SMRU Limited Scottish Oceans Institute New...
29
SMRU Limited Scottish Oceans Institute New Technology Centre North Haugh ST ANDREWS Fife KY16 9SR www.smru.co.uk http://soi.st-andrews.ac.uk/ VAT reg. No. GB 607 6064 48 SMRU LIMITED is a limited company registered in Scotland, Registered Number: 296937. Registered Office: 5 Atholl Crescent, Edinburgh EH3 8EJ FTOWDG SAFESIMM Noise Impact Assessment – Seals and Bottlenose dolphins (Neart na Gaoithe). Authors: Carol Sparling, Catriona Harris, Carl Donovan and Lorenzo Milazzo Date: 9 th March 2012 Report code: SMRU-MRP-2012-004 This report is to be cited as: Sparling, Harris, Donovan, and Milazzo , FTOWDG SAFESIMM Noise Impact Assessment – Seals and Bottlenose dolphins (Neart na Gaoithe). Report number SMRU-L- MRP-2012-004 to Mainstream, March, 2012 (unpublished). Lead Scientist: Carol Sparling Project Manager: Carol Sparling Scientific QA: John Harwood/Gordon Hastie For its part, the Buyer acknowledges that Reports supplied by the Seller as part of the Services may be misleading if not read in their entirety, and can misrepresent the position if presented in selectively edited form. Accordingly, the Buyer undertakes that it will make use of Reports only in unedited form, and will use reasonable endeavours to procure that its client under the Main Contract does likewise. As a minimum, a full copy of our Report must be appended to the broader Report to the client.
Transcript of SMRU Limited Scottish Oceans Institute New...

SMRU Limited Scottish Oceans Institute New Technology Centre North Haugh ST ANDREWS Fife KY16 9SR www.smru.co.uk http://soi.st-andrews.ac.uk/
VAT reg. No. GB 607 6064 48
SMRU LIMITED is a limited company registered in Scotland, Registered Number: 296937. Registered Office: 5 Atholl Crescent, Edinburgh EH3 8EJ
FTOWDG SAFESIMM Noise Impact Assessment – Seals and Bottlenose
dolphins (Neart na Gaoithe).
Authors: Carol Sparling, Catriona Harris, Carl Donovan and Lorenzo Milazzo
Date: 9th March 2012
Report code: SMRU-MRP-2012-004
This report is to be cited as: Sparling, Harris, Donovan, and Milazzo , FTOWDG SAFESIMM Noise
Impact Assessment – Seals and Bottlenose dolphins (Neart na Gaoithe). Report number SMRU-L-
MRP-2012-004 to Mainstream, March, 2012 (unpublished).
Lead Scientist: Carol Sparling
Project Manager: Carol Sparling
Scientific QA: John Harwood/Gordon Hastie
For its part, the Buyer acknowledges that Reports supplied by the Seller as part of the Services may be misleading if not read in their entirety, and can misrepresent the position if presented in selectively edited form. Accordingly, the Buyer undertakes that it will make use of Reports only in unedited form, and will use reasonable endeavours to procure that its client under the Main Contract does likewise. As a minimum, a full copy of our Report must be appended to the broader Report to the client.

Report No _SMRUL-MRP-2012-004 to _Mainstream_ Issue Date: 9th March 2012
1 | P a g e
Table of contents
1 Methodology ................................................................................................................................... 3
1.1 Physical Effects: ....................................................................................................................... 3
1.2 Behavioural Effects: ................................................................................................................ 7
1.3 Parameters modelled .............................................................................................................. 8
2 Results and discussion .................................................................................................................... 9
2.1 Neart na Gaoithe site only: ..................................................................................................... 9
2.1.1 Scenario 1 – Single piling event at one location ............................................................. 9
2.1.2 Scenario 1 vs 1a: drive-drill-drive vs drive only ............................................................ 10
2.1.3 Piling simultaneously at two locations at NNG (Scenario 2) ......................................... 11
2.1.4 Cumulative Scenario - Single piling event at Neart na Gaoithe, concurrent piling at one
location at Inch Cape and one location at Firth of Forth (Scenario 3). ......................................... 13
3 Summary and conclusions ............................................................................................................ 15
4 References .................................................................................................................................... 16
I. Appendix One ................................................................................................................................ 17
II. Appendix Two ................................................................................................................................. 0
List of figures
Figure 1 Dose-response curves used within SAFESIMM to relate the probability of Temporary
Threshold Shift (black curves) and Permanent Threshold Shift (red curves) to M-weighted Sound
Exposure Level (SEL) for cetaceans and pinnipeds exposed to pulsed and non-pulsed sounds. ........... 5
Figure 2. Grey seal density surface used in the simulations (from Sparling et al. 2011) ....................... 6
Figure 3. Harbour seal density surface used in the simulations (from Sparling et al. 2011) .................. 6
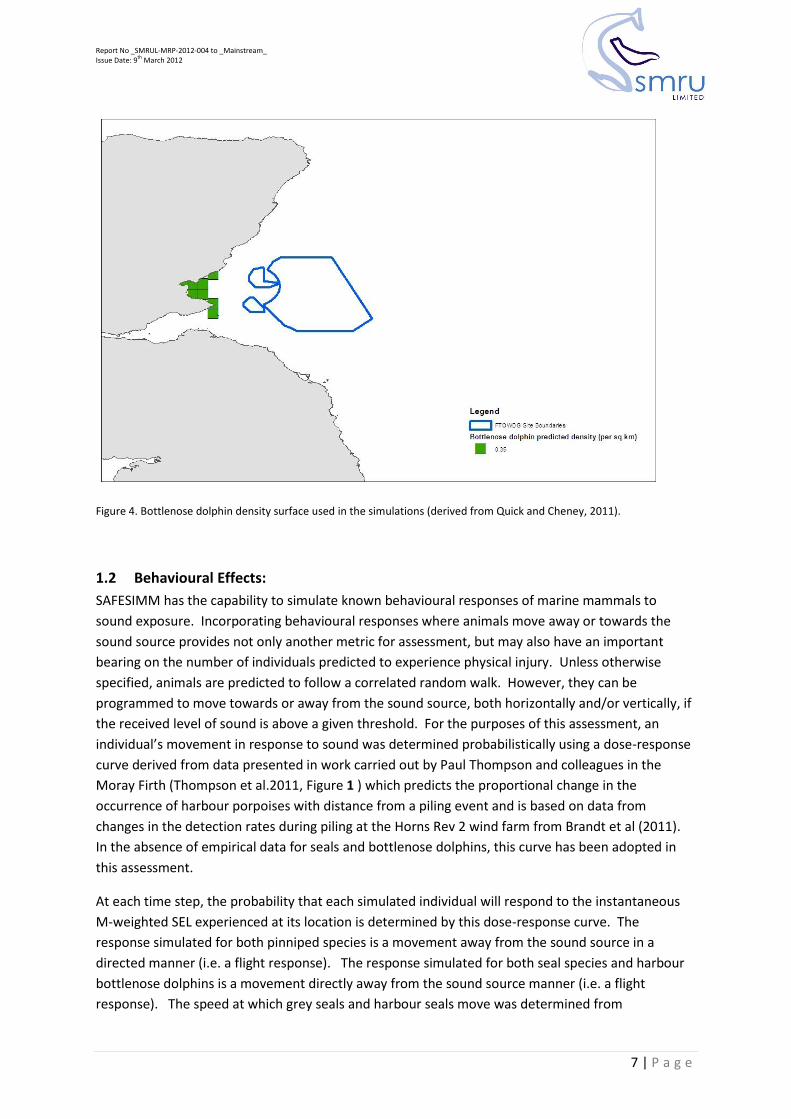
Figure 4. Bottlenose dolphin density surface used in the simulations (derived from Quick and
Cheney, 2011). ........................................................................................................................................ 7
Figure 5. Dose-response curves used within SAFESIMM to relate the probability of behavioural
displacement to M-weighted Sound Exposure Level (SEL) for cetaceans and pinnipeds exposed to
pile driving noise. .................................................................................................................................... 8
Figure 6. The number of animals predicted to experience PTS per 0.083 deg grid cell within the area
of calculation (boundary of green area) for Scenario 1, single location (left hand panels) and Scenario
Report No _SMRUL-MRP-2012-004 to _Mainstream_ Issue Date: 9th March 2012
2 | P a g e
2, piling at two locations simultaneously (right hand panels), for both harbour seals (top panels) and
grey seals (middle panels) and bottlenose dolphins (bottom panels). Note that the scale differs
between species. .................................................................................................................................. 12
Figure 7. The number of animals predicted to experience PTS per 0.083 deg grid cell within the area
of calculation (boundary of green area) for Scenario 3, piling at NNG, IC and FoF simultaneously, for
harbour seals (top panels) and grey seals (middle panels) and bottlenose dolphins (bottom panels).
Note that the scale differs between species. ....................................................................................... 16
Figure 9: Broad overview of the modular nature of SAFESIMM ........................................................... 23
Figure 10: Density maps for sperm whales around the Hawaiian Islands, based on the RES models of
Kaschner et. al. (2006) and calibrated against survey data. ................................................................. 24
Figure 11. Locations used in the SAFESIMM simulations. ...................................................................... 1
List of tables
Table 1. Summary of scenarios assessed ................................................................................................ 9
Table 2. The number of grey seals, harbour seals and bottlenose dolphins predicted to experience
physical (PTS and TTS) and behavioural effects as a result of two consecutive piling events with 19.5
hours of drilling between them at a single location at Neart na Gaoithe (Scenario 1). The abundance
of animals predicted to be at-sea within the area of calculation (see map) is 9196 grey seals and 335
harbour seals......................................................................................................................................... 10
Table 3. Number of grey seals, harbour seals and bottlenose dolphins predicted to experience
physical (PTS and TTS) and behavioural effects as a result of two consecutive piling events with no
drilling at a single location at Neart na Gaoithe. The abundance of animals predicted to be at-sea
within the area of calculation (see map) is 9196 grey seals and 335 harbour seals. ........................... 11
Table 4. Number of grey seals, harbour seals and bottlenose dolphins predicted to experience
physical (PTS and TTS) and behavioural effects as a result of two simultaneous pile-drill-drive events
at two locations at Neart na Gaoithe (Scenario 2). The abundance of animals predicted to be at-sea
within the area of calculation (see map) is 9196 grey seals and 335 harbour seals. ........................... 12
Table 5. Number of grey seals, harbour seals and bottlenose dolphins predicted to experience
physical (PTS and TTS) and behavioural effects as a result of two simultaneous pile-drill-drive events
at two locations at Neart na Gaoithe (Scenario 2). The abundance of animals predicted to be at-sea
within the area of calculation (see map) is 11263 grey seals and 403 harbour seals. ......................... 14
Table 6. Summary of predicted impacts on all species, expressed as a percentage of the at-sea
abundance in the maximum area of calculation (AOCmax). Unless otherwise specified, the NNG
paramaters were drive-drill-drive ......................................................................................................... 14
Table 7 Engineering parameters modelled for each site. ....................................................................... 0

Report No _SMRUL-MRP-2012-004 to _Mainstream_ Issue Date: 9th March 2012
3 | P a g e
Introduction
Pile driving during the construction of offshore wind turbines has the potential to produce levels of
noise in the marine environment which may have a detrimental effect on marine animals. SMRU Ltd
were contracted by the Forth and Tay Offshore Developers Group to assess the potential impacts of
pile driving at multiple development sites on local marine mammal populations during the
construction of wind farms in the region.
A detailed description of the potential effects of pile driving noise on marine mammals is out with
the scope of this report; however we are concerned with two main types of impact. The first is
auditory injury leading to a reduction in the hearing abilities of animals (permanent and temporary
threshold shift) and the second is the elicitation of behavioural responses to sound which result in
animals being displaced away from areas around the piling activities.
The assessment approach combines three key pieces of quantitative information to estimate the
number of animals likely to be affected by each type of impact: 1) the predicted spatial pattern and
extent of underwater noise produced by piling activities, 2) the spatial pattern of abundance of
marine mammals across the area of potential impact, and 3) the way in which animals are predicted
to move in response to sound.
This report presents the results of these modelling exercises for both species of seal (harbour seal
and grey seal) and for bottlenose dolphins for 1) pile driving at the Neart Na Gaoithe site alone and
2) pile driving at the Neart Na Gaoithe site concurrent with pile driving at the Inch Cape site and Firth
of Forth Round 3 sites.
1 Methodology The SAFESIMM (Statistical Algorithms For Estimating the Sonar Influence on Marine Megafauna)
algorithm is a software tool for estimating the potential effects of anthropogenic noise on marine
fauna. SAFESIMM can also be used to compare the effectiveness of different strategies for mitigating
the effects of anthropogenic sound by determining the risk associated with these strategies under a
range of scenarios. For example, a proposed sound producing activity can be analysed with
SAFESIMM to determine the likely effects of changes in operational parameters (such as the activity
location and time of year, or the source level, frequency and duty cycle of the sound production) on
the risk to marine mammals (please see Appendix One for full details of the algorithm).
1.1 Physical Effects:
The main physical effect on marine mammals that is likely to occur as a result of turbine construction
is Permanent Threshold Shift (PTS). This involves a permanent impairment in hearing sensitivity at a
particular frequency caused by exposure to excessive sound levels. There have been no direct
experiments on marine mammals to determine what sound levels may cause PTS. Rather, these
levels have been estimated by determining what sound levels are required to cause a temporary
threshold shift (TTS) and then estimating what additional sound exposure would be required to
cause PTS by inference from the results of experiments with small mammals. Southall et al. (2007)

Report No _SMRUL-MRP-2012-004 to _Mainstream_ Issue Date: 9th March 2012
4 | P a g e
used this approach to derive interim recommendations of the sound levels that could cause PTS in
different groups of marine mammals. They also developed a series of weighting functions (M-
weightings) that could be used to take account of the hearing sensitivities of four different marine
mammal groups (low frequency cetaceans, mid-frequency cetaceans, high frequency cetaceans and
pinnipeds). The authors recommend the following values for the onset of PTS based on M-weighted
Sound Exposure Levels (SELs) for both pulsed (such as those produced during pile driving) and non-
pulsed sounds (such as vessel noise or that produced during cable laying):
Cetaceans = Pulsed (198dB), Non-pulsed (215dB) Pinnipeds = Pulsed (186dB), Non-pulsed (203dB) They also recommended a similar set of values for the onset of TTS: Cetaceans = Pulsed (183dB), Non-pulsed (195dB) Pinnipeds = Pulsed (171dB), Non-pulsed (183dB) However, exposure to SELs at or above these levels does not mean that an animal is certain to
experience TTS or PTS, because the onset of threshold shift is a probabilistic phenomenon. The data
from Finneran et al. (2005) that were used by Southall et al. (2007) to develop the TTS values for
mid-frequency cetaceans indicate that ~18-19% of exposures to an SEL of 195 dB re 1 µPa2.s-1
resulted in measurable TTS. SAFESIMM therefore uses a series of dose-response relationships
derived from Finneran et al.’s work to determine the likely effect of sound exposure on the different
marine mammal groups. These dose-response relationships are shown in Figure 1 Dose-response
curves used within SAFESIMM to relate the probability of Temporary Threshold Shift (black
curves) and Permanent Threshold Shift (red curves) to M-weighted Sound Exposure Level
(SEL) for cetaceans and pinnipeds exposed to pulsed and non-pulsed sounds. In these
relationships, the probability that an animal which is exposed to an SEL equivalent to the threshold
values recommended by Southall et al. (2007) will experience PTS or TTS is set at 0.18, and that
probability increases as the SEL increases.

Report No _SMRUL-MRP-2012-004 to _Mainstream_ Issue Date: 9th March 2012
5 | P a g e
Figure 1 Dose-response curves used within SAFESIMM to relate the probability of Temporary Threshold Shift (black curves) and Permanent Threshold Shift (red curves) to M-weighted Sound Exposure Level (SEL) for cetaceans and pinnipeds exposed to pulsed and non-pulsed sounds.
SAFESIMM provides estimates of the number of animals of each species of marine mammal that
may experience PTS and TTS from a particular sound field by simulating the three dimensional
movements of thousands of simulated animals through this field, based on known characteristics of
the diving and swimming behaviour of each species, and recording the cumulative SEL of each
simulated individual. The species-specific PTS and TTS dose-response curves are then used to
convert each individual’s SEL into a probability that it will experience PTS or TTS. The initial locations
of these simulated animals are chosen at random, although the density of simulated animals in any
grid cell is proportional to the expected density provided by the animal density data. The actual
number of animals predicted to experience PTS and TTS at individual locations is then calculated by
scaling these simulated values using estimates of the expected densities of all marine mammal
species at each location.
The density data for grey seals and harbour seals used in the simulations were provided by the Sea
Mammal Research Unit at a resolution of 5km2 (SMRU Ltd 2011: FTWODG seal baseline
report)(Figure 2 and Figure 3). This grid was converted into a 0.083 degree grid for incorporation
into SAFESIMM. The density estimate for bottlenose dolphins was derived from Quick and Cheney
(2011) and was applied over all 0.08 grid cells which overlapped with the areas surveyed. This
resulted in a uniform density estimate of 0.35 dolphins/km2 Figure 4).

Report No _SMRUL-MRP-2012-004 to _Mainstream_ Issue Date: 9th March 2012
6 | P a g e
Figure 2. Grey seal density surface used in the simulations (from Sparling et al. 2011)
Figure 3. Harbour seal density surface used in the simulations (from Sparling et al. 2011)
Report No _SMRUL-MRP-2012-004 to _Mainstream_ Issue Date: 9th March 2012
7 | P a g e
Figure 4. Bottlenose dolphin density surface used in the simulations (derived from Quick and Cheney, 2011).
1.2 Behavioural Effects:
SAFESIMM has the capability to simulate known behavioural responses of marine mammals to
sound exposure. Incorporating behavioural responses where animals move away or towards the
sound source provides not only another metric for assessment, but may also have an important
bearing on the number of individuals predicted to experience physical injury. Unless otherwise
specified, animals are predicted to follow a correlated random walk. However, they can be
programmed to move towards or away from the sound source, both horizontally and/or vertically, if
the received level of sound is above a given threshold. For the purposes of this assessment, an
individual’s movement in response to sound was determined probabilistically using a dose-response
curve derived from data presented in work carried out by Paul Thompson and colleagues in the
Moray Firth (Thompson et al.2011, Figure 1 ) which predicts the proportional change in the
occurrence of harbour porpoises with distance from a piling event and is based on data from
changes in the detection rates during piling at the Horns Rev 2 wind farm from Brandt et al (2011).
In the absence of empirical data for seals and bottlenose dolphins, this curve has been adopted in
this assessment.
At each time step, the probability that each simulated individual will respond to the instantaneous
M-weighted SEL experienced at its location is determined by this dose-response curve. The
response simulated for both pinniped species is a movement away from the sound source in a
directed manner (i.e. a flight response). The response simulated for both seal species and harbour
bottlenose dolphins is a movement directly away from the sound source manner (i.e. a flight
response). The speed at which grey seals and harbour seals move was determined from

Report No _SMRUL-MRP-2012-004 to _Mainstream_ Issue Date: 9th March 2012
8 | P a g e
unpublished telemetry data collected in the FTOWDG region by SMRU. This gave a minimum speed
of 0.01m.s-1 for both species and maximum speeds of 2.6m.s-1 for grey seals and 2.3m.s-1 for harbour
seals. The minimum and maximum values of 0.01m.s-1 and 5.6m.s-1 for bottlenose dolphins were
obtained from an extensive literature search.
The total numbers of individuals that respond in this way over the course of the scenario is
documented by SAFESIMM and provided as an output. This metric doesn't tell us anything about
how many times each individual responds throughout the simulation, or how far they move away, or
how long they stay away for - this metric simply counts the number of animals that at least once
throughout the simulation received a sound dose high enough to swim away from the sound. Any
predicted behavioural responses need to be carefully interpreted in light of the likely spatial and
temporal variation in abundance and likely motivation for being in a given area.
Figure 5. Dose-response curves used within SAFESIMM to relate the probability of behavioural displacement to M-
weighted Sound Exposure Level (SEL) for cetaceans and pinnipeds exposed to pile driving noise.
1.3 Parameters modelled
Subacoustech provided SMRU Ltd with the outputs of sound propagation models for each pile
driving scenario in the format of a calculated SEL for a single hammer blow (of 0.5 sec duration) for
each blow energy used during the piling event on 96 transects radiating from the source location
(3.75o apart). The predicted SEL was provided at steps of 100m along each transect. SAFESIMM then

Report No _SMRUL-MRP-2012-004 to _Mainstream_ Issue Date: 9th March 2012
9 | P a g e
carried out a simulation of animal exposure over the whole piling duration using parameters for
duration and strike rate provided by individual developers (Appendix Two). Where ramp ups were
included in the engineering scenarios, Subacoustech provided a separate sound field for each
different blow force – SAFESIMM cycled through these in accordance with the duration of each step
in the ramp up. The details of the engineering scenarios and piling locations can be found in
Appendix Two and summarised in Table 1. There are uncertainties regarding the behaviour of
animals during breaks in piling, therefore in order to explore the impact of including a long drilling
period between two periods of piling, we ran two versions of Scenario 1, one with the drilling
included (Scenario 1) and one where the simulation consisted of both driving periods running
consecutively with no break (Scenario 1a). The predicted sound from the drilling operation was
calculated from the following equations provided by Subacoustech. Their SPEAR model estimates
the approximate levels of drilling noise at different ranges using simple SL – N log r equations that
have been derived from measured data.
These levels were calculated for typical drilling operations at any range using the following equations
(where r is the range):
Mid Frequency Cetaceans (Bottlenose dolphin) 167.8 – 15 log10 r
High Frequency Cetaceans (harbour porpoise) 165.8 – 15 log10 r
Pinnipeds (in water) 167.8 – 15 log10 r
Table 1. Summary of scenarios assessed
Scenario Site(s) and Location Description
Scenario 1 NNG Loc 5 Drive-drill-drive Scenario 1a NNG Loc 5 Drive only Scenario 2 NNG Loc 5 & 6 Drive-drill-drive Scenario 3 NNG Loc 5
IC Loc 4 FoF Loc 1
Drive-drill-drive Drive only Drive only
2 Results and discussion
2.1 Neart na Gaoithe site only:
2.1.1 Scenario 1 – Single piling event at one location
Under Scenario 1 the absolute number of grey seals predicted to experience injury (PTS) and
behavioural disturbance was greater than the number of harbour seals predicted to experience the
same level of injury and disturbance (Table 2Error! Reference source not found.). This was a
consequence of the much larger numbers of grey seals predicted to be present in the area. This is
the case for all scenarios.

Report No _SMRUL-MRP-2012-004 to _Mainstream_ Issue Date: 9th March 2012
10 | P a g e
If we consider the numbers as a proportion of the at-sea population in the area of calculation (AOC)
then the proportion of the harbour seal population that was affected was much larger than that of
the grey seal (e.g. proportion of grey seal AOC population experiencing PTS under scenario 1 =
0.0054, proportion of harbour seal AOC population experiencing PTS under scenario 1 = 0.012).
Similarly, the proportion of harbour seals responding behaviourally throughout the simulation was
higher than grey seals, although the absolute numbers of animals affected were lower. This applies
to all metrics and across all scenarios. No bottlenose dolphins were predicted to experience PTS;
however, 6 individuals predicted to experience TTS. A total of 124 bottlenose dolphins were
predicted to exhibit behavioural responses by moving away from the noise at least once during the
simulated exposure.
Spatially, the highest numbers of affected seals (PTS) were in areas close to the coast, at the mouth
of the Tay and Eden Estuary (Figure 6). This is likely to be a result of a combination of factors;
particularly high usage in these areas (Figure 2 and Figure 3) and fleeing animals being constrained
by the coast. Seals do have the option of hauling out here and thus preventing any further exposure
to underwater noise (although this is mainly restricted to periods of low tide when the sandbanks
are visible), however haul out cannot currently be incorporated into the simulations so these
predictions may be slightly precautionary as a result.
Table 2. The number of grey seals, harbour seals and bottlenose dolphins predicted to experience physical (PTS and TTS)
and behavioural effects as a result of two consecutive piling events with 19.5 hours of drilling between them at a single
location at Neart na Gaoithe (Scenario 1). The abundance of animals predicted to be at-sea within the area of calculation
(see Figure 6) is 9,196 grey seals and 335 harbour seals
Species TTS PTS Behaviour
Grey seal 635 50 5,483 Harbour seal 57 4 314 Bottlenose dolphin 6 0 124
2.1.2 Scenario 1 vs 1a: drive-drill-drive vs drive only
Simulation of the drive–only scenario resulted in much fewer animals experiencing TTS and PTS
compared to the drive-drill-drive scenario (Table 3). Approximately half the number of seals
experienced TTS and PTS compared to the drive-drill-drive scenario and the number of seals
responding behaviourally was between 10 and 20% lower. The reduction in numbers of seals
responding behaviourally was smaller and was less than 10% lower under Scenario 1a than under
Scenario 1. Only 1 bottlenose dolphin was predicted to experience TTS under the drive only scenario,
compared to 6 under the drive-drill-drive scenario. 116 dolphins were predicted to respond under
the drive only scenario compared to 124 under the drive-drill-drive scenario.
The difference in predicted impact between the two scenarios is most likely a result of animals no
longer responding behaviourally once the drilling has commenced after the first driving period.
Drilling is much quieter than piling, and noise levels drop below those predicted to elicit behavioural
responses. Therefore during the extensive drilling period, simulated animals receive a sound dose
below the threshold for a behavioural response and so start to come back into the area in order to
be re-exposed to the 2nd piling period. We have to assume no recovery in sound exposure in the
interim between driving periods; therefore individuals are predicted to receive a much higher dose

Report No _SMRUL-MRP-2012-004 to _Mainstream_ Issue Date: 9th March 2012
11 | P a g e
of sound overall and are therefore more likely to develop PTS. We have very little information with
which to assess how realistic this is. There are few studies which describe how quickly animals return
to an area that they have been displaced from as a result of noise, although there is some evidence
from sonar behavioural studies on beaked whales to suggest animals move into an area relatively
quickly once sonar operations stop. Brandt et al (2011) found that porpoise activity was absent for
the first hour after pile driving, thereafter increasing, although activity remained lower than normal
for 24-72 hours after pile driving. It is likely that a proportion of animals return but overall density
may remain lower than the starting density. Therefore it is inappropriate to assume that all animals
keep fleeing during the drilling period, but it is similarly inappropriate to assume that all animals will
start moving back in immediately after pile driving, during the drilling.
Furthermore, there is little data to assess how breaks in sound exposure over this timescale affect
the relationship between cumulative sound dose and onset of injury – therefore this assessment is
likely to be somewhat precautionary and true impact may be intermediate between the two sets of
predictions. We have not carried out this comparison for the other scenarios as this was outside the
original scope for this work. However it is reasonable to assume that the magnitude of the
difference may be similar between drive-drill-drive and drive only scenarios when these operations
are being carried out at more than one location sites.
Table 3. Number of grey seals, harbour seals and bottlenose dolphins predicted to experience physical (PTS and TTS) and
behavioural effects as a result of two consecutive piling events with no drilling at a single location at Neart na Gaoithe. The
abundance of animals predicted to be at-sea within the area of calculation (see map) is 9,196 grey seals and 335 harbour
seals.
Species TTS PTS Behaviour
Grey seal 347 22 4,404 Harbour seal 26 2 283 Bottlenose dolphin 1 0 126
2.1.3 Piling simultaneously at two locations at NNG (Scenario 2)
For both species of seal, the number of animals predicted to experience PTS under Scenario 2 was
approximately 10-20% greater than the numbers predicted under Scenario 1 (Table 4). The
difference between the two scenarios in terms of the numbers of animals predicted to experience
behavioural disturbance was substantially less, with a high proportion of animals being disturbed
even under the single location scenario. For harbour seals the percentage of the AOC population
predicted to be behaviourally disturbed was 94% under both scenarios. Proportionally there was
less disturbance of the grey seal AOC population, with 60% being disturbed under the single location
scenario, and 65% under the 2 location scenario. For both grey seals and harbour seals the spatial
extent where animals were predicted to experience PTS was greater under the 2 concurrent piling
events at NNG than the single piling event at NNG, with higher absolute numbers in each grid cell
under the 2 piling event scenario (Figure 6). For bottlenose dolphins, the results were identical
regardless of whether piling was occurring at one location or at two locations simultaneously. This is
likely to be because although higher numbers occurred in each grid cell under the two-piling event
scenario, the numbers were still generally below 1 in each cell (Figure 6).
Report No _SMRUL-MRP-2012-004 to _Mainstream_ Issue Date: 9th March 2012
12 | P a g e
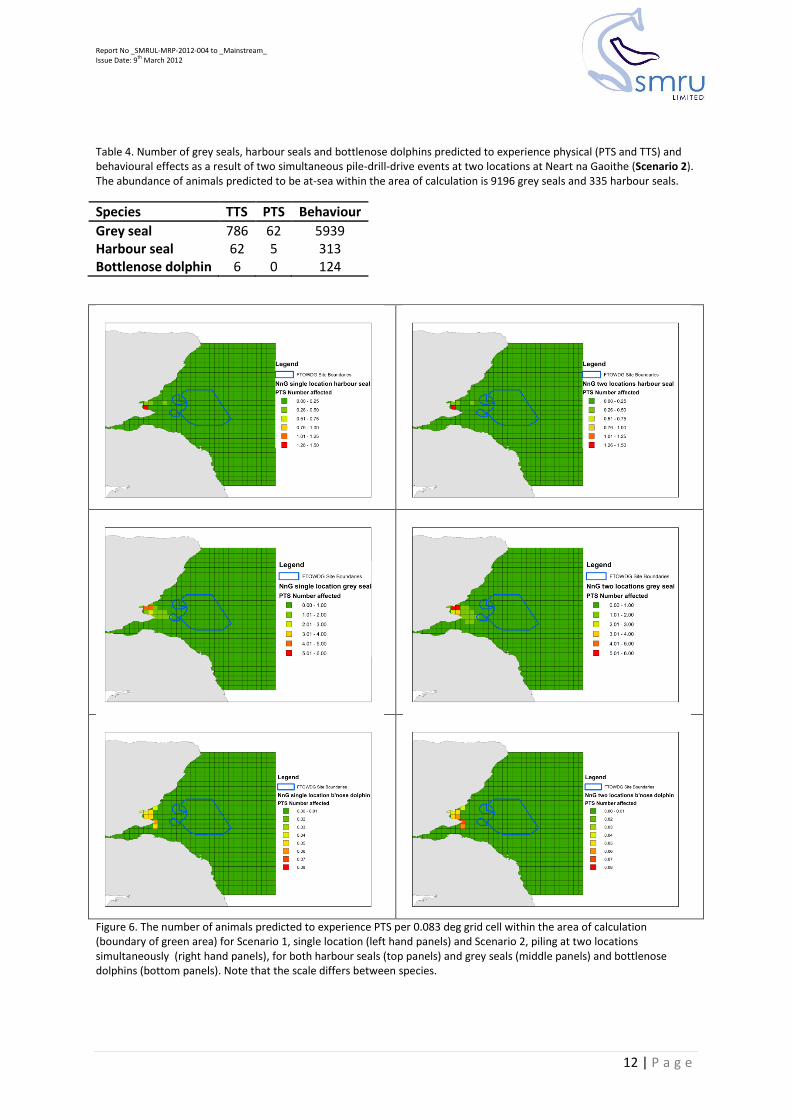
Table 4. Number of grey seals, harbour seals and bottlenose dolphins predicted to experience physical (PTS and TTS) and behavioural effects as a result of two simultaneous pile-drill-drive events at two locations at Neart na Gaoithe (Scenario 2). The abundance of animals predicted to be at-sea within the area of calculation is 9196 grey seals and 335 harbour seals.
Species TTS PTS Behaviour
Grey seal 786 62 5939 Harbour seal 62 5 313 Bottlenose dolphin 6 0 124
Figure 6. The number of animals predicted to experience PTS per 0.083 deg grid cell within the area of calculation (boundary of green area) for Scenario 1, single location (left hand panels) and Scenario 2, piling at two locations simultaneously (right hand panels), for both harbour seals (top panels) and grey seals (middle panels) and bottlenose dolphins (bottom panels). Note that the scale differs between species.

Report No _SMRUL-MRP-2012-004 to _Mainstream_ Issue Date: 9th March 2012
13 | P a g e
The differences in behavioural responses between the various scenarios was much less pronounced
than those for injury metrics, this is because behaviour (the probability of response) is much more
closely linked to the absolute loudness than the cumulative nature of exposure over time, and
absolute loudness was more similar between the different scenarios. Therefore an increase in the
number of piling events will increase cumulative noise dose (and therefore the probability of injury)
more than it will increase the number of animals responding behaviourally. Furthermore the spatial
range of bottlenose dolphins in the simulations is small relative to the area affected by noise and an
increase in the number of piling events does not appreciably increase the degree of overlap. The
predicted noise levels in the coastal zone are above behavioural thresholds over much of the
predicted range of bottlenose dolphin occurrence regardless of the scenario so the number of
animals responding at least once does not differ much between scenarios. However it must be noted
that the number of animals responding at least once does not reflect the exact nature of the
behavioural response, and cannot be used to say anything about how far animals may be displaced,
how long for, or what the consequences of this response may be for the population in the long term.
The metric is presented here to provide a basic assessment of the scale of the response and how it
might differ under different scenarios. Assessment of the long term population response nature will
require much more detailed information on the spatial and temporal variability in behavioural
response and a number of assumptions regarding how individual impacts may manifest on
population dynamics. Such an assessment is outwith the scope of this current work although
progress is currently being made on these issues on a number of current projects.
Overall the difference between a single piling event and two simultaneous piling events at the same
site are relatively small compared to the differences between scenario 1 and 1a. This is because the
spatial overlap between scenario 1 and 2 is high and very little ‘additional’ exposure results and
temporally they are identical.
2.2 Cumulative Scenario - Single piling event at Neart na Gaoithe, concurrent piling at one location at Inch Cape and one location at Firth of Forth (Scenario 3).
Unsurprisingly, for both species of seal the extent of the spatial footprint of the cumulative scenario
was greater than all individual site scenarios (Error! Reference source not found.). This was not the
ase for bottlenose dolphins, because the entire range of the bottlenose dolphin was affected in all
scenarios. It is probable that bottlenose dolphins are found outside of this mapped range but we
currently have no data with which to quantify this, thus the simulations are restricted to this density
estimate over this spatial scale.
For both species of seal, the numbers predicted to experience PTS under the cumulative scenario
(Scenario 3) are approximately 50-60% greater than the numbers predicted under the NNG only
scenario (Scenario 1) (Table 5). As was the case with the comparison between Scenario 1 and
Scenario 2, the difference between the two scenarios in terms of the numbers of animals predicted
to experience behavioural disturbance is substantially less than the difference in injury metrics, with
a high proportion of animals responding under all scenarios. The reasons for this are similar to the
reasons explained above, that the behavioural response is more closely linked to the absolute
loudness of the noise rather than the temporal component, although numbers are larger due to the
increase in the spatial overlap. In fact because the cumulative simulations cover a larger area, the
abundance of seals within the area of calculation is higher, resulting in a lower proportion of the

Report No _SMRUL-MRP-2012-004 to _Mainstream_ Issue Date: 9th March 2012
14 | P a g e
population responding. This is a result of how the simulations are set up with the spatial limits of
each simulation set by the spatial area of the sound field supplied by Subacoustech. While these are
appropriate for calculating the numbers of animals affected by each piling event (because impacts
are not expected out with the spatial extent of the sound field used) the abundance in the area of
calculation for each single simulation may not be the most appropriate reference value for
comparing impacts proportionally. It may be more appropriate to use the largest AOC i.e. that of the
cumulative scenario – this will give a more realistic indication of the number of animals ‘available’ to
be impacted during each event (Table 6. Summary of predicted impacts on all species, expressed as
a percentage of the at-sea abundance in the maximum area of calculation from the cumulative
assessment (AOCmax).).
Table 5. Number of grey seals, harbour seals and bottlenose dolphins predicted to experience physical (PTS and TTS) and behavioural effects as a result of two simultaneous pile-drill-drive events at two locations at Neart na Gaoithe (Scenario 2). The abundance of animals predicted to be at-sea within the area of calculation (see map) is 11,263 grey seals and 403 harbour seals.
Species TTS PTS Behaviour
Grey seal 993 83 6,163 Harbour seal 96 9 305 Bottlenose dolphin 6 0 124
Table 6. Summary of predicted impacts on all species, expressed as a percentage of the at-sea abundance in the maximum area of calculation from the cumulative assessment (AOCmax). Unless otherwise specified, the NNG paramaters were drive-drill-drive
ScenarioNo.
site/parameters sp TTS %AOCmax PTS %AOCmax behav %AOCmax
1 NNG loc5 grey 635 6% 50 0% 5483 49%
1 NNG loc5 harbour 57 14% 4 1% 314 78%
1a NNG loc5 drive only grey 347 3% 22 0% 4404 39%
1a NNG loc5 drive only harbour 26 7% 2 0% 283 70%
2 NNG loc5&loc6 grey 786 7% 62 1% 5939 53%
2 NNG loc5&loc6 harbour 62 15% 5 1% 313 78%
3 NNG loc5, IC&FoF grey 993 9% 83 1% 6163 55%
3 NNG loc5, IC&FoF harbour 96 24% 9 2% 305 76%
1 NNG loc5 BND 6 5% 0 0% 124 98% 1a NNG loc5 drive only BND 1 1% 0 0% 116 92% 2 NNG loc5&loc6 BND 6 5% 0 0% 124 98% 3 NNG loc5, IC&FoF BND 6 5% 0 0% 124 98%

Report No _SMRUL-MRP-2012-004 to _Mainstream_ Issue Date: 9th March 2012
15 | P a g e
3 Summary and conclusions
Low numbers of marine mammals were predicted to develop PTS, as a result of the scenarios
simulated. No bottlenose dolphins were predicted to develop PTS under any of the simulations.
Relatively high numbers of animals were predicted to exhibit behavioural responses and it is likely
that this may be a key concern and a focus for the design of appropriate mitigation.
Inclusion of a period of drilling in between two pile driving periods results in higher predicted
impacts because animals are predicted to move back in between the two driving periods, thereby
increasing overall exposure.
Increasing the number of locations of simultaneous piling events results in higher predicted impacts,
although the spatial scale at which concurrent operations occur is important; there was a relatively
small increase in impact with two locations at the one site (scenario 1 compared to 2). Although we
do not have a scenario with two piling events at different sites for comparison, this suggests that the
temporal nature of the piling may be more important than the number of individual events as long
as the degree of spatial overlap can be minimised. This has implications for the consideration of
cumulative impact and simultaneous piling within and between different sites, simulations should be
carried out to explore the optimal balance of temporal and spatial overlap in piling to minimise
overall impact.
In absolute terms, more grey seals were predicted to be affected than harbour seals. This is as a
result of an overall higher abundance of grey seals in the region and when expressed as a proportion
of total abundance, the impacts on harbour seals were much higher.
Injury metrics were more sensitive than behavioural responses to changes in scenario parameters
such as the number of locations, different engineering parameters. Although both scale in the
directions one would expect although there is a degree of variability due to stochasticity in animal
responses and the probabilistic nature of the responses.
These predictions rely on a number of assumptions about the response of animals to noise, some of
which have limited empirical basis, particularly for the species being assessed here. A full
examination of the sensitivity of the results of these simulations to variations in the assumptions
adopted is beyond the scope of this work but the biggest uncertainties probably relate to the nature
and extent of species-specific behavioural responses to piling noise and the onset of auditory injury
in marine mammals in relation to the specific temporal nature of exposure to piling.
Nevertheless these results represent the application of the best available information on these
factors, along with the best available estimates of spatial variation in animal distribution in the
region to produce the most robust estimates possible of the impact of pile driving in the FTOWDG
region.

Report No _SMRUL-MRP-2012-004 to _Mainstream_ Issue Date: 9th March 2012
16 | P a g e
Figure 7. The number of animals predicted to experience PTS per 0.083 deg grid cell within the area of calculation (boundary of green area) for Scenario 3, piling at NNG, IC and FoF simultaneously, for harbour seals (top panels) and grey seals (middle panels) and bottlenose dolphins (bottom panels). Note that the scale differs between species.
4 References Brandt, M.J., A. Diederichs, K. Betke, and G. Nehls. 2011. Responses of harbour porpoises to pile driving at the Horns Rev II offshore wind farm in the Danish North Sea. Marine Ecology Progress Series 421:205-216.

Report No _SMRUL-MRP-2012-004 to _Mainstream_ Issue Date: 9th March 2012
17 | P a g e
Finneran, J.J., Carder, D.A., Schlundt, C.E. & Ridgeway, S.H. (2005). Temporary threshold shift in
bottlenose dolphin (Tursiops truncatus) exposed to mid-frequency tones. Journal of the Acoustical
Society of America. 118: 2696-2705.
Thompson, P.M., Hastie, G.D., Nedwell, J., Barham, R., Brooker, A. Brookes, K., Cordes, L., Bailey, H. and McLean, N. (2011). Proposed framework for assessing the impacts of offshore windfarms on protected harbour seal populations. A report commissioned by the Moray Firth Offshore Windfarm Developers.
Southall, B., Bowles, A., Ellison, W., Finneran, J., Gentry, R., Greene, C.J., Kastak, D., Ketten, D.,
Miller, J., Nachtigall, P., Richardson, W., Thomas, J., & Tyack, P. (2007a) Marine Mammal Noise
Exposure Criteria: Initial Scientific Recommendations. Aquatic Mammals 33: 411-521.
I. Appendix One
Donovan et al. Quantifying the effects of anthropogenic sound on marine mammals. Draft: Please do not cite or quote without prior reference to the authors
A simulation-based method for quantifying and mitigating the effects of anthropogenic sound on
marine mammals
Donovan, C. R., Harris, C.M., & Harwood, J.
Centre for Research into Ecological and Environmental Modelling
and Sea Mammal Research Unit, University of St Andrews.
Abstract
The SAFESIMM (Statistical Algorithms For Estimating the Sonar Influence on Marine Megafauna)
algorithm is a software tool for estimating the potential effects of anthropogenic noise on marine
animals. SAFESIMM can also be used to compare the effectiveness of different strategies for
mitigating the effects of anthropogenic sound by determining the risk associated with these
strategies under a range of scenarios. For example, a proposed sound producing activity can be
analysed with SAFESIMM to determine the likely effects of changes in operational parameters (such

Report No _SMRUL-MRP-2012-004 to _Mainstream_ Issue Date: 9th March 2012
18 | P a g e
as the activity location and time of year, or the source level, frequency and duty cycle of the sound
production) on the risk to marine mammals.
Report No _SMRUL-MRP-2012-004 to _Mainstream_ Issue Date: 9th March 2012
19 | P a g e
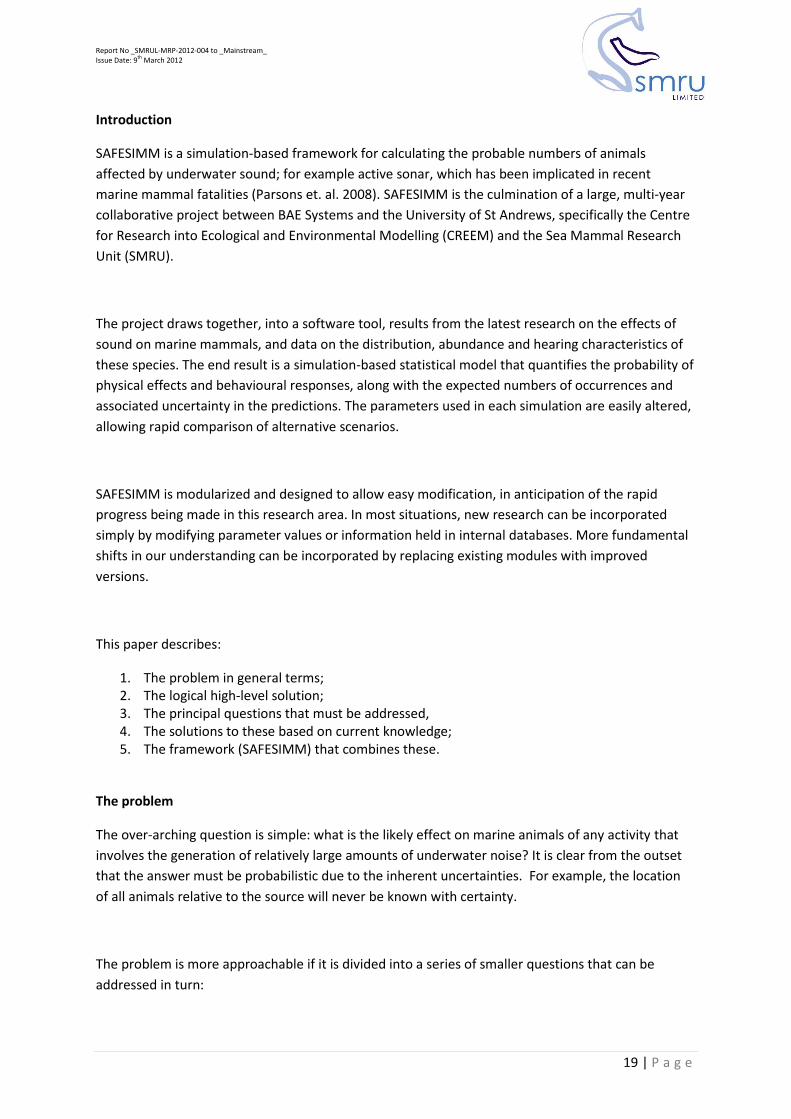
Introduction
SAFESIMM is a simulation-based framework for calculating the probable numbers of animals
affected by underwater sound; for example active sonar, which has been implicated in recent
marine mammal fatalities (Parsons et. al. 2008). SAFESIMM is the culmination of a large, multi-year
collaborative project between BAE Systems and the University of St Andrews, specifically the Centre
for Research into Ecological and Environmental Modelling (CREEM) and the Sea Mammal Research
Unit (SMRU).
The project draws together, into a software tool, results from the latest research on the effects of
sound on marine mammals, and data on the distribution, abundance and hearing characteristics of
these species. The end result is a simulation-based statistical model that quantifies the probability of
physical effects and behavioural responses, along with the expected numbers of occurrences and
associated uncertainty in the predictions. The parameters used in each simulation are easily altered,
allowing rapid comparison of alternative scenarios.
SAFESIMM is modularized and designed to allow easy modification, in anticipation of the rapid
progress being made in this research area. In most situations, new research can be incorporated
simply by modifying parameter values or information held in internal databases. More fundamental
shifts in our understanding can be incorporated by replacing existing modules with improved
versions.
This paper describes:
1. The problem in general terms; 2. The logical high-level solution; 3. The principal questions that must be addressed, 4. The solutions to these based on current knowledge; 5. The framework (SAFESIMM) that combines these.
The problem
The over-arching question is simple: what is the likely effect on marine animals of any activity that
involves the generation of relatively large amounts of underwater noise? It is clear from the outset
that the answer must be probabilistic due to the inherent uncertainties. For example, the location
of all animals relative to the source will never be known with certainty.
The problem is more approachable if it is divided into a series of smaller questions that can be
addressed in turn:
Report No _SMRUL-MRP-2012-004 to _Mainstream_ Issue Date: 9th March 2012
20 | P a g e
1. What is the distribution of the sound source's energy through space and time? 2. What sound exposure histories are likely to be experienced by the different components of
the marine fauna? 3. What is the likely effect on this fauna of a given history of sound exposure?
So far, most of the research in this area has focussed on one component of the marine fauna
(marine mammals, and particularly cetaceans), because they are perceived (at least by the public) to
be the most vulnerable to anthropogenic sound. We have followed this example in SAFESIMM, and
the rest of this paper deals primarily with evaluating the potential impacts of such sounds on marine
mammals.
The distribution of sound from the anthropogenic source
The underwater propagation characteristics for many anthropogenic sound sources are well known.
Indeed, the effectiveness of active sonar depends on knowing how the emissions travel through the
aquatic environment. More generally, there are established physics principles governing the
transmission of sound waves through water that can be used to model propagation-loss under a
particular set of physical conditions (e.g. source spectra, bathymetry, water column temperature
profiles, sediment types etc.).
The output from such a two or three-dimensional propagation-loss model can be used to predict the
received sound-level, and history of sound exposure, at any point in space and time in the ocean,
provided the important oceanographic features and source characteristics are known.
The distribution of animals within the sound field
Although it may be possible to determine the precise locations of individual animals that are
detected and tracked, the specific locations of the vast majority of animals within the sound field will
never be known. This is, to a large extent because of the limited availability of animals for detection
(e.g. at the surface for a visual observer, or vocalising if passive acoustic detection is being used) and
the relatively low probability that animals will be detected even if they are available (e.g. animals far
from the observer/detector are likely to be overlooked).
However, extensive information is available about the distribution of marine animals, both
horizontally and vertically, from surveys and statistical models. Published survey results can be used
to identify regions of high or low densities for many species. Similarly, species distribution maps can
be constructed using information such as presence/absence, density and habitat preference
(Kaschner et. al. 2006, Costello et. al. 2007). Detailed studies of the diving behaviour of marine
mammals also provide information about their depth distributions. This can be at a coarse level

Report No _SMRUL-MRP-2012-004 to _Mainstream_ Issue Date: 9th March 2012
21 | P a g e
(such as maximum dive depth and preferred depths) or fine scale (distribution at depth from models
of dive patterns or animal tag data). Collectively, this information can be used to predict the
distribution of most marine mammals species in three-dimensions, and these models can be used to
provide probabilistic predictions for a given area and time.
The likely sound exposure of these animals can be derived from the history of sound exposure for a
hypothetical animal as it moves through the sound field. The distribution model described above can
be used to provide probable starting points for these hypothetical animals. Then a suitable
movement model can be used to provide species-specific sound-exposure histories. These
movement models can be parameterised from detailed studies of the behaviour of individual
animals fitted with various kinds of telemetry devices. For example, we can use the distribution of
swim speeds and dive depths of these animals, with constrained random components to reflect the
uncertainties in actual movement.
The range of probable sound-exposure histories for all of the individuals likely to be exposed to the
predicted sound field can therefore be found by repeated computer simulations using the species
distribution information and movement model. Each simulated animal represents a possible reality
of sound exposures. Hence it is possible to calculate probable exposures for all animals, even though
their precise locations are unknown.
The effect of sound exposure history
Sound exposure histories form the basis of Health and Safety regulation for humans and elements of
this approach can be used to answer similar questions for marine mammals. In terms of physical
effects, the most important factor is the accumulated amount of sound energy the subject has been,
or is likely to be, exposed to.
For humans, accumulated sound energy is calculated as a function of the received levels through
time. These are typically weighted, to give a single numeric measure called the personal exposure
level for the period exposed. The weighting assigns less importance to sounds at frequencies to
which the human ear is least sensitive. Similar calculations can be performed for marine mammal
sound exposure histories, with the weighting provided by a measured or assumed profile of hearing
sensitivity. Southall et al (2007b) provide a set of such weightings for different groups of marine
mammals.
In the human case, the accumulated sound exposure can be compared to threshold levels which
delineate safe and unsafe histories of sound exposure. In general this is based on dose-response
curves that predict the probability of a particular response given a particular sound exposure history.

Report No _SMRUL-MRP-2012-004 to _Mainstream_ Issue Date: 9th March 2012
22 | P a g e
For human hearing, the most commonly used responses are temporary and permanent deafness
(defined as an unacceptably large upward shift in the threshold for hearing) at particular
frequencies.
Dose-response curves, relating sound exposure to the probability of physical effects, have been
estimated for some marine mammals through captive studies (e.g. Finneran et. al. 2005, Kastak et.
al. 2005).
A general framework for estimating the probable effects of anthropogenic sound
The information discussed above can be combined to estimate the probabilities of any individual
marine mammal exhibiting physical effects from sound exposure, and hence the actual numbers that
might be affected. The uncertainties associated with these calculations can also be quantified to
provide information on the confidence associated with the individual estimates.
Put simply, the sound field produced by the source is simulated, as are the animals that might
potentially be affected by it. These simulated animals sample the sound field through time in a
realistic way and their sound exposure histories can be used to estimate the probability that they
will suffer hearing problems. The simulation process is repeated a large number of times to reflect
the uncertainty in the modelled system.
SAFESIMM
SAFESIMM implements the approach described above in such a way that it can be used to simulate
the effects of anthropogenic sound in the marine environment anywhere in the world’s oceans. It
includes a collection of global distribution maps for 115 marine mammal species; a database of
information on hearing capabilities, diving and swimming behaviour, reactions to sound and
conservation status for each species; parameter sets that define hearing sensitivities and dose
response curves; and simulation routines. SAFESIMM can be used with any model providing
propagation loss information.
The core code for SAFESIMM is written in the statistical programming environment R (R Core
Development Team, 2008). The broad functioning is shown in Figure 8, the module descriptions that
follow relate to this flow diagram.
Report No _SMRUL-MRP-2012-004 to _Mainstream_ Issue Date: 9th March 2012
23 | P a g e
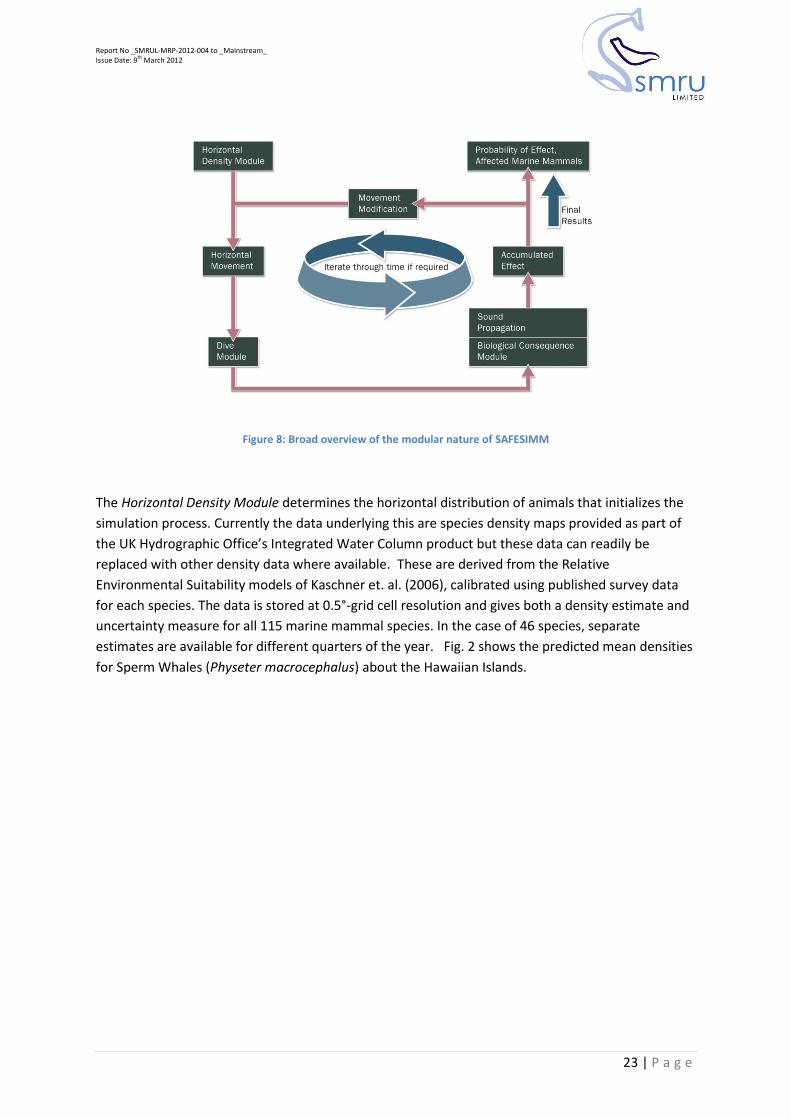
Figure 8: Broad overview of the modular nature of SAFESIMM
The Horizontal Density Module determines the horizontal distribution of animals that initializes the
simulation process. Currently the data underlying this are species density maps provided as part of
the UK Hydrographic Office’s Integrated Water Column product but these data can readily be
replaced with other density data where available. These are derived from the Relative
Environmental Suitability models of Kaschner et. al. (2006), calibrated using published survey data
for each species. The data is stored at 0.5°-grid cell resolution and gives both a density estimate and
uncertainty measure for all 115 marine mammal species. In the case of 46 species, separate
estimates are available for different quarters of the year. Fig. 2 shows the predicted mean densities
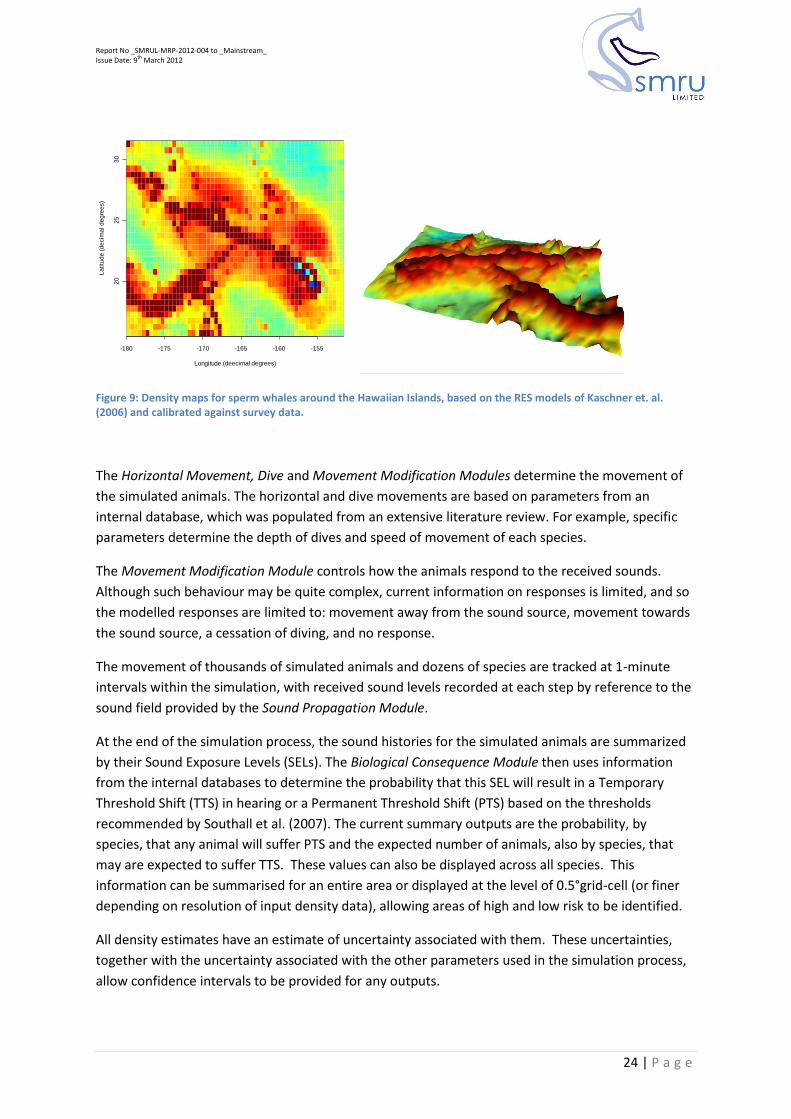
for Sperm Whales (Physeter macrocephalus) about the Hawaiian Islands.
Report No _SMRUL-MRP-2012-004 to _Mainstream_ Issue Date: 9th March 2012
24 | P a g e
Figure 9: Density maps for sperm whales around the Hawaiian Islands, based on the RES models of Kaschner et. al. (2006) and calibrated against survey data.
The Horizontal Movement, Dive and Movement Modification Modules determine the movement of
the simulated animals. The horizontal and dive movements are based on parameters from an
internal database, which was populated from an extensive literature review. For example, specific
parameters determine the depth of dives and speed of movement of each species.
The Movement Modification Module controls how the animals respond to the received sounds.
Although such behaviour may be quite complex, current information on responses is limited, and so
the modelled responses are limited to: movement away from the sound source, movement towards
the sound source, a cessation of diving, and no response.
The movement of thousands of simulated animals and dozens of species are tracked at 1-minute
intervals within the simulation, with received sound levels recorded at each step by reference to the
sound field provided by the Sound Propagation Module.
At the end of the simulation process, the sound histories for the simulated animals are summarized
by their Sound Exposure Levels (SELs). The Biological Consequence Module then uses information
from the internal databases to determine the probability that this SEL will result in a Temporary
Threshold Shift (TTS) in hearing or a Permanent Threshold Shift (PTS) based on the thresholds
recommended by Southall et al. (2007). The current summary outputs are the probability, by
species, that any animal will suffer PTS and the expected number of animals, also by species, that
may are expected to suffer TTS. These values can also be displayed across all species. This
information can be summarised for an entire area or displayed at the level of 0.5°grid-cell (or finer
depending on resolution of input density data), allowing areas of high and low risk to be identified.
All density estimates have an estimate of uncertainty associated with them. These uncertainties,
together with the uncertainty associated with the other parameters used in the simulation process,
allow confidence intervals to be provided for any outputs.
-180 -175 -170 -165 -160 -155
20
25
30
Longitude (deecimal degrees)
La
titu
de
(d
ecim
al d
eg
ree
s)
Report No _SMRUL-MRP-2012-004 to _Mainstream_ Issue Date: 9th March 2012
25 | P a g e
Mitigations can be explored by comparing results under different scenarios. For example, deploying
the sound source in a slightly different location or at a different time of year. Similarly, a small
change in the characteristics of the sound source may have a substantial effect on risk, depending on
the hearing sensitivities of the marine mammal species that occur in the region.
Behavioural responses to sound exposure are still poorly understood (Southall et al. 2007c) but, as
understanding increases, they can be accommodated within SAFESIMM in two ways. Additional
dose-response curves for particular behavioural responses can be included without system
modification. The sound exposure and location of simulated animals are monitored at a fine spatial
scale. It is therefore possible to record and flag particular high risk events, such as if simulated
beaked whales are driven from deep to shallow waters during a simulation, or if a large proportion
of a local population is driven out of a particular area.
Summary
SAFESIMM is a flexible algorithm for the calculation of risk to marine fauna from anthropogenic
sound. It is currently populated with a large and comprehensive set of data that reflects the current
state of knowledge for marine mammals.
The algorithm has been created in an easily modifiable form, so the latest research developments in
this rapidly changing field can easily be incorporated.
References
Costello M.J., Stocks K., Zhang Y., Grassle J.F., Fautin D.G. (March 2007). About the Ocean
Biogeographic Information System (OBIS).
Finneran, J.J., Carder, D.A., Schlundt, C.E. & Ridgeway, S.H. (2005). Temporary threshold shift in
bottlenose dolphin (Tursiops truncatus) exposed to mid-frequency tones. Journal of the Acoustical
Society of America. 118: 2696-2705.
Kaschner, K., Watson, R., Trites, A.W. & Pauly, D. (2006). Mapping world-wide distributions of
marine mammal species using a Relative Environmental Suitability (RES) model. Marine Ecology
Progress Series 316: 285-310.
Kastak, D., Southall, B. L., Schusterman, R. J., and Kastak, C. R. (2005). Underwater temporary
threshold shift in pinnipeds: Effects of noise level and duration. . Journal of the Acoustical Society of
America. 118 (5): 3154-3163
Parsons, E.C.M., Dolman, Sarah J., Wright, Andrew J., Rose, Naomi A., and W.C.G. Burns. (2008)
Navy sonar and cetaceans: Just how much does the gun need to smoke before we act? Marine
Pollution Bulletin 56 (7): 1248-1257
R Development Core Team. (2008) R: A Language and Environment for Statistical Computing. R
Foundation for Statistical Computing. Vienna, Austria. http://www.R-project.org

Report No _SMRUL-MRP-2012-004 to _Mainstream_ Issue Date: 9th March 2012
26 | P a g e
Southall, B., Bowles, A., Ellison, W., Finneran, J., Gentry, R., Greene, C.J., Kastak, D., Ketten, D.,
Miller, J., Nachtigall, P., Richardson, W., Thomas, J., & Tyack, P. (2007a) Marine Mammal Noise
Exposure Criteria: Initial Scientific Recommendations. Aquatic Mammals 33: 411-521.
Southall, B., Bowles, A., Ellison, W., Finneran, J., Gentry, R., Greene, C.J., Kastak, D., Ketten, D.,
Miller, J., Nachtigall, P., Richardson, W., Thomas, J., & Tyack, P. (2007b) Marine Mammal Noise
Exposure Criteria: Initial Scientific Recommendations - Structure of the Noise Exposure Criteria.
Aquatic Mammals 33: 427-436.
Southall, B., Bowles, A., Ellison, W., Finneran, J., Gentry, R., Greene, C.J., Kastak, D.,
Ketten, D., Miller, J., Nachtigall, P., Richardson, W., Thomas, J., & Tyack, P. (2007c)
Marine Mammal Noise Exposure Criteria: Initial Scientific Recommendations - Criteria
for Behavioral Disturbance. Aquatic Mammals, 33, 446-473.

Report No _SMRUL-MRP-2012-004 to _Mainstream_ Issue Date: 9th March 2012
0 | P a g e
II. Appendix Two Table 7 Engineering parameters modelled for each site.
Inch Cape (Most Likely)
FOF (most likely Worst Case)
NNG (Most Likely) Estimated Engineering Parameters
Pile Diameter (mm) 2438 2000 2500
Total Penetration (m driven below seabed) 50 34 27.5
Hammer Capacity (max blow energy, kJ) 1200 1800
1200
Soft-start duration (mins) 20 20 20
Total Piling Duration (hours per pile) 3 hours
2 hours per pile (for installation of full
substructure 4 piles, 3hours break between between each driving
operation 200 Mins (3 Hours 20 mins)
Ramp-up Details
Time (minutes
at % efficiency)
Efficiency (% of max blow
energy)
Time (minutes
at % efficiency)
Efficiency (% of max
blow energy)
Time (minutes
at % efficiency)
Efficiency (% of max blow
energy)
Use Soft Start + Standard Ramp up
15 20 20 20
15 40 180 83
15 60
25 80
50 95
Strike rate (per s) 1 1 0.5
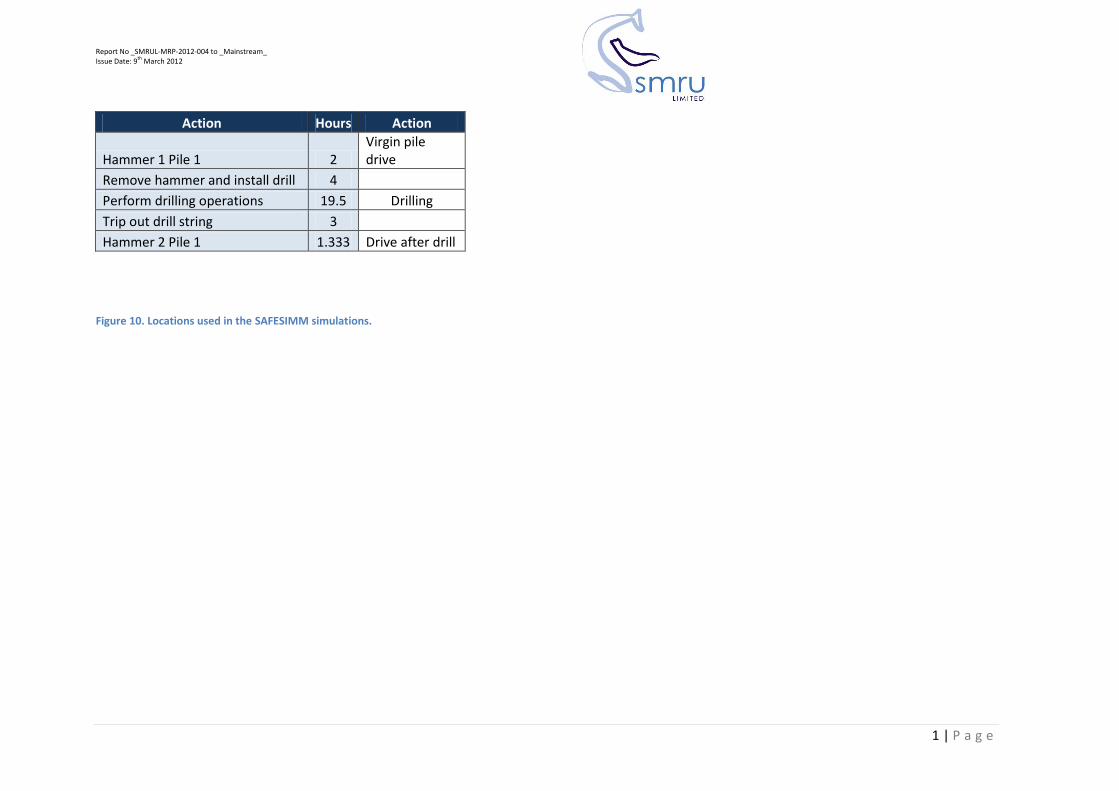
NNG Most Likely Drill & Drive
Report No _SMRUL-MRP-2012-004 to _Mainstream_ Issue Date: 9th March 2012
1 | P a g e
Action Hours Action
Hammer 1 Pile 1 2 Virgin pile drive
Remove hammer and install drill 4
Perform drilling operations 19.5 Drilling
Trip out drill string 3
Hammer 2 Pile 1 1.333 Drive after drill
Figure 10. Locations used in the SAFESIMM simulations.