SMC Global Monthly Report on Bullions & Energy
19
SPECIAL MONTHLY REPORT ON Bullions & Energy (May 2014)
-
Upload
smc-global-securities-ltd -
Category
Economy & Finance
-
view
87 -
download
0
Transcript of SMC Global Monthly Report on Bullions & Energy

SPECIAL MONTHLY REPORT ON
Bullions & Energy(May 2014)
2
BU
LL
ION
S &
EN
ER
GY
May 2014
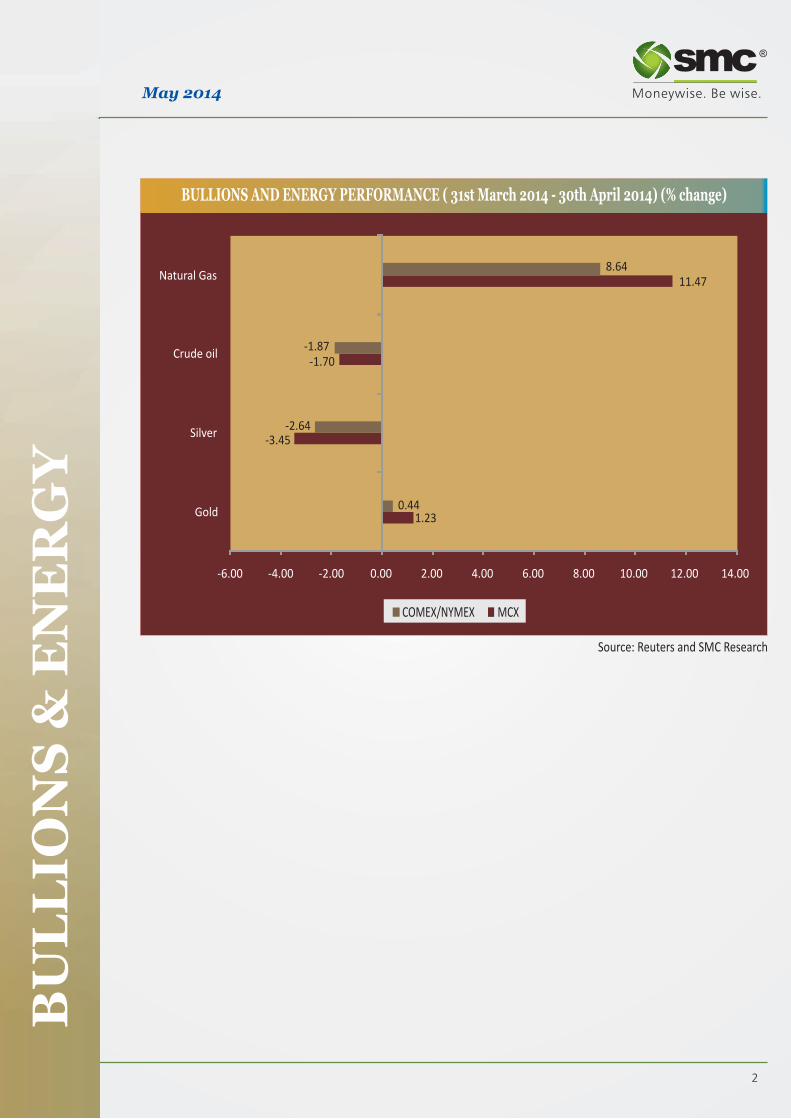
BULLIONS AND ENERGY PERFORMANCE ( - 30th April 2014) (% change) 31st March 2014
Source: Reuters and SMC Research
COMEX/NYMEX MCX
1.23
-3.45
-1.70
11.47
0.44
-2.64
-1.87
8.64
-6.00 -4.00 -2.00 0.00 2.00 4.00 6.00 8.00 10.00 12.00 14.00
Gold
Silver
Crude oil
Natural Gas

3
BULLIONS
In the month of April bullion counter moved in very
thin range on mixed fundamentals. Dollar index
took support near 79.5 levels and recovered last
month which pressurized the bullions lower. Slow
China physical demand capped the upside in gold.
Overall gold traded in range of 27770-28670 in MCX
and $1268-1332 in COMEX. Silver traded in range of
$18.91-20.38 in COMEX and 41500-43800 in MCX.
Recently rising greenback and better economic data
have kept the prices downbeat. Meanwhile
geopolitical tensions in Ukraine kept the downside
capped as it increases safe haven demand of yellow
metal. COMEX Gold has rallied 7.5 percent this year,
rebounding from the worst annual drop in more
than three decades, partly as the conflict between
Russia and Ukraine fueled demand. U.S. Secretary
of State John Kerry warned that Russia was running
out of time to comply with an accord aimed at easing
tensions in Ukraine, as Russian forces began
exercises on the two countries' border. President
Vladimir Putin warned Ukraine against continuing
an anti-separatist offensive. Holdings in the SPDR
Gold Trust, the largest gold backed exchange traded
product, held at a 12-week low of 792.14 metric
tonnes.
In the month of May 2014 bullion counter can move
sideways with upside bias. On domestic bourses the
movements of local currency rupee will be key factor
to watch out which can move in range of 59-61.50 in
the month of May. Gold can trade in range of Rs
26000-29500 in MCX and $1220-1350 in
COMEX. Silver can trade in range of 40000-
44000 in MCX and $19-21 in COMEX. The
gold/silver ratio has moved to nearly 66.7 from 61
since start of the February which showed that silver
fell at faster pace than gold recently. This ratio can
hover in range of 64-68 in the month of May.
Recovery in US economy has also led to reduced safe
haven demand in bullion counter. Investors looked
ahead to a series of key economic events in this
month for further indications on the strength of the
U.S. economy and the future course of monetary
policy. An improving economy and slowing stimulus
measures hurt gold's appeal as an investment
compared with other assets. Meanwhile, hundreds
of pro-Moscow separatists stormed government BU
LL
ION
SMay 2014
buildings in one of Ukraine's provincial capitals on
recently and fired on police holed up in a regional
headquarters, a major escalation of their revolt despite
new Western sanctions on Russia. Geopolitical tensions
usually increase gold's appeal as a safe haven asset. Gold
has gained from rising Ukraine tensions this year, but it
has recently been weighed down by strong economic
data. Turkey cut its gold holdings by 14.3 tonnes to 483
tonnes in March, while Russia lowered its bullion
reserves slightly last month. As per industry forecast,
gold imports to India for April and May are likely to be
feeble against March imports as restrictions on cash
movements during the general elections possibly
reduced the purchasing power of consumers.
Gold and emerging markets
Over the past decade, emerging markets have benefited
from strong growth and cheap funding. Investors have
increased their exposure and, given the positive long-
term view of these economies, there is a strong rationale
for investors to have EM in their portfolios. However,
given recent market volatility and concerns about the
sustainability of EM growth, it is more pressing than
ever for investors to understand how to hedge exposure
to the asset class and, even if they don't have direct
holdings, how to reduce the effects of a spillover in their
portfolios. While EM crises may have been regionally
contained in the past, the increasing weight of these
markets in global GDP and international trade could
increase the risk of contagion in any future crisis. In that
context, there is a strong argument for using gold to
enhance EM hedging strategies.
Ukraine tensions and Gold
Recently escalating military tension between Ukraine
and Russia bolstered demand for assets such as gold
which is perceived to be relatively safe haven. Any
escalation in tensions between Russia and the West over
Ukraine could push prices higher. Ukraine sought to
dislodge rebels from its eastern industrial heartland
amid violence that's also spread to the Black Sea
gateway of Odessa. Troops in the Donetsk area, near
Russia's border, took back a television tower overnight
that had been seized by pro-Russian forces.
4
BU
LL
ION
SMay 2014
Election cash restrictions to dent India's
gold imports
India's gold imports in April and May could be less
than half of arrivals in March, as restrictions on the
movement of cash during general elections dent the
buying power of consumers, jewellery industry.
Lower imports by the world's No.2 buyer of gold
after China could hurt a recovery in global prices of
the precious metal after a sharp 28 percent drop last
year.
India's 2013/14 gold, silver imports down 40
pct at $33.46 bln-govt source
Gold and silver imports into India, the world's
second-biggest buyer of the metal, dropped 40
percent to $33.46 billion in 2013/14, following a
series of restrictions imposed by the federal
government to curtail the current account deficit.
China imports less gold as demand wanes,
currency weakens
Banks in China have been importing less gold over
the past month as demand waned after the festival
season, while cheaper prices at home due to a softer
yuan also curbed overseas purchases of the precious
metal. Nickel usage (consumption) will continue to
increase this year, although at a lower rate than in
recent years, with China being the main growth
market.
China Gold market
China's economy has grown by an astonishing 140%
over the past decade. Yet this figure is eclipsed by
spending on gold jewellery, which is estimated to
have risen by 500% in real terms over the same
period. Although this outperformance implies that
other factors have been at work, their positive
impact on the jewellery market has been
underpinned by the huge strides made by the
Chinese economy. Economic growth has not only
lifted hundreds of millions of China's citizens out of
poverty but also helped create sufficient wealth to
drive a boom in expenditure on a wide range of
consumer discretionary goods and services. Average
GDP per capita in China has increased to over
RMB42,000 (around US$7,000). However, income
distribution between social groups and regions is very
unequal. This means that there are a substantial
number of Chinese citizens whose incomes are a
multiple of the average. Indeed, the 'middle class',
defined as those households with incomes greater than
RMB50,000, now consists of almost 300 million
people and is forecast to grow to 500 million by 2020.
Such people have sufficient disposable income to
purchase higher value non-essential items, such as
jewellery and luxury goods. This group of wealthier
individuals has expanded considerably both in absolute
terms and in spending power. Moreover, its presence
has also grown in those parts of China, such as the West
and North East of the country, where economic
development has historically lagged behind that of
Beijing and the prosperous Eastern seaboard.
China Jewellery market
From humble beginnings China has become the world's
number one jewellery market, nearly trebling in size
over the past decade. Over the past decade the Chinese
jewellery market has been transformed. In terms of gold
demand this has meant a near tripling in volume from
2004's 224t to 669t last year.
Even more impressive is that over the same period
expenditure on gold jewellery has risen close to six-fold.
In 2013 China eclipsed India to become the world's
largest consumer and manufacturer of jewellery.
Moreover, in 2013 the country accounted for no less
than 30% of global jewellery demand. As explained
below, this tremendous expansion has been founded on
a combination of economic, demographic and cultural
factors.
According to Thomson Reuters GFMS China's
fabrication of gold jewellery jumped to 724t in 2013, a
31% rise over the previous year's figure. Over 85% of
fabrication is destined for the domestic market. Exports
to the US and Europe increased substantially in the
2000s.

5
BU
LL
ION
SMay 2014
Silver jewellery has performed especially well in China over recent years. Data from Thomson Reuters GFMS
show that fabrication demand has almost trebled in the past decade, reaching 1,762t in 2012.32
6
BU
LL
ION
SMay 2014
Key reason for surge in China demand
�China's transformation over the past 30 years
from rural poverty to urban prosperity has
created a new middle class, with economic
growth producing hundreds of millions of new
consumers.
�A huge expansion in manufacturing capacity
and retail outlets has provided the foundation
for explosive growth in jewellery demand.
�Demand has benefited from a substantial
increase in the working age population and a
rise in the number of marriages: we estimate
that wedding demand accounts for 40% of gold
consumption.
�Development of the supply-side infrastructure,
making products available to the public, has
been essential for investment demand growth.
�Investors in China believe that US economic
policies will eventually undermine the dollar
and drive up the international price of gold.
China Gold outlook for 2014
2014 is likely to be a year of consolidation after 2013's
spectacular growth in demand, although much will
depend on the trend in local gold prices. Over the
medium term the expected increase in real income and
purchasing power will support growth in jewellery
consumption.
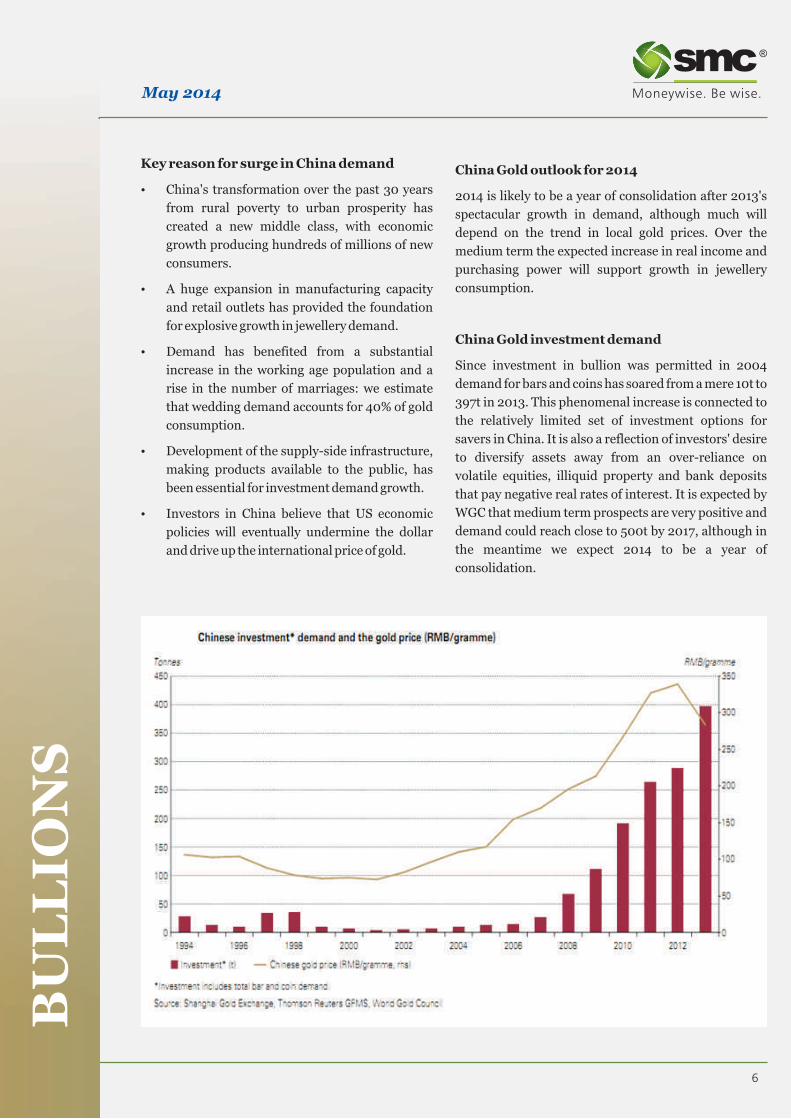
China Gold investment demand
Since investment in bullion was permitted in 2004
demand for bars and coins has soared from a mere 10t to
397t in 2013. This phenomenal increase is connected to
the relatively limited set of investment options for
savers in China. It is also a reflection of investors' desire
to diversify assets away from an over-reliance on
volatile equities, illiquid property and bank deposits
that pay negative real rates of interest. It is expected by
WGC that medium term prospects are very positive and
demand could reach close to 500t by 2017, although in
the meantime we expect 2014 to be a year of
consolidation.

7
BU
LL
ION
SMay 2014
SHFE Gold trading
Speculative investment in gold, especially via the Shanghai Futures Exchange, has also grown tremendously in
recent years. A different type of private investor, or rather speculator, is active in the 'paper' markets, be that the
SGE or, more notably, the Shanghai Futures Exchange (SHFE). By definition, in order to access these markets
even through intermediaries the investors need to be large and relatively sophisticated. They are also usually
taking positions based upon short-term price expectations. Unlike physical bullion where investors typically
invest for the long-term, these are actively traded gold markets not 'buy and hold' ones. As explained below, these
markets have thrived, experiencing a major jump in turnover in recent years. Gold is a very high profile, liquid
and internationally traded asset that Chinese speculators are increasingly keen to trade on domestic bourses, or
even loco-London or Comex. These markets offer a less costly and more highly leveraged means of speculating on
gold than, for example, ETFs.
China industrial demand
Industrial demand for gold has grown strongly but is tiny compared to jewellery and investment demand. Gold
use in a variety of industrial applications accounted for around 5.5% of total private sector demand and 8% of
Chinese fabrication demand in 2013. Around two-thirds of industrial demand in China is related to electronics,
with the balance largely required for a variety of decorative uses.
Overall industrial demand has grown strongly in the past decade, climbing from 16t in 2003 to around 66t in
2013. This is in line with China's rise to prominence as the world's manufacturing hub. Data on industrial
production show the same trend, with output in 2013 over 2.5 times greater than it was in 2004. China has
become the world's dominant producer of electronics goods, the world's largest manufacturer of automobiles
and a growing centre for the production of branded luxury goods.

8
BU
LL
ION
SMay 2014
China official reserves
Based on a declared stock of 1,054t China is the world's sixth largest holder of bullion but this only represents 1%
of its total official reserves. In fact, there have been three occasions in the recent past when China has reported a
sudden increase in its official monetary reserves to the IMF. In 2001 reported monetary gold holdings increased
from 395t to 500t and in 2002 to 600t . Then in April 2009 gold holdings jumped to 1,054t, a level that has been
maintained since then through to the end of 2013. The most recent increase in reported gold holdings has led to
China becoming the world's sixth largest holder of gold behind the US (8,134t), Germany (3,387t), the IMF
(2,814t), Italy (2,452t) and France (2,435t).

9
BU
LL
ION
SMay 2014
Range
Gold MCX Rs 26000-29500 per 10 gms
COMEX $1220-1350 per troy ounce
Gold Hedge NCDEX Rs 24700-26700 per 10 gms
Silver MCX Rs 40000-44000 per kg
COMEX $19-21per ounce
Silver Hedge NCDEX Rs 3600-4000 per 100 gms
Gold Silver ratio
Source: Reuters
Analysis: The gold/silver ratio has moved to nearly 66.7 from 61 since start of the February which showed that
silver fell at faster pace than gold recently. This ratio can hover in range of 64-68 in the month of May.
In the month of May 2014 bullion counter
will remain sideways with upside bias.
Ukraine tensions and movement of
greenback will give further direction to the
prices. Moreover condition of global
economy and movement of local currency
rupee coupled with Physical, ETF demand
will also influence its prices.

ENERGYENERGYCRUDE OIL & NATURAL GASCRUDE OIL & NATURAL GAS

11
EN
ER
GY
ENERGY COMPLEX
Crude Oil
In the month of April crude oil prices traded on
volatile path amid recovery in greenback and
increasing stockpiles. On domestic bourses volatile
local currency rupee has kept the prices on sideways
path. Meanwhile Ukraine and Russia tensions gave
support to the prices. According to Energy
Information Administration “U.S. crude stockpiles
expanded by 3.52 million barrels to 397.7 million ”
Supplies have increased in the Gulf coast since
January as the southern leg of the Keystone XL
pipeline began moving oil from Oklahoma to the
Gulf of Mexico while U.S. law bars almost all
exports. Inventories along the Gulf Coast climbed by
2.44 million barrels to 209.6 million which are the
highest in EIA data going back to 1990.Prices traded
in range of nearly $98.8- 104.98 in NYMEX and
5928-6322 in MCX.
Crude oil futures can move on sideways with weak
bias in the month of May. Economic data from US
May 2014
and Europe will give direction to the crude oil prices.
Middle East tensions may result in reduced supplies
which may also give support to the crude oil prices.
Crude oil can move in range of 5850-6300 in the
month of May. Meanwhile U.S. Secretary of State
John Kerry warned Russia of making “an expensive
mistake” in Ukraine as Russia's military began drills
near the border. Russia is the world's second-largest net
oil exporter and supplied 30 percent of Europe's natural
gas last year. Libya's National Oil Corporation is set to
resume exports from Zueitina after declaring an end last
week to a force majeure imposed on the eastern port,
which was blocked by rebels for nine months. Investors
continued to monitor events in Ukraine, as hostilities
between Kiev and Moscow escalated after pro-Russian
rebels in east Ukraine took eight European military
inspectors hostage. In response, the U.S. and the
European Union said they will step up sanctions against
Moscow, underlining concerns over a disruption to
global supplies.
Brent WTI Spread
Source: Reuters
Analysis: Brent WTI spread expanded to above 8 after testing low of below 4 in beginning of this year .This
spread can hover in range of 7-10 in near term. Cushing inventories have decreased since January as the
southern leg of the Keystone XL pipeline began moving oil from the hub to Gulf Coast refineries. Supplies
dropped to 26 million in the week ended April 18, the least since October 2009, according to the Energy
Information Administration.
12
EN
ER
GY
May 2014
US oil rigs at record highs
The total number of drill rigs deployed onshore in
the US rose from 1,809 to 1,818 last month. Rigs
deployed in oil plays lifted from 1,487 to 1,498, while
rigs deployed in gas plays decreased from 318 to 316,
the lowest level since May 1993. Oil rigs have
increased to a record high since Baker Hughes
separated oil and gas rigs in 1987, as energy
producers utilise hydraulic fracturing and
horizontal drilling technologies to access shale
deposits.
IMF cuts world growth forecast in 2014
The International Monetary Fund (IMF) is
forecasting the world economy to grow by 3.6% this
year, down from its earlier estimate of 3.7%. The US
economy is expected to grow by 2.8% with China's
up 7.5% and Australia's to grow by 2.6%.
IEA lifts OPEC crude oil output forecast
The International Energy Agency (IEA) estimates
that crude oil supply from the Organisation of
Petroleum Exporting Countries (OPEC) fell
890kb/d from 30.51mb/d in February to
29.62mb/d March, reflecting weaker crude oil
output from Saudi Arabia, Iraq and Libya. The IEA
estimates that OPEC will need to supply 30.6mb/d
in 2014, above OPEC's collective 30mb/d target,
after the IEA cut its forecast for crude oil output
from Russia and Kazakhstan.
Some key points from EIA estimates
Global Crude Oil and Liquid Fuels
Consumption
EIA estimates that global consumption grew by 1.2
million bbl/d in 2013, averaging 90.4 million bbl/d
for the year. EIA expects global consumption to
grow 1.2 million bbl/d in 2014 and 1.4 million bbl/d
in 2015. Projected global oil-consumption-
weighted real GDP, which increased by an estimated
2.3% in 2013, grows by 2.9% and 3.4% in 2014 and
2015, respectively.
Non-OECD countries account for all of the expected
consumption growth in 2014 and nearly all of the
growth in 2015. China is the leading contributor to
projected global consumption growth, with
consumption increasing by 400,000 bbl/d in 2014
and 430,000 bbl/d in 2015. However, China's
economic and oil consumption growth rates have
moderated compared with rates before 2012, when
annual GDP growth exceeded 9% and oil consumption
growth averaged almost 800,000 bbl/d from 2009
through 2011.
EIA expects lower OECD consumption in 2014, led by
projected consumption declines in both Japan and
Europe. EIA expects Japan's oil consumption to fall by
an annual average of 150,000 bbl/d in 2014 and 2015, as
the country continues to increase natural gas and coal
consumption in the electricity sector and returns some
nuclear power plants to service in the second half of
2014 and in 2015. EIA projects that OECD Europe's
consumption, which fell by 100,000 bbl/d in 2013, will
decline by 60,000 bbl/d in 2014 and then remain
relatively flat in 2015. U.S. liquids consumption, which
increased by 400,000 bbl/d in 2013, is expected to
remain relatively flat in 2014 and then increase by
90,000 bbl/d in 2015.
Non‐OPEC Supply
EIA estimates that non-OPEC liquids production grew
by 1.3 million bbl/d in 2013, averaging 54.0 million
bbl/d for the year. EIA expects non-OPEC liquids
production to grow by 1.6 million bbl/d in 2014 and 1.3
million bbl/d in 2015. EIA forecasts production from
U.S. Energy Information Administration . United States
and Canada to grow by a combined annual average of 1.4
million bbl/d in 2014 and 1.2 million bbl/d in 2015. EIA
estimates that the Former Soviet Union's production
will rise by an annual average of 0.16 million bbl/d over
the forecast period, led by Russia in 2014 and
Kazakhstan in 2015.
Unplanned supply disruptions among non-OPEC
producers averaged 0.6 million bbl/d in March 2014,
about 40,000 bbl/d lower than in February as a result of
fewer outages in the North Sea and Indonesia. South
Sudan, Syria, and Yemen accounted for almost 90% of
total non-OPEC supply disruptions. EIA does not
assume a disruption to oil supply or demand as a result
of ongoing events in Ukraine.
OPEC Supply
EIA estimates that OPEC crude oil production averaged
30.0 million bbl/d in 2013, a decline of 0.9 million bbl/d
from the previous year, primarily reflecting increased
outages in Libya, Nigeria, and Iraq, along with strong
non-OPEC supply growth. EIA expects OPEC crude oil
production to fall by 0.2 million bbl/d in both 2014 and
2015, as a result of supply disruptions in OPEC and
13
EN
ER
GY
May 2014
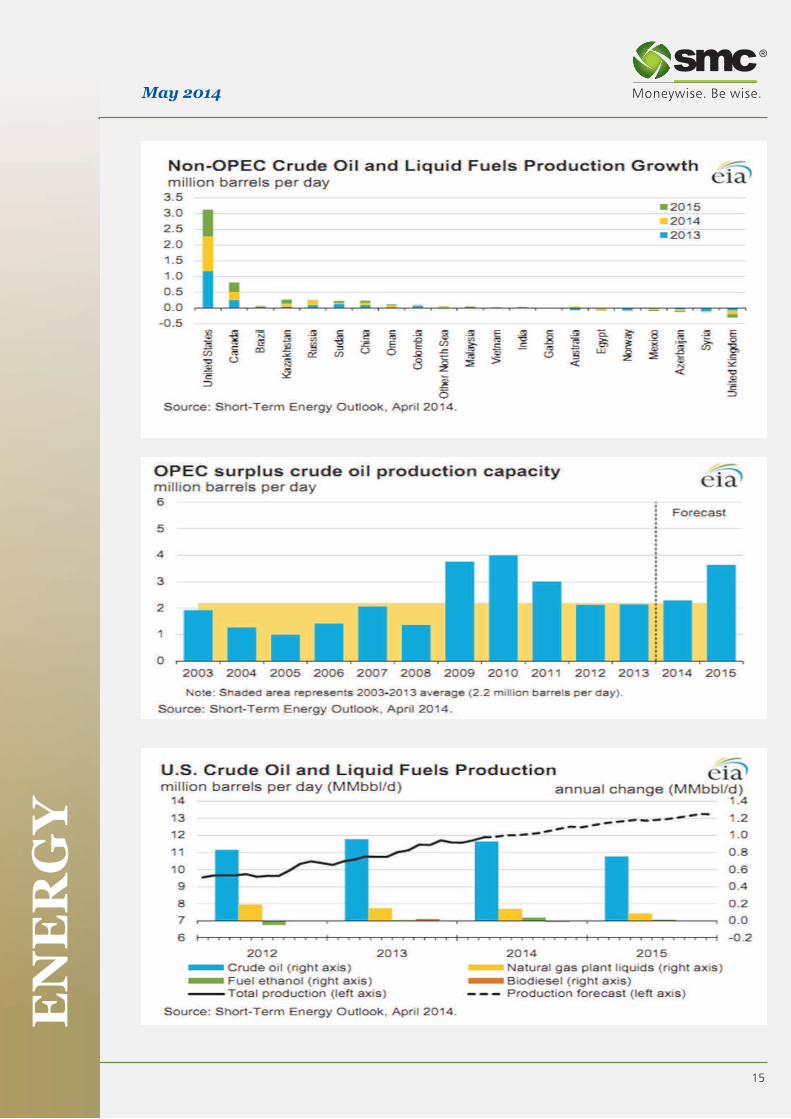
cutbacks in crude oil production to accommodate
increased supplies in non-OPEC countries.
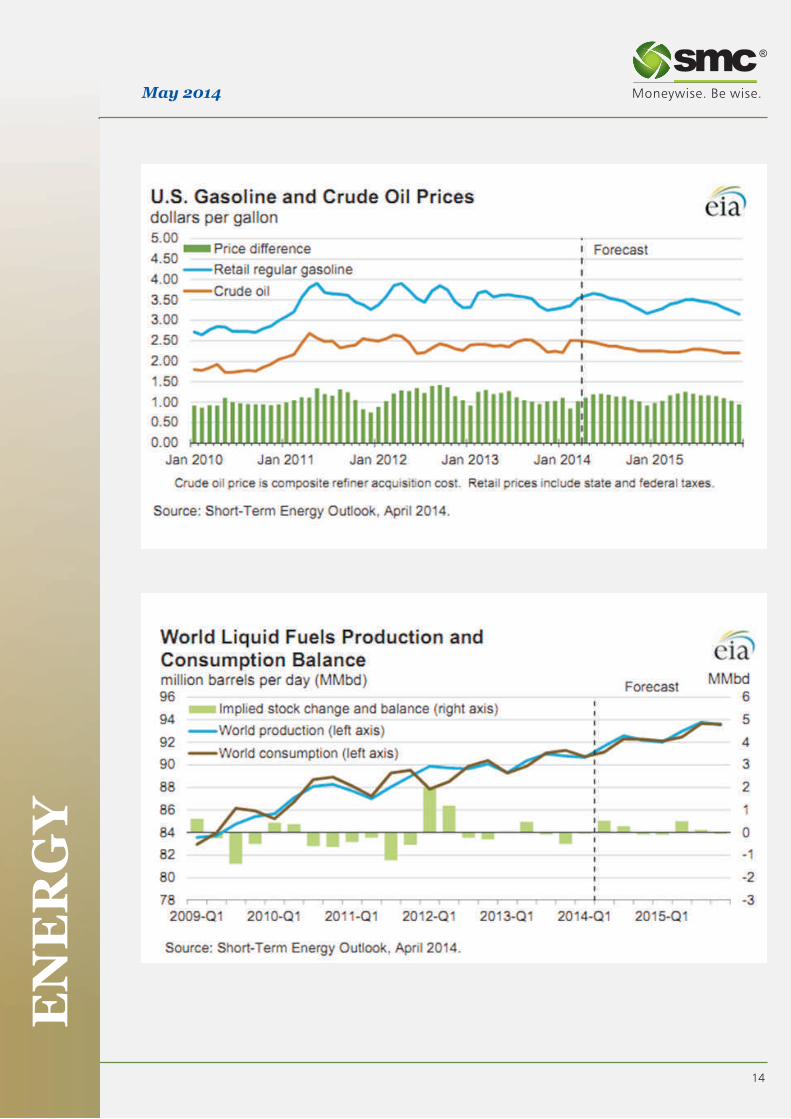
U.S. Liquid Fuels Consumption
Total U.S. liquid fuels consumption rose by an
estimated 400,000 bbl/d (2.1%) in 2013.
Consumption of hydrocarbon gas liquids (HGL)
registered the largest gain, increasing by 150,000
bbl/d (6.4%). Motor gasoline consumption grew by
90,000 bbl/d (1.1%), the largest increase since
2006. Stronger-than-expected growth in highway
travel during the second half of 2013 contributed to
that increase. Distillate fuel consumption increased
by 90,000 bbl/d (2.5%), reflecting colder weather
and domestic economic growth.
U.S. Liquid Fuels Supply
Weather conditions in the Lower 48 states during
December 2013 and January 2014 caused
operational issues in key producing regions. While a
Range
Crude Oil
MCX Rs 5850-6300 per barrel
NYMEX $96-104 per barrel
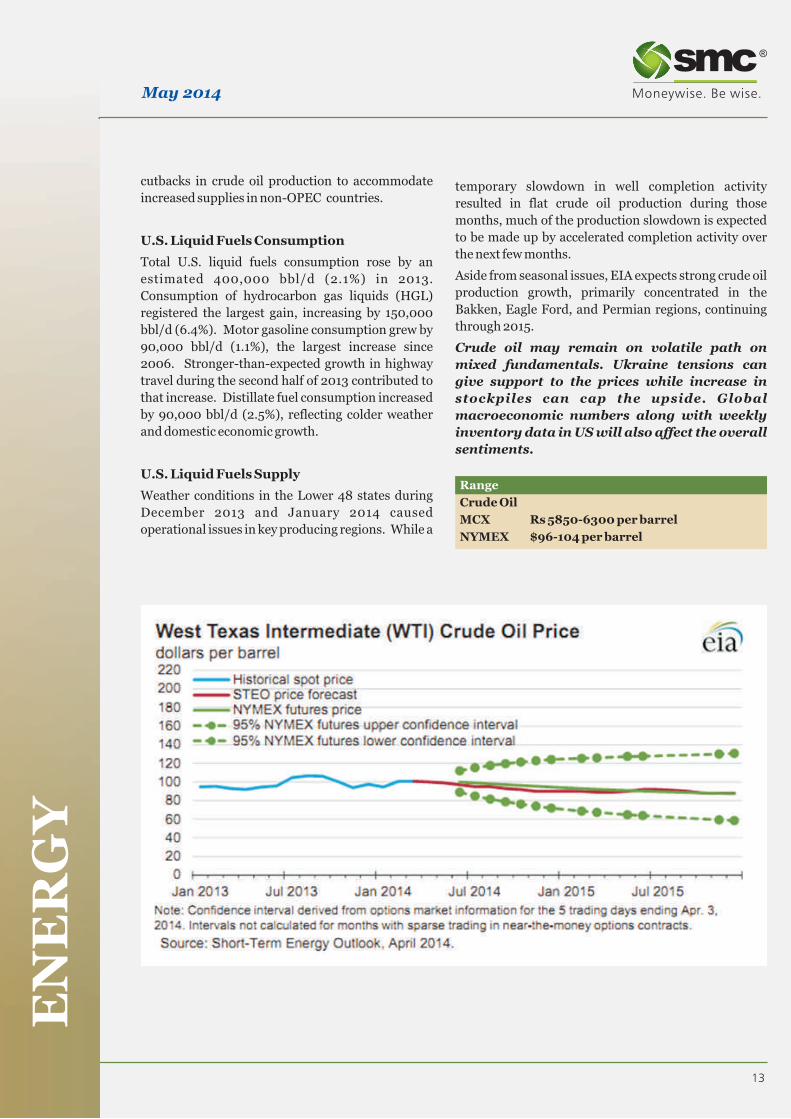
temporary slowdown in well completion activity
resulted in flat crude oil production during those
months, much of the production slowdown is expected
to be made up by accelerated completion activity over
the next few months.
Aside from seasonal issues, EIA expects strong crude oil
production growth, primarily concentrated in the
Bakken, Eagle Ford, and Permian regions, continuing
through 2015.
Crude oil may remain on volatile path on
mixed fundamentals. Ukraine tensions can
give support to the prices while increase in
stockpiles can cap the upside. Global
macroeconomic numbers along with weekly
inventory data in US will also affect the overall
sentiments.
14
EN
ER
GY
May 2014
15
EN
ER
GY
May 2014
16
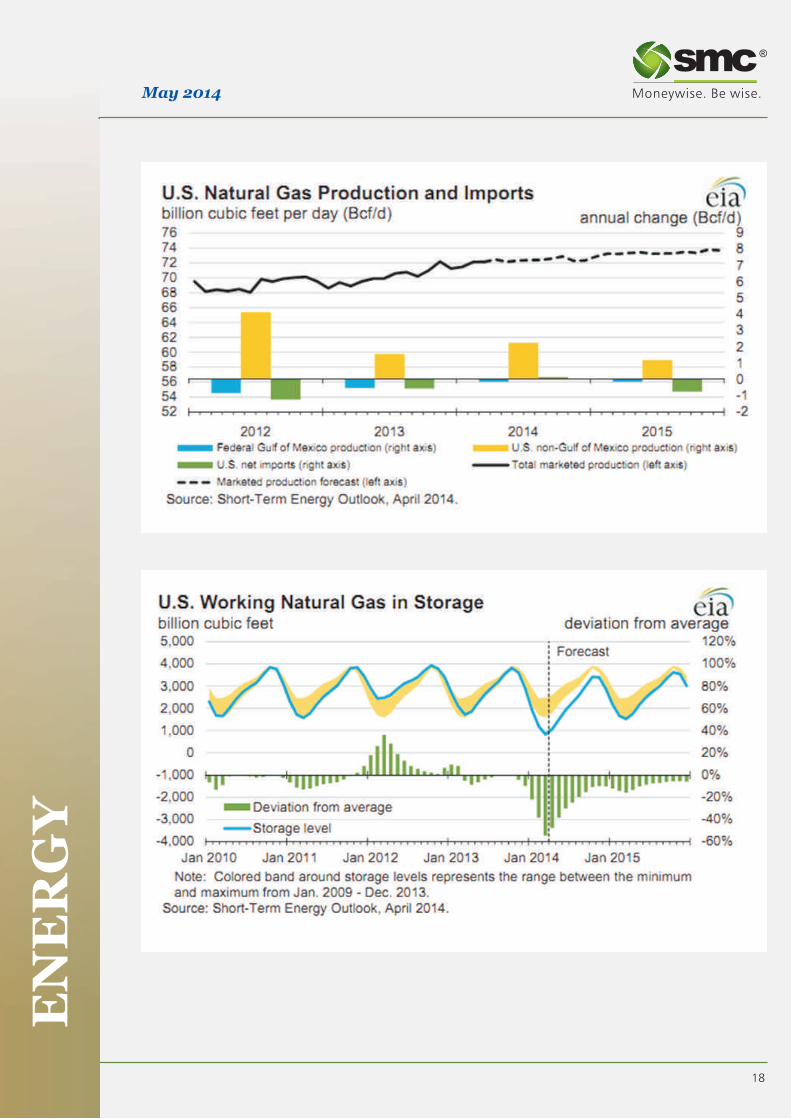
Natural Gas EIA Natural gas estimates
U.S. Natural Gas ConsumptionNatural gas prices recovered swiftly in the month of
April on cooler weather conditions and rise in EIA expects total natural gas consumption will
heating demand Overall it traded in range of $4.20-average 72.1 Bcf per day (Bcf/d) in 2014, an increase
4.83 in NYMEX and 256-294 in MCX. Prices got of 0.7 Bcf/d from 2013. Increased residential,
support as updated weather forecasting models commercial, and industrial use offsets declines
continued to call for below normal temperatures from the electric power sector, which are related to
stretching across portions of the central and eastern higher natural gas prices. In 2015, total natural gas
U.S. Portions of the Midwest and eastern regions of consumption falls by 0.4 Bcf/d as a decline in
the U.S. residential and commercial consumption more
than offsets consumption growth in the industrial Natural gas can move in range of 260-315 in and electric power sectors. EIA expects natural gas the month of May as weather concerns and consumption in the power sector to increase to 22.8 position of stockpiles will give further Bcf/d in 2015 with the retirement of some coal direction to the prices. Investors are betting plants. seasonably mild weather typical of this time of year
will curb demand for both heating and air
conditioning across much of the U.S. Updated
U.S. Natural Gas Production and Trade weather forecasting models continued to call for
slightly warmer than normal temperatures over the EIA expects natural gas marketed production will
next 15 days. Spring and fall see the weakest grow by an average rate of 3.0% in 2014 and 1.5% in
demand for natural gas in the U.S, as the absence of 2015. Rapid natural gas production growth in the
extreme temperatures curbs demand for heating Marcellus formation is contributing to falling
and air conditioning. Approximately 52% of U.S. natural gas forward prices in the Northeast, which
households use natural gas for heating, according to often fall even with or below Henry Hub prices
the Energy Department.outside of peak winter demand months.
Consequently, some drilling activity may move
away from the Marcellus back to Gulf Coast plays Latest inventory report
such as the Haynesville and Barnett, where prices
are closer to the Henry Hub spot price. Recently natural gas storage in the U.S. rose by 82
billion cubic feet last week, above forecasts for an Natural gas prices will depend upon
increase of 75 billion cubic feet. Inventories rose by weather conditions and power generation
41 billion cubic feet in the same week a year earlier, demand coupled with its consumption
while the five-year average change for the week is a pattern and inventory position in the
build of 58 billion cubic feet.month of May 2014.
Total U.S. natural gas storage stood at an 11-year
low of 981 billion cubic feet. Stocks were 790 billion
cubic feet less than last year at this time and 984
billion cubic feet below the five-year average of
1.965 trillion cubic feet for this time of year.
EN
ER
GY
May 2014
Range
Natural gas
NYMEX $4.45- $4.90 per mmBtu
MCX Rs260-315 per mmBtu

17
EN
ER
GY
May 2014
18
EN
ER
GY
May 2014

SMC Global Securities Limited is proposing, subject to receipt of requisite approvals, market conditions and other considerations, a further public issue of its equity shares and has filed a Draft Red Herring Prospectus (DRHP) with the Securities and Exchange Board of India (SEBI). The DRHP is available on the website of the SEBI at www.sebi.gov.in and the website of the Book Running Lead Managers i.e. Tata Securities Limited at www.tatacapital.com and IL&FS Capital Advisors Limited at www.ilfscapital.com. Investors should note that investment in equity shares involves a high degree of risk. For details please refer to the DRHP and particularly the section titled Risk Factors in the Draft Red Herring Prospectus.
Disclaimer:
This report is for the personal information of the authorized recipient and doesn't construe to be any investment, legal or taxation advice to you. It is only for private circulation and use .The report is based upon information that we consider reliable, but we do not represent that it is accurate or complete, and it should not be relied upon as such. No action is solicited on the basis of the contents of the report. The report should not be reproduced or redistributed to any other person(s)in any form without prior written permission of the SMC.
The contents of this material are general and are neither comprehensive nor inclusive. Neither SMC nor any of its affiliates, associates, representatives, directors or employees shall be responsible for any loss or damage that may arise to any person due to any action taken on the basis of this report. It does not constitute personal recommendations or take into account the particular investment objectives, financial situations or needs of an individual client or a corporate/s or any entity/s. All investments involve risk and past performance doesn't guarantee future results. The value of, and income from investments may vary because of the changes in the macro and micro factors given at a certain period of time. The person should use his/her own judgment while taking investment decisions.
Please note that we and our affiliates, officers, directors, and employees, including persons involved in the preparation or issuance if this material;(a) from time to time, may have long or short positions in, and buy or sell the commodities thereof, mentioned here in or (b) be engaged in any other transaction involving such commodities and earn brokerage or other compensation or act as a market maker in the commodities discussed herein (c) may have any other potential conflict of interest with respect to any recommendation and related information and opinions. All disputes shall be subject to the exclusive jurisdiction of Delhi High court.
Your valuable feedback will be appreciated
For further queries
Pls. Contact
Sandeep Joon Senior Research Analyst
Phone 011-30111000 Extn - 683
E-mail [email protected]
Supportive team
Pramod Chhimwal Graphic Designer
May 2014