Slowdown in bank credit growth: Aggregate … in bank credit growth: Aggregate demand or bank...
25
WP-2017-014 Slowdown in bank credit growth: Aggregate demand or bank non-performing assets? Ashima Goyal and Akhilesh Verma Indira Gandhi Institute of Development Research, Mumbai September 2017
Transcript of Slowdown in bank credit growth: Aggregate … in bank credit growth: Aggregate demand or bank...

WP-2017-014
Slowdown in bank credit growth: Aggregate demand or banknon-performing assets?
Ashima Goyal and Akhilesh Verma
Indira Gandhi Institute of Development Research, MumbaiSeptember 2017

Slowdown in bank credit growth: Aggregate demand or banknon-performing assets?
Ashima Goyal and Akhilesh Verma
Email(corresponding author): [email protected]
AbstractThis paper tests the bank lending channel against the aggregate demand channel as an explanation for
slow credit growth by estimating the determinants of credit and of non- performing assets (NPAs) using
three types of data sets: a quarterly macroeconomic time series, a bank panel on advances and NPAs
and a firm level panel. The results suggest demand was and remains the key constraint for credit. Only
demand variables affected corporate credit for a broad set of firms-sales and inventory were the only
significant variables. Only for a subset of indebted firms in a difference-in-difference type analysis, did
lagged credit and assets reduce credit, even so sales remained the dominant variable. From the bank
panel gross NPAs did not have a negative effect on advances but the Asset Quality Review did have a
strong negative effect. NPAs fell with growth, increased with repo rates and with past advances.
Therefore, while high interest rates and low growth raised NPAs, so did past credit. If the priority is to
revive assets and get credit flowing again, the valuable deadline imposed by the new bankruptcy code
must be supported by flexibility in restructuring, funds infusion in PSBs, and easing of macroeconomic
conditions.
Keywords: Credit slowdown; aggregate demand; bank lending; non-performing assets; firm debt
JEL Code: G21, E51
Acknowledgements:
We thank S. Sridhar, Nirmal Gangwal and other participants of the IGIDR-BRESCON workshop for useful inputs, Madan
Sabhnavis for providing a firm level dataset, and S.S. Mundra for providing data on quarterly NPAs, and Reshma Aguiar for
assistance.

1
Slowdown in bank credit growth: Aggregate demand or bank non-performing assets?
1. Introduction
High growth has been elusive and private investment has stagnated since 2011 in India. In
high growth episodes, bank credit1 has grown at least 15 % p.a. but it fell steadily to below
5% in 2016. Is this due to the increase in bank non-performing assets (NPAs) reflecting bad
loans to corporates? This is puzzling, however, since NPAs are concentrated largely in PSBs
and corporate debt largely in infrastructure sector firms. The average Indian debt-equity ratio
is below unity and average debt levels much below those in other emerging markets
(EMs).That corporate credit from other sources has also shrunk below past peaks2 suggests a
generalized fall in credit demand. Is the problem then due to low demand? Indian
macroeconomic policy was fighting high supply-shock driven inflation since 2011. Interest
rates were kept high despite low growth, even as fiscal consolidation reduced deficits3.
This paper sets out to test the bank lending channel against the aggregate demand channel as
an explanation for slow credit growth. That is, it examines whether corporate debt or bank
NPAs are the constraint on credit growth or whether low demand and high interest rates
raised NPAs as well as reduced credit growth. Low interest rates and high growth are
internationally known as the best conditions to bring down debt. India had the opposite
conditions since 2011.
In order to address these questions we estimate the determinants of credit and of NPAs using
three types of data sets: a quarterly macroeconomic time series, a bank panel on advances and
NPAs and a firm level panel.
1Growth of bank credit was less than 15% pa since 2011 (compared to a peak of 30% pa over 2004-06) and fell
to a low of 10% in 2016 (Mundra 2016). Increase non-food bank credit was only 3.5 per cent in January 2017
and bank credit growth to industry actually became a negative 5.1 per cent (see
https://rbi.org.in/Scripts/BS_PressReleaseDisplay.aspx?prid=39692) 2 Although average corporate finance as a ratio of GDP was between 6-8 per cent of GDP in 2016, this was
much below a peak of almost 20 per cent in 2011. The 2 per cent from market borrowings (commercial paper,
corporate bonds and syndicated loans) was also below a peak of almost 6 per cent in 2011. In 2016 Another 2
per cent came from FDI and 2-4 per cent from bank credit. Net ECB was negative (IMF 2017 pp. 8). 3 Inflation due to commodity price shocks reduced demand as well as raised real product interest rates for
corporates. There was a gap between wholesale and consumer prices. From 2011 onward the real repo was
positive with respect to core wholesale price inflation (WPI), which captures product prices. It increased since
WPI fell, and from May 2014 became positive with respect to headline inflation CPI also, which the RBI began
to target. Fiscal-monetary tightening aggravated negative aggregate demand shocks from the international
slowdown.

2
The results suggest demand was and remains the key constraint for credit. Only demand
variables affected corporate credit for a broad set of firms—sales and inventory were the only
significant variables. Only for a subset of indebted firms in a difference-in-difference type
analysis, did lagged credit and assets reduce credit, even so sales remained the dominant
variable. From the bank panel gross NPAs did not have a negative effect on advances but the
RBI imposed Asset Quality Review (AQR) did have a strongly negative effect.
The bank panel showed NPAs fell with growth, increased with repo rates and with past
advances. Therefore, while high interest rates and low growth raised NPAs, so did past credit.
Other control variables including types of banks were not significant.
A macro exercise with quarterly NPAs was limited by only 42 observations. Quarterly NPAs
were found to rise with advances and call money rates, but fell with inflation. Dummy
variables for 2015-16 were positive and significant pointing to the AQR. But when a trend
was introduced it was strongly negative and left only advances as positive and significant
while inflation stayed negative and significant. The call money rate switched signs now
reducing NPAs. There were also features, such as inflation, tending to reduce NPAs.
The results suggest the past credit boom did contribute to NPAs, but macroeconomic
conditions, more than the debt accumulation constrained credit and output growth that could
have brought down the NPAs. An inherently sectoral debt problem was allowed to fester
since 2011. Absence of resolution in a high interest rate regime led to chronically stressed
assets with interest cover of less than 1 reaching about 33.5% of the aggregate loan portfolio
in 2016. High interest rates reduce demand as well as add to stress in assets. They raise
corporate debt especially in when revenue growth is low.
The slowdown in bank credit growth is urgent. Alternative sources of credit will take time to
mature, especially for small firms. It is unfortunate if a debt that is low by international
standards prevents India realizing its growth potential. In the 2003 slowdown some
accommodation as well as growth helped reduce NPAs. US banks, which were adequately
capitalized, did better post GFC than European banks where only cosmetic liquidity was
provided. The problems of Japanese banks were neglected in the seventies and have
contributed to the persistent stagnation since then.

3
The priority should be to revive assets and get credit flowing again. For this, apart from
easing macroeconomic conditions, NPAs have to be restructured as well as funds infused in
PSBs, to clear the swollen NPA backlog. The onus is on the government as the largest
shareholder. Finances are a problem, however, for a government on a fiscal consolidation
path and unwilling to reduce PSB shareholding. Moreover, the government wants to make
capitalists more accountable. Tax payers cannot be repeatedly asked to bear the burden of
corporate failure. Some infrastructure promoters had received large loans with very little own
equity at stake. Making funding conditional on better governance does build better incentives,
but such changes take time.
Various resolution mechanisms set up, in the absence of a pre-existing resolution regime, did
not work well. Strategic Debt Restructuring (SDR) allowed banks to convert their loans to
stressed firms into equity. Scheme for Sustainable Structuring of Stressed Assets (S4A)
allowed banks to bifurcate their debt to a stressed account into sustainable and unsustainable
portions. It was difficult to reach agreement in Joint Lenders Forum (JLFs) for large
infrastructure projects4. Given the small window for SDR it effectively resulted only in
postponing NPAs. The 5/25 refinance scheme was limited to infrastructure and core
industries. Moreover, it required banks to protect the NPV value of the loans refinanced,
making it difficult to make the business sustainable at the same time. Asset reconstruction
companies5 (ARCs) are thin, making valuation and asset transfer difficult. There was a fear
that potentially valuable assets would just get written off in the process. Hostile takeovers
may not work in the Indian context. Since laws were focused on foreclosure rather than
reconstruction unlocking asset value was difficult.
Many infrastructure assets stalled due to clearance delays or external price shocks were
potentially viable in Indian conditions. Bad banks, who take over weak assets, were
proposed but they did not work in the past—realizations were very poor. Issues of who will
take decisions, who will provide the funding, do not get resolved.
4In May 2017fresh lending has been allowed if a majority (60 per cent), rather than supermajority (75 per cent)
of creditors agree. 5ARCs seem to be deteriorating rather than improving as a resolution mechanism over time. Bad loans sold by
banks to ARCs halved from ₹50,000 crore over 2013-15, to ₹20,000 crore in 2015-16 and fell further to ₹15,000
crore in 2016-17 (http://www.thehindubusinessline.com/economy/sale-of-bad-loans-to-arcs-hit-for-2nd-year-
running/article9550779.ece?ref=relatedNews).

4
If an asset is recognized as an NPA, provisions must be made for possible losses. As accounts
become sub-standard PSBs used to lend just enough to prevent it becoming an NPA, but not
enough for the industry to revive. Extending and pretending avoids scrutiny and possible
witch-hunts by central agencies such as the CAG and the CBI, and protracted legal battles to
recover dues from promoters through our over-burdened legal system.
PSB managers subject to investigation from the CBI are reluctant to take decisions on exit or
on the haircuts required for restructuring—it is easier in a transferrable PSB job to leave the
decision to the next incumbent. Delays were also due to borrower-initiated court
interventions, under multiple laws and the inefficient Debt Recovery Tribunal (DRT).
Because restructuring and bankruptcy functioned poorly, banks stopped lending to companies
whose assets were declared to be NPAs. Without resolution, debt burdens rose. Private banks
tend to be faster to exit. They tend not to make high risk long-term infrastructure loans.
In May 2017 the government amended the RBI Act, giving powers to the RBI to direct banks
to take punitive action against individual accounts under the 2016 Indian Bankruptcy Code
(IBC). In June the RBI directed banks to send 12 large NPAs for resolution under the IBC,
with other NPAs to follow within six months, if not resolved. These amount to 25 per cent of
the Rs 7.11 lakh crore outstanding NPAs. This process enforces a valuable deadline for
banks. They have an incentive to reach agreement quickly, since they have to make 50 per
cent provisioning on assets that enter the IBC process. If resolution is not achieved within
180 days extendable to 270 months the asset will enter liquidation, and bank creditors are
unlikely to get much among multiple claims. The resolution process will, however, be able to
draw upon all earlier on-going schemes. The onus is on the Committee of Creditors to agree
on a resolution process within the IBC timeline, and for the courts to resist debtors’ delaying
tactics.
The IBC is untested and it is not known if it will be able to deliver. There are fears that the
takeover of a complex running firm by the insolvency professional may damage it and force a
shut down. She will again require credit from banks to keep activity going. The international
practice is to appoint an insolvency professional only for a non-functional asset.

5
Oversight committees are also set up that can decide on the haircuts, defusing fears of the
CBI. Banks should be able to build on on-going discussions in the JLF, for example, to reach
closure in the next few months. But funds will have to be found, and, our study suggests,
macroeconomic policy will have to be supportive and restructuring flexible for credit growth
to revive.
The structure of the paper is as follows: Section 2 presents some stylized facts; Section 3
gives a literature review; Section 4 discusses data and methodology; Section 5has the analysis
of estimation, before Section 6 concludes the paper with some policy implications.
2. Stylized facts
A major current global risk is the rise in EM corporate dollar debt. This grew from 1.7 trillion
dollars in 2008 to 4.3 trillion in 2015 as quantitative easing pumped up global liquidity.
China, Turkey, and some Latin American countries saw the largest rise. EM corporates are
vulnerable to rising international interest rates and dollar appreciation as the US Fed exits
from easing.
Talk of an Indian balance sheet problem tends to put Indian firms in the same basket. But
rather than excessive credit growth in this period of excess global liquidity, India actually
managed the opposite problem—too low a level and growth rate of credit. Calibrated
restrictions on foreign borrowing also limited the relative size of large Indian corporate
external debt. Indian private sector external debt only rose to $105 bn in 2014 from $59bn in
2008. In India the rise in debt may have been large in absolute terms but still low as a ratio to
GDP. But was there a credit boom before the GFC that created India’s corporate debt
problem?
The Bank of International Settlements releases quarterly data on international core debt ratios
to gross domestic product (GDP). A comparison of Indian ratios, and change in these ratios,
with different regions is startling. The ratio of Indian total credit to the non-financial private
sector was and remains far below the average for all economies and for EMs (Table 1).
Indian credit availability has never been excessive, despite double digit credit growth prior to
the GFC.

6
The Indian government borrows more, as a ratio to GDP, than other EMs, although much less
than AEs. But overall Indian debt ratios are much lower than all other countries. Corporates
and households borrow much less.
Moreover, the increase in Indian ratios of total debt, debt to government and to non-financial
corporations over 2011-15, a period of high global liquidity, was below the global increase.
The government was reducing its fiscal deficit and firms were borrowing little. For Indian
non-financial corporations, the ratio increased only by 0.3 compared to 29.4 for other EMs.
Debt is concentrated in large infrastructure firms, but even so average debt-equity ratios
remain at around unity since they are low for other firms. The pre 2008 credit boom,
therefore, was concentrated only in a few firms.
Table 1: Core debt ratios to GDP in Q3 2016
Total credit
to the non-
financial
sector
Credit to
government
Total credit
to the
private non-
financial
sector
Total credit
to households
Total credit
to non-
financial
corporations
Total bank
credit to
the private
non-
financial
sector
1 2 3 4 5 6
1 = 2 + 3 3 = 4 + 5
India 128.2
(3.4)
68.2
(1.9)
60
(1.4)
10.5
(1.2)
49.5
(0.3)
56.3
(1.7)
All economies 246.3
(-15.2)
82.6
(2.9)
156.7
(-11.1)
61.5
(-0.1)
95.2
(11.0)
91.4
(5.6)
Advanced
economies
279.2
(5.5)
103.1
(4.0)
165
(-0.6)
76.1
(-1.4)
88.9
(0.9)
89.1
(-4.2)
Emerging markets 190
(42.3)
47.5
(6.1)
142.5
(36.2)
36.6
(6.9)
105.9
(29.4)
107.6
(22.5)
Notes: 1.Core debt comprises debt securities, loans and currency and deposits in nominal values. 2. In USD at market exchange
rates. 3. Figures in brackets give the change in the ratio from 2011 to 2015.
Source: BIS (2017)
While there was some de-leveraging by AE households and banks, household bank credit and
market borrowings grew substantially in EMs. Non-bank financial intermediation (Column 3
– Column 6 for the term in brackets) increased by about 14 per cent of GDP since the crisis
for EMs. In India this was minuscule. Banks remain the dominant source of credit, so the
slow growth of bank credit is doubly worrying.

7
The all India commercial bank credit-deposit ratio fell to 70.6 per cent by end-December
2016 compared to 74.5 per cent a quarter earlier6. As Table 2 shows, the asset quality
problem affects only a part of the banking system and only a particular type of loan. NPAs
that stopped producing income are concentrated in public sector bank loans to large
corporates. The problem was therefore limited in size and funds required to restore health
were not excessive.
Even so, high interest rates in this period added to stress and debt since little fresh equity was
available. For over 3000 non-financial firms in the CMIE data base, debt grew at12.8 pa over
2011-2015. Firms were less able to service their interest burden. Loans rolled over to cover
interest payments grew even as asset values deteriorated. Interest coverage declined by over
25 per cent over 2011-2014 although it was a still healthy 3.5 times. It deteriorated more for
smaller firms. The share of chronically stressed firms with interest coverage ratio less than
unity reached 33.5 in 2016.
Table 2: Indian banks’ bad loans, deposit and credit growth
March
2015
March
2016
Sept 2016
Banks Gross
NPA/
Gross
advances
Deposit
growth
Gross
NPA/
Gross
advances
Deposit
growth
Stressed
advances
Gross
NPA/
Gross
advances
Deposit
growth
Credit
growth
Private
2.2 16.5 2.7 17.3 4.6 3.2 20 23.2
Foreign 3.2 15.0 4.2 13.2 4.4 4.1 18 4.8
Public 5.4 8.9 9.8 4.6 15.8 11.8 5.5 3.1
All
banks
4.6 10.7 7.8 7.6 12.3 9.1 9.2 7.8
Note: NPA: Non-performing assets; Stressed advances are ratios to total advances of gross NPAs plus
restructured standard advances.
Source: RBI (2016), Chapter 2.
The RBI introduced many schemes to encourage banks to restructure advances, but delays
continued recovery was taking too long, and loan and deposit growth in PSBs was the slowest
(Table 2).Their larger share of stressed assets was denting confidence in PSBs, even though
there was no run on banks, due to government backing, and assets were largely maintained.
6 https://www.rbi.org.in/Scripts/BS_PressReleaseDisplay.aspx?prid=39697

8
If asset sales or capital conservation are inadequate, infusion of new capital is required to
clean balance sheets and revive lending. The government, however, as part of its
Indradhanush restructuring plan for PSBs decided to provide only limited amounts
conditional on improvements in governance7. Even so, the RBI imposed asset quality review
in 2015. As a result NPAs jumped sharply in 2016 (Table 2). Between March and September
2016 the stressed advances ratio increased for more than 70 per cent of banks (RBI, 2016)8.
The banking system as a whole continued to be stable, however. Asset quality was weak only
in a part of the system, as Table 2 shows, and only a particular type of loan. NPAs were
concentrated in PSB loans to large corporates, in specific sectors. Non-priority sector loans
accounted for 65 per cent of NPLs in 2015, a switch from pre GFC when priority sector loans
were the majority. Diversity helped reduce overall risk, since private banks did well in this
period. Their market capitalization overtook that of listed public sector banks in 2011. They
also attracted more foreign investment.
PSBs have demonstrated the ability to compete effectively and earn profits in the past9. Their
post GFC problems were partly due to government pressure but also to errors of judgment
and to external shocks. PSBs were pushed to compensate for the winding up of development
banks and for thin bond markets. They came from a history of hand-holding large corporates
in order to encourage development. They did not foresee the governance and administrative
problems that delayed projects expected to be viable under high growth. Private sector banks
that focused on retail credit remained in good shape. Disincentives from taxpayer support are
not limited to PSBs since no large bank is allowed to fail for fear of systemic spillovers.
7Rs. bn 700 was to be provided from the budget over 2015-19 against a privately estimated requirement of Rs. bn 1800.
Apart from NPAs funds are also required for expanded capital requirements due to international accounting standards and
aspects of Basel III that are to apply in 2018. 8As on September 30, 2016, gross NPAs of public sector banks rose to Rs. 6.3 lakh crore from about 3lakh
crores in 2012. Including figures for restructured assets as well, the stressed assets in the banking system are
estimated to be in the range of Rs. 10 lakh crore. Of the estimated 4 lakh crore of provisioning about 3 lakh
crores was done, but bankers believe more is required to revive assets. 9Standardised versions of Basel-type prudential norms supplemented with broad pattern regulation were
implemented in the 1990s banking reforms. Although chosen because of skill limitations they turned out to have
good stability-enhancing incentives. The new philosophy of regulation, together with high growth and legal
reform that made debt recovery easier, led to NPA ratios falling to historic lows of 2.4 per cent in 2009-10 from
12.8 per cent in 1991. The public sector did unexpectedly well, and even overtook private banks on some
parameters. It also outperformed during and immediately after the GFC. Features such as high leverage, short-
term market-based funding, risky endogenous expansion of balance sheets, and exposure to cross-border risks,
which had led to massive bank failures in the West, were limited (Goyal 2014).

9
The problem has been allowed to fester too long, however, while banks were not spared fresh
blows. Extending and pretending in a high interest regime aggravated debt. PSBs are also
turning to retail lending. Alternative credit sources remain underdeveloped, and bank credit
fell sharply over 2011-16.For example, bank non-food credit growth rates fell from about 20
per cent to 8 per cent. Credit growth to industry actually was minus 1 per cent over May-July
2016. Structural reforms undertaken are inadequate or will be effective only in the long-term.
Valid shorter-term strategies for NPA resolution and recovery of credit growth are required.
3. Literature review
There is an exhaustive literature on non-performing loans, with causal factors ranging from
macroeconomic, to external shocks, past loans, credit standards, and bank specific factors.
Beck et al (2013) find macroeconomic factors, such as real GDP growth, exchange rate, share
prices and lending rates, as main determinants of NPAs. Further, external sector shocks and
capital market size also affect the size of NPAs.
The literature emphasizes that bank lending is excessive during boom periods compared to
recessionary times (Caruana, 2002). During upturns, banks get overoptimistic about
borrower’s investment project and their ability to repay their loans, fees and interest rates and
hence give more credit while lowering credit standards. Such lending practice increase NPAs
during downturns. Rajan (1994) emphasizes “herd behavior” among banks as a primary
reason for financing projects with negative NPV during expansions. Bank face strong
competition from peers to perform at par with them, which enhances lending during booms
that later turns out to be non-performing. Adrian and Shin (2010) provide empirical support
that asset price changes are reflected in net worth, which leads to banks’ balance. They tend
to search for new borrowers during credit booms and end up providing sub-prime loans,
which increase their NPAs during recession.
Berger and Udell (2003) empirically test the “institutional memory hypothesis” to explain
procyclicality of bank loans and non-performing loan losses. They show banks tend to have a
short memory of ‘credit busts’ during downturns. As time passes, they face similar incentives
of risk taking during booms and grant excess loans.

10
Collateral is also an important factor which drives credit cycles and risk taking by banks. In
general, credit cycles tend to be associated with asset price cycles. During asset price boom,
banks increase credit limits because valuation of underlying collateral goes up, setting in a
feedback mechanism (Kiyotaki and Moore 1997). In the process, banks provide excess loans
which later turn out as bad loans during a downturn in asset prices. Davis and Zhu (2004)
show credit cycles are largely driven by dynamic linkages among commercial property
prices, bank credit and the macroeconomy. Asea and Blomberg (1998) provide evidence that
probability of collateralization decreases during the expansions and increases during
contractions in the United States.
Keeton (1999) shows that higher loan losses can be attributed to increases in loan growth
provided that faster loan growth is caused mainly by shift in bank credit supply. Salas and
Saurina (2002) show poor credit risk management is an important determinant of problem
loans. Dell’ Ariccia and Marquez (2005) provide a theoretical explanation that the stronger
the credit expansion more likely is financial distress mainly due to lower credit standards.
Jimenez and Saurina (2006) provide empirical support for a positive relationship between
rapid growth and loan losses. They further show banks exercise easier credit standards
during boom times in terms of screening of borrowers and collateral requirements.
Ownership structure of banks also influences their risk taking behavior. Stockholder
controlled banks tend to take higher risk in bank lending compared to banks with manager
control (Saunders et. al 1990). De Bock and Demyanets (2012), using a sample of EMEs,
showed that lower growth rate, exchange rate depreciation, weaker debt inflows and weaker
terms of trade reduce private credit and deteriorate loan quality. They further show feedback
from the financial sector to the wider economy.
On similar lines, Skarica (2013) emphasizes role of economic slowdown, unemployment and
interest rates as important factors raising NPAs using panel of Eastern and central European
countries. Adverse macroeconomic factors generally accompany rising NPAs and it has
further feedback effect on macroeconomic performance of AEs (Nkusu 2011). Financial
market openness tends to reduce NPAs (Tanaskovic and Jandric (2015).Berger and DeYoung
(1997) shows lower cost efficiency and decrease in bank capital ratios increase NPAs, since
low-capitalized banks take more risk and end up having higher NPAs. Louzis et al. (2011)
found that higher non-interest income of banks relates to lower NPAs, however, size of the
bank does not affect the level of NPAs significantly. Higher level of NPA is also associated

11
with geographical concentration in a loan portfolio (Jimenez and Saurina 2006). They further
show collateralized loans to industry are more risky compared to households and positively
affect NPAs.
In the Indian context efficiently managed banks are found to have better loan quality (Das
and Ghosh (2007); Swamy (2012)). Rajan and Dhal (2003) found that expectation of higher
cost of credit tends to increase NPAs while maturity of credit, better credit culture and better
macroeconomic environment lower NPAs in the economy. Mishra and Dhal (2010) show
terms of credit, bank specific indicators, regulatory capital requirements and business cycle
shocks mainly influence level of NPAs in the Indian economy. Lokare (2014) emphasizes
that NPA growth is followed by credit growth with some lag. Growth slowdown, changes in
the lending rates, high inflation, falling asset prices, external macroeconomic environment,
non-priority sector lending and lax monitoring are some of important factors which
contributed to rising NPAs.
Reddy (2002) emphasizes that problem of NPA is mainly caused by legal complications and
time consuming nature of asset disposal process. Aggrawal and Mittal (2012) further show
that rising NPAs are mainly attributed to weak credit appraisal system, loose credit
management and monitoring, industrial slowdown, inefficient method to select borrowers and
lack of proper follow up. Large banks have better risk management procedures, which reduce
their NPA levels compared to smaller banks (Swamy 2012). Also private and foreign banks
are more efficient in credit management and reducing NPAs. They have faster exit.
The Indian literature has largely addressed the question of what determines NPAs. But there
is no rigourous study of the contribution of NPAs to the credit slowdown, although Indian
policy makers often make that attribution. The international literature that we survey above,
does find a credit boom reduces future credit. But credit growth and ratios in India have both
been low by international standards. Anusha (2016) finds in India credit follows but does not
lead the business cycle. Therefore determinants of credit are worth exploring in the Indian
context.
Acharya, Mishra and Prabhala (2016) try to distinguish between a bank lending (credit
supply) and a corporate distress (firm demand) channel by using outcome variation when the
cycle turned in 2012 with a database of 3000 firms. They find firms connected to weak banks

12
did better in an up cycle and worse in a down cycle suggesting the problem originates in the
bank lending channel, thus supporting the RBI’s AQR. They do not control for factors such
as that private banks did not lend to infrastructure firms, which were worst affected by
external price shocks and permission delays. They also do not test the effect of aggregate
demand against the bank lending channel.
5. Data and methodology
A corporate data base on indebtedness of 8,648 firms was sourced from Ace Equity, put
together by Accord Fintech Pvt ltd, and provided by CARE. It has all the components of the
balance sheet and profit and loss account. Hence on assets side there was data on gross fixed
assets, current assets and investments while on liabilities side there were borrowings, equity,
reserves, and current liabilities. The five year panel we use ends in 2015-16. Finance based
companies were excluded from the dataset. Firm specific variables such as sales, assets and
inventories, debt to capital employed, assets to sales, debt to asset ratio and turnover ratio
were developed. Credit as the dependent variable was defined as first difference of debt in
two successive period (t and t+1). We used 2014-15 as year dummy for asset quality review
conducted by RBI.
Bank statistical returns, available on the RBI website, provide the bank panel data. In this
bank panel, we use annual data on 51 banks for 2005-2015. Apart from information on gross
advances and NPAs, this provides bank specific variables such as capital adequacy ratios
(CAR) by type of banks. Macro demand variables such as GDP growth and repo rates,
inflation, industries growth, tourist arrivals, air travel were also largely obtained from the RBI
database as the data on quarterly NPAs.
We use dynamic panel GMM estimation model for the analysis of bank and firm level credit.
It controls for endogeneity of explanatory variables, commonly observed in macroeconomic
variables. Dynamic panel model is as following:
Yit = ∑αjYi, t-j + xit β1 + wit β1 + vi + εit i = 1. . . n; t = 1. . . Ti (1)
Where xit is vector of strictly exogenous variables, wit is vector of predetermined and
endogenous variables and vi are the panel-level effects.

13
Since dynamic panel GMM estimation is at first difference level, hence any fixed effect drops
out during the estimation. Fixed effects model was also estimated along with dynamic panel
for robustness. Fixed or random effects were used in lieu of bank or firm variables.
Insignificant variables were dropped. R was used for data cleaning and Stata for dynamic
panel and GMM estimation. The orthog command was used to minimize data loss.
6. Estimation
Credit
The first set of regressions have credit as the dependent variable measured as change in
firms’ indebtedness from the CARE dataset, regressed on lags, NPA ratios, fixed effects,
other firm specific variables such as such as sales, assets and inventories, macro demand
variables such as growth and repo rates. Credit as the dependent variable is defined as first
difference of debt in two successive period (t and t+1). Only sales, however, are found to be
positive and weakly significant for credit (Table 3, Column 1).
Table 3: Dynamic Panel for Firm Credit (GMM)
All firms Indebted firms
1 2
L. firm credit 0.10 (0.34) -0.46* (-2.31)
Growth rate -22.28 (-1.19)
L. Growth rate -6.79 (-1.72) 3.80 (0.16)
Sales 0.24* (2.50) 0.54** (2.58)
L. sales -0.22 (-1.77) 0.16 (0.75)
Assets 0.01 (0.84) 0.06 (0.78)
L. assets 0.01 (0.81) -0.21** (-3.09)
Observations 15546 1305
Sargan_overid_p 1.16e-64 7.00e-09
Hansen_overid_p 0.816 0.858
ABtest_AR1_p 0.0881 0.468
ABtest_AR2_p 0.374 0.359 Note: t statistics in parentheses; * p<0.05; ** p<0.01
Coefficients such as debt to capital employed, and assets to sales were not significant. This
specification was the best of various other specifications tried using different dependent

14
variables and controls. A few dependent variables tested were debt to asset ratio, debt to
capital employed etc. Controls such as turnover ratio remained insignificant.
Table 4: Firm Debt
Fixed effect (All
firms)
Fixed effect
(Subset of firms)
Fixed effect
(Interactive
dummy)
Pooled OLS
(Group dummy)
1 2 3 4
Growth rate -1.69 (-0.24) 5.92 (0.45) -0.549 (-0.08) -1.429 (-0.07)
Repo rate -9.74* (-2.07) 1.47 (0.17) -9.090 (-1.94) -12.65 (-0.88)
Inventories 1.26*** (56.91) 0.15*** (5.05) 1.299***
(54.12) 0.726***
(5.74)
Sales 0.06*** (23.75) 0.05*** (4.74) 0.0587***
(21.42) 0.103***
(5.97)
Year 2015 26.10 (1.39) -36.29 (-1.06) 26.43 (1.41) 32.10 (0.51)
Indebt_sales 0.251***
(12.53)
Indebt_invent -0.426***
(-6.96)
Indebt_indgrp 251.2***
(4.75)
Constant 220.6*** (6.92) -55.23 (-0.90) 189.5***
(5.94) 258.6***
(3.31)
Observations 27357 2245 27357 27357
Note: t statistics in parentheses ; * p<0.05, ** p<0.01, *** p<0.001
Next total debt was regressed as a function of repo and other control variables. In the fixed
effects regression, sales and inventories significantly increase firm debt, while the repo rate
weakly decreases it (Table 4, Column 1). A dummy for asset quality review is insignificant.
This implies that firms raised debt, taking more credit when sales rose, but a rise in repo rates
decreased credit, lowering debt.
Since only demand variables were significant for all firms, the regressions were repeated for
the subset of sectors where indebted firms are concentrated. There is large diversity among
corporates: Infrastructure, aviation, iron and steel, mining, and textiles are the sectors
contributing most of the NPAs. For a filtered corporate dataset of these indebted firms only
sales and inventories continue to raise credit in a fixed effect regression (Table 4, Column 2).
Interacting the sales and inventory variables with a dummy variable for the indebted firms in
a fixed effects regression for all firms shows a larger coefficient for sales, while inventories
become negative (Table 4, Column 3). Thus sales would allow even indebted firms to raise
more credit. A pooled OLS regression with a group dummy for the indebted firms shows debt

15
rising strongly for such firms pointing to the debt trap they are in. In a dynamic GMM panel
regression (Table 3, column 2) sales continue to be significant, but lagged credit weakly
reduces credit, as do lagged assets, since they are likely to be low. Thus past borrowing is a
constraint on credit only for indebted firms but even that is alleviated by assets held. Thus
past credit and debt related variables are significant only for indebted firms, while demand
variables help all firms increase credit. Coefficients are different for indebted firms, however.
Bank panel
Table 5: Dynamic Panel GMM Results
Gross advances Gross NPA
1 2
CAR 0.28* (2.03)
Grossnpa 6.09* (2.61)
L. Grossnpa 1.43*** (7.90)
L2. Grossnpa -0.88** (-3.25)
Gross advances 0.02** (3.12)
L1. Gross advances 0.74*** (5.84) -0.003 (-0.44)
Growth rate -18.23** (-3.27) 359.1 (1.83)
L1. Growth rate -340.1** (-2.95)
repo rate 6.80 (1.47) -412.1 (-1.27)
L1.repo rate 1574.9** (2.66)
Year_2015_dum (Ass~) -66.74* (-2.08)
N 497
Sargan_overid_p 5.35e-09 7.88e-11
Hansen_overid_p 1 0.997
ABtest_AR1_p 0.166 0.0239
ABtest_AR2_p 0.273 0.0755
Note: t statistics in parentheses ; * p<0.05 **p<0.01 ***p<0.001
We then turn to the bank panel. First, we repeat the credit analysis using bank advances as the
dependent variable (Table 5, column 1). Lagged advances actually increase advances as do
gross NPAs, rather than appearing as a constraint on lending. This may reflect ever greening,
as one way to get NPA ratios down is to increase credit. Perhaps that is why growth, whose
lagged value decreases NPAs (Table 5, Column 2), also mildly decreases advances. A
dummy for the 2015 asset quality review, which stopped such lending, is strongly negative.
16
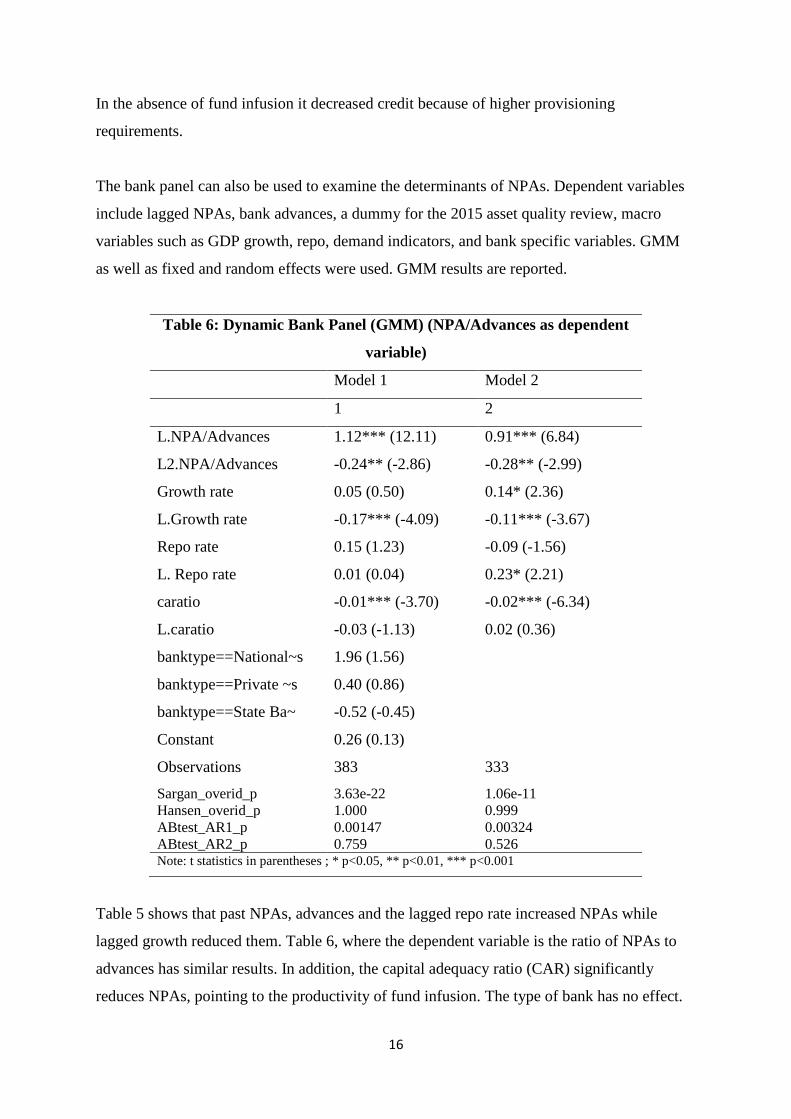
In the absence of fund infusion it decreased credit because of higher provisioning
requirements.
The bank panel can also be used to examine the determinants of NPAs. Dependent variables
include lagged NPAs, bank advances, a dummy for the 2015 asset quality review, macro
variables such as GDP growth, repo, demand indicators, and bank specific variables. GMM
as well as fixed and random effects were used. GMM results are reported.
Table 6: Dynamic Bank Panel (GMM) (NPA/Advances as dependent
variable)
Model 1 Model 2
1 2
L.NPA/Advances 1.12*** (12.11) 0.91*** (6.84)
L2.NPA/Advances -0.24** (-2.86) -0.28** (-2.99)
Growth rate 0.05 (0.50) 0.14* (2.36)
L.Growth rate -0.17*** (-4.09) -0.11*** (-3.67)
Repo rate 0.15 (1.23) -0.09 (-1.56)
L. Repo rate 0.01 (0.04) 0.23* (2.21)
caratio -0.01*** (-3.70) -0.02*** (-6.34)
L.caratio -0.03 (-1.13) 0.02 (0.36)
banktype==National~s 1.96 (1.56)
banktype==Private ~s 0.40 (0.86)
banktype==State Ba~ -0.52 (-0.45)
Constant 0.26 (0.13)
Observations 383 333
Sargan_overid_p 3.63e-22 1.06e-11
Hansen_overid_p 1.000 0.999
ABtest_AR1_p 0.00147 0.00324
ABtest_AR2_p 0.759 0.526 Note: t statistics in parentheses ; * p<0.05, ** p<0.01, *** p<0.001
Table 5 shows that past NPAs, advances and the lagged repo rate increased NPAs while
lagged growth reduced them. Table 6, where the dependent variable is the ratio of NPAs to
advances has similar results. In addition, the capital adequacy ratio (CAR) significantly
reduces NPAs, pointing to the productivity of fund infusion. The type of bank has no effect.

17
While the growth rate was significant, other demand variables such as core industries growth,
tourist arrivals, air travel were insignificant along with the 2015 year dummy variable. Hence
they were dropped. Interaction variables such as advances with repo were also statistically
insignificant. NPAs normalized by deposits were also used as the dependent variable with
similar results.
Macro time series
Table 7: NPA (for all banks)
Dependent variable (Gross NPA)
Gross advances 0.05*** (0.003)
GDP Growth rate 17.28 (22.06)
Repo rate 79.19*** (28.38)
WPI inflation -58.77*** (11.11)
qtr20150630 172.70 (215.001)
qtr20150930 184.61 (227.41)
qtr20151230 1,113.56*** (217.66)
qtr20160630 2,350.54*** (216.76)
qtr20160630 3,051.56*** (209.68)
Constant -864.63*** (304.61)
Observations 42
R2 0.99
Adjusted R2 0.98
Residual Std. Error (df = 32) 185.62
F Statistic (df = 9; 32) 254.58***
Note: ***p<0.01
The determinants of NPAs can also be examined with aggregate quarterly data. But there are
only 46 observations (2005Q1-2016Q1) in the dataset. Constructing time series models such
as ECM, VAR/VECM did not work given the small sample. GMM estimation also did not
converge due to the small sample.

18
A simple OLS regression (Table 7) had similar results as the bank panel, however. NPAs rose
with gross advances and the repo rate. They fell with inflation, however. Four quarterly
dummies for the year 2015 (of the asset quality review) significantly raised NPAs.
The regression can be spurious, however, since most of the variables such as NPA, advances,
repo rate, GDP growth rate are non-stationary. But there were no meaningful results after
making the variables stationary.
Table 8: Bank level NPA (GMM)
Model 1
Advances 0.16*** (5.70)
GDP growth rate 96.26* (2.08)
Trend -148.4*** (-3.73)
Inflation -101.9** (-3.24)
Constant -2066.2*** (-3.74)
Observations 42
Wald chi2(4) 414.99
R-squared 0.8690
Note: t statistics in parentheses ; * p<0.05, **
p<0.01, *** p<0.001
In a regression with a trend variable (Table 8), to control for any common trend, advances
continued to raise NPAs. But perhaps because the trend was strongly negative, growth
became weakly positive. Inflation continued to reduce NPAs. In the period of sharp rise in
NPAs, inflation had also fallen.
7. Conclusion
In answer to our question on the critical constraint on credit growth for firms, the analysis in
this paper supports the aggregate demand over the bank lending channel. It points towards
low demand rather than NPAs as the cause of slowdown in credit growth. Industrial demand
was squeezed ever since 2011 in a fight against inflation largely driven by supply shocks.
This aggravated NPAs as well as reduced credit growth.

19
High interest rates added to debt in the absence of revenue. Internationally high growth and
low real interest rates (high inflation) is most effective in bringing down debt. Indian policy
created opposite conditions with pro-cyclical tightening during a slump. Since NPAs are most
serious only in PSBs, and infrastructure firms, how can they be the cause of a general
slowdown in credit growth?
Adverse macroeconomic conditions and neglect of NPAs allowed a small problem to grow
large. Infusion of funds in PSBs is now essential. But the Indian tax payer has had to
subsidize government and private investment for too long. Earlier this was through loss
making PSUs and development banks whose loans were rarely repaid. The 1990s reform
closed some of these channels, and sought to bring in a larger role for market forces. But
private infrastructure investment was inadequate. So PSBs were persuaded to step in again
even though their short-term liabilities made them inappropriate to infrastructure lending.
India has been unable to solve the problem of making risk capital available for firms. Despite
25 years of liberalizing reform markets have not been able to replace banks as a source of
credit.
Reforms in credit culture must therefore accompany further infusion of taxpayer funds. But
proposed bank reforms, whether through Indradhanush, a bank holding company, bankruptcy
or asset recovery infrastructure will largely show results in the long-term. Alternative sources
of credit such as a vibrant corporate bond market will take time to mature and can never
wholly substitute for institutional lending. While ECBs, bonds, stocks are available to big
corporates, long gestation infrastructure, SMEs, agriculture will continue to require bank
credit. Bond markets do reduce risk with banks, but for less than AAA rated firms bank
warranties are required. FIIs demand larger spreads to cover EM risk premium.
Since the IBC has now been triggered, in the small window of time available before
liquidation has to take place, current restructuring schemes must be allowed to work with full
flexibility. Even as the stick of the liquidation deadline pushes banks towards resolution and
revival of assets the carrot of easier resolution must be made available, supported by easier
macroeconomic conditions. The loan loss provision on the unsustainable debt could be
amortised over a longer period as a measure of relief for the lending banks. The 5/25
refinance scheme could be dovetailed with the sustainable debt portion under S4A. The limit

20
of 50 per cent for sustainable debt under S4A could be flexibly decided by majority of
creditors. Lender/borrower needs could drive a flexible merging of schemes.
Once restructuring has taken place fresh loans by banks to stressed corporates, must be
classified as standard, to provoke the mind-set change required to aggressively revitalize
projects rather than just preventing them from becoming NPAs. The stigma attached to risk-
taking, failure and to stressed assets has to be removed. To incentivize banks to lend to
stressed assets that have established long term viability, fresh loans to stressed corporates,
after resolution, could be classified as standard. PSBs must also adopt a risk-based approach,
learn to identify and assess risk, so they lend to strong companies and let weak companies
die. In a country like India, however, where infrastructure is underprovided there will be
demand for most industries as growth revives.
The latest research (IMF-FSB-BIS 2016) on use of macro-prudential regulations recommends
relaxation especially where macro-prudential measures are binding on the provision of credit.
This supports flexibility in restructuring schemes.
In the long-run stronger boards and improved governance mechanisms in PSBs would ensure
that independent decisions are made on purely commercial grounds. Stricter credit appraisals
should use better information systems. Compensation packages, particularly grant of ESOPs,
could be aligned to performance and market levels, even as commercial decisions are
insulated from non-commercial investigating agencies.
Bankruptcy reforms will force promoters to share risk and potential losses while making it
easier to change management and allow equity infusion to keep viable businesses going.
Institutional finance plus professional management should emerge as an alternative to
promoter driven companies in infrastructure.
As long as structural change is in the right direction, and supply-side changes keep inflation
low, some monetary stimulus is feasible to revive demand. More loan based consumption
implies a higher demand elasticity of interest rates.

21
References
Acharya, V., Mishra, P. and N. R. Prabhala. (2016). The anatomy of a business cycle
presentation at The 2nd Moody’s, ICRA and NYU Stern Conference: August 3rd
.
Adrian, T., and Shin, H. S. (2010). Liquidity and leverage. Journal of Financial
Intermediation, 19(3), 418-437.
Aggarwal, S., and Mittal, P. (2012). Non-performing asset: Comparative position of public
and private sector banks in India. International Journal of Business and Management
Tomorrow, 2(1), 1-7.
Anusha. (2015). Leading macroeconomic indicators of India: Trend and cyclical analysis.
Ph.D thesis, IGIDR, Mumbai.
Asea, P. K., and Blomberg, B. (1998). Lending cycles. Journal of Econometrics, 83(1), 89-
128.
Beck, R., Jakubik, P., and Piloiu, A. (2013). Non-performing loans: What matters in addition
to the economic cycle? European Central Bank Working Paper Series No 1515, February.
Berger, A., and Udell, G. (2003). The institutional memory hypothesis and the procyclicality
of bank lending behavior. BIS Working Papers No125.
Berger, A. N., and DeYoung, R. (1997). Problem loans and cost efficiency in commercial
banks. Journal of Banking and Finance, 21(6), 849-870.
Das, A., and Ghosh, S. (2007). Determinants of credit risk in Indian state-owned banks: An
empirical investigation. Economic Issues, 12(2), 27-46, September.
Davis, E. P., and Zhu, H. (2011). Bank lending and commercial property cycles: Some cross-
country evidence. Journal of International Money and Finance, 30(1), 1-21.
De Bock, R., and Demyanets, M. A. (2012). Bank asset quality in emerging markets:
Determinants and spillovers (No. 12-71). International Monetary Fund.
Dell'Ariccia, G., and Garibaldi, P. (2005). Gross credit flows. The Review of Economic
Studies, 72(3), 665-685.
Goyal, A. (2014). ‘Banks, policy, and risks: How emerging markets differ.’ International
Journal of Public Policy, 10(1, 2, 3), 4-26.
IMF (International Monetary Fund). (2017). India: 2017 Article IV Consultation-Press
Release; Staff Report; and Statement by the Executive Director for India. Available at
https://www.imf.org/en/Publications/CR/Issues/2017/02/22/India-2017-Article-IV-
Consultation-Press-Release-Staff-Report-and-Statement-by-the-Executive-44670
IMF-FSB-BIS. (2016). Elements of effective macroprudential policies: Lessons from
international experience, August. Available at
https://www.imf.org/external/np/g20/pdf/2016/083116.pdf
22
Jimenez, G., Salas, V., and Saurina, J. (2006). Determinants of collateral. Journal of
Financial Economics, 81(2), 255-281.
Keeton, W. R. (1999). Does faster loan growth lead to higher loan losses? Economic Review,
84(2), 57-75. Federal Reserve Bank of Kansas City.
Kiyotaki, N., and Moore, J. (1997). Credit cycles. Journal of Political Economy, 105(2), 211-
248.
Lokare, S. M. (2014). Re-emerging stress in the asset quality of Indian banks: Macro-
financial linkages. Reserve Bank of India Working paper.
Louzis, D. P., Vouldis, A. T., and Metaxas, V. L. (2012). Macroeconomic and bank-specific
determinants of non-performing loans in Greece: A comparative study of mortgage, business
and consumer loan portfolios. Journal of Banking and Finance, 36(4), 1012-1027.
Misra, B. M., and Dhal, S. (2010). Pro-cyclical management of banks’ non-performing loans
by the Indian public sector banks. BIS Asian Research Papers.
Mundra, S. S. (2016). Setting the priorities right. Keynote Address at the 3rd SBI Banking
and Economics Conclave in Mumbai on September 28, 2016. Available at
https://www.rbi.org.in/scripts/BS_SpeechesView.aspx?Id=1027 (Accessed on October 20,
2016).
Nkusu, M. (2011). Nonperforming loans and macro financial vulnerabilities in advanced
economies. IMF working papers no WP/11/161. Available at
https://www.imf.org/external/pubs/ft/wp/2011/wp11161.pdf
Rajan, R. G. (1994). Why bank credit policies fluctuate: A theory and some evidence. The
Quarterly Journal of Economics, 109(2), 399-441.
Rajan, R., and Dhal, S. C. (2003). Non-performing loans and terms of credit of public sector
banks in India: An empirical assessment. Reserve Bank of India Occasional Papers, 24(3),
81-121.
RBI (Reserve Bank of India). (2016). Financial stability report December 2016. Available at
https://rbi.org.in/Scripts/PublicationReportDetails.aspx?UrlPage=&ID=865
Reddy, Y. V. (2002). Public sector banks and the governance challenge: Indian experience.
BIS Review, 25, 2002.
Salas, V., and Saurina, J. (2002). Credit risk in two institutional regimes: Spanish commercial
and savings banks. Journal of Financial Services Research, 22(3), 203-224.
Skarica, B. (2014). Determinants of non-performing loans in Central and Eastern European
countries. Financial Theory and Practice, 38(1), 37-59.
Swamy, V. (2012). Financial instability, uncertainty and banks’ lending behaviour. The
International Journal of Banking and Finance, 9 (4), 74-95

23
Tanasković, S., and Jandrić, M. (2015).Macroeconomic and institutional determinants of non-
performing loans. Journal of Central Banking Theory and Practice, 4(1), 47-62.