Slides -- 2 of 4 (Supply Chain, Smarter Planet)
22
© 2009 IBM Corporation Smarter Supply Chain: Intelligence Through Advanced Analytics Tory Johnson – Director, Power Systems, System x and RSS Integrated Supply Chain Fulfillment Engineering 17 September 2009
-
Upload
thesupplychainniche -
Category
Documents
-
view
1.050 -
download
0
description
Transcript of Slides -- 2 of 4 (Supply Chain, Smarter Planet)
© 2009 IBM Corporation
Smarter Supply Chain: Intelligence Through Advanced Analytics
Tory Johnson – Director, Power Systems, System x and RSS
Integrated Supply Chain Fulfillment Engineering
17 September 2009

© 2009 IBM Corporation
MN Quality Seminar
Agenda
A Smarter World – Driving the Need for a Smarter Supply Chain
Enabling a Smarter Supply Chain through the Process Excellence Initiative
– Integrated Supply Chain Engineering Transformation
– Examples of Innovation Opportunities
Closing Remarks

© 2009 IBM Corporation
MN Quality Seminar
40 - 70 percent of electrical energy is lost due to inefficiencies in the grid.
In one small business district in Los Angeles alone, cars burned 47,000 gallons of gasoline just looking for parking.
Consumer products and retail industries lose about $40 billion annually due to inefficient supply chains.
In a world where 820 million people are undernourished, $48 billion worth of food is thrown away each year in the US.
Our healthcare “system” can’t link from diagnosis to drug discovery, providers, insurers, employers and patients.
Financial markets spread risk but can’t track it; this has led to undermined confidence and uncertainty.
3
The World is Getting Smarter: Because it Must

© 2009 IBM Corporation
MN Quality Seminar
Supply chains continue to become more global and complex...
Going GlobalProduct Portfolio
Turmoil
Between 1995 and 2007, foreign subsidiaries nearly tripled, from 265,000 to 790,000
Increased Network Complexities
3X
Transnational companiesmore than doubled, from 38,000 to 79,0001
2X
Nearly 80% of executives expect number of collaborative relationshipswith third parties to increase2
80%
Between 2007 and 2010, R&D outsourcing is forecast to increase by 65%
65%
Engineering services and product-design projects are forecast to increase by 80%3
80%
• In consumer products industry, production introductions increased by 17% in 2006, more than double the 2005 rate4
• Portfolio rationalization is eliminating SKUs almost as fast
17%
Businesses and supply chains are becoming more global over the last decade
Supply chains are involving more companies
Supply chains must contend with rapidly expanding and
contracting portfolios
IBM wanted to gain insight into the challenges facing supply chain executives around the world… to learn what strategies and initiatives they are undertaking.
400 Supply Chain Executives World-wide
25 Countries0 5 10 15 20 25 30 35 40 45
Utilities (e.g., gas & electric)
Government and public services
Aerospace and defense
Telecommunications
Transportation and logistics
Life sciences / pharmaceuticals
Chemicals and petroleum
Food, beverages and tobacco
Automotive
Consumer products / wholesale
Industrial products
Electronics
Retail
Number of Respondents
400 Supply Chain Executives World-wide
29 Industries

© 2009 IBM Corporation
MN Quality Seminar
Global Chief Supply Chain Officer Study 2009
Cost ContainmentRapid, constant change is significantly affecting this traditional area of strength and the ability of supply chain executives to adapt.
VisibilityFaced with more information than ever, supply chain executives still struggle to “see” and act on the right information.
RiskCFOs are not the only senior executives urgently concerned about risk; risk management also ranks high on the supply chain agenda.
Customer IntimacyDespite demand-driven mantras, companies are better connected to their suppliers than their customers.
GlobalizationContrary to initial rationale, globalization has proven to be more about revenue growth than cost savings.

© 2009 IBM Corporation
MN Quality Seminar
Three Characteristics of a Smarter Supply Chain
Interconnected
Intelligent
Automated Transactions & Smart Devices
• Use of sensors, actuators, RFID, & smart devices to automate transactions: inventory location, replenishment detection, transportation locations & bottlenecks
• Supports real-time data collection & transparency from POS to manufacturing to raw material
• Predict and Act through alert warning systems
Optimized Flows
• ERP to ERP to ERP system integration across the network. Standardized data and processes.
• Collaborative decision making through decision support and business intelligence – starting with the customer
• Risk management programs for integrated financial controls with operational performance – monitored and measured
Networked Planning, Execution & Decision Analysis
• Simulation models to evaluate trade-offs of cost, time, quality, service and carbon and other criteria
• Probability-based risk assessment & predictive analysis
• Networked planning/execution with optimized forecasts & decision support
Instrumented

© 2009 IBM Corporation
MN Quality Seminar
Automobile mileage range Google PowerMeter
“If you bought this, then…”Alert: airline arrival, library, weather, etc.
Dynamic pricing: based on inventory levels, predicted demand, pattern recognition, weather forecast
Improving crisis response time via global connections
A Smarter Supply Chain: Synergies & Cognitive ModelsGlobalization and growing supply chain interdependence have introduced a heightened level of information, volatility, complexity and uncertainty that is unlikely to subside. This new environment demands a different kind of supply chain – a much smarter one.
Intersection of smarter dimensions opens opportunities for innovation
Cost Containment
Visibility
Risk
Customer Intimacy
Globalization
Interconnected IntelligentInstrumented

© 2009 IBM Corporation
MN Quality Seminar
ISC Engineering: Enabling a Smarter Supply Chain
Customer and Business requirements mandate the need for a Smarter Supply Chain
The Integrated Supply Chain (ISC) Engineering team has made a strategic investment in providing the tools and training needed to enable the Smarter Supply Chain Strategy
– Defining projects to target customer defined gaps and inhibitors, while balancing with strategic goals and financial value to the business
– Developing the capability for process-led execution to deliver business results through a standardized approach which supports a data driven culture of decision making
– Enabling employees and process owners to develop skills and competencies needed in order to positively impact their customers and the business
Interconnected IntelligentInstrumented

© 2009 IBM Corporation
MN Quality Seminar
Integrated Supply Chain (ISC) Engineering - Process Excellence
ISC Engineering owns a Lean Six Sigma Green Belt curriculum designed specifically for the engineering community. This curriculum is delivered via in-class training by our own internal Black Belts and Master Black Belts.
IBM ISC Engineering drives a globally integrated Design for Six Sigma (DFSS) and Lean Six Sigma (LSS) program in conjunction with IBM Process Excellence.
Both DFSS and LSS are leveraged for innovation and transformation to achieve Product and Process Excellence benefits and improvements.
This globally integrated effort minimizes cost to correct quality and reliability problems, and achieves a trained, skilled, and active work force with involvement at all levels of process execution.

© 2009 IBM Corporation
MN Quality Seminar
Lean Six Sigma vs. Design for Six Sigma
Management philosophy implementedover past years
Common Roadmap (DMAIC)
Cost Reduction / Waste Elimination
Focus on variability reduction and defect elimination
Improving original design of product
Streamline production/business Transactional environment
DOE for reducing variations in process
Focusing on root cause analysis/corrective actions
Lean Six Sigma Design for Six Sigma
Next level of efficiency
No Common Roadmap(IDOV, DMEDI, DMADV, …)
Cost Avoidance
Elimination of Errors during designof new Product/Process
Robust Design optimizing performance
Designing Quality into product
Starts early in design cycle
Focusing on preventing errors
Both LSS and DFSS are needed to solve business problems

© 2009 IBM Corporation
MN Quality Seminar
Six Sigma and Lean Sigma – Complimentary Methodologies for Combined Lean Six Sigma
Lean Methodology“As-Is Flow” “To-Be Flow”
Increase efficiency Simplify work flows
Focus on high-value steps Eliminate waste
A Lean enterprise is one that delivers value to its
stakeholders with little or no wasteful consumption of
resources.
Product or Service Output
Critical Customer Requirement
Defects: Service unacceptable to
customer
B A
Product or Service Output
Critical Customer Requirement
Defects: Service unacceptable to
customer
B A
Product or Service Outputs
Six SigmaTM Methodologies
Increase consistency Reduce variation Eliminate defects
In a Six Sigma enterprise, everyone is focused on identifying
and eliminating defects.
Customer Driven Customer Driven
LeanSix
Sigma

© 2009 IBM Corporation
MN Quality Seminar
ISC Engineering: Lean Six Sigma Training and Tools
0
2
4
6
8
10
12
14
0 5 10 15
Data set
Fitted Equation
DOE,DOE, RegressionRegression
Control Charts /
SPC
Pareto Analysis
Cause & Effect Diagram
FMEAFMEA
SIPOC Diagram
Kano Analysis
Project Charters
Value Stream Map
Process Capability Study
Hypothesis Analysis
DMAIC
Define Project Opportunity
Introduction to program & methodology Introduction to Lean Six Sigma & DMAIC VOC (Voice of Customer) Lean Sigma
Measure Process Performance
Statistical Basics – Probability, Hypothesis Testing and ANOVA
Analyze Improvement Opportunity
Measurement Systems Analysis – Gage R&R, Attribute Agreement Analysis, Baselines, Failure Modes & Effect Analysis
Improve Process Performance
Design of Experiments Solution Selection & Piloting
Implement Control Strategies
Implementing Statistical Process Control & Acceptance Sampling

© 2009 IBM Corporation
MN Quality Seminar
Green Belt Lean Six Sigma Certification Process
Candidate nominated for IBM LSS Training
Class Project selected prior to the start of training
Successful completion of IBM approved
project
Attend the full 5 day training
session
Training onproper tool
use
Candidatedemonstrates
competency via Toll Gates
Follow-on Projects• Yield Improvement• Scrap reduction• Process optimization• Waste Reduction• Defect prevention
Review Board reviews results and certifies
Green Belt
Successful completion of
Green Belt exam
Track project and record
benefits
• Standard WW training curriculum• “Common language” for improving processes
• Training delivered by IBM Master Black Belts / Black Belts• >700 of the ISC Engineering Team is Green Belt certified
• Representing 3 Geographies and 12 Countries• 15 WW Suppliers participating in collaborative projects
© 2009 IBM Corporation
MN Quality Seminar
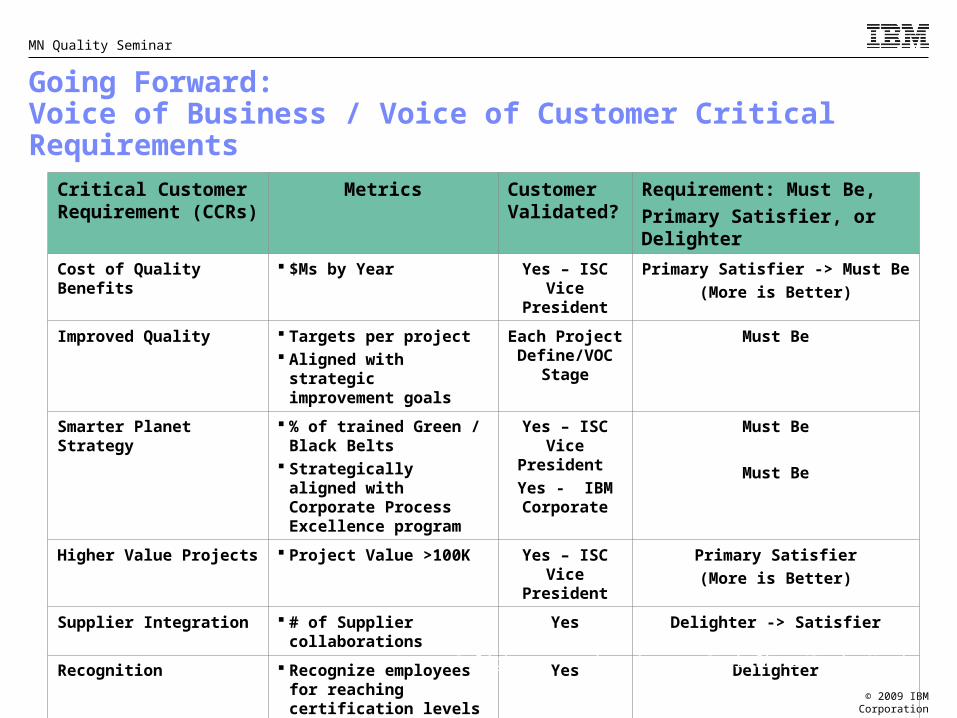
Going Forward: Voice of Business / Voice of Customer Critical Requirements
Critical Customer Requirement (CCRs)
Metrics Customer Validated?
Requirement: Must Be,
Primary Satisfier, or Delighter
Cost of Quality Benefits $Ms by Year Yes – ISC Vice President
Primary Satisfier -> Must Be
(More is Better)
Improved Quality Targets per project Aligned with strategic
improvement goals
Each Project Define/VOC
Stage
Must Be
Smarter Planet Strategy % of trained Green / Black Belts
Strategically aligned with Corporate Process Excellence program
Yes – ISC Vice President
Yes - IBM Corporate
Must Be
Must Be
Higher Value Projects Project Value >100K Yes – ISC Vice President
Primary Satisfier
(More is Better)
Supplier Integration # of Supplier collaborations
Yes Delighter -> Satisfier
Recognition Recognize employees for reaching certification levels and delivery of project results
Yes Delighter
Delighters tend to become Satisfiers/Basic Needs Over Time

© 2009 IBM Corporation
MN Quality Seminar
From Pilot to Ongoing Transformation
Steady growth in project benefits from concept through 2009– Stage 1: Establish Methodology Foundation – Stage 2: Build Capability through Project Experience– Stage 3: Responsive and Adaptive Organization focused on customer feedback
100X Training Return on Investment
Integrated Leadership and Management System – WW Black Belts meet on monthly basis and share results– WW Black Belts’ annual commitment includes training/coaching Green Belts and
leadership of a committed number of projects
Multi-year business transformation that requires persistence
Examples of innovation opportunities linked to the program– “Green” Packaging Optimization– Digitized Fulfillment– Intelligent Early Warning System (EWS) across the Supply Chain

© 2009 IBM Corporation
MN Quality Seminar
Packaging OptimizationBusiness Problem:
Currently, 3 to 4 different sets of packaging material are used across the supply chain – from chassis supplier through product shipment to the End Customers or Business Partners
Chassis supplier ships 5 units to Fabrication supplier
IBM ships final assembly in single packs to End Customer or Business Partner
Current Process
Fabrication supplier discards packaging
Completes assembly operation and ships units to IBM, 4 per package
Standardized DOX Project Methodology Applied through Analyze Phase: Project Charter outlined the business problem, project objectives, costs & benefits SIPOC analysis performed As-is process mapping Key Stakeholder Analysis & Management Plan defined Voice of Customer – Voice of Business – Critical to Quality analysis Established baseline and target metrics
Define Measure ControlImplementAnalyze

© 2009 IBM Corporation
MN Quality Seminar
Packaging Optimization
Opportunity: Implementation of a process to reuse bulk packaging, multiple times, throughout the supply chain
Upon completion of assembly, Fabrication supplier re-uses packaging & ships units to IBM, 6 per package
Future Process IBM bulk ships
to Business Partners
OR
IBM ships final assembly in single packs to End Customer
Chassis supplier ships 6 units to Fabrication supplier
Projected Results: 77% Reduction in Packaging Costs 13% reduction in Shipping Costs Elimination of approximately 100 tons of packaging entering the waste stream

© 2009 IBM Corporation
MN Quality Seminar
Digitized Fulfillment
Mixing Digitized Fulfillment withMixing Digitized Fulfillment withPhysical ManufacturingPhysical Manufacturing
New possibilities for digitized fulfillment with multiple delivery mechanisms
Reduce existing customer pain
Reduce IBM’s Carbon Footprint
The Business ChallengeThe Business Challenge
Heritage of “required” hardcopy information Legal, Safety, User Experience
Mixed Fulfillment controlling physical and digital content
Configured Orders – each order is customized, unique
Digitization that makes sense to the customer
We design and ship “Green” products but….We design and ship “Green” products but…. we can further improve the “Green” we can further improve the “Green”
customer experiencecustomer experience
Your Web
IBM Web
CD/DVD
USB
Build or SelectDigitized
Output forDigital PNs
Organizefor consistent
CustomerExperience
ConversionServices / Libraries(e.g. setup guides)
UIPatterns
Customer Order
Systems
Manufacturing Execution Systems
AssemblyProcess
Merge/ValidateDigital ActionsAnd Physical
Assembly
Part No. Description QTY97P2372 Bracket 221P4437 Screws 821P4491 300 GB DRIVE. 121621381 Safety Insert 11621842 OS SW key 100G126807H665517P771622R1128
Classify Parts
Digital or Physical
Assembly?
PhysicalAssembly
Digitized Fulfillment
CustomerShipment
Potential Benefits from “Green” InvestmentPotential Benefits from “Green” Investment
Define Measure ControlImplementAnalyze

© 2009 IBM Corporation
MN Quality Seminar
Intelligent Early Warning System
What Needs to ChangeWhat Needs to Change
IBM Supply ChainIBM Supply Chain
The nature of SPC / Rate Based management is reactiveUnable to predict what “MAY” occur in the future Does not rank warnings to focus on potential emerging issuesNeed a “smarter” infrastructure to predict defect trends before evidence is available
Business ChallengeBusiness Challenge
Rapid detection of emerging defectsTrue problems vs. false alarmsManage complexity of the data through intelligent infrastructure
Mitigate volume variation through measures that account for variation
Supply Chain
Sav
ing
s
Supplier Mfg Field
Traditional Quality ManagementTraditional Quality ManagementStatistical Process Control (SPC) or Rate BasedStatistical Process Control (SPC) or Rate Based
SPC Control Charting
Cumulative Evidence
Cu
mu
lati
ve
Def
ec
ts
Typical :• Set control limits • Apply statistical monitoring
“Out of Control” when Cumulative Defects reach statistical significance
Business Implication :• Late and Reactive• % of Defects have escaped
SPC Control Charting
Cumulative Evidence
Cu
mu
lati
ve
Def
ec
ts
Alternative : • Reduce Control Limits
Business Implication :• Earlier identification• Overflow of false alarms• Inability to find the real control
issues
Time
Time
“Shewhart control charts”
“Out of Control” when Cumulative Defects reach “LESS” statistical significance
IBM Hardware EnvironmentIBM Hardware Environment7 hardware brands245 world wide suppliersConfigurable products Volumes highly skewed to end of quarter / year
20 manufacturing facilities> 70,000 unique part numbersDistributed Global Supply Chain
Define Measure ControlImplementAnalyze

© 2009 IBM Corporation
MN Quality Seminar
Intelligent Early Warning SystemNew ApproachNew Approach
Intelligent EWS InfrastructureIntelligent EWS InfrastructureApply multiple SPC / Control Methods at the same time
Classic Shewhart/SPC charting, Actual vs. Target Rates, Predictive “Cumulative Sum”
Intelligence to weight & apply methods most appropriate for the point in time in the defect lifecycle
Why Cumulative Sum (CUSUM)?Why Cumulative Sum (CUSUM)?Non-traditional method : “Cumulative plot” summarized against a hypothesis that the process level is acceptable
Efficient in detecting small shiftsDetects shifts that Shewhart cannotWorks well with varied sample sizes Predicts Future defects !
Why Not Only CUSUM?Why Not Only CUSUM?Ineffective during catastrophic events Can miss wide variations that repeat over multiple periodsIneffective at managing recovery
BenefitsBenefits
Early Supply Chain Detection
Tangible project savings and improved customer sat
Reduction in Carbon Footprint
Auto-determines lifecycle “phase” Determines weighting / priority of
each measure Prioritizes most likely alarms
Customized per Part Number Over 70,000 Active Measures
Intelligent EW SystemIntelligent EW System
Defect LifecycleDefect Lifecycle
Emerging RecoveringContain
CUSUM
Actual vs Target
CUSUM
Actual vs Target
Shewhart SPC
# D
efec
ts
Define and Weight MethodsDefine and Weight Methods
“Intelligence in the Engine”
““New Phase” New Phase” Predicts defect trends before Predicts defect trends before cumulative evidence is availablecumulative evidence is available
Shewhart SPCActual vs.
TargetCUSUM
Subtle ShiftWeek 30
StatisticallyOut of Control
Week 37Poor
Performance
Prediction of Future Problem
at Week 30Dashboard
Predictive Example
Saved 7 Weeksof defect containment !!!
Cumulative Evidence
Time
Cu
mu
lati
veD
efec
ts
Rate basedSPC
Define Measure ControlImplementAnalyze

© 2009 IBM Corporation
MN Quality Seminar
Closing Remarks
Supply chains continue to become more global and complex
Strategic investment and senior leader commitment are key to enabling a process-lead, data-driven culture
Predictive analysis and evaluation of business trade-offs is fundamental to an “Intelligent” Supply Chain
– Leveraging disciplined methodologies such as LSS / DFSS drive innovative solutions which provide customer value, aligned with strategic business goals
– Enabling employees with a standard methodology and tool set, across the global supply chain – not only builds employee morale through skill growth - but further leverages the capability of a globally integrated effort that rapidly responds to the need to transform and to be “smarter”
Interconnected IntelligentInstrumented

© 2009 IBM Corporation
Minnesota Council for Quality: Lean Six Sigma Forum
17 September 2009