Siza matters for EFA - create-rpc.org · Consortium for Research on Educational Access, Transitions...
70
Consortium for Research on Educational Access, Transitions and Equity Size Matters for EFA Angela W. Little CREATE PATHWAYS TO ACCESS Research Monograph No 26 April 2008 Institute of Education University of London
Transcript of Siza matters for EFA - create-rpc.org · Consortium for Research on Educational Access, Transitions...

Consortium for Research on Educational Access, Transitions and Equity
Size Matters for EFA
Angela W. Little
CREATE PATHWAYS TO ACCESS
Research Monograph No 26
April 2008
Institute of Education University of London

The Consortium for Educational Access, Transitions and Equity (CREATE) is a Research Programme Consortium supported by the UK Department for International Development (DFID). Its purpose is to undertake research designed to improve access to basic education in developing countries. It seeks to achieve this through generating new knowledge and encouraging its application through effective communication and dissemination to national and international development agencies, national governments, education and development professionals, non-government organisations and other interested stakeholders. Access to basic education lies at the heart of development. Lack of educational access, and securely acquired knowledge and skill, is both a part of the definition of poverty, and a means for its diminution. Sustained access to meaningful learning that has value is critical to long term improvements in productivity, the reduction of inter-generational cycles of poverty, demographic transition, preventive health care, the empowerment of women, and reductions in inequality.
The CREATE partners
CREATE is developing its research collaboratively with partners in Sub-Saharan Africa and South Asia. The lead partner of CREATE is the Centre for International Education at the University of Sussex. The partners are:
The Centre for International Education, University of Sussex: Professor Keith M Lewin (Director)
The Institute of Education and Development, BRAC University, Dhaka, Bangladesh: Dr Manzoor Ahmed The National University of Educational Planning and Administration, Delhi, India: Professor R Govinda
The Education Policy Unit, University of the Witwatersrand, South Africa: Dr Shireen Motala The Universities of Education at Winneba and Cape Coast, Ghana: Professor Jerome Djangmah
The Institute of Education, University of London: Professor Angela W Little
Disclaimer
The research on which this paper is based was commissioned by the Consortium for Research on Educational Access, Transitions and Equity (CREATE http://www.create-rpc.org). CREATE is funded by the UK Department for International Development (DFID) for the benefit of developing countries and is coordinated from the Centre for International Education, University of Sussex. The views expressed are those of the author(s) and not necessarily those of DFID, the Institute of Education or the CREATE Team. Copyright © CREATE 2008 ISBN: 0-901881-26-0
Address for correspondence: CREATE, Centre for International Education, Sussex School of Education, University of Sussex, Falmer, Brighton BN1 9QQ, United Kingdom Tel: + 44 (0) 1273 678464 Fax: + 44 (0) 1273 877534 Author email: [email protected] Website: http://www.create-rpc.org Email [email protected] Please contact CREATE using the details above if you require a hard copy of this publication.
Size Matters for EFA
Angela W. Little
CREATE PATHWAYS TO ACCESS Research Monograph No 26
April 2008

ii
Contents
Acknowledgements........................................................................................................v Preface...........................................................................................................................vi Summary ......................................................................................................................vii 1. Introduction................................................................................................................1 2. School Size Worldwide..............................................................................................4
2.1 Sub Saharan African Countries............................................................................6 2.2 South Asian Countries .........................................................................................8 2.3 OECD Countries ................................................................................................14 2.4 Section Summary ...............................................................................................16
3. Does School Size Matter?........................................................................................17 3.1 School Size and Achievement: Cross-national Analyses ..................................17 3.2 School Size and Costs........................................................................................19 3.3 School Size and Social Equity ...........................................................................24
4. School Size as a Policy ‘Issue’ ................................................................................26 4.1 England ..............................................................................................................26 4.2 United States of America ...................................................................................30
4.2.1 Small Schools in Rural Areas in the USA ..................................................32 4.3 Is School Size a Policy ‘Issue’ in India?............................................................32
5. Learning and Teaching in Small, Multigrade Schools Worldwide..........................35 5.1 Avoidance of Multigrade in Small Schools .......................................................36 5.2 Quasi-Monograde in Small Schools ..................................................................37 5.3 Differentiation in Small Schools........................................................................37 5.4 Learning Outcomes............................................................................................39
6. Does Class Size Matter? ..........................................................................................43 6.1 Research on Class Size in Developed Countries ...............................................43 6.2 Research on Class Size in Developing Countries ..............................................47
7. Implications for CREATE .......................................................................................49 References....................................................................................................................52
List of Tables
Table 1 Estimates of Numbers of Primary School-age Children Learning in Multigrade Settings, 2005..........................................................................................5
Table 2 Percentage Distribution of Schools by Enrolment 2005-2006 School Year, India ...........................................................................................................................9
Table 3 Percentage of Single-teacher Schools by School Category, 2005-6, India ....11 Table 4 Schools Distributed by Teachers, India ..........................................................12 Table 5 Number of Schools by Size of Student Population, Sri Lanka, 1997 and 2005
..................................................................................................................................13 Table 6 Average Size of Public Elementary and Secondary Schools, USA................15 Table 7 Percentage Distribution of Effect of Key Resources on Student Performance,
Based on 376 Production Function Estimates, USA ...............................................44 Table 8 Percentage of Estimated Expenditure Parameter Co-efficients from 96 Studies
of Educational Production Functions in Developing Countries ..............................48

iii
List of Figures
Figure 1 Distribution of Pupils by Size of Primary Schools, Ten African Countries, 2005/2006 School Year..............................................................................................6
Figure 2 Percentage of Primary Schools with ≤ 50 pupils in 2005-2006, India.........10 Figure 3 Percentage of Schools by Student Population, Sri Lanka, 1980-2002 ..........13 Figure 4 School Size and Instruction Costs per Pupil..................................................20 Figure 5 Opportunities Afforded to Small Schools and their Implications for the
CREATE Zones of Exclusion..................................................................................24

iv
List of Acronyms
BRAC Bangladesh Rural Advancement Committee
COMMS Community and School Studies (CREATE)
CREATE Consortium for Research on Educational Access, Transitions
and Equity
DISE District Information System for Education (India)
EDI Education for All Development Index
EFA Education for All
EGS Education Guarantee Scheme (India)
EMIS Education Management Information System
HMI Her Majesty’s Inspectors of Schools (UK)
INSET In-Service Training
LEA Local Education Authority (UK)
LMS Local Management of Schools (UK)
NCF National Curriculum Framework (UK)
NGO Non-Governmental Organisation
OECD Organisation for Economic Co-operation and Development
OFSTED Office for Standards In Education (UK)
PTR Pupil Teacher Ratio
TIMMS Trends in Mathematics and Science Studies
UIS UNESCO Institute of Statistics
UNESCO United Nations Education, Scientific and Cultural Organisation

v
Acknowledgements
I am grateful for the support of various colleagues who have contributed to the production of this monograph. Caine Rolleston, CREATE researcher at the Institute of Education, University of London identified relevant literature and data sets. Albert Motivans of UNESCO’s Institute of Statistics provided the data and analysis for Figure 1. Chris Berry and Manjula Vithanapthirana, former researchers on the Institute of Education research programme on Learning and Teaching in Multigrade Settings, provided annotations of research on small schools in England and India respectively. I am also grateful for comments on earlier drafts from Nicole Blum, Geeta Kingdon and Caine Rolleston.

vi
Preface
This research monograph explores different aspects of size and their implications for access. Size does matter not least because extending access to the ‘last 20%’ in many low income countries will mean reaching out to new groups of children, some of whom will be in low population density areas. This will be an issue at lower secondary levels as well as primary, especially where national guidelines seek to ensure that schools are available within 3-5 km of households. The review notes that small schools often, but not always, have higher costs than those closer to average size. Where they do have higher costs, imaginative use of multigrade patterns of learning and teaching can mitigate unsustainable costs. The review also notes that school size does not map directly on to class size, though often in systems with monograde pedagogy there is a relationship. Class size clearly does matter where it is excessive, but it may not be the most important determinant of meaningful learning across a range of class sizes. This is important because class size is related to pupil:teacher ratios through class:teacher ratios. Taken together these determine how much learning time children experience at what cost. At least in some systems it may be that class size is less important for learning time than the number of days lost to disruption, irregular attendance, teacher absenteeism, and poor pedagogical practices. CREATE welcomes this discussion of issues that are critical to expanded access that is affordable. More than this, the discussion is a reminder that policy dialogue benefits from evidence on the demonstrable effects of school and class size on access and learning, and that analysis of size is a central issue for effective planning and rational resource allocation. Professor Keith Lewin Director of CREATE

vii
Summary
This monograph reviews literature on school and class size for its relevance to the concerns of CREATE. It estimates the numbers of small schools and numbers of children learning in small schools worldwide. It assesses the implications of school size, large and small, for learning outcomes, costs and for social equity. It outlines how policy ‘issues’ of size, large and small, are constructed and presented in a range of education systems. It identifies the curriculum, teaching and learning issues associated with small schools and examples of good practice and discusses the evidence on learning outcomes in small, multigrade schools. It synthesises the research on class size, large and small, in developed and developing countries, and identifies its relevance for EFA Goals 2, 5 and 6. Finally, the monograph draws implications for on-going and future CREATE studies, in particular the Community and School studies in Bangladesh, Ghana and India.

1. Introduction
CREATE is concerned with issues of access to and exclusion from basic education in South Asia and Sub-Saharan Africa. Issues of geographical accessibility are high on the list of barriers to education. Where these barriers are overcome, schools with low enrolments arise, both in the government and the non-government sectors. An early review of small schools by Bray (1987) identified cost-effective strategies for rural school provision. Small schools have many advantages. Because they are sited within reach of local communities they may be able to respond to local needs and conditions better than larger schools sited outside communities and to which children have to travel large distances. At the same time smaller schools face myriad problems, including difficulties in recruiting teachers and often incur higher unit costs. However, as Little (2006) has pointed out, if it were not for small schools, millions of the world’s children would not be in school at all. This equity consideration is crucial for CREATE and its concern with access for all to education. Running alongside the issue of school size are those of system size and class size. All three units of educational delivery influence the experience of learners at the heart of the Education for All movement. Shortly after the World Conference on Education for All (EFA), held in Jomtien, Thailand in 1990, the heads of the nine most populous developing countries in the world – Bangladesh, Brazil, China, Egypt, India, Indonesia, Mexico, Nigeria and Pakistan – launched the E-9 initiative. All nine face high population growth, one of the main obstacles to the achievement of EFA in general and universal enrolment in primary and basic education in particular, because it places enormous strain on infrastructure and resources. In 2000 the combined population of these nine countries was 3.2 billion people, about half of the world’s total population. Around 40% of the world’s out-of-school children and 70% of the world’s illiterate adults live in these nine countries. At the other extreme of system size are small countries and small systems of education such as those in the Caribbean and Pacific regions (Crossley and Holmes, 1999). These face different types of delivery issues. While they do not generally experience the resource constraints imposed by high population growth rates, the provision of higher education is limited by enrolments and costs, and the provision of support services such as examination systems and specialised training benefit from resource-sharing between countries. The Dakar EFA goals are wide–ranging. They are:
Goal 1 Expanding and improving comprehensive early child care and education, especially for the most vulnerable and disadvantaged children.
Goal 2 Ensuring that by 2015 all children, particularly girls, children in difficult circumstances and those belonging to ethnic minorities, have access to and are able to complete primary education that is free, compulsory and of good quality.

Size matters for EFA
2
Goal 3 Ensuring that the learning needs of all young people and adults are met through equitable access to appropriate learning and life-skills programmes.
Goal 4 Achieving a 50% improvement in levels of adult literacy by 2015, especially for women, and equitable access to basic and continuing education for all adults.
Goal 5 Eliminating gender disparities in primary and secondary education by 2005, and achieving gender equality in education by 2015, with a focus on ensuring girls’ full and equal access to and achievement in basic education of good quality.
Goal 6 Improving all aspects of the quality of education and ensuring excellence of all so that recognised and measurable learning outcomes are achieved by all, especially in literacy, numeracy and essential life skills.
The concerns of the CREATE consortium focus largely on Goals 2, 5 and 6 and these are the goals implied in the title of this monograph Size Matters for EFA. This monograph focuses on issues posed by school and class size rather than system size. A range of work, often involving case studies, exists on the difficulties faced by small schools in the developing country context, including such issues as ‘multigrade’ teaching and learning. A review of these studies will be included in this monograph. In the context of developed countries, a more extensive literature exists on the efficiency and effectiveness of schools according to size, including quantitative studies which focus on ‘optimum school size’ and the relationship between school size and pupil level variables such as attainment, particularly for OECD countries. Some of the literature points to considerable advantages of smaller schools and smaller classes. However, the conclusions of studies of both school and class size conducted in OECD countries should not be translated to developing countries, or indeed to other OECD countries. As we shall see, variances in school size, and especially variance in class size, in OECD countries are of a quite different order from those found in many developing countries. ‘Large’ and ‘small’ are relative to the system under consideration. In CREATE Pathways to Access Research Monograph No 1, Lewin (2007) sets out what we know about those excluded from primary and secondary schooling in Sub Sahara Africa and South Asia. To date, CREATE has identified seven important ‘zones of exclusion’. In summary these are:
Zone 0 children who are excluded from pre-schooling
Zone 1 children who have never been to school, and are unlikely to attend school
Zone 2 children who enter primary schooling, but who drop out before completing the primary cycle
Zone 3 children who enter primary schooling and are enrolled but are ‘at risk’ of dropping out before completion as a result of irregular attendance, low achievement, and silent exclusion from worthwhile learning

Size matters for EFA
3
Zone 4 children who fail to make the transition to secondary school grades
Zone 5 children who enter secondary schooling but who drop out before completing the cycle
Zone 6 children who enter secondary schooling and are enrolled but are ‘at risk’ of dropping out before completion as a result of irregular attendance, low achievement and silent exclusion from worthwhile learning
To date we have little evidence on the effect, if any, of the size of school on patterns of access in systems which remain some distance away from the achievement of EFA Goa1s 2, 5 and 6. However, we might assume, a priori, that in areas where there has been neither a pre-school nor a primary school hitherto (Zones 0 and 1), such provision is likely to cater for small numbers of students initially. We might also assume that in areas of low population density, where distances between schools are great and transportation absent, that small institutions will be common. Conversely, in areas of high population density where parents can choose to which school they send their children there will be a tendency for popular schools to become very large with very large classes. In areas of low population density secondary school provision is also likely to cater to small numbers. We have no evidence of whether dropout from primary (Zones 2 and 3) and low transition to secondary (Zone 4) is affected by membership of a very large or very small school or of very large or very small classes. Similarly, we have no evidence of whether dropout from secondary (Zone 5) and being at risk of dropout from secondary (Zone 6) is affected by membership of a very large or very small school or a very large or very small class. This monograph has six objectives, which are to:
• Estimate the numbers of small schools and number of children learning in small schools worldwide
• Assess the implications of school size, large and small, for learning outcomes, costs and equity
• Outline how the policy ‘issue’ of size, large and small, is constructed and presented in a range of education systems
• Identify the curriculum, teaching and learning issues associated with small schools, and examples of good practice
• Synthesise the research on class size, large and small, in developed and developing countries, and identify its relevance for EFA Goals 2, 5 and 6
• Draw implications for on-going and future CREATE studies

Size matters for EFA
4
2. School Size Worldwide
Small and large schools pose different sets of challenges for teachers. Small enrolments are generally associated with small numbers of teachers. Where there are few teachers, sometimes only one, the burdens of lesson planning and teaching increase. Teachers become responsible for learners in two or more curriculum grades at the same time. This is termed multigrade teaching. Large enrolments, on the other hand, may lead to more teachers but also very large class sizes. For millions of children worldwide the only type of schooling to which they will gain access, if they gain access at all, will be small and multigrade. Economically and socially disadvantaged areas support disproportionate numbers of multigrade schools. Areas experiencing conflict and civil strife offer limited learning opportunities for children and, where they do, the arrangements are often small-scale and multigrade. In many disadvantaged areas, whether a school is large or small, multigrade or monograde is not the main policy issue. Rather, it is whether there is a school at all (Little, 1995 and 2001). Aikman and el Haj (2006) suggest that 15-25 million nomadic and pastoralist children are ‘out of school’ worldwide. To the extent that these children have a chance of any schooling at all, their school is likely to be small, mobile and multigrade. Little (2006) underlined the scale of the quantitative challenge if access to primary education is achieved. Based on 2000 figures she estimated that, if UPE was to be achieved, some 218.6 million children would be likely to be learning in small school and multigrade settings in developing countries in any one year in the foreseeable future. This figure represented 42% of all primary school–age children in the developing world. A more recent estimate is offered below in Table 1. It is based on the same two assumptions used in the earlier estimate. The first is that 30% of children worldwide and in developing countries are enrolled in de facto multigrade schools. De facto multigrade refers to schools where there are fewer teachers than grades. Schools organize classes and timetables in varying ways in the light of this constraint. Such schools are not necessarily labelled as multigrade schools; nor do they necessarily adopt a positive multigrade pedagogy. The figure of 30% is a conservative estimate. The second assumption is that if EFA Goal 2 is to be achieved then all out-of-school children should be in school; and that if they were in school then 50% would likely be learning in multigrade settings. This slightly higher percentage is based on the assumption that out-of-school children are more likely to be living in disadvantaged areas where multigrade is more likely to be the norm. Using figures for 2005 published in the EFA Global Monitoring Report 2008 (UNESCO, 2007), the most recent estimates are that if EFA goal 2 had been achieved in 2005 then 242.45 million children worldwide would have been learning in a de facto multigrade setting. The figure for developing countries would have been 216.65 million. The achievement of EFA Goal 2 is not a major challenge in communities where large urban and rural schools offer learning opportunities to middle-class children. It is not, in most developing countries, a huge challenge for medium-sized schools organised on age-graded lines with reasonable class sizes, regularly attending teachers and learning resources. Children in these schools are supported by the system of education, by households and by communities. The greater challenge here is for improvements in

Size matters for EFA
5
the quality of education in line with EFA Goal 6. The greater challenge for EFA goal 2 is posed by those children and communities the system does not reach. These include communities where large numbers of children are out-of-school and where schools are unavailable: and communities served by small and multigrade schools and a curriculum structure and teacher training system designed for monograde schooling. Table 1 Estimates of Numbers of Primary School-age Children Learning in Multigrade Settings, 2005 Enrolled Enrolled in de
facto multigrade
settings
Out-of-school
If enrolled, numbers
learning in de facto
multigrade settings
Total
Worldwide 688.3 m 206.4 m 72.1 m 36.05 m 242.45 m
Developing Countries 607.5 m 182.25 m 68.8 m 34.4 m 216.65 m
Source: calculations based on Little (2006); latest figures from UNESCO (2007) Hitherto, the CREATE model works with a general notion of ‘school’. The term is used in its most general sense to apply to provision by a wide range of providers – formal and non formal. Figures relating to ‘school’ enrolment, including patterns by wealth and gender, are usually based on information provided by national ministries of education or household surveys. Information from national ministries in particular is based on schools within the purview of the respective national ministry. While this set of ‘schools’ will often include private schools, large numbers of providers can be left out, leading to under-reporting of both schools and enrolments. For example, in Bangladesh the total number of institutions recorded as offering primary education in 2003/2004 was 82,868 (Ahmed et al, 2007). However these official statistics exclude more than 30,000 one-room, one-teacher schools offering primary education and run by non-governmental organisations. While this type of measurement error faces research on all aspects of access to education, it poses an additional problem for research on the effects of small schools on access, since many of the providers overlooked in official statistics are providing education in very small centres/institutions/schools. Other measurement issues stem from the structure of household survey questions wherein household representatives are asked about the school attendance of their children but never about the size of school attended. Moreover, the meaning of ‘school’ in local culture and language may signal a particular type of school. Attendance at a small, non-formal education centre which offers a range of learning opportunities may not be considered an appropriate answer to a question about schooling by parents. Again this can lead to under-reporting. Conversely, information on enrolment, whether under- or over-reported, gives little indication of what CREATE terms ‘meaningful access’ since this requires a learner to be attending school and participating in the teaching and learning process, not simply to appear as a name on an enrolment register. Secondary data on school size in terms of the number of pupils, teachers or classrooms is not readily available in publicly accessible literature on developing

Size matters for EFA
6
countries. Some Ministries of Education collect data on school size, frequently through an Education Management and Information System (EMIS). The UNESCO Institute of Statistics (UIS) does not routinely collect and publish information about school size. EMIS projects frequently involve extensive public reporting of data. For example, the South African Department of Education publishes a detailed statistical yearbook which reports the EMIS findings but does not provide information on the distribution of school size. Like the South African Department, The Ghanaian Ministry reports data from the EMIS relating to the number of schools and of pupils by district and region which can be used to show that the average school size is much larger in some areas than in others. But it does not provide information about the numbers and percentages of schools of particular sizes. Consequently, analysis of school size will most often require access to the original census or survey data files. Despite the absence of information about small schools worldwide it is possible to begin to build a picture by using a wide range of information collated from various sources. This is presented below for selected countries in three regional groups.
2.1 Sub Saharan African Countries
UIS does not routinely collect and publish information about size of schools. However, it works closely with national ministries of education and can, in some cases, provide information. Figure 1 was produced by Albert Motivans and colleagues, on request from CREATE, and indicates the percentage distribution of pupils by size of primary schools during the 2005/2006 school year in ten African countries. Figure 1 Distribution of Pupils by Size of Primary Schools, Ten African Countries, 2005/2006 School Year
4 6 7 10 14 18 19 26
413
1626 24
28 2536
38
2228
5759
49 42
43 35
38 26
30 20
25 14 1315
810
4 7
45 46
5 5 9 6 123 4
11
3
1
0
10
20
30
40
50
60
70
80
90
100
Ugand
a
Ethiop
iaBen
inGha
na
Burkina
Faso Mali
Guinea
Seneg
alNige
r
Maurita
nia
% o
f pup
ils b
y si
ze o
f sch
oo
500+300-499100-29950-990-49
Source: UIS and national education ministries

Size matters for EFA
7
In Figure 1 school size is divided into five groups: 0-49 pupils 50-99 pupils 100-299 pupils 300-499 pupils 500+ pupils The percentages of pupils studying in small and large schools vary enormously in these ten countries. In Uganda and Ethiopia for example, only 1% of pupils are enrolled in very small schools, i.e. those with less than 50 pupils. By contrast, in Senegal, Niger and Mauritania, 18%, 19% and 26% of pupils respectively are enrolled in very small schools. For schools with less than 100 pupils enrolled, the figures are even more striking. These vary from just 4% and 5% in Uganda and Ethiopia to 42%, 43%, 55% and 64% in Guinea, Senegal, Niger and Mauritania respectively. Conversely, some countries have large numbers of large schools. In Uganda and Ethiopia, 45% and 46% of all pupils are enrolled in schools with enrolments more than 500 respectively, while in Senegal, Mali and Guinea the figures are 12%, 9% and 6% respectively. In Benin, Ghana, Burkina-Faso, Niger and Mauritania 5% or less of all pupils are enrolled in schools with more than 500 students enrolled. Several of the countries with the highest proportions of small schools fall at the bottom end of the Education For All Development Index (EDI), a composite of universal primary education, adult literacy, the survival rate to grade 5 and gender parity (UNESCO, 2007). Niger, Burkina Faso, Mali, Guinea, and Benin form five of the bottom six countries on the EDI index. The correlation is not perfect however, since Ethiopia is also ranked seventh from the bottom. But it is suggestive that many, if not most, of the countries at the lower end of the EDI index have systems with large numbers of very small schools (UNESCO, 2007). A correlation between low enrolment and high proportion of small schools does not indicate causation. The causal relationship between the two is likely to be two-way. Schools are small because of low enrolments, but enrolments in the country as a whole are low because of the low supply and capacity of schools. Other evidence on small schools can be generated from estimates of numbers of teachers and pupils in multigrade schools. The majority of multigrade schools are those in which classes need to be combined because enrolments are small. They arise through necessity in areas with, mostly, low population densities. While not a perfect measure of small size, the existence of a multigrade school usually indicates small numbers of teachers and fewer teachers than grades. Even more importantly, the number of multigrade schools indicate the scale of the curriculum, learning and teaching challenges faced by teachers and learners in them. Information on the extent of multigrade teaching for some African countries is presented below:
• In Burkina Faso in 2000, 36% of schools and 20 % of classes were multigrade; 18% of children studied in multigrade classes (Little, 2006a).
• In Mauritania in 2002/2003, 39% of all pupils were educated in a multigrade class; 82% of these pupils attended schools in rural areas (Little, 2006a).

Size matters for EFA
8
• In Ghana in 2000/2001, 5.3% of schools had only one or no trained teacher; in the Northern region this was as high as 15.3% (Akyeampong, 2006).
South Africa In South Africa the learner:educator ratio (L:E) may be used as an indicator of size of school since smaller schools tend to have lower L:E ratios. The L:E ratio refers to the number of pupils per teacher at the level of the school, not class. Because teachers perform a range of duties outside the class, the L:E ratio is usually a higher figure than the average class size in a school. In the South African report quoted below the term small school refers to a school in which the average class group size is less than 30. Using this definition, a school with only one class could have 50 pupils and not be considered small in principle. By the same principle, a school with 12 grades and 100 pupils would be considered small.
The percentage of primary schools that can be regarded as ‘small’, varies from 80% in the case of the Free State to 10% in the case of Gauteng. The provincial average L:E ratio varies from a high of 36.7 (KwaZulu-Natal) to 27.2 (North West). The L:E ratio for small schools only is always somewhat lower than that for the province as a whole. This is because the 1998 post provisioning policy favours small schools somewhat… the overall L:E ratio does not appear to be strongly linked to the fiscal advantage enjoyed by the province. The Western Cape, for instance, is an advantaged province, yet its overall L:E ratio is higher than that of the Eastern Cape. Secondly, the L:E ratio for small schools varies considerably between provinces, from 20.6 to 30.2, and this despite the fact that all are using the same post provisioning model… All this begs the question of what is optimal… it is also important … to engage in research that can inform the teacher utilisation debates in the country (South African Department of Education, 2003).
2.2 South Asian Countries
India India’s Education Management Information System is extremely well established and produces a large amount of publicly available data which includes indicative statistics on school size. Known as DISE (District Information System for Education), the system holds school census information by district, including data on the percentage of schools providing elementary education by enrolment size and on the percentage of single teacher schools. Table 2 shows the distribution of schools offering elementary education by enrolment size in 2005-2006. Elementary is defined as education up to 14 years of age, and offered in the primary grades (1-5) and the upper primary grades (6-8). Table 2 indicates that children receive elementary education in schools which span different grade ranges. Pupils receive primary (Grades 1-5) in schools offering:
• Grades 1-5 only (primary-only), • Grades 1-8 only (primary with upper primary) • Grades 1-8 plus Grades 9-10 or 9-12 (primary with upper primary and
secondary/higher secondary).

Size matters for EFA
9
The upper primary cycle of education is offered in the last two of these schools and also in schools offering Grades 6-8 only (upper primary) and schools offering Grades 6-8 with Grades 9-10 or 9-12 (upper primary and secondary/higher secondary). The majority of schools offering elementary education are primary-only schools. In 2005, 66.8% of schools offered primary-only and 17.3% offered primary with upper primary. Much smaller percentages offered other combinations of grades. In 2005-2006, 56% of all primary only schools had 100 or fewer pupils. The figure for all schools offering the primary and/or upper primary grades, including those with upper primary, secondary and higher secondary grades, was 46%. Only 5.5% of primary-only schools and 11.01% of all schools had enrolments of more than 300. Table 2 also presents comparative figures over time. The percentage of all schools with 100 or fewer pupils decreased between 2002-2003 and 2003-2004 from 42.89% to 42.39%, but since then has increased to 44.37% in 2004-2005 and 45.62% in 2005-2006. In part this increase may be due to programmes such as the Education Guarantee Scheme (EGS) which aims to expand schooling to the most difficult areas and to keep these schools open (Govinda et al, 2007). It may also be due to the improved coverage of the DISE survey over time or a combination of both. Table 2 Percentage Distribution of Schools by Enrolment 2005-2006 School Year, India
Source: DISE Analytical Report 2005-2006 Table 2 also shows the extremely high percentages of very small schools, i.e. schools with 1-25 and 26-50 pupils enrolled. Over a quarter (28.12%) of primary schools (Grades 1-5) had enrolments of 50 or fewer students. Such is the scale of the school system in India that these percentages translate into extremely large numbers of schools. The total number of primary-only schools recorded in 2005-2006 was 738,150. The number of primary-only schools with 50 or less pupils enrolled was 207,568, while the number of primary schools with 100 or less pupils enrolled was 415,357. To put this into perspective for readers more familiar with the English system of education, where primary-only schools are the norm: the number of primary-only schools in India is 42 times the number of all primary schools in England. The number of primary-only schools with 50 or less pupils in India is almost

Size matters for EFA
10
twelve times the number of all primary schools in England. The number of primary-only schools with 100 or less pupils is almost 24 times the number of all primary schools in England. Even in Indian schools offering Grades 6-8 only, the proportion of schools with enrolments of fewer than 100 is, at 45.6%, almost half. The proportion of schools offering Grades 6-8 and the secondary grades with fewer than 100 pupils is lower, at 18.6%, but still substantial. The high percentage of small schools offering post primary education indicates that the issue of school size is not confined to the primary grades. State-specific data show extremely wide variations in the percentages of small schools and one-teacher schools. Figure 2 shows the percentage of primary schools with 50 or fewer students in 29 Indian states. In eight states more than half of all schools have enrolments of 50 or fewer pupils. These include the mountainous North Eastern states of Arunanchal Pradesh, Meghalaya and Sikkim; the mountainous Northern states of Himachal Pradesh, Jammu and Kashmir, and Uttaranchal; and the Southern and Western states of Karnataka and Maharashtra. Figure 2 Percentage of Primary Schools with ≤ 50 pupils in 2005-2006, India
Source: DISE Analytical Report, 2005-2006 Table 3 shows the percentage of schools with a single teacher by school category and by state.

Size matters for EFA
11
Table 3 Percentage of Single-teacher Schools by School Category, 2005-6, India
Source: DISE Analytical Report, 2005-2006 Across all schools offering elementary education, 12.17% have only one teacher. In primary-only schools this figure is 16.58%. These single teachers are responsible for delivering five grades of the national curriculum and must, of necessity, teach more than one grade within the same timetabled period. When percentages are translated into numbers the figures are staggering. For primary-only schools, the number with only one teacher available to teach all five grades was 122,385. The figure for all schools offering elementary education is 136,692. The challenge of curriculum delivery is not confined to single-teacher schools. The National Curriculum in India is predicated on single grade teaching. At a minimum, five teachers are necessary to deliver a five-grade curriculum in a school offering Grades 1-5. Where the number of teachers is smaller than the number of grades some teachers will be responsible for more than one grade within the same timetabled period in any school day. The majority of schools offering elementary education have three or fewer teachers. Table 4 indicates that in the country as a whole 76.32% of all primary-only schools have three or fewer teachers. In rural areas the figure is 79.11% and in urban areas 47.4%. Even in schools offering primary and upper primary there are often fewer than three teachers. In all schools which offer elementary education, the proportion having three teachers or less is a staggering 58.74%. India is a very large system of small schools. The percentages and numbers of small schools among those which offer only the primary grades are extremely high. In these and also in those schools which offer both upper primary and secondary grades with small numbers of teachers, the major challenge inside the multigrade classroom is one of pedagogy and quality viz: the delivery of a curriculum designed for the monograde school, where there is at least one teacher per grade. We return to this point later in the paper.

Size matters for EFA
12
Table 4 Schools Distributed by Teachers, India
Source: DISE Analytical Report, 2005-2006 Sri Lanka The Sri Lankan Ministry of Education provides fairly comprehensive data on school size, though not at the same level of detail as in India. In 1997 there were 10,120 primary and secondary schools country-wide. Of these, 12.3% had enrolments of less than 50, and 26.3% had enrolments of less than 100. Among ‘type 3’ schools, i.e. schools with enrolments from Grades 1-5 or Grades 1-8, these percentages were much higher. In 1997, nearly 30% of type 3 schools had enrolments of less than 50 while almost 60% enrolled less than 100 (School Census, 1997, Sri Lanka). The percentage of schools with small enrolments has increased over time. Figure 3 shows the proportion of government schools by student population between 1980 and 2002. In 1980 19% of all schools had 100 or fewer students. By 1993 this had increased to 23.3% and by 2002 to 27.4%. Concomitantly, the proportion of large schools, i.e. those with more than 2000 enrolled, had increased from 0.9% in 1980 to 2.7% by 2000, while those with between 1001 and 2000 enrolled also increased, from 5.1% to 7.3%. These trends have been described as a polarisation of the system in which the numbers of schools at both ends of the size spectrum have increased. Increasing numbers of very large schools are concentrated in urban areas and increasing numbers of small schools are concentrated in rural areas (Kataoka, 2006; World Bank, 2005).

Size matters for EFA
13
Figure 3 Percentage of Schools by Student Population, Sri Lanka, 1980-2002
6.4 7.5 7.7 7.6 10.5 12.4 13.0 13.8
14.6 15.6 14.1 13.312.8
13.9 13.5 13.6
5.1 6.0 7.1 7.7 7.5 7.2 7.3 7.3
0.9 1.0 1.3 1.6 1.8 2.2 2.9 2.7
0%
20%
40%
60%
80%
100%
1980 1984 1987 1990 1993 1997 2000 2002
>2001
1001-2000
501-1000
201-500
101-200
51-100
1-50
Source: Kataoka (2006) based on School Census data, relevant years. Between 1997 and 2005 the process of polarization of very small and very large schools continued (Table 5). While the total number of schools covering Grades 1-13 had declined from 10,120 to 9,723, largely as a result of system restructuring, the percentages of very small and very large schools increased. In 1997 26.3% of schools enrolled 100 or fewer children. By 2005 this had risen to 29.7%. In 1997 2.9% of schools enrolled more than 2000 children. By 2005 this had risen to 2.9%. Table 5 Number of Schools by Size of Student Population, Sri Lanka, 1997 and 2005 Size of school 1997 % 2005 % <50 1253 12.4 1528 15.751-100 1409 13.9 1358 14.0101-200 1959 19.4 1981 20.4210-500 2920 28.8 2539 26.1501-1000 1632 16.1 1336 13.71001-1500 534 5.3 495 5.11501-2000 193 1.9 207 2.12001-2500 98 1.0 117 1.22501-3000 53 0.5 74 0.83001-350 36 0.4 38 0.4>3500 34 0.3 50 0.5Total 10,120 100.00 9,723 100.0Source: School Census, 1997 and 2005, Ministry of Education, Sri Lanka

Size matters for EFA
14
2.3 OECD Countries
England In England in January 2006, the number of government maintained primary schools was 17,504 and of maintained secondary schools 3,367. The number of schools with enrolments of 100 pupils or less was 2,586, representing almost 15% of all primary schools. Among secondary schools, less than 1% had 200 pupils or fewer. In some local authorities between 40% and 50% of all schools had fewer than 100 pupils. These were Northumberland (68), Cumbria (122) and North Yorkshire (150) (Teachernet, 2007a). Of the 2,586 small primary schools, around 650 are classified as ‘very small’ with fewer than 50 pupils. The average size of all schools varies by local authority. In metropolitan (largely urban) local authorities the average size of (all) schools varies from 160-345. In local authorities that serve counties which include rural and urban areas, the variation is from 140-240. Most small schools are in local authority areas where over 50% of the schools are rural (Teachernet, 2007b). Finland Finland is a sparsely populated country with only 15-17 inhabitants per kilometre. In 2000, 1,279 out of 4985, some 26% of schools, were classified as multigrade schools. These schools are small, usually enrolling fewer than 50 children. Continuing decreases in the birth rate, increases in rural-urban migration and financial pressures in municipalities have led to a decrease of 3.4% in the proportion of multigrade schools over the period 1996-2000. Nonetheless the proportion remains very high and the needs of teachers great (Little and Pridmore, 2004). Greece In Greece, small and multigrade schools are found on the hundreds of islands across the Aegean Sea and in the remote mountainous areas of the mainland. 47% of all Greek primary schools are classified as multigrade and 17% of teachers are working in multigrade schools (Little and Pridmore, 2004). USA Table 6 presents the average size of public elementary and secondary schools in the states or jurisdictions of the USA. Table 6 indicates that the average size of primary schools varies greatly from state to state. The rural states of North Dakota, South Dakota, Wyoming, Montana and Nebraska have average school sizes of fewer than 200 pupils. At the other extreme, the states of Florida, Georgia and Nevada have average primary school sizes of more than 600. Average sizes of middle schools and high schools are much greater and range from 126 in Montana to 882 in California. Average sizes of high schools are larger still and range from 209 in South Dakota to 1,745 in Florida. Schools with only one pupil enrolled are found in eleven states. Although these are listed in the above table as ‘schools’ it is unclear whether they are conventional schools or home-learning arrangements. The largest school, with 6,245 pupils enrolled, is located in Ohio. As we shall see in subsequent sections, the question of school size has attracted much policy-research interest in the USA.

Size matters for EFA
15
Table 6 Average Size of Public Elementary and Secondary Schools, USA
Source: http://nces.ed.gov/pubs2007/2007354rev.pdf

Size matters for EFA
16
2.4 Section Summary
In this section, available evidence on the sizes of schools from several countries has been presented. Information on school size is not published by all national systems of education and is not collected routinely by UNESCO. It is clear that in some systems, where EFA goals remain unfulfilled, official statistics exclude significant numbers of very small schools. Evidence from a limited number of counties in sub-Saharan Africa demonstrates enormous variation between countries in the size distribution of primary schools. At one extreme, Uganda and Ethiopia have large proportions of schools enrolling more than 500 students; at the other, Niger and Mauritania have large proportions of schools enrolling less than 50. In the South Asia region, India stands out for its routine collection and publication of statistics on school size, and also for the information conveyed by them. A staggering 27.9% of all recognised schools offering primary grade education in India enrol fewer than 50 students. Like UNESCO, the OECD does not routinely collect from and publish statistics on school size from its member countries. Available evidence indicates that in several OECD countries the percentage of schools with enrolments fewer than 100 is significant. Average school size in the USA indicates great inter-state variations, from a low of 200 to a high of 600. In the next section we explore whether school size matters for achievement and other learning outcomes. A reading of the comparative literature on small schools raises the question: how big is small? In England the official classification of a ‘small’ primary school is one with 100 or fewer pupils. ‘Very small’ is a school with 50 or fewer pupils. In the USA small elementary schools have 300-400 students. In India small schools are classified in three ways: 1-25 students, 26-50 students and 51-100 students. This underlines the relative definition of size. It also underlines the importance of reviewing findings on the correlates of size within countries before any attempt is made to synthesise findings across countries. This will become clear in the next section.

Size matters for EFA
17
3. Does School Size Matter?
Size matters to policymakers for at least three interrelated reasons. The first is achievement outcomes, the second is costs and third is social equity. The three are not unrelated, but their relationship may vary from country to country. In this section we review what is known about size and achievement outcomes, size and costs and size and equity.
3.1 School Size and Achievement: Cross-national Analyses
Does school size matter for achievement outcomes? Schütz (2006) reports results from a secondary analysis of the Trends in Mathematics and Science Studies (TIMSS) 2003 cross national study. Her analysis focussed on the relationship between school size and achievement in maths among Grade 8 students in 51 countries. Controls were included in regression modelling for school and pupil characteristics including age, gender, parents’ education, student and parents’ country of birth, teacher experience and education, and class size, as well as for student social background and resources at school level. Separate regression analyses were performed for students grouped according to socio-cultural status (proxied by home language and country of birth) and according to socio-economic status (proxied by the number of books in the household). The research notes that much of the earlier research on the effects of school size has been based on the United States and that this had generated the conclusion of an optimal school size of between 600 and 900. The analysis of 51 countries was motivated by the possibility of determining optimal school sizes in other countries. The countries covered by TIMSS include two of our CREATE countries, Ghana and South Africa, along with a number of low and middle income countries. Both linear and quadratic models were fitted to the data. Estimated coefficients for both the linear and quadratic terms were significant in 6 of the 51 countries. Where the quadratic coefficient was significant, the relationship was most often that of an inverse U-shape. This was the case in Lebanon, South Africa, Bahrain, Indonesia and the Basque Country (Spain). In other words, larger school size and higher maths attainment were positively correlated across a certain range of scores, after which increases in size were associated with declining performance. However, in Singapore the relationship was a U-shape, suggesting that the smallest and largest schools were associated with the highest student performance. U or inverted U-shaped curves suggest an optimal or non-optimal school size and these sizes varied widely between countries. Optimal sizes varied from a high of 1970 in Lebanon to a low of 652 in Bahrain. In South Africa, the data generated an inverse U-shape, yielding an optimal school size of 1247. The comparable figure for Indonesia was 1056. In another group of 11 countries, a straightforward linear relationship was found. These included Ghana (where the ‘effect’ size was large), Chile, Malaysia and Tunisia. A negative correlation was found in England, Indiana (USA) and Macedonia. For the USA as a whole, a significant quadratic term was found in the absence of a significant linear term, indicating an increasingly positive relationship such that larger schools were associated with increasingly higher TIMSS scores ceteris paribus.

Size matters for EFA
18
Do the socio-economic and socio-cultural backgrounds of students produce an interaction effect between school size and performance? In this study, the socio-economic background of students was measured by parents’ education and number of books at home. The socio-cultural background was measured by the match/mismatch between the language of the test and the language spoken at home. A variety of patterns emerged in different countries, although the general picture yielded no significant differences. In South Africa, the relationship between school size and performance for the higher socio-cultural groups was found to be as in the overall regression, but for the lower group the relationship was found to be positive across all school sizes, although with a decreasing slope, leading to the suggestion that minority language students benefit relatively more in larger schools. In Indonesia, an inverse U shape was found for both groups, but with an earlier peak for minority language students. Interestingly, significant school size ‘effects’ were found for lower socio-cultural status students in a number of countries where no overall effect was detected. These included Egypt and Russia (both inverse U shapes). Regression by socio-economic status group also found results for the lower group in the absence of general effects, this time in Botswana and the Philippines (also both inverse U shapes). More generally, quadratic effects were found for both SES groups including in Ghana, Lebanon and Saudi Arabia. While an inverse U describes the relationship in Lebanon and Ghana for both groups (although in Ghana the ‘optimum size’ is very close to the right hand side of the distribution), in Saudi Arabia, the patterns were opposites, with a U shape being found for the low SES group and an inverse U for the high SES. These results indicate that school size may be an issue with implications for equality of opportunity in certain contexts. The absence of a common optimal size is hardly surprising since societies, systems and demographics differ so much. In the complete sample, the smallest school enrolled 21 pupils and the largest 9,960. In Ghana the smallest school size was 24 and the largest 1,500, while in South Africa the smallest was 68 and the largest 2,017. In Chile the spread was even larger, from a minimum school size of 52 to a maximum of 6,410. Schütz recognises a number of significant limitations in her study. These include the non-random selection of schools by TIMSS and the complex issues associated with selectivity bias since it cannot be assumed that school size is uncorrelated with unobserved student characteristics. She writes that
unfortunately, regression coefficients cannot be interpreted as depicting causal effects. The use of the words “optimal” and “non-optimal” in regard to school size and associated highest or lowest predicted test scores should not be interpreted as a statement related to causality (Schütz, 2006: 174).
In general, these findings provide a compelling reminder of several principles of international and comparative research. First, analyses based on data pooled across countries disguise all-important relationships at country level. Country level patterns vary enormously, and it is incautious for national policy makers to assume that findings from any one of these country patterns can be transferred to their own national system. Second, the range of salient values of key variables, in this case, size and achievement, vary from country to country. In Ghana most schools included in the analysis have enrolments of fewer than 400, with a ‘low’ range of 50-100. In

Size matters for EFA
19
Indonesia, the majority of schools have enrolments of less than 800, with a similarly low range of 50-100. In Singapore the majority of schools have enrolments of fewer than 1500. Very few schools have fewer than 500. The ‘fit’ between school size and achievement also depends on the overall range of performance. In Ghana the school mean values for school performance range between 130 and 400; in Indonesia between 220 and 540; and in Singapore between 400 and 770. The TIMSS study is unusual in so far as it has used a common measure of achievement across countries. Schütz’s study focussed on Grade 8 students. In terms of CREATE, these students have made the transition from primary to lower secondary. Some will be at risk of dropping out and fall into CREATE Zone 6. However, the TIMSS data set also includes children in Grade 4, and analyses of the effects of school size on students in this grade would be extremely valuable for our understanding of the effects of school size and other factors on performance of all children, and particularly on the low achievers and those at risk of dropping out of school (CREATE Zone 3).
3.2 School Size and Costs
We are unaware of any study that has systematically explored the issue of the relationship between school size and costs cross-nationally. It is commonly assumed that cost savings can be realised in larger schools. The evidence for this policy assumption is available in some countries. In the UK, for example, the relative costs of small and large schools are illustrated in a website for teachers1.The website describes how small schools cost more to run than larger schools, for two reasons. First, they have a greater proportion of fixed costs (e.g. administrative and cleaning). For example, at a 420 pupil school the fixed costs were around £218,000, representing 21% of the school budget while at a 60 pupil school, the fixed costs were around £82,000, representing 34% of the budget. Second, small schools ‘tie up more of the local education (authority) resources in unspent balances’ (Teachernet, 2007c). Small schools appear to maintain larger balances as a percentage of their planned budgets than larger schools. A local education authority with a high proportion of small schools ties up more money (proportionately) of unspent reserves than an authority with a lower proportion of small schools. This monograph has not undertaken a systematic search for studies of size and costs elsewhere. However, two authors have set out the elements of a cost-approach that might be used to describe the relationship between size and costs both inter- and intra-nationally. Note that, unlike the approach above, costs are not limited to the direct costs and cost savings for government. Second, they are not concerned with cost-effectiveness and not only with costs. Bray (1987) challenges the conventional wisdom that small schools necessarily have higher unit costs than large schools. The operation of several small schools can sometimes be cheaper than a single large school and small schools can often generate more resources from local communities. The calculation of costs, and of cost-effectiveness, requires a number of steps. Costs refer to financial and non-financial inputs and can include labour, land, goods and donations ‘in kind’. Costs include 1 See www.teachernet.gov.uk/management/fallingschoolrolls/context/smallschools/.

Size matters for EFA
20
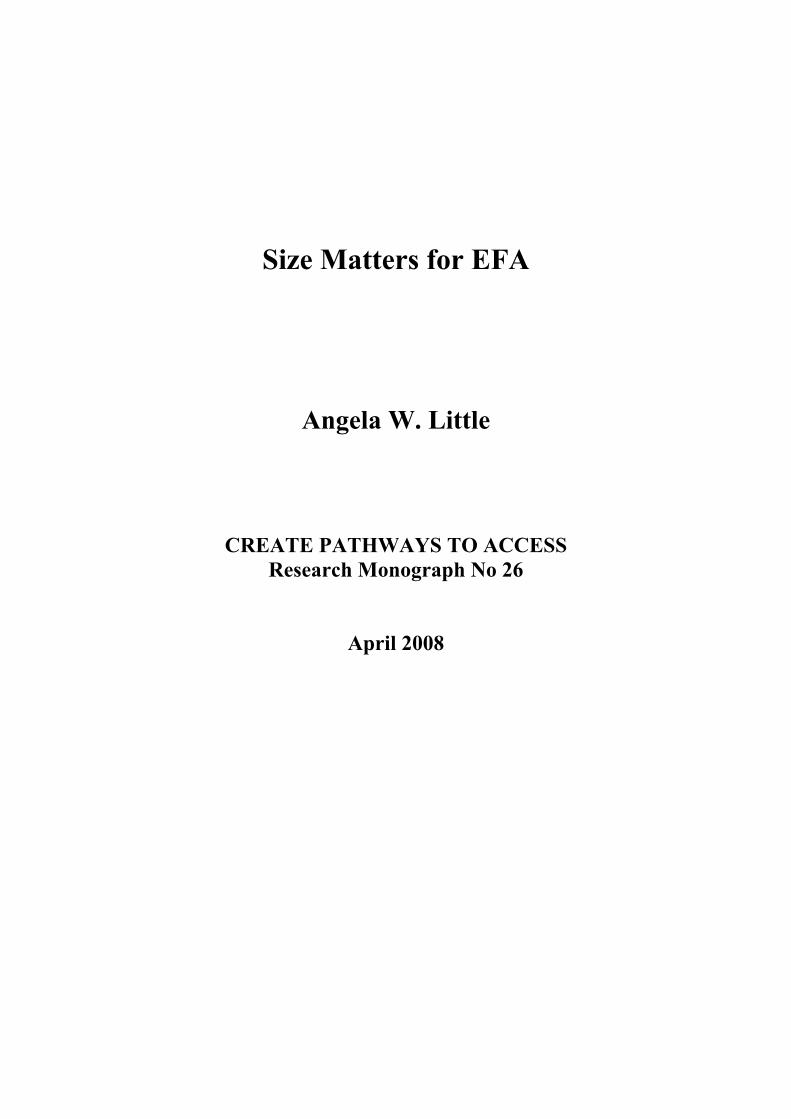
opportunity costs, i.e. benefits sacrificed when money is spent on this school rather than another or on a different type of project altogether. Non-government, as well as government costs, also need to be addressed. These include expenditures incurred by non-government bodies, families and individuals. The closure of small schools in a favour of a single large school usually increases the travel time and distance travelled by children – and by their parents, if parents accompany the child to school. These generate increases in costs and have possible implications for fatigue and learning. Today we would also be wise to include the costs of environmental pollution caused by increased carbon-fuelled travel. The cost factors that favour large schools include the more efficient use of fixed facilities. The costs of fixed facilities such as libraries, laboratories and playgrounds can be shared and spread over larger numbers of children in a large school than in a small school. Larger schools also tend to have higher pupil:teacher ratios. The relationship between school size and teacher costs per pupil is subject to thresholds, determined by the number of pupils beyond which one class is divided into two and another teacher employed. Bray (1987) illustrates this nicely in Figure 4. Figure 4 School Size and Instruction Costs per Pupil
Source: Bray (1987: 25) Figure 4 indicates that if teacher numbers remain the same and pupil numbers increase, unit expenditures decline. Once a new teacher is employed, the unit expenditures will increase before they start to fall again with further increases in pupil numbers. As pupil numbers increase and more teachers are employed, the underlying trend is for teacher costs per pupil to decline. The cost factors that favour small schools include the reduced costs of travel where children would otherwise have to walk long distances to school. In the context of CREATE, short travel distances also increase the likelihood that children will enrol and attend school. Children who reside close to a school can live at home, while children who reside long distances from school sometimes incur additional costs by boarding in student hostels or in private houses. Teacher and other staff salary costs in

Size matters for EFA
21
small schools can be lower since teachers in large schools are often more senior and large schools employ specialised administrative staff. Small schools often find it easier to raise community resources because communities find it easier to ‘identify’ with their school, contributions from family members are more likely to be appreciated, and communities are more likely to protect their small school from closure. In contexts such as Kenya, small schools are often set up as a result of community action (harambee) and, because of financial and in-kind support from communities, are less costly from the point of view of government. Bray (1987) asks: At what size of school are unit costs lowest? Reviewing studies published in the 1970s and 1980s, he reports wide variations, from 1,700 (in Wisconsin, US) to 4,000 (Ontario, Canada) at secondary, and from 300 (Prince Edward Island, Canada) to 600 (Pennsylvania, USA) at primary. Bray urges caution in the interpretation of these findings since they exclude all transport costs. Overall, he concludes that there is no such thing as an optimum size for all schools in a single country, let alone in the world. Cost and cost-effectiveness are not the same thing, and cost-effectiveness requires attention to the outcomes of schooling, such as achievement, discussed above, and to other dimensions, such as attendance, student attitudes, teacher attitudes and school atmosphere/ethos, discussed below. However, to our knowledge no studies to date have combined the dimensions of costs of small and large schools on the one hand and effectiveness measures on the other. Lewin (2006) has explored in a hypothetical way the cost and efficiency issues of multigrade strategies for learning in small schools in the context of Sub-Saharan Africa and South and West Asia. Not all small schools employ multigrade strategies for teaching and learning, but many do. Not all systems promote multigrade strategies for teaching and learning, but some do. Lewin’s review (2006) begins with the observation that where school size is small and where one teacher is appointed to teach each grade this can lead to very low pupil-teacher ratios and high recurrent costs per child. In turn, this can have severe implications for provision elsewhere in the system, including the restriction of access to education in some areas (CREATE Zone 1). Multigrade strategies can increase class sizes and release resources for provision elsewhere. Multigrade strategies can also allow more flexible progression from ‘grade’ to ‘grade’ and can reduce repetition and increase access through the system, thereby reducing dropout (CREATE Zone 2). Multigrade strategies, implemented well, usually increase the time students spend on learning. This can lead to higher pupil performance and a reduction of the numbers of children ‘at risk of dropout’ (CREATE Zone 3). Lewin (2006) provides a useful map of different types of costs associated with small and multigrade schools:
Recurrent: School level: Salary (teaching and non teaching staff) Non-salary (e.g. learning materials, in-service teacher training support, transport, maintenance, etc.) Common services: Salary (inspection, assessment examination, curriculum development, in-service training) Non-salary (materials, transport)

Size matters for EFA
22
Development: New buildings, new equipment and furniture Initial investment needed for curriculum and learning materials
Costs are divided into fixed costs and variable costs. Fixed costs are independent of the number of pupils in a system or a school, while variable costs are dependent on the numbers of pupils or teachers. At a system level, fixed costs include the costs of curriculum or textbook development and examination writing; variable costs include the learning materials distributed to schools per pupil. At a school level, the costs of teacher salaries will be fixed for the period of time during which teachers are employed at the school. The maintenance of buildings is also a fixed cost. Variable costs include the costs of provision of learning materials for pupils. However, the total costs of teachers in small schools can change dramatically if one new teacher is appointed and, as we saw above in Bray’s example, costs per pupil proceed in a step-wise manner. Costs are also divided into public and private costs. Public costs are met by public budgets at national or local level, while private costs are paid by households. One might also add a third category here, of particular relevance to non-governmental and non-formal small schools. In these, many costs are neither public nor private in the conventional sense. Rather, they are met by revenues raised in a variety of ways by community-based organisations and civil society. Opportunity costs are also relevant. Opportunity costs arise when the performance of one activity (e.g. attending school) reduces the income from other activities that might have been performed instead.
Attending school has an opportunity cost if a student could have gone fishing instead and sold or eaten the fish. The question then is whether the opportunity cost of going to school is balanced by the benefits associated with going to school (Lewin, 2006: 244).
The concept of opportunity costs applies to all children and households in systems where there is no compulsory education legislation or where it is not enforced and where opportunities for work of one kind or another exist. And opportunity costs may be higher and the perceived benefits of schooling lower in remote, particularly labour-intensive agricultural, communities with small schools. Education planners often calculate the costs per pupil, or the unit cost. At the school level this would derive mainly from teacher salaries and learning materials plus a share of support costs at district, province and national level. Costs per pupil are to be distinguished from costs per graduate. This allows for repetition and dropout. The main element of unit costs is the pupil-teacher ratio (PTR). Lewin (2006) explains that a multigrade system of learning and teaching can affect all the types of costs identified. Depending on the type of multigrade system employed and the overall size of a school, costs for multigrade schools may be higher or lower than for monograde schools. However, in making any comparison it is important to compare like with like. While a small monograde school requires one teacher per grade, the required number of teachers may not be deployed or, if the school is very remote, non-resident teachers

Size matters for EFA
23
may frequently be absent. Adequately resourced multigrade schools should only be compared with adequately resourced monograde schools. At a system level, inefficiencies can arise from over-staffing very small schools using the norms applied in monograde schools for determining the numbers of teachers to be appointed. However, the deployment of fewer teachers and the expectation that teachers will teach combined classes requires support of a different kind, including teacher training and learning and assessment materials suited to the multigrade class. Schools with low PTRs are more expensive than those with average PTRs. But averages are averages and most low PTR schools will be located in remote rural areas, the very areas where access to school remains problematic (CREATE Zone 1)2. Given the high proportions of small schools in many of the world’s systems of education (Chapter 1) it is clear that the achievement of EFA Goal 2 is possible only when a significant proportion of small schools are supported. Studies by the World Bank (e.g. Bruns et al, 2003) suggest that average PTRs will need to be 35-40:1 if EFA Goal 2 is to be achieved. Lower PTRs will be achieved by very small schools designed to meet the needs of children in marginalised areas with low population densities. Conversely, PTRs in schools with higher population densities will be higher. Lewin (2006) suggests that the use of multigrade learning and teaching strategies can lead to a reduction of per pupil costs in small schools where previously one teacher per grade was deployed; and an increase in efficiency and reduction of costs per successful graduate by improving the learning and teaching quality. Lewin (2006: 257-258) identifies the probable effects of a multigrade organisation of teaching and learning on costs at the school level. In the case of small schools these are likely to be:
School level costs • Decrease in the costs of teacher salaries per pupil. • No difference between adequately resourced multigrade and adequately
resourced monograde in the purchase costs of teaching aids; learning materials may be more expensive per pupil if self-study is encouraged.
• Training costs will be greater if new teacher education programmes are developed, but these are only start-up costs.
• New systems of assessment will incur start-up costs and may be a little more expensive is assessments are conducted as learning progresses, but not if assessment is built in to learning sequences.
• Multigrade is more demanding on teachers’ preparation time, but if more and better learning occurs there is a productivity gain.
System level costs • Inspectors, advisers and teacher educators will need additional training to
support and evaluate multigrade, but this ‘once-only’ development can be integrated into regular training programmes.
• No difference if system level assessments are held at the end of the primary cycle and based on the same stated criteria.
2 Some schools in urban areas, especially low quality schools, also have low PTRs.

Size matters for EFA
24
• In-service training costs will be extra if they are regarded as additional to regular INSET; but no difference if integrated.
• Curriculum revision would be an additional cost, but only start-up and not ongoing. If curriculum revision produces new syllabi, teacher’s guides and learning materials that can be used in both multi- and monograde classes the additional costs will be marginal.
• The costs of learning aids are unlikely to be different from monograde schools unless expensive technologies are used.
Lewin (2006) argues that the image of multigrade teaching as the option of last resort, associated with poor quality, understaffed remote schools, while prevalent and powerful, is unjustified. In some circumstances, multigrade will be the best and the most cost-effective option. It is extremely important that policymakers do not use multigrade simply as a way of increasing PTRs in rural schools:
It is a strategy to increase access at lower costs than monograde can provide. If PTRs are low because of small school size and monograde assumptions, then more could be enrolled at affordable costs if multigrade was introduced (Lewin, 2006: 260)
Lewin (2006:261) judges that, on cost and cost-effectiveness grounds, the effective use of multigrade strategies in small schools could have many benefits, listed below in the left hand column of Figure 5. The current author has assessed the implications of each of these for their impact on the numbers of children in the CREATE Zones of Exclusion, listed in the right hand column of Figure 5. Figure 5 Opportunities Afforded to Small Schools and their Implications for the CREATE Zones of Exclusion
Implications for Children in Zones of Exclusion
Deploy teachers more efficiently, reduce the range of class sizes Reduce numbers in Zone 1and 2
Improvement of access for out-of- school children in areas where schools are small, remote, uncongenial to learning, and under-resourced.
Reduce numbers in Zone 1
Restructure learning tasks to reflect the diversity of learning capabilities of students Reduce numbers in Zones 2-6
Manage learning progression more clearly Reduce numbers in Zones 2-6 Source: adapted from Lewin (2006: 261)
3.3 School Size and Social Equity
The literature on school size and social equity is not yet well-developed. However, at least two points can be made. Little (2006a) has argued that in many remote habitations small schools often provide the only possibility of access to primary education for millions of children worldwide. In these contexts the policy choice is not between a small school, a medium size school or a large school. It is between a small school or no school. In these contexts the establishment of small schools contributes is just and contributions to equity of opportunity for schooling. This logic
Size matters for EFA
25
lies behind many programmes for enrolment expansion. For example, Govinda et al (2007) describe the education guarantee scheme in India which encourages the establishment of schools in all habitations with 20 or more children of school-going age. While this programme meets criteria of social equity, some have argued such policies can contribute to inequality of quality and learning opportunities. In the context of India, Kochar (2007) suggests that this policy may be leading to increasing caste-based schooling inequalities. She explains that in rural India people reside in habitations or hamlets within villages. In 2002, India’s 586,986 villages comprised, on average, 2.1 habitations. More than a third of habitations are scheduled caste or scheduled tribe habitations. The implementation of the policy objective of providing a school within easy walking distance is planned around the habitation. This, she suggests, has had two implications. First, school size reflects the population of the habitation. Second, the system of residential segregation within villages is reproduced into a system of schooling segregation. This, she suggests, has had detrimental effects on learning outcomes for scheduled caste/tribe children because (i) school size in SC/ST habitations are smaller than in upper caste habitations and (ii) low quality multigrade teaching is more likely in smaller schools. This trade-off between access and quality can be minimised by
Consolidating the schools in a village and using the resulting savings to finance a system of cash transfers to scheduled caste and tribe households, conditional on their child’s schooling attainment (Kochar, 2007: 3).

Size matters for EFA
26
4. School Size as a Policy ‘Issue’
School size has emerged as an important policy issue, especially in a number of OECD countries. In Finland a large number of lower comprehensive schools were closed in the early 1990s through a combination of declining student numbers and economic pressures. In England some have raised questions about the ability of small primary schools to deliver the National Curriculum to pupils in the upper grades and about their financial viability (Vulliamy et al, 1997). In the U.S.A, by contrast, there have been growing concerns through the 1990s about the learning outcomes of pupils enrolled in very large schools. Research conclusions on the optimum size of schools vary, but ‘on average… an effective size for an elementary school is in the range of 300-400 students and that 400-800 is appropriate for a secondary schools’ (Williams, 1990: 7-8). In her review of literature, Irmsher (1997) concludes that larger schools do not appear to have produced greater academic success at lower costs.
4.1 England
As we saw above in section 3.2, the relatively higher costs of small schools are of current concern to policymakers in England. This issue is discussed not only by education managers, but is also communicated to teachers, and indeed the public at large, via the UK government’s website ‘teachernet’. We have found no studies that link costs with outcomes across the whole system. However, a number of studies have commented on costs, curriculum and quality issues in small schools. These studies date from the 1970s. Writing more than thirty years ago, Gregory (1975) wrote of the educational advantages of small private schools. Writing from the perspective of a practitioner, she claims that small schools support a stronger family atmosphere, close home-schools relationships, teaching in mixed age groups and the development of a co-operative spirit. Edmunds and Bessai (1978) compared 27 two-teacher schools in Cheshire, England with 51 one- and two-roomed schools on Prince Edward Island, Canada (Edmunds and Bessai, 1977). Teachers in the Cheshire schools reported that they felt that small schools were superior to large schools in terms of inter-personal relationships, student learning and classroom management. Teachers in the Prince Edward Island schools presented a positive view of small schools in terms of student learning, inter-personal relationships, classroom management and discipline. Student perceptions were also assessed. Students in the Prince Edward Island small schools reported higher school satisfaction, higher social cohesion and lower friction than students in larger, graded schools. The mean scores of students in the Cheshire schools were similar to the Prince Edward Island students. No comparisons with students in graded schools were made in Cheshire. In the mid 1980s, Cornall (1986) studied curriculum development in 30 small schools in four counties. Curriculum challenges faced by teachers in small schools included professional isolation, lack of cover, small peer groups, the need to undertake administration as well as teaching and an over-dependence on individualised

Size matters for EFA
27
instruction with children. Nonetheless, Cornall reports a number of examples of quality education and curriculum innovation. Bell and Sigsworth (1987) explored positive and negative attitudes towards small schools held by different stakeholders. Detractors claim that small schools are constrained in their delivery of quality education by virtue of their size, location and curriculum. The authors adopt a more positive view of small schools, arguing that high quality can result from the social relations within the school and the unique relationships between a small school and its local community. Keast (1987) reports on developments in four local education authorities that had responded to the challenges of ‘uneconomic’ and ‘low quality’ provision by organising schools into ‘clusters’. Clustering involves the building of co-operative links between groups of schools in order to strengthen curriculum provision through the sharing of expertise and resources. A key ingredient in the more effective clusters was the appointment of an advisory or other experienced teacher to co-ordinate, encourage and lead the work across the schools in the cluster. Subsequent work by Keast (1991) and associates in the Exeter Small School network on clustering emphasises that effective clustering depends on the teacher’s belief that involving other teachers and children in the life of the school is worthwhile, and on support from the local education authority whether in the form of money, advice, materials or ‘protection in the face of opposition’. Writing specifically for education officers and advisors, Davies (1992) highlights the advantages of small schools suggesting that many have a ‘special quality’ derived from the positive use of open plan classrooms and co-operative teaching over a wide age range. Arnold and Roberts (1990) provide examples of Local Education Authority (LEA) schemes designed to overcome the economic and curriculum challenges posed by small schools, including school clusters and the use of peripatetic specialist teachers. Developing this, Francis (1992) reports a study of pupil attitudes in small (less than 60 pupils) and large primary schools in one county in England. Children in small schools had more positive attitudes towards school than children in larger schools. Throughout the 1980s, reports from Her Majesty’s Inspectors (HMI) were generally critical of small schools. Hopkins and Ellis (1991) were among several to attempt to counter the criticism with evidence of effective small schools. The key to ‘effectiveness’ is considered to lie in the use of appropriate pedagogical methods and class organisation, with an emphasis on individualised and co-operative group approaches. By the late 1980s and early 1990s, the context in which discussions about small schools in England were conducted had changed significantly. Two changes in policy were particularly salient. The first was the introduction of a National Curriculum in 1988, and the subsequent introduction of the National Literacy and Numeracy Strategies. For the first time in the history of education in England, the definition of curriculum goals and objectives had become centralised. Hitherto teachers and primary schools determined the curriculum alone, in collaboration with other teachers, or in collaboration with subject advisers at the local authority level. The new curriculum strategies provided considerable guidance on the process and content of teaching and were based on the assumption that classes catered to single rather than mixed ages. Adaptation of the centralised curriculum to the mixed year classes so typical of small schools would now be perceived as a new and burdensome challenge by some teachers (Berry and Little, 2006). The second policy reform was in school budget management. The policy, known as Local Management of Schools (LMS),

Size matters for EFA
28
introduced from 1988, involved the devolution of budgets to individual schools, with implications for the additional time needed for administration by headteachers, teachers, school secretaries and buildings caretakers as well as the (increasing) size of mixed year classes (Harrison and Busher, 1995). Forward’s work was published in 1988 during the year of national curriculum reform. His book, Teaching in the Smaller School (1988), underlined a number of potential strengths of small schools. Among these was the trust developed between teacher and student over a long period of time. At the same time, local authorities needed to recognise the different context of small schools and commit to providing special forms of professional development to teachers. Written before the policy change on curriculum, Forward’s prescient postscript senses a future for English education with ‘a centrally prescribed curriculum with children forced to conform to it by frequent testing and a strong element of competition between schools’ (Forward, 1988). Such a climate, he argued, runs counter to the ethos of small schools with its emphasis on the individual child and peer learning. Galton’s work on small schools focussed on curriculum and management issues in the years immediately following the introduction of the National Curriculum and LMS policy changes. Galton and Patrick (1990) examined teaching practices in 168 small primary schools. What is termed in England ‘vertical grouping’ (and elsewhere ‘multigrade’ or ‘combined grades’) was observed in almost every school. Practices within these classes were, however, very similar to those observed in single grade/year classes. Both sets of teachers used whole class teaching, small group teaching and individualised teaching. Whole class teaching was more common in vertically grouped classes than might have been expected. ‘Group work’ was often individual work undertaken in physical seating groups. Groups that required collaboration among pupils produced more work from students. Individualised work generally implied an individualisation of pace rather than content. Several writers had emphasised the value of school clustering as a means of delivering the national curriculum in small schools (e.g. Keast, 1987, 1991, 1992a, 1992b). Galton (1993) explored the management development issues associated with school clustering as a means of helping schools deliver the national curriculum. Galton identifies three stages in the development of school clusters – initiation, consolidation and re-orientation. In the initiation stage, contacts between schools involved the sharing of facilities or joint ‘outings’. Decisions on whether to collaborate further were based on economic considerations. In the consolidation stage, the focus was on the implementation of an agreed teaching programme. Teacher expertise was in great demand and the most effective clusters were those that could call on specialist advisory teachers beyond the schools. However, the practice of teaching and sharing was unlikely to change until schools reached the re-orientation stage. Now the cluster managed its own activities without recourse to outside assistance. Galton argued that the policies on devolved budgets and the need for increased specialisation as a result of the National Curriculum required that schools move beyond informal clustering arrangements into Federations of Consortia. These would involve formalised structures for decision making on allocations of staff and resources across a number of schools. In a subsequent study, Hargreaves, Comber and Galton (1996) explored the confidence and competence levels of teachers in small rural primary schools in the context of clustering. In general, teachers reported high competence and confidence ratings. There was a slight decrease in confidence at the third stage of clustering, i.e. the re-orientation stage. The authors speculate that as teachers became more aware of

Size matters for EFA
29
the complexity of curriculum implementation, their confidence in capacity to deliver declined. Keast (1992a, 1992b) reports a survey of small schools in the wake of the 1988 Education Reform Act. The survey examined policies for small schools in 33 LEAs, including funding arrangements, staffing and head teacher commitments. Findings indicate that the majority of LEAs had special funding arrangements for small schools to compensate for higher costs. The cluster idea was not being implemented in most LEAs, nor were most LEAs supporting the cluster concept. While management and administrative duties had certainly increased after the policy reform, there was no evidence of a corresponding increase in staffing in small schools. Changes in policies on parental choice had helped small schools increase in size. Vulliamy and Webb (1995) report an evaluation of the implementation of the National Curriculum at Key Stage 2 (ages 10-11) in 50 small primary schools. Five main organisational aspects of small schools are identified as posing ‘issues’ for curriculum implementation – mixed year classes, classes which span two key curriculum stages, subject teaching, the roles of the head teacher and the role of school clusters. The authors found no evidence to suggest that small schools were unable to provide a broad and balanced curriculum. This was because small schools had certain advantages over larger schools, including more opportunities for innovative curriculum practices and classroom organisation, strong curriculum leadership from the head teacher, who is also a class teacher, and greater ease in monitoring and supporting pupil progress because all teachers know all the pupils. Because larger schools used the single class teacher model, the depth and breadth of the curriculum experienced by the child depended on the qualities and practices of the individual class teacher. Small schools continued to experience some challenges including a greater curriculum planning burden and professional isolation caused by lack of access to in-service courses. Where school clusters operated effectively these disadvantages were alleviated somewhat. By 2000, the policy climate for small schools in England had changed again. A report by the Office of Standards in Education (OFSTED) published in 2000 compared the achievement and quality of very small (less than 50 pupils), small (less than 100 pupils) and larger schools. In schools where the eligibility for free school meals is low (i.e. the social-economic background of most pupils is favourable), pupils in very small schools achieve significantly less than those in larger schools3. Disparities of achievement between small schools are great, with more than would be expected among both the top and the bottom performing 100 schools. However, disparities of achievement within small schools are fewer. While pupils in small and very small schools are less likely to make unsatisfactory or poor progress than those in larger schools, those in very small schools are less likely to make good or very good progress. The quality of teaching and the breadth and balance of the curriculum are reported to be as great in small and very small schools as in larger schools. Strengths of small and very small schools lie in their ethos and the leadership offered by the head teacher. Their main weakness lies in provision for the under-fives, especially when these children form a minority in a mixed age class. And while it remains a fact that the unit costs of small schools are higher than those of lager schools, they are
3 While the OFSTED report attributes lower achievement to school size, the reverse could also be true, i.e. schools that have lower achievement attract fewer students and become small. This calls for studies of the effects of school and class size over time.

Size matters for EFA
30
reported to use they money they have ‘wisely’ and ‘effectively’. In contrast to the HMI reports of the 1970s and 1980s, this report ends on a very positive note:
There is much… to encourage those who work in small schools. Higher unit costs notwithstanding, a good case emerges for the place of small schools in the education system as a whole, when the quality of their educational performance is added to the broader contribution they make to their communities’ (OFSTED, 2000).
Literature on teaching and learning in small, multigrade schools in England and elsewhere is increasingly becoming available via the internet. Sites designed specifically for teachers include: www.hamilton-trust.org.uk www.teachernet.gov.uk www.norfolkesinet.org.uk www.standards.dfes.gov.uk/literacy/publications/framework ‘additional guidance’
4.2 United States of America
In the United States, there are two very distinct literatures on school size. The first is in the tradition of the TIMSS study reported above. Does school size have an impact on student performance and other student outcomes? Here, the full range of school size, from small to large is explored. The second is a USA literature on small multigrade schools. Both are reviewed here. Several ERIC Clearinghouse documents have synthesised a large body of research on the correlates of school size. The summary below draws on three ERIC syntheses written by Irmsher (1997), Cotton (1996), and Raywid (1999). In contrast to the UK research, much of the USA research has focussed on the disadvantages of large and very large schools on pupil achievement and attitudes. And the literature on costs has seen a shift from a pre-occupation with costs per se to a concern with ‘cost-effectiveness’. Attendance and Achievement Attendance rates in small schools are higher and dropout rates lower than in larger schools. Large schools have lower grade averages, standardised test scores, higher drop-out rates and more problems with violence, security and drug abuse. Females, non-whites and special-needs students, whether at risk, gifted, exceptional or disadvantaged, are all better served by small schools. Teachers Small schools encourage innovation on the part of teachers and participation on the part of students. Teacher perceptions of school managers/administrators are more positive and collaboration among colleagues is greater in small schools. Teachers are more likely to form teaching teams, to integrate subject matter content and to employ multi-age grouping and cooperative learning as teaching strategies in small schools than they are in large schools.

Size matters for EFA
31
Student attitudes Student attitudes to school in general and in particular to school subjects are more favourable in small than in large schools. Student personal and academic self concepts, sense of belonging and interpersonal relationships are more positive in small schools. Student behaviours Students participate in extra-curricula activities more in small than in large schools. Students are more likely to take responsibility for their own learning. (Bad) behaviour problems are greater in larger schools. Curriculum While large schools can offer greater curriculum variety, only a few students take advantage of this. Learning activities are more likely to be individualised in small schools and curriculum scheduling is more flexible. Teaching and learning is experienced in class sizes that are likely to be smaller in small schools. There is a greater emphasis on learning that is experiential and relevant to the world outside of school in small than in large schools. School culture and stratification Large schools function like bureaucracies; small schools function more like communities. Communication among teachers is easier when all can sit around the same table. Large schools become stratified. Academic and athletic ‘stars’ benefit from close contact with adults in large schools. The majority do not. In small schools, everyone, not just the stars, are part of a community. Teachers and students get to know each other better. Parents Parental involvement in schools is more likely and more extensive in small schools. Costs Savings associated with school consolidation (i.e. the creation of larger schools) have not materialised. ‘Penalties’ (or diseconomies) of scale have replaced ‘economies’ of scale since large schools need more layers of support and administrative staff to handle increased bureaucratic demands. While costs per student enrolled can appear lower in larger than smaller schools, the costs per graduated student are higher. Cotton (1996: 5) concludes her review with a plea for research findings to play more of a role in policy decisions about schools:
Although the professional literature supports educating children in small schools, the consolidation trend continues to create large schools. This is because factors other than student results – political, economic, social and demographic factors – typically drive decisions about school size. While such a trend would be difficult to reverse, the research indicates that it would be well worth the effort.
The more recent evidence from the USA (as reported in Schütz (2006)) appears to suggest an inverse U-shape relationship between school size and achievement, with optimum sizes being 600-900 students.

Size matters for EFA
32
4.2.1 Small Schools in Rural Areas in the USA
A quite separate literature on school size in the USA addresses the issue of small schools in rural areas. Prominent among the contributors to this literature is Bruce Miller at the Northwest Regional Educational Laboratory in Portland, Oregon. The literature is of two types – academic reviews of literature of the cognitive and affective outcomes of multigrade and monograde schools, and handbooks to support teachers working in multigrade settings. In an ERIC digest, Miller (1991a) describes how, in the USA, multigrade classes have ranged from the one-room schools of the early 1890s to the ‘ungraded’ classroom of the 1960s and 1970s, to the cost effective two grade classes of the 1990s. His reviews of the evidence on the outcome of multigrade and monograde (1990, 1991b) suggest no consistent differences were apparent in terms of cognitive achievement and more positive student attitudes to schooling among those in multigrade classes. In his review of qualitative studies of classroom practices, Miller (1991b) underlines the extra demands placed on the multigrade teacher, the poor preparation given by initial teacher education to meet these demands, and the inflexibility of curricula designed primarily for single-age classes. At the same time, teachers in multigrade classes underline the development of independence and interdependence among students as an advantage offered by these settings. Six instructional dimensions are considered key for teacher training – classroom organisation, classroom management and discipline, instructional organisation and curriculum, instructional delivery and grouping, self-directed learning, and peer tutoring. Effective multigrade teachers share instructional responsibilities with students. They set clear rules and routines and help students develop independence, and they plan whole class instruction that revolves around ‘open task activities’ (Miller, 1991a). A resource handbook for teachers working in small rural schools in the USA offers basic concepts and principles, sample schedules, classroom layouts, instructional strategies and further resources for teaching (Miller 1989).
4.3 Is School Size a Policy ‘Issue’ in India?
Most of the Indian literature on small schools appears to be focused on pedagogy, teacher education and curriculum. The most recent overview of the status and implications of multigrade teaching in small schools was produced by Gupta, Jain and Bala of the National Council of Educational Research and Training more than ten years ago, in 1996. It suggests that the concept of ‘multi-level teaching’ acknowledges the co-existence of several levels of attainment in one class, and can apply to both the monograde and multigrade class. The authors report that in the mid 1990s as many as 90% of schools, mostly in rural areas, faced the challenge of multigrade teaching at some point or other. Aggarwal’s (1997) study of schools in the state of Assam confirmed this national picture. He also predicted that the percentage of small schools in the system as a whole would increase as government promoted their efforts to achieve EFA Goal 2, especially in rural areas that had not been reached hitherto. Govinda et al (2007) confirm this prediction. Gupta, Jain and Bala (1996) identify a number of issues requiring policy attention in the mid 1990s. These included increased awareness of multigrade teaching, the need for curriculum and instructional materials designed for multigrade classes, the incorporation of multigrade into pre- and in-service teacher training and the exploration of a range of instructional

Size matters for EFA
33
strategies, including peer-group learning, the use of monitors and self-learning activities. The Institute of Education website on Learning and Teaching in Multigrade Settings (www.ioe.ac.uk/multigrade) contains a handful of additional references to research on multigrade teaching in India that post-date the review by Gupta et al (1996). A few studies have focused on the effect of various multigrade interventions on the attainment of learning competencies. Swamalekha (1999) and Bharadwaj (1998) report improvements in learning competencies in a small number of rural schools, with clear implications for teacher training strategies. Kamat (1998) reports on the positive implications of various grouping strategies, self-study and graded learning exercises for attendance and achievement in grade 1-4 multigrade classes. Saloshini (1999) examines the relative lack of autonomy of Indian teachers in adapting teaching strategies to the multigrade class compared to teachers in Canada, indicating the need for improved teacher training, while Bhatacharjee (1998) suggests how research-based interventions and strategies could be pursued to improve pedagogy in small multigrade rural primary schools. A number of books and booklets provide practical, locally relevant advice for teacher trainers (e.g. Shabnam, 1998). And a handful of published materials describe pedagogic and curriculum practices in particularly successful non-government programmes in small schools – for example in the Rishi Valley Programme in Andhra Pradesh (Rishi Valley Education Centre, 2000; Menon and Rao, 2004; Rao, 2005; Little, 2006). Most recently, Blum and Diwan (2007) have reviewed the experiences of the Rishi Valley programme in Andhra Pradesh and the Bodh Shiksha Samiti programme in Rajasthan, in the context of national education policies on EFA. Both programmes have been successful in providing learning experiences in small schools that address learner diversity and are relevant to local knowledge and contexts. Both programmes have restructured the sequence and type of learning activities for children, but in line with National Curriculum objectives. And both have been able to support teachers through pre-and in-service training. Both have made a commitment to maintaining teaching groups of 30 or fewer children. Both programmes create strong links between schools and communities that necessitate a change in the teacher’s role from knowledge transmitters to learning facilitators and community organizers. They differ in important ways too. The Rishi Valley programme trains and employs local residents with minimum qualifications as teachers in mainly rural areas. The Bodh programme more usually offers supplementary training for teachers from other communities and works in both urban and rural settings. The small-scale Rishi Valley NGO programme – referred to often as ‘School in a Box’ – has inspired state government provision. The Activity Based Learning (ABL) programme for primary education in Tamil Nadu has been inspired by several education programmes including Rishi Valley (Anandalakshmy, 2007) and has recently been extended to all 37,000 schools in the state. Many schools previously organized along monograde lines have re-organised themselves on a multigrade basis around a pedagogy based on activity learning. Other states are set to follow the Tamil Nadu example or to trial the approach on a small scale (Kumar, personal communication, 2007).

Size matters for EFA
34
While there is a growing research literature on curriculum and pedagogy in small schools in India it is not clear that size, per se, has surfaced as a policy ‘issue’. As we shall see below there is considerable disjunction between the reality and extent of small size and the premises on which curriculum planners and teacher educators work.

Size matters for EFA
35
5. Learning and Teaching in Small, Multigrade Schools Worldwide
A considerable amount of research has been undertaken in recent years on learning and teaching in multigrade settings in a range of developing countries (Little, 2006 and www.ioe.ac.uk/multigrade). Small schools face many challenges in the delivery of the curriculum, especially when ‘small’ signals enrolments of fewer than 100. In these contexts, teachers are typically faced with the challenge of delivering a curriculum whose designers have modelled it on larger schools with monograde classes in which one teacher is responsible for the teaching of a subject to a single grade group at any one time. Most national curricula are premised on such monograde classes. However, in small schools worldwide there are very large numbers of teachers and learners who work together in groups in which two or more ‘official’ grades are combined into ‘multigrade’ classes. The Indian case is instructive. The number of primary-only schools in 2005/2006 with 50 or fewer pupils was 207,568, while the number of primary-only schools with only one teacher was 122,385. In all schools that offer elementary education the corresponding figure is 136,692. These teachers are responsible for delivering a 5 grade curriculum single-handedly. However, the issue of multigrade teaching is not confined to single teacher schools. The need for a multigrade pedagogy and curriculum for some part of the school day is apparent in all schools in which there are fewer teachers than grades. In Table 4 (above) we saw that 76.32% of all schools that offer education from grades 1-5 have three or fewer teachers. In rural areas this figure rises to 79.11%, while in urban areas it is just under half of schools (47.40%) (Mehta, 2006: 76; Table B23). The Indian primary school curriculum is organised around the assumption that students are divided and taught in five separate classes. Given the numbers of teachers per school (and the fact that few teachers appear to teach double shifts), one can only conclude that teachers divide the classes between them and teach classes in combination (unless, that is, they cope by ignoring some classes some of the time). In having common objectives for some class combinations, the recently reformed National Curriculum Framework (NCF) has a clear advantage over frameworks in many other countries. In the subject of English, for example, the curriculum objectives for Classes I and II are common as they are also for Classes III, IV and V. In Mathematics, the syllabus is organised in ‘five very natural streams’ flowing from Class I to Class V, which overlap not only with each other but also with themes developed in other subjects that are being learnt simultaneously (NCERT, 2006). Hence, the concepts of ‘shapes and spatial understanding’ and ‘number operations’ appear in the syllabus for each Class at increasing levels of difficulty. Environmental studies which starts at Class III is woven around six common themes for Classes III-V – ‘family and friends’, ‘food’, ‘shelter’, ‘water’, ‘travel’ and ‘things we make and do’. In principle then, the curriculum structure and content are amenable to some re-organisation that would support the multigrade teacher in its delivery, without compromising overall curriculum objectives.

Size matters for EFA
36
However, there is currently no recognition in the NCF documentation of the implementation realities facing the multigrade teacher nor of her particular needs. The current documentation is packaged for schools in which there are at least five teachers, i.e. schools in which teachers are monograde, not multigrade. At a minimum, the NCF needs to be translated into multiple formats that support the work of teachers in a one-teacher, two-teacher, three-teacher and four-teacher school, respectively. In the rest of this section teaching and curriculum strategies currently employed by multigrade teachers worldwide are outlined. These have been described in various ways (Little, 1995, 2001, 2004, 2006; Pridmore, 2006). The following is the most recent classification by this author. Strategies are divided into three broad approaches – Avoidance, Quasi-Monograde and Differentiation.
5.1 Avoidance of Multigrade in Small Schools
In some systems school principals and teachers avoid the need to adopt a multigrade curriculum by organizing schooling in one or more of three different ways. The first organizational strategy is deferred entry. Most schools admit students annually. Some admit biennially or triennially (Bray, 1987) This was a common strategy in the 1980s in several of the Pacific island countries and involved deferring the entry of a group of primary grade 1 students and combining them with next year’s entry. In this way a reasonable number of students could be enrolled at the same time and taught as if they were in a monograde class (Collingwood, 1991). It is also a strategy adopted in the BRAC primary schools in Bangladesh. A one-teacher school is started when there are sufficient (defined as c. 33) children of different ages present in the village and wishing to attend a school. The children are taught as one grade, generating a multi-age but not multigrade class (Lovell and Fatema, 1989). The second strategy is the use of double and sometimes triple shifts (Little, 1995; Bray, 1989). In some systems, teachers teach more than one shift of school during the day. They may, for example, teach Grade 1 in the morning and Grade 4 in the afternoon. While this may avoid the need to combine classes, it usually also means that the length of the school-day from the child’s perspective is shorter than it would be if he/she attended school for a whole day. The third strategy is abandonment. Suzuki’s (2006) observations of multigrade teachers in Nepal generated five curriculum strategies. The first might be described as neglect. This involves avoidance of some students by teachers some of the time. In this strategy teachers divide the time available for a school day by the number of grades they are timetabled to cover. This generates the time teachers allocate to each graded class. These classes are then taught as a monograde class. By implication, some students are ignored for some part of each day. They are not guided towards self-study because no teacher feels responsible for them. Four other strategies were also observed, some of which are described later.

Size matters for EFA
37
5.2 Quasi-Monograde in Small Schools
The term Quasi-Monograde refers to attempts by teachers to organize a multigrade class as if it were a monograde class. Within this approach there are three main strategies. In the first, the teacher organises the class into separate spaces and grade groups. Students work alongside their class grade peers. There are often separate chalk-board spaces for different grade groups. The teacher divides her time between the grades and may or may not use a pupil-monitor to supervise the work of one grade while she is working with another. Within this strategy one can observe further subdivisions. Lungwangwa (1989) describes the ‘subject stagger’ strategy, in which subjects are staggered on the timetable. Subjects requiring high teacher-pupil contact are matched with those requiring little. The teacher gives most attention to the group timetabled to follow the teacher-intensive subject. Berry (2006) reports the use by teachers in the Turks and Caicos Islands of a common subject but ‘grade by grade’ approach, in which two or three different lessons at different levels are prepared on the same subject. This was commonly used in relation to mathematics and language arts. Lungwangwa (1989) describes this as a common timetable approach in which all children learn the same subject in a given timetable period but each group follows its own work according to grade level. In the second strategy, the teacher makes use of curricula that have been planned in units spanning more than one year – multi-year span curricula. Learners from different grades ‘enter’ the span at different times, but all students in the class then follow the curriculum unit together. Berry and Little (2006), working in London observed teachers working with ‘two year curriculum spans’. This strategy was found commonly in science, history, geography, art, information and communications technology, design and technology, music and physical education. In Greek multigrade schools, Ministry guidelines instruct teachers to teach Grades 5 and 6 simultaneously, in all subjects bar Mathematics. Students sit close to others within the same grade group, but the two grade groups are located side by side. This year’s Grade 5 may work from the Grade 5 textbook; next year’s Grade 5 will start with the Grade 6 text, moving on to the Grade 5 text the following year. In the third, the whole class strategy, the teacher teaches the same lesson to all the students in the same way and treats them as if they were a single monograde class. Lungwangwa (1989) refers to this as a ‘subject grouping’ strategy. Music, art, religious knowledge and social studies lend themselves well to this option. Suzuki (2006) observed this whole group, undifferentiated approach in Nepal. The teacher merges the separate grades and treats the class as one. This approach was most often observed in sports, music and arts. Similar inputs and similar processes are followed and similar learning outcomes are expected from all students, irrespective of their formally assigned grade.
5.3 Differentiation in Small Schools
The third broad approach rests on the concept of differentiation. The first strategy focuses on the teacher and her/his handling of curricula texts and material inputs with learners. In Finland, Laukkanen and Selventoinen (1978) demonstrated how it was

Size matters for EFA
38
possible under the common timetable approach to deliver the same subject at the same time in up to four year groups combined into one, each group studying the topic at what the teacher judges to be a grade-appropriate level. Berry and Little (2006) describe how multigrade teachers in London speak of ‘integrating frameworks’. This involves teachers reconstructing the national curriculum framework for each of two or more years (grades) into one by identifying learning objectives and/or topics in common. The teacher focuses her attention on the common elements and teaches the whole group as one (see whole class above), followed by some differentiated tasks and activities. With differentiated tasks come differentiated expected learning outcomes. The concept of curriculum differentiation has also been used fruitfully in programme interventions with teachers in Vietnam (Vu Son and Pridmore, 2006), with curriculum developers in Vietnam (Pridmore with Vu Son, 2006) and with teachers in Sri Lanka (Vithanapathirana, 2006). In developmental work on curriculum re-organisation in Vietnam, for example, Pridmore and Vu Son (2006) engaged curriculum developers in active support for teachers. The curriculum content of the subject of ‘health’ was re-organised to enable teachers to address the same subject, same theme and same topic across grades, using some whole class teaching followed by differentiated tasks and differentiated expected learning outcomes for each grade. This was done by identifying themes and topics related to health from within the subjects of natural and social sciences (grades 1-3) and from science (grades 4-5) that were repeated across two or more grades. The order of themes and topics within grades was then re-sequenced so that all students in either grades 1-3 or grades 4-5 could work together. The pedagogy adopted for each theme was also changed towards a stepped enquiry and activity-based approach. The potential advantages of this approach for the multigrade teacher are several. First, children from different grades can be grouped together and taught the same curriculum subject at the same time. Second, children of all ages, abilities and grades learn together. By structuring the stages of the lesson through a mix of whole class teaching, single and mixed grade discussion groups, individual enquiry and activity, the teacher can appreciate the unity of the lesson planning task – one topic across several lessons, albeit with differentiation within. Most importantly, she has been professionally supported in the planning task by a national authority. She has not been expected to carry the burden of planning for two or more grades alone. Little (2006) has argued that multigrade teachers should not be expected by external authorities to adapt curriculum to their multigrade circumstance alone. In most monograde systems teachers are not expected to exercise such levels of adaptive professional autonomy (and indeed are often discouraged from so doing). Why should so much more be expected from the multigrade teacher? The involvement of national level curriculum developers in the adaptation, re-organisation and re-alignment or reform of the curriculum framework would legitimate the work of multigrade teacher. It would dispel the message that she is a second class teacher trying her best to teach in the monograde style. It indicates that there is another way which meets with the approval of higher authorities. A rather different strategy of differentiation arises when the main driver for learning is graded learning material rather than the teacher. This strategy is learner-centred. In this approach the curriculum does not necessarily need to be re-sequenced. Rather,

Size matters for EFA
39
learning materials are designed to help the learner progress through the curriculum sequence. And such materials need to be available in plentiful supply (Little, 2006). Two examples of this approach stand out. The first is the Escuela Nueva Programme, originating in rural Colombia in the 1980s. The development of the curriculum focused on the learning needs of students. Self-learning guides were developed for each of the subjects of the national curriculum reflecting its objectives. Regional and local adaptations were made to the content where appropriate. Self-learning guides were developed in natural science, mathematics, social studies and language, with regional and local adaptations. These were organised by sequences of learning tasks and presumed levels of difficulty. Learning activity centres and libraries complement the study guides. Assessment of learner achievement is built into the study guides and flexible promotion systems allow students to progress at their own pace. Learners working at several curriculum grade levels are grouped together in the same classroom (Colbert, Chiappe and Arboleda, 1993). A second compelling approach comes from the Rishi Valley in the state of Andhra Pradesh, India (Rishi Valley, 2000; Menon and Rao, 2004). Developed over the past eighteen years, the scheme is premised on differentiated learning and a curriculum programme that ‘scales down the learning outputs of each class into a meaningful sequence of concrete and manageable units’ (Menon and Rao, 2004: 43). Five types of learning activities are stimulated by work cards and learning aids that draw from the local environment and daily-life experiences of the learner. These are classified as: introductory, reinforcement, evaluation, remedial and enrichment. Multiple sets of activities comprise ‘milestones’, organised in ascending order along a ‘ladder of learning’. This approach has recently inspired the developers of the activity-based programme in the state of Tamil Nadu (Anandalakshmy, 2007). Hailed as ‘The Silent Revolution’, the programme is currently being introduced across the state. Thus, at least three broad approaches, comprising eight pedagogic strategies, have been identified in multigrade classes in small schools around the world. These are: Avoidance (deferred entry, shifts, abandonment); Quasi-Monograde (separate spaces and grade groups, multi-year curriculum spans, whole class); and Differentiation (teacher differentiation of tasks and outcomes, and learner-centred materials differentiation). All eight describe how teachers transact learning and teaching in classes and small schools within systems designed for larger classes and larger schools. And, as the recent Tamil Nadu experience suggests, the graded learning materials approach is as relevant for large urban schools as for small rural schools.
5.4 Learning Outcomes
Several attempts have been made in the past to synthesise the results of studies on the relative effects on performance of multi- and monograde forms of teaching (for a review see Little, 2006b). Some studies report more beneficial achievement effects for students who learn in monograde settings. For example Kochar (2007) has recently reported that in Andhra Pradesh, India, students in multigrade schools perform at lower levels than in monograde schools. Rowley (1992) showed cognitive differences in favour of monograde schools in rural Pakistan. By contrast, in Burkina Faso and Togo, Jarousse and Mingat (1991) found that learners in multigrade classes performed better than those in monograde classes. In Colombia, within the Escuela Nueva programme, Grade 3 learners in the multigrade schools performed better in Spanish

Size matters for EFA
40
and maths and Grade 5 learners better in Spanish (Rojas and Castillo, 1988; Psacharopoulos et al, 1993; McEwan, 1998). In the Turks and Caicos Islands, Miller et al (1994; cited in Berry, 2001) found that learners in multigrade schools consistently outperformed those in monograde schools in the terminal grade of primary school. Berry (2001) found that learners in multigrade schools performed better on a test of reading than those in monograde schools, but that the advantage was greatest for the lowest achieving learners. And more recently, two recent Global Monitoring Reports on Education for All (2001, 2004) have reported research syntheses that underline the positive impact of multigrade teaching on learning levels in a number of countries. Earlier meta-analyses of results from developed countries indicate no clear pattern of results either way. Pratt (1986) reviewed 30 studies undertaken in the USA and Canada between 1948 and 1983. There was no general pattern in the achievement results. Learners in multigrade classes showed higher achievement in maths and reading in 10 studies, worse in five and no difference in 13. Miller’s subsequent review (1991) of research from the USA confirmed that learners in multigrade classes performed no better and no worse than students in monograde classes. Veenman’s (1995) review of studies, mainly from OECD countries, distinguished (i) multigrade classes formed of necessity from imbalanced or inadequate enrolments, (ii) single-grade classes, and (iii) multi-age, non-graded classes formed for pedagogical or philosophical reasons. Learning in multigrade or multi-age classes was neither inferior nor superior to that in monograde classes. Mason and Burns (1997) confirmed the general picture of no consistent cognitive achievement differences, a picture re-confirmed by Hattie (2002) who concludes that classroom effects are much more likely to be attributable to the quality of teaching and the expectations of principals, parents and pupils rather than to the composition of classes. Educators and parents value non-cognitive outcomes of learning as well as the cognitive. Pratt’s (1986) and Miller’s (1991) reviews identified studies that included measures of children’s friendships, self-concepts, altruism and attitudes to school. They both concluded that the socio-emotional development of learners in multigrade groups was greater than, or equal to, learners in monograde groups. Ford’s (1977) review of studies from the USA and UK reports both positive and negative findings on the reduction of anxiety levels, the maturity of friendship patterns and on personal and social adjustment, and positive findings on self-concept, self-esteem, and attitudes to school. Studies of the social effects of learning in multigrade settings in developing countries are few indeed and appear to be confined to evaluations of the Escuela Nueva multigrade programme in Colombia. An early evaluation credited the programme with positive effects on self-esteem and civic behaviour (Colbert et al, 1993). A subsequent study confirmed the positive effect for civic behaviour but not for self-esteem (Psacharopoulos et al, 1993). The work on the civic behaviour learning outcomes was developed further by Chesterfield (1994; reported in Forero-Pineda, Escobar-Rodriguez and Molina, 2006). Working in Escuela Nueva and ‘control’ group schools in Guatemala, Chesterfield reports that ‘democratic’ behaviours such as ‘turn-taking’, helping others, attitudes and participation in school organization were more common among students who had received their schooling in Escuela Nueva schools. Forero-Pineda et al (2006) extend this work further and examine in some detail the effects of

Size matters for EFA
41
participation in the Escuela Nueva programme in Colombia on ‘peaceful social interaction’, using measures along four dimensions – active respect, universal solidarity, fair play and equity. Children in Escuela Nueva schools demonstrated higher levels of peaceful social interaction than children in conventional schools. And comparisons between alumni of Escuela Nueva and conventional schools demonstrated differences in their attitudes to democracy. Escuela Nueva alumni were more inclined to be members of voluntary organisations and more inclined towards participatory democracy. Alumni from conventional schools were more inclined towards representative democracy. These findings are of considerable interest, but are most likely to be attributable to the active promotion of democratic behaviour in Escuela Nueva classes rather than the multigrade composition of classes. We are aware of at least two studies that address learning outcomes through teacher and educator perceptions. In a UNESCO/APEID study (1989: 5) of teacher perceptions of the benefits of multigrade teaching, educators from twelve countries in the Asia and Pacific Region identified the following beneficial learning outcomes: (i) learners develop self-study skills; (ii) learners learn to co-operate across age groups, resulting in collective ethics, concern and responsibility, and (iii) learners learn to help each other. Berry and Little (2006) report a study of the perceptions of 47 multigrade teachers and headteachers in London, England of positive learning opportunities presented by the multigrade classroom. The most commonly mentioned was the opportunity for ‘cognitive stretching’ of the younger, less able and lower achieving learners. The second was the opportunity for the use of peer tutoring learning strategies. While such strategies are not unique to multigrade classes, the strategy appears to work particularly well in the multigrade class. Unlike cognitive stretching, which was considered a benefit mainly for the less able, the lower achieving and the younger learner, peer tutoring was perceived to benefit all pupils, cognitively, socially and personally. More able, higher achieving and older learners ‘cement’ their learning through teaching and helping others. The less able, lower achieving and younger learners look up to and learn from others. A third commonly mentioned opportunity was ‘behaviour stretching’, or the opportunity for younger learners to learn appropriate social behaviours from the role models offered by older learners. In short, teachers perceived that the multigrade class presented learning benefits for both older and younger and higher achieving and lower achieving learners. Considerably more research on the learning outcomes of multigrade and monograde pedagogy is required. Attempts to synthesise the limited research evidence face at least three methodological issues. The first is that the terms ‘multigrade’ and ‘monograde’ embrace a very wide variety of classroom practices. As many have pointed out, some schools and classes are de facto multigrade. They arise out of necessity and teachers manage and cope as best they can. These are to be distinguished from schools and classes whose curricula and teaching and learning materials are planned around a multigrade class composition, and where multigrade is promoted as a positive pedagogy (Little, 2001; Little, 2006a). Similarly, teaching and learning practices in monograde classes vary enormously. Teachers use whole class, group and individual-based teaching is myriad ways. Studies that compare multigrade classes with ‘conventional’ classes usually fail to describe the teaching and learning practices that are typical in both multigrade and so-called conventional classes. Hence, we are rarely know which teaching and learning practices are being compared with what. Berry (2006) offers some useful insights. He sought to explain why, in a

Size matters for EFA
42
longitudinal study of monograde and multigrade classes conducted between 1993 and 1996 in the Turks and Caicos Islands, low achieving students in multigrade classes performed better than low achieving students in monograde classes. Re-visiting five of the ten schools previously studied to observe teaching and learning practices and to interview teachers about their pedagogy, he focussed specifically on teacher planning, assessment practices, grouping for instruction, and dependent, independent and interdependent learning. He observed four main points of difference between the monograde and multigrade classes. In the multigrade classes low achievers had more opportunities to revisit material and attain mastery. When teachers interacted with pupils it tended to be in the context of small rather than large groups. Learners appeared to engage in more independent work in the multigrade class which in turn provided more opportunities to learn how to learn. Finally, peer learning was practiced more often in multigrade. A second issue with the interpretation of ‘findings’ on the relative effects of multigrade and monograde teaching concerns the backgrounds of students. Few analyses separate the relative effects of home background and school experience on learning outcomes. And in the real world many of the characteristics of both are confounded. For example, in the most recently reported research on multigrade in Andhra Pradesh, India, Kochar (2007) reports that achievement levels are lower in multigrade schools than in schools where there is one teacher per grade. Schools in SC/ST habitations had an average of 2.6 teachers per school compared with schools in upper caste habitations with an average of five teachers, and average school sizes were also considerably lower in the former. While the fewer number of teachers in SC/ST habitations clearly influenced the type of teaching that is possible in schools in these locations, it is also the case that the achievement levels of students would be substantially influenced by the their home background. The reported analysis of achievement differences does not appear to have taken home background into account. A third issue is the trade-off between access and no access. All studies of the relative effects of multi- and monograde schooling on achievement only study children already enrolled in school. As pointed out in section 3.2, for many millions of children the only school that they may able to access in the coming decades is a multigrade school. Those who fail to enter school, or who dropout before the completion of primary are, by definition, excluded from such comparisons. For them the trade-off is between no access to any school and access to school, whether multi- or monograde. Studies of the cognitive and non-cognitive levels achieved by children in multi- and monograde schools should also include comparisons with the cognitive levels of out-of-school children, using non-school cognitive tests. This is not an easy research task, but not an impossible one. Cross-cultural psychology offers many pointers to assessments of the cognitive and non-cognitive skills of out-of-school and unschooled children (e.g. Cole, 2005).

Size matters for EFA
43
6. Does Class Size Matter?
The relative paucity of research on the impact of school size on achievement and other outcomes of schooling is more than compensated by the considerable size of literature on the relationship of class size with achievement on the one hand, and costs on the other. Many studies and several meta-analyses have been undertaken over recent years.
6.1 Research on Class Size in Developed Countries
Thirty years ago Haddad (1978) asked:
• Do pupils learn better in smaller classes than they do in larger classes? • Do the educational benefits of small classes, if they exist, justify the additional
costs? • Is there an optimum class size that maximises educational benefits and cost-
effectiveness? Haddad’s early review of 40 studies, mostly from North America, yielded inconclusive results. An increase in class size will not necessarily lead to a decrease in the level of academic achievement of pupils. A decrease in class size does not guarantee an improvement in the social environment of learning. What seems to make a difference is what teachers do with the learning and teaching opportunities offered by the size of the class. The attempt to compare studies was hampered by a number of methodological concerns, not the least of which was the absence of an agreed definition of small and large. A second issue was the treatment of size as a continuous variable as opposed to a categorical variable. In some systems, resource additions of various kinds are dependent on threshold sizes. An increase in class size from 30 to 35 may qualify for an extra teacher, whereas a similar increase of 5 students from 20 to 25 may not. A third issue was the use of a wide variety of measures for the similarly labelled variables, while a fourth was the range of values of variables included in the studies. Notably absent from many of the articles and meta-reviews of class size included in Haddad’s study is an indication of the range of values on the class size variable. For example, is the range of class size under review from 10-30, or from 30-60? In the early 1990s, Blatchford and Mortimore (1994) reviewed evidence from over 50 studies from the USA and Britain. Their analysis provided evidence of a positive link between class size and educational attainment in the early years of education, with classes smaller than 20 and for disadvantaged pupils. This finding accords with an ERIC review by Thomas conducted some years earlier (1984) who noted, additionally, that small classes are beneficial for the academically gifted and the disabled. Ten years ago Hanushek (1998) offered a more detailed meta-analysis of the evidence for the USA on the implications of reductions in class size for costs on the one hand and for learning outcomes on the other. In a telling historical analysis, he notes that large reductions in pupil:teacher ratios over the previous 25 years in the USA were not accompanied by improvements in student performance.

Size matters for EFA
44
In a subsequent meta-analysis Hanushek (2003) reports estimates from 376 production function studies that link a range of inputs to academic achievement through regression analysis. Of these, 276 offered estimates of the impact of the pupil:teacher ratio on academic achievement. The pattern of results shows a greater proportion of statistically insignificant results and an equal division among the remainder into positive and negative effects. These results are presented in Table 7. In one of the most widely cited studies of class size, the STAR experiment in the 1980s in the state of Tennessee, education authorities assigned children in Kindergarten randomly to regular classes of 22-24 students or small classes of 14-16 students. They were then followed up to Grade 3. Additionally, the regular classes were of two types, one with teacher aides and one without aides. Three main findings emerged. Students in small classes achieved at a significantly higher level in reading and mathematics than children in regular classes. Second, students in regular classes with aides and without aides performed at similar levels from Kindergarten through to Grade 3. Third, the size of the gap observed between small and regular classes was maintained through the first, second and third grades, but did not increase. The puzzle then is to know whether the gap observed at kindergarten level would have been maintained if children from the small classes had moved subsequently to large classes. Hanushek (1998) explores a number of interpretations of the findings and concludes that this single major random-assignment experiment
provides no support for widespread class size reductions, although it holds out hope for gains from reduced-size kindergartens (Hanushek, 1998: 33).
Table 7 Percentage Distribution of Effect of Key Resources on Student Performance, Based on 376 Production Function Estimates, USA
Source: Hanushek (2003) Other meta-reviews have updated the STAR experiment and reported that when the children in smaller kindergarten-grade 3 classes moved to regular class sizes in grades 5-7, achievement effects of one tenth to one fifth of a standard deviation persisted across a wide range of subjects. The more years students spent in small classes during grades kindergarten-3, the longer the performance benefits lasted from grades 4-8.

Size matters for EFA
45
The presence in the classes of teacher aides did not yield any performance benefits (Ehrenberg et al, 2001). The authors question the generalisability of the experiment whose design and results might be very dependent on the conditions under which it was conducted. This is a particularly salutary point when one considers the very different conditions surrounding classes in many developing countries, and especially those furthest away from meeting the goals of EFA.
In the case of class size in Tennessee for example, there was an ample supply of qualified teachers and no facilities shortages, and additional costs were borne by the state, such that implementation could proceed smoothly, without the need for reallocation of other resources (Ehrenberg et al, 2001: 50).
Even the best designed social experiment faces methodological challenges. In the Tennessee case there was no independent check on the achievement level of students assigned randomly to experimental and control classes. There was no guarantee that students would stay in the same treatment group for up to four years. Student attrition and the admission of late-entering students could not be prevented. Some of the grade 1 students had not attended the kindergarten class since this was not compulsory in the state at the time. And the effects of teacher expectations can never be ruled out. Teachers assigned to small classes may exaggerate class-size effects by increasing their efforts to fulfil what they believe is the point of the experiment. Conversely, teachers assigned to larger classes may understate the effects by increasing their efforts to show that they can overcome the handicap they believe is built into the experiment. Nonetheless Ehrenberg et al (2001) judge that the results suggest
There is a statistically significant effect of being in a class of 14-17 rather than a class of 23 in an environment of ample teachers and facilities, and this advantage appears to persist well into the upper grades, after students have returned to larger classes. Although the advantage is persistent, it is not cumulative. That is, the advantage that emerges in kindergarten and first grade does not become larger even when small classes are maintained in second and third grades. However, the early benefits of small class size, once established, persist at least through the upper elementary grades… Although there are a few legitimate concerns about the design and implementation of the study that could have been rectified with better data, it is very difficult to document that these cause considerable threat to the basic findings. We view the bigger threat as one of correct inference and interpretation of the results for policy, which is an issue of external validity rather than the technical merits of how internally valid the experiment was in practice (Ehrenbeg et al, 2001: 54).
Ehrenberg et al (2001) report other studies, less robust in design, which appear to support a positive relation between class size and student achievement especially in the early grades for classes below 20 and for at-risk students. They also report the outcomes of a well designed evaluation policy intervention in the state of Wisconsin, where the Student Achievement Guarantee in Education (SAGE) scheme reduced the pupil:teacher ratio to 15:1 in selected schools where 30% or more students lived in homes below the poverty line. The learning outcomes of these students were compared with those from comparison schools with students of similar achievement, enrolment, racial and income composition. Results from the first two years indicated an achievement gain of 0.2 standard deviation units among students in classes of 12-

Size matters for EFA
46
15 compared with those in classes of 21-25. African America students gained more than White students. Even if reductions in class size lead to improvements in learning outcomes, we need to understand better why this might be so. Size itself cannot determine learning outcomes. The possible reasons are many, including more contact between teachers and parents, more contact between teachers and students, or changes in instructional practices. However Ehrenberg et al (2001) find little evidence of consistent changes in teacher behaviour in smaller classes. This begs the question of what is happening in the small classes in those programmes that have yielded consistent positive results. According to Ehrenberg et al the most likely explanation
is that teachers whose instructional methods benefit from smaller classes – e.g. those who work with small groups, those who depend on personal relationships with students, those who emphasize hands-on project – are more productive with smaller than with larger classes. This interpretation is consistent with the finding that class size effects occur in the early elementary grades, are substantial and persistent, but do not accumulate beyond first or second grade. Kindergarten and first grade teachers in particular are especially likely to use small groups, hands-on projects, and rely on personal relationships with students, in contrast to teachers of older teachers whose instruction consists largely of whole-group lecture, recitation, and seatwork (Ehrenberg et al, 2001: 70).
The most recent review of class-size effects is offered by Wößmann and West (2006). Based on an analysis of the Third International Mathematics and Science Study (TIMSS) among 13 year olds, the design exploits the available evidence on the class size of groups in two adjacent grades of each school, as well as on the average class size in each grade of each school.
In a nutshell, we identify class-size effects by relating differences in the relative performance of students in two adjacent grades within individual schools to that part of the between-grade difference in class size in the school that reflects between-grade difference in average class size (Wößmann and West, 2006: 696).
Based on evidence from eleven countries – Belgium, Canada, Czech Republic, France, Greece, Iceland, Portugal, Romania, Singapore, Slovenia and Spain – the authors report sizable beneficial effects of smaller classes in Greece and Iceland. In Canada, Portugal, Singapore and Slovenia there is no effect and in French Belgium, the Czech republic, Romania and Spain the effects are small. It should be noted that the grade-average class sizes varied from 20.1 in Iceland to 33.2 in Singapore. However, there was a significant interaction between class size and teacher education in some countries, indicating that class-size effects are smaller, absolutely, where teachers are of higher quality. Smaller classes have beneficial effects only where the average capability of the teaching force is low.

Size matters for EFA
47
An apparent implication is that it may be a better policy to devote the limited resources available for education to employing more capable teachers rather than to reducing class sizes – moving more to the quality side of the quantity-quality trade-off in the hiring of teachers (Wößmann and West, 2006: 727)
They add
the merits of this admittedly speculative conclusion seem a promising topic for future research. They ask where are class-size reductions likely to be beneficial? (Wößmann and West, 2006: 727).
6.2 Research on Class Size in Developing Countries
The range of variation in class size across the world is much greater than across the developed world. The STAR study in the US explored a variation from 14 to only 24. Several of the meta-analyses fail to note the range of variation included in the studies they review. Given the strength of the evidential base from the US and UK, it would not be unreasonable to assume that the upper bound of the range included in studies was 45-50. Studies of the effects of class sizes greater than 50 are rarer, yet large class size in some developing country contexts can often mean classes of 50-90 or more. A study of student:teacher ratios in 120 estate primary schools in the Nuwara-Eliya district of Sri Lanka in 1989 showed a variation from 10 to 237. The student:teacher ratios in the ‘top’ twenty schools varied from 10 to 40 while the ‘bottom’ twenty varied from 99 to 237 (Little, 1999). In a study of the effects of class size on achievement outcomes in secondary schools in Bangladesh, Asadullah (2005) reports that larger classes yield more positive effects than small classes. It should be noted that in the Bangladesh case, the threshold at which new teachers are appointed is 60. However, Asadullah has not indicated whether children in classes of 50-60 are performing better than those in classes of 30-50. Nor do we know the range of class size included in the study, nor the interaction between class size and social class background. We know only that across the full range, children in smaller classes perform less well than children in larger classes. By contrast, Urquiola (2001) reports a study from schools and classes in rural Bolivia and shows that increased class size has a negative effect on achievement. Sullivan (2006) uses a definition from Valerien (1991) to suggest that a large class in a developing country is generally regarded to be 60 or more. Six countries in Africa record pupil:teacher ratios of between 60:1 and 68:1 (UNESCO, 2001a, quoted in Sullivan, 2006). Sullivan (2006) presents illustrations of what she considered to be effective teaching in four classes in Uganda, varying in size from 71 to 102. Key to the judgement of effectiveness was good use of group work and individual work within groups, the use of questioning, and the use of a variety of techniques, including whole-class approaches which did not rely purely on rote memorisation and repetition of information. Hanushek (1995) reviews education production function studies of the effects of class size in developing countries on academic achievement (Table 8). His meta-analysis included studies previously collated by Fuller (1985) and by Harbison and Hanushek

Size matters for EFA
48
(1992), amounting to a total of 96 production functions, 30 of which included estimates for a class size proxy in the form of teacher/pupil ratio. Table 8 Percentage of Estimated Expenditure Parameter Co-efficients from 96 Studies of Educational Production Functions in Developing Countries
Source: Hanushek (1995) Just less than half of these 30 did not achieve statistical significance, and the remainder were equally divided between those that found a positive effect of pupil:teacher ratio on achievement and those that found a negative effect. Clearly, the results are mixed. There appears to be no consistent relationship between pupil:teacher ratio and achievement. Nevertheless, it is important to bear in mind that these studies focus on a very wide range of contexts and may not be strictly comparable. The range of class sizes included in the studies is not reported.

Size matters for EFA
49
7. Implications for CREATE
This final section draws implications from the above for further research on access and for the CREATE Zones of Access model. It is clear from the above review that school and class-size effects on learning are contingent on social and economic context. The distribution of schools by size varies greatly from country to country. The proportion of small schools within developing country systems appears to be higher than in developed country systems. The limited evidence cited on class size in developing countries suggests that the range of class sizes in developing countries is greater than that in developed countries. The range of variation of both school size and class size within a system is likely to impact on the relationships found between either and on learning outcomes. At the same time, these studies have generated a range of insights that need to be borne in mind in the design of new studies on the determinants of academic achievement. Size may need to be treated as a categorical rather than continuous variable since in many systems resource additions of various kinds are dependent on threshold sizes. For example, a school that increases in size from 25 to 40 students may qualify for the appointment of an extra teacher, whereas an increase from 40 to 55 may nor. A class that increases from 30 to 35 may qualify for an extra teacher, whereas a similar increase of 5 students from 20 to 25 may not. Moreover, if reductions or increases in class or school size lead to changes in average student performance, one needs to know what is happening to the process of teaching and learning. Size, per se, cannot generate such changes, but size does, a priori, have implications for the way that teachers and learners interact. Other studies have pointed to the importance of teacher education and qualifications and to the interaction between these and class size. It may be that highly skilled teachers can manage a wide range of class sizes because they can deploy a range of teaching strategies. Less skilled and qualified teachers may find that large classes pose too many pedagogical challenges. At the same time, it should be noted that the finding that class size made no difference when teacher education and qualifications were high was contingent on a range of class size from 20 to 33. The Community and School Studies (COMMS) within CREATE are currently in their pilot stage. The following suggestions are offered to the field teams:
While information on school size is included in the COMMS formats, as is grade by grade enrolment, information should also be collected on the size of any centre offering pre-school provision and the daily attendance.
The numbers of students enrolled in and attending classes, both within and across grades, should be noted. Most studies of the effects of class size to date measure class size through the numbers officially enrolled in class. However, the gap between official enrolment and daily attendance can be very wide. Teacher attendance can also vary greatly between and within schools. A small-scale study in rural schools in Sri Lanka indicated that average daily attendance of students was 15% lower than enrolment and average teacher absenteeism was 32% (Little, 1999: 202). A combination of this information

Size matters for EFA
50
will provide a more accurate estimate of effective class size and also teaching input across a school year.
In the COMMS studies it is especially important to note whether the sizes of classes in the lower grades are significantly higher than those in the higher grades of primary. It is also important to describe how teachers are managing multiple classes in schools and whether they have received/are receiving curriculum, materials and other support for this type of teaching. Classes and schools may not be labelled as ‘multigrade’, but if a teacher is responsible at any one time for more than one grade then he/she is, perforce, required to manage one or more grades. This can be termed multigrade by default or de facto multigrade. How this is done will vary from school to school and class to class and should be noted in the field notes.
Observations of teaching and learning planned within the COMMS should make use of the three approaches/eight strategies framework outlined in section 5 for describing how teaching and learning is organised in de facto multigrade classes. It is likely that additional strategies will be observed in each of the field sites in Bangladesh, Ghana, India and South Africa. These should be described and used to extend the Avoidance, Quasi-Monograde and Differentiation (AQMD) framework.
The COMMS also need to explore whether larger proportions of children thought to be ‘at risk of exclusion’ (Zone 3) are found in larger classes. Life histories of selected students who have dropped out of school should also include information about the size of the classes and the school in which they were enrolled. Measures of class size included in future CREATE field studies should also distinguish between numbers officially enrolled in classes and the average number of students attending classes. In some systems, the gap between the two can be very wide, and, as we have seen above, a crucial question to address is what difference a small or large school or class might make to the way teachers behave and the way student learning is organised. In this regard, it is also important to explore the relationship between school size and teacher absenteeism. Does an increase in the number of teachers in a school increase teacher absenteeism and undermine the potential benefits of increased interaction between teachers and individual students offered in small classes? Any exploration of the question of the impact of school or class size on achievement, repetition, progression through or dropout from primary must ask the supplementary question of what impact does a change in size of school or class make on the process of teaching and learning. And surrounding these questions is the urban and rural context of the school and the home backgrounds of students. Students in larger classes and schools may perform better than in smaller classes and schools, but this difference may arise more as a function of the rural or urban school and home background of the students, as much as of the size of class or school. The use of multi-level modelling would lend itself well to the exploration of this question.
School size may also be relevant to the issue of transition from primary to secondary (Zone 5) in so far as large schools that are located too far away from student residences are less likely to create demand for secondary

Size matters for EFA
51
schooling than smaller schools located close to where students live. The COMMS studies should include information about the size of secondary schools and classes within reach of the primary schools under study.
The literature review has also identified a number of areas where policy decisions related to size could have a significant impact on reductions in the numbers of children included in various zones of exclusion. Policies on the establishment of schools that tolerate small enrolments could reduce the numbers of children in Zone 1. Teacher deployment policies that ensure that class sizes in the early foundational years of primary are small could also increase the numbers of children attracted to grade 1 primary (Zone 1) and reduce the numbers who dropout (Zone 2) in the early years of primary education. This is based on the assumption that teachers in small classes would give more attention to all children in their care than in a larger class. A radical restructuring of the curriculum and in the pedagogical strategies employed by curriculum developers and teacher educators could lead to learning activities in the classroom that ensure more student time on task and more engagement with stimuli for learning. This could contribute to a reduction in the numbers of children in exclusion Zones 2-6.

Size matters for EFA
52
References
Aggarwal, Y. (1997) Small Schools: Issues in Policy and Planning. NIEPA Occasional Paper 23. New Delhi: NIEPA.
Ahmed, M., Ahmed, K.S., Khan, N.I. and Ahmed, R. (2007) Access to Education in
Bangladesh: Country Analytic Review of Primary and Secondary Education. Falmer: CREATE, University of Sussex.
Aikman, S. and El Haj, H. (2006) ‘EFA for Pastoralists in North Sudan: A mobile
multigrade model for schooling’. In Little, A.W. (ed.) Education for All and Multigrade Teaching: Challenges and Opportunities. Dordrect, The Netherlands: Springer.
Akyeampong, A.K. (2006) ‘Extending Basic Education to Out-of-School Children in
Northern Ghana’. In Little, A.W. (ed.) Education for All and Multigrade Teaching: Challenges and Opportunities. Dordrect, The Netherlands: Springer.
Akyeampong, K., Djangmah, J., Seidu, A., Oduro, A. and Hunt, F. (2007) Access to
Elementary Education in Ghana: Country Analytic Review. Falmer: CREATE, University of Sussex.
Arnold, R. and Roberts, B. (1990) ‘Small Primary Schools: A report for education
officers and advisers’. International Journal of Educational Management, 4(5), pp. 4-12.
Asadullah, M.N. (2005) ‘The Effect of Class Size on Student Achievement: Evidence
from Bangladesh’. Applied Economic Letters, 12, pp. 217-221. Bell, A. and Sigsworth, A. (1987) The Small Rural Primary School: A Matter of
Quality. London: Falmer Press. Berry, C. (2001) ‘Achievement Effects of Multigrade and Monograde Primary
Schools in the Turks and Caicos Islands’. International Journal of Educational Development, 21(6), pp. 537-552.
Berry, C. and Little, A.W. (2006), ‘Multigrade Teaching in London, England’. In
Little, A.W. (ed.) Education for All and Multigrade Teaching: Challenges and Opportunities. Dordrect, The Netherlands: Springer.
Bharadwaj, N.S. and Boda, A. (1998) ‘Multigrade Teaching in Small Schools’. Paper
presented at the Conference of Learning Organisation, Community Participation and School Effectiveness at Primary Stage: International Perspectives, National Council of Educational Research and Training, Delhi.
Bhatacharjee, D.K. (1998) ‘How to Operationalise Research-based Interventions/
Strategies to Improve the Pedagogy of Rural Primary Schools in Multigrade Context?’. New Delhi: Regional Institute of Education, National Council of Education and Research and Training (NCERT).

Size matters for EFA
53
Blatchford, P. and Mortimore, P. (1994) ‘The Issue of Class Size for Young Children
in Schools: What can we learn from research?’. Oxford Review of Education, 20(4), pp. 411-428.
Blum, N. and Diwan, R. (2007) Small, Multigrade Schools and Increasing Access to
Primary Education in India: National Context and NGO Initiatives. London: CREATE Pathways to Access Research Monograph No 17.
Bray, M. (1987) Are Small Schools the Answer? Cost-effective Strategies for Rural
School Provision. London: Commonwealth Secretariat. Bray, M. (1989) Multiple-shift Schooling: Design and Operation for Cost-
Effectiveness. London: Commonwealth Secretariat. Bruns, B., Mingat, A. and Rakotomalala, R. (2003). Achieving Universal Primary
Education by 2015: A Chance for Every Child. Washington D.C.: The World Bank.
Chesterfield, R. (1994) ‘Indicators of Democratic Behaviour in Nueva Escuela
Unitaria (NEU) Schools’. Research Report. Guatemala: Academy for Educational Development, Juarez and Associates, Inc., and IDEAS Ltd. USAID.
Colbert, V., Chiappe, C. and Arboleda, J. (1993) The New School Program: More and
Better Primary Education for Children in Rural Areas in Colombia. In Levin, H.M. and Lockheed, M.E. (eds.) Effective Schools in Developing Countries. London: Falmer Press.
Cole, M. (2005) ‘Cross-cultural and Historical Perspectives on the Developmental
Consequences of Education’. Human Development, 48, pp. 195-216. Collingwood, I. (1991) Multiclass Teaching in Primary Schools: A Handbook for
Teachers in the Pacific. Apia, Western Samoa: UNESCO Office for the Pacific States.
Cornall, J.N. (1986) ‘The Small School: Achievements and problems’. Education
Today, 36(1), pp. 25-36. Cotton, K. (1996) ‘Affective and Social Benefits of Small-Scale Schooling’. ERIC
Digest [Internet], ERIC Clearinghouse on Rural Education and Small Schools. Available from <http://www.ericdigests.org/1997-2/small.htm>. [Accessed 17 September 2007].
Crossley, M and Holmes, K. (1999) Educational Development in the Small States of
the Commonwealth: Retrospect and Prospect. London: Commonwealth Secretariat.
Davies, E. (1992) ‘The Small Primary School: Problem or paradigm?’. Forum, 17(3),
pp. 76-78.

Size matters for EFA
54
Edmunds, E.L. and Bessai, F. (1977). ‘Small Schools’. Headteachers’ Review, 68(3), pp. 54-56.
Edmunds, E.L. and Bessai, F. (1978) ‘Small Schools’. Headteachers’ Review, 69, pp.
2-5. Ehrenberg, R.G., Brewer, D.J., Gamoran, A. and Willms, J.D. (2001) ‘Class Size and
Student Achievement’. Psychological Science in the Public Interest, 2(1), pp. 1-30. Ford, B.E. (1977) ‘Multiage grouping in the Elementary School and Children’s
Affective Development: A review of recent research’. The Elementary School Journal, November, pp. 149-159.
Forero, C., Escobar-Rodriguez, D. and Molina, D. (2006) ‘Escuela Nueva’s Impact on
the Peaceful Social Interaction of Children in Colombia’. In Little, A.W. (ed.) Education for All and Multigrade Teaching: Challenges and Opportunities. Dordrecht: Springer.
Forward, B. (1988) Teaching in the Smaller School. Cambridge: Cambridge
University Press. Francis, L.J. (1992) ‘Primary School Size and Pupil Attitudes: Small is happy?’.
Educational Management and Administration, 20(2), pp. 100-104. Galton, M. (1993) ‘Managing Education in Small Primary Schools’. Association for
the Study of Primary Education (ASPE) Paper No 4. Stoke-on-Trent: Trentham Books.
Galton, M. and Patrick, H. (eds.) (1990) Curriculum Provision in the Small Primary
School. London: Routledge. Govinda, R. and Bandyopadhyay, M. (2007) Access to Elementary Education in
India: Country Analytical Review. Falmer: CREATE, University of Sussex. Gregory, R. (1975) ‘The Educational Advantages of the Small Primary School’.
Forum, 17(3), pp. 79-81. Gupta, D., Jain, M. and Bala, N. (1996) ‘Multi-grade Teaching: Status and
Implications’. New Delhi: National Council of Education and Training (NCERT). Haddad, W.D. (1978) ‘Educational Effects of Class Size’. World Bank Staff Working
Paper, No 280. Washington D.C: World Bank. Hanushek, E.A. (1998) ‘Interpreting Recent Research on Schooling in Developing
Countries’. World Bank Research Observer, 10(2), pp. 227-216. Hanushek, E.A. (1998) ‘The Evidence of Class Size’. Occasional Paper, No 98-1. W.
Allen Wallis Institute of Political Economy, University of Rochester.
Size matters for EFA
55
Hanushek, E.A. (2003) ‘The Failure of Input-based Schooling Policies’. Economic Journal, 113(485), pp. 64-98.
Hargreaves, L., Comber, C. and Galton, M. (1996), ‘The National Curriculum: Can
Small Schools Deliver? Confidence and Competence Levels of Teachers in Small Rural Primary Schools’. British Educational Research Journal, 22(1), pp. 89-99.
Harrison, D.A. and Busher, H. (1995) ‘Small Schools, Big Ideas: Primary Education
in Rural Areas’. The British Journal of Educational Studies, 43(4), pp. 384-397. Hattie, J.C. (2002) ‘Classroom Composition and Peer Effects’. International Journal
of Educational Research, 37, pp. 449-481. Hopkins, D. and Ellis, P.D. (1991) ‘The Effective Small Primary School: Some
significant factors’. School Organisation, 11(1), pp. 115-122. Irmsher, K. (1997) ‘School Size’. ERIC Digest [Internet]. Available from:
<http://eric.uoregon.edu/publications/digests/digest113.html> [Accessed 10 November 2007].
Jarousse, J.-P. and Mingat, A. (1991) ‘Efficacite pedagogique de l’enseignment a
cours multiples dans le contect africain’. IREDU-CNRS: University of Dijon. Kamat, K. (1998) ‘Management and Organisation of Learning in Multilevel/
Multigrade Situations for School Effectiveness’. Paper delivered at the Seminar on Studies on Learning Organisation, Community Participation and School Effectiveness at Primary Stage: International Perspective. National Council of Educational Research and Training, New Delhi, India.
Kataoka, S. (2006) Does Educational Decentralisation Work?: An Exploration of
Policy Practice and Outcomes in Sri Lanka. Unpublished DPhil thesis, University of Sussex.
Keast, D. (1987) Small Primary Schools. Perspectives Series No. 30. Exeter: School
of Education, University of Exeter. Keast, D. (1991) Small Schools in Clusters. Exeter: Exeter Small Schools Network. Keast, D. (1992a) Small Rural Primary Schools: A Resource Book. Exeter: Exeter
Small Schools Network. Keast, D. (1992b) Small Schools After ERA: 1992 (The Second) Survey. Exeter:
Exeter Small Schools Network. Kochar, A. (2007) ‘Do Schooling Policies Contribute to Schooling Inequality? School
location policies in rural India’. Policy Brief [Internet], Stanford Institute of Economic Policy Research. Available from: < http://siepr.stanford.edu/papers/briefs/policybrief_Nov07.html> [Accessed 10 February 2008].

Size matters for EFA
56
Laukkanen, R. and Selventoinen, P. (1978) Small Schools and Combined Grades in Finland. Paris: OECD, Centre for Educational Research and Innovation.
Lewin, K.M. (2006) ‘Costs and Finance of Multigrade Strategies for Learning: How
do the books balance?’ in Little, A.W. (ed.) Education for All and Multigrade Teaching: Challenges and Opportunities. Dordrecht: Springer.
Lewin, K.M. (2007) Improving Access, Equity and Transitions in Education:
Creating a Research Agenda. Falmer: CREATE Pathways To Access Research Monograph No 1.
Little, A.W. (1995) Multigrade Teaching: A Review of Research and Practice. Serial
No 12. London: Overseas Development Administration. Little, A.W. (1999) Labouring to Learn: Towards a Political Economy of Plantations,
People and Education in Sri Lanka. Basingstoke: Macmillan. Little, A.W. (2001) ‘Multigrade Teaching: Towards an international research and
policy agenda’. International Journal of Educational Development, 21(6), pp. 481-498.
Little, A.W. (2004) ‘Learning and Teaching in Multigrade Settings’. Paper prepared
for the UNESCO 2005 EFA Monitoring Report. Available from: <http://www.ioe.ac.uk/multigrade/selected_texts.html>.
Little, A.W. (ed.) (2006) Education for All and Multigrade Teaching: Challenges and
Opportunities. Dordrecht: Springer. Little, A.W. (2006a) ‘Education for All: Multigrade realities and histories’. In Little,
A.W. (ed.) Education for All and Multigrade Teaching: Challenges and Opportunities. Dordrecht: Springer.
Little, A.W. (2006b) ‘Multigrade Lessons for EFA: A synthesis’. In Little, A.W. (ed.)
Education for All and Multigrade Teaching: Challenges and Opportunities. Dordrecht: Springer.
Little, A.W. and Pridmore, P. (2004) ‘The MUSE Training Programme: A final
evaluation’. Mimeo. London: Institute of Education. Lovell, C.H. and Fatema, K. (1989) Assignment Children. The BRAC Non-Formal
Primary Education Programme in Bangladesh. New York: United Nations Children’s Fund.
Lungwangwa, G. (1989) ‘Multi-grade Schools in Zambian Primary Education: A
Report on the Pilot Schools in Mkushi District’. Stockholm: Swedish International Development Authority.
Mason, D.A. and Burns, R.B (1997) ‘Reassessing the Effects of Combination Classes’.
Educational Research and Evaluation, 3(1), pp. 1-53.
Size matters for EFA
57
McEwan, P. (1998) ‘The Effectiveness of Multigrade Schools in Colombia’. International Journal of Educational Development, 18(6), pp. 435-452.
Mehta, A.C. (2006) Elementary Education in India: Analytical Report 2004-05.
Delhi: National Institute of Educational Planning and Administration. Menon, L. and Rao, P. (2004) ‘Multigrade for Remote and Disadvantaged Schools’.
Paper delivered at the Second International Multigrade Teaching Conference: Turning Biases into Benefits, Armidale Centre for Research on Education in Context, University of New England.
Miller, B.A. (1989) The Multigrade Classroom: A Resource Handbook for Small
Rural Schools. Oregon: Regional Education Laboratory. Miller, B.A. (1990). ‘A review of the quantitative research on multigrade instruction’,
Journal of Research in Rural Education, 7(1), pp. 1-8. Miller, B.A. (1991a) ‘Teaching and Learning in the Multigrade Classroom: Student
Performance and Instructional Routines’. ERIC Digest [Internet], ERIC Clearinghouse on Rural Education and Small Schools. Available from: <http://www.eric.ed.gov/contentdelivery/servlet/ERICServlet?accno=ED335178> [Accessed December 2007].
Miller, B.A. (1991b) ‘A review of the qualitative research on multigrade education’,
Journal of Research in Rural Education, 7(2), pp. 3-12. NCERT [National Council of Educational Research and Training] (2006) National
Curriculum Framework for Teacher Education – DRAFT. New Delhi: National Council of Educational Research and Training. Available from: <http://ncte-in.org/curriculum250906.pdf> [Accessed 5 March 2007].
OFSTED. (2000) Small Schools: How Well Are They Doing? London: OFSTED. Padmanabha Rao, Y.A. (2005) ‘Quality Schooling: Enriching the commons’. Paper
delivered at the 8th UKFIET International Conference on Education and Development, Oxford, 13-15 September, 2005.
Pratt, D. (1986) ‘On the Merits of Multigrade Classrooms’. Research in Rural
Education, 3(3), pp. 111-115. Pridmore, P. (2006) ‘Education for All: The paradox of multigrade education’. In
Cornish, L. (ed.) Reaching EFA Through Multigrade Teaching. Armidale: Kardooraire Press.
Pridmore, P. with Vu Son (2006) ‘Adapting the Curriculum for Teaching Health in
Multigrade Classes in Vietnam’. In Little, A.W. (ed.) Education for All and Multigrade Teaching: Challenges and Opportunities. Dordrecht: Springer.

Size matters for EFA
58
Psacharopoulos, G., Rojas, C. and Velez, E. (1993) ‘Achievement Evaluation of Colombia’s Escuela Nueva: Is multigrade the answer?’ Comparative Education Review, 37(3), pp. 263-276.
Raywid, M.A. (1999) ‘Current Literature on Small Schools’. ERIC Digest [Internet],
ERIC Clearinghouse on Rural Education and Small Schools. Available from: <http://www.ericdigests.org/1999-3/small.htm> [Accessed 23 October 2007].
Rishi Valley Education Centre. (2000) ‘Report of the Second National Workshop on
Planning and Implementation of Multigrade Programmes’. Rishi Valley, Andhra Pradesh: Rishi Valley Education Centre, Krishnamurti Foundation, India.
Rojas, C. and Castillo, Z. (1988) ‘Evaluación del Programa Escuela Nueva en
Colombia’. Bogota: Instituto Ser de Investigaciones. Rowley, S.D. (1992) Multigrade Classrooms in Pakistan: How Teacher Conditions
and Practices Affect Student Achievement. Unpublished PhD thesis, Harvard University.
Saloshini, M. (1999). ‘Case Studies of Multigrade Teaching in India and Canada:
Implications for improving primary school effectiveness’. Conference Proceedings from the International Seminar of Researches in School Effectiveness at Primary Level, National Council of Educational Research and Training, New Delhi, India.
Schütz, G. (2006) ‘School Size and Student Achievement in TIMSS 2003’. In
Loveless, T. (ed.) Lessons Learned: What International Assessments Tell Us about Mathematics Achievement. Washington, DC: Brookings Institution Press.
Shabnam, S. (1998) Vidhi mein nidhi (A Trainer’s Handbook on Multigrade
Teaching). National Council of Educational Research and Training, Bihar, India. South African Department of Education. (2003) ‘Report to the Minister: A review of
the financing, resourcing and costs of education in public schools’. Pretoria: South African Department of Education.
Sri Lanka Ministry of Education and Higher Education. (1998) School Census Report
for 1997. Isurupaya: Sri Lanka Ministry of Education and Higher Education. Sri Lanka Ministry of Education and Higher Education. (2005) School Census Report
for 2005. Isurupaya: Sri Lanka Ministry of Education and Higher Education. Sullivan, M.C. (2006) ‘Teaching Large Classes: The international evidence and a
discussion of the some good practice in Ugandan primary schools’. International Journal of Educational Development, 26, pp. 24-37.
Suzuki, T. (2006) ‘Multigrade Teachers and their Training in Rural Nepal’. In Little,
A.W. (ed.) Education for All and Multigrade Teaching: Challenges and Opportunities. Dordrecht: Springer.
Size matters for EFA
59
Swarnalekha, N. (1999) ‘Application of Multiple Interventions for Reducing the Work Load of Teachers and Enhancement in Attainment of Competencies in Students of Rural Multigrade Primary Schools’. Paper presented at the International Seminar on Researches in School Effectiveness at Primary Level: National Council for Educational Research and Training, New Delhi, India.
Teachernet (2007a) ‘Analysis of small schools by local authority’ [Internet].
Available from: <www.teachernet.gov.uk/_doc/8259/Analysis_of_small_schools_by_local_authority.doc> [Accessed 11 July 2007].
Teachernet (2007b) ‘Average school sizes’ [Internet]. Available from:
<http://www.teachernet.gov.uk/management/fallingschoolrolls/context/schoolsizes/> [Accessed 11 July 2007].
Teachernet (2007c) ‘High cost of small schools’ [Internet]. Available from:
<www.teachernet.gov.uk/management/fallingschoolrolls/context/smallschools/> [Accessed 11 July 2007].
Thomas, C. & Shaw, C. (1992) Issues in the Development of Multi-grade Schools.
Washington: World Bank. UNESCO (2001). Is the World on Track? EFA Global Monitoring Report 2002. Paris:
UNESCO. UNESCO. (2004) EFA: The Quality Imperative. EFA Global Monitoring Report 2005.
Paris: UNESCO. UNESCO. (2007) Education for All by 2015. Will We Make It? EFA Global
Monitoring Report 2008. Paris: UNESCO. UNESCO/APEID (1989) Multigrade Teaching in Single Teacher Primary Schools.
Bangkok: Asia and the Pacific Programme of Educational Innovation for Development.
Urquiola, M.S. (2001) ‘Identifying Class Size Effects in Developing Countries:
Evidence from Rural Schools in Bolivia’. World Bank Policy Research Working Paper No 2711. Washington, D.C.: World Bank Development Research Group, Public Services for Human Development Team.
Veenman, S. (1995) ‘Cognitive and Non-cognitive Effects of Multigrade and Multi-
age Classes: A best-evidence synthesis’. Review of Educational Research, 65(4), pp. 319-381.
Valerien, J. (1991) ‘Innovations for Large Classes: A guide for teachers and
administrators’. UNESCO Educational Studies and Documents, No 56. Paris: UNESCO.

Size matters for EFA
60
Vithanapathirana, M. (2006) ‘Adapting the Primary Mathematics Curriculum in the Multigrade Classroom in Rural Sri Lanka’. In Little, A.W. (ed.) Education for All and Multigrade Teaching: Challenges and Opportunities. Dordrecht: Springer.
Vu Son, T. and Pridmore, P. (2006) ‘Improving the Quality of Health Education in
Multigrade Schools in Vietnam’. In Little, A.W. (ed.) Education for All and Multigrade Teaching: Challenges and Opportunities. Dordrecht: Springer.
Vulliamy, G., Kimonen, E., Nevalainen, R. and Webb, R. (1997) ‘Teacher Identity
and Curriculum Change: A comparative case-study analysis of small schools in England and Finland’. Comparative Education, 33(1), pp. 97-115.
Vulliamy, G. and Webb, R. (1995) ‘The Implementation of the National Curriculum
in Small Primary Schools’. Educational Review, 47(1), pp. 25-41. Williams, D.T. (1990) ‘The Dimensions of Education: Recent research on school size’.
Working Paper Series. Clemson, SC: Clemson University, Strom Thurmond Institute of Government and Public Affairs.
World Bank. (2005) ‘Treasures of the Education System in Sri Lanka: Restoring
performance, expanding opportunities and enhancing prospects’. Colombo, Sri Lanka: World Bank.
Wößmann, L. and West, M. (2006) ‘Class-size Effects in School Systems Around the
World: Evidence from between-grade variation in TIMSS’. European Economic Review, 50(3), pp. 695-736.

Report summary: This monograph reviews literature on school and class size for its relevance to the concerns of CREATE. It estimates the numbers of small schools and numbers of children learning in small schools worldwide. It assesses the implications of school size, large and small, for learning outcomes, costs and for social equity. It outlines how policy ‘issues’ of size, large and small, are constructed and presented in a range of education systems. It identifies the curriculum, teaching and learning issues associated with small schools and examples of good practice and discusses the evidence on learning outcomes in small, multigrade schools. It synthesises the research on class size, large and small, in developed and developing countries, and identifies its relevance for EFA Goals 2, 5 and 6. Finally, the monograph draws implications for on-going and future CREATE studies, in particular the Community and School studies in Bangladesh, Ghana and India. Author notes: Angela W little is Professor of Education and International Development at the Institute of Education of the University of London and founding member of the recently-established London International Development Centre. She directs the Institute’s partnership within the CREATE consortium. For more than 30 years she has worked on educational policy and planning, access to primary education and multigrade pedagogy, with special reference to developing countries. In 1999 undertook she undertook the evaluation of the work of the International Consultative Forum on Education for All. Her books include EFA and Multigrade Teaching: challenges and opportunities (2006), Education and Development in a Global Era (2007), Labouring to Learn (1999), and Beyond Jomtien: implementing primary education for all (1994).
Address for Correspondence: CREATE, Centre for International Education Sussex School of Education, University of Sussex Brighton BN1 9QQ, UK. Website: http://www.create-rpc.org Email: [email protected]