Sit or Fit? Work Wellness! - Chatham-Kent...10/8/2015 1 Sit or Fit? Work Wellness! Shauna M. Burke,...
27
10/8/2015 1 Sit or Fit? Work Wellness! Shauna M. Burke, PhD, School of Health Studies Michael J. Rouse, PhD, Richard Ivey School of Business Our Discussion Today Definition and benefits of physical activity Definition and risks of sedentary behaviour Example “Move More/Sit Less” workplace initiatives Sun Life – Ivey Canadian Wellness ROI Study Q & A 2
Transcript of Sit or Fit? Work Wellness! - Chatham-Kent...10/8/2015 1 Sit or Fit? Work Wellness! Shauna M. Burke,...

10/8/2015
1
Sit or Fit? Work Wellness!Shauna M. Burke, PhD, School of Health StudiesMichael J. Rouse, PhD, Richard Ivey School of Business
Our Discussion Today
Definition and benefits of physical activityDefinition and risks of sedentary behaviourExample “Move More/Sit Less” workplace
initiativesSun Life – Ivey Canadian Wellness ROI
StudyQ & A
2
10/8/2015
2
3
What is Physical Activity?
Any bodily movement produced by skeletal muscles that requires energy expenditure
World Health Organization (2015)
4
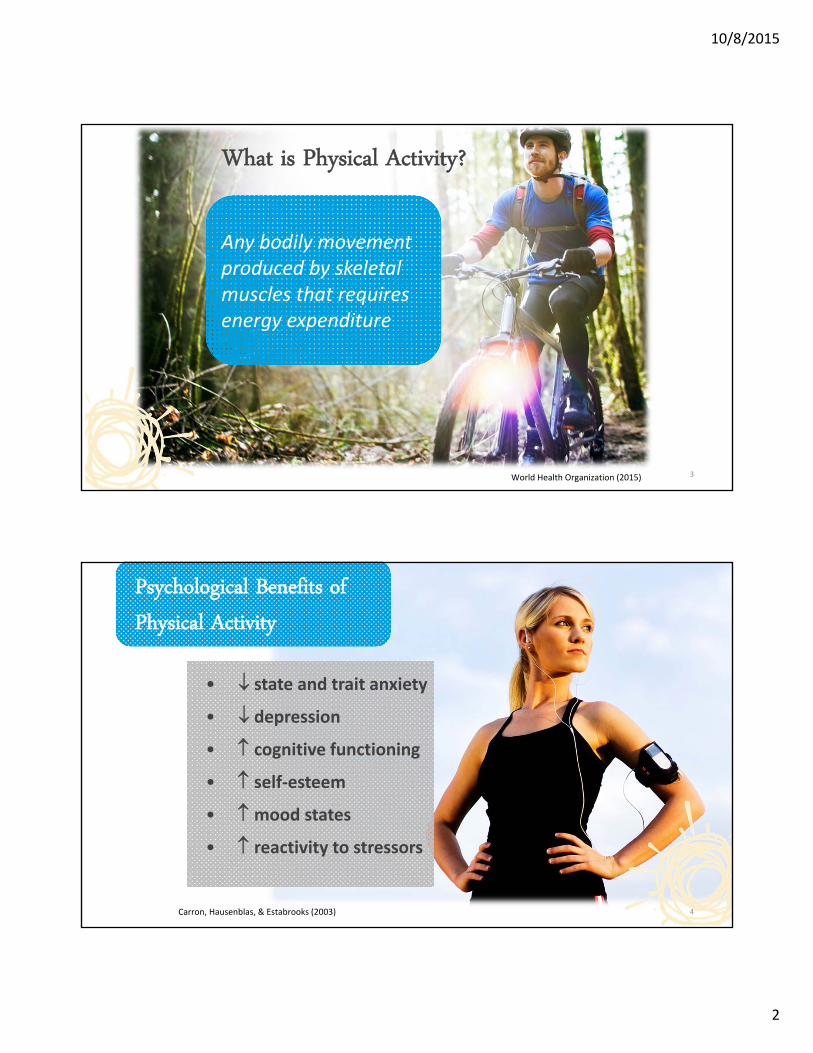
Psychological Benefits of Physical Activity
• state and trait anxiety
• depression
• cognitive functioning
• self‐esteem
• mood states
• reactivity to stressors
Carron, Hausenblas, & Estabrooks (2003)

10/8/2015
3
Physiological Benefits of Physical Activity
5World Health Organization (2015)
• bone and functional health
• muscular and cardiorespiratory fitness
• risk of hypertension, coronary heart disease, stroke, diabetes, breast and colon cancer
• risk of falls and hip or vertebral factures
• weight control and energy balance
6
Inactivity the incidence of at least 17 unhealthy conditions:
Obesity Coronary heart disease Type 2 diabetes Some cancers
“We know of no single intervention with greater promise than physical exercise to reduce the risk of virtually all chronic diseases simultaneously” (p.778)
Booth, Gordon, Carlson, & Hamilton (2000)
Consequences of Inactivity

10/8/2015
4
Physical Activity Guidelines
7Canadian Society for Exercise Physiology (2011)
Prevalence of Physical Activity
8
Approximately 47% of Canadian adults are inactive• More men (55%) than women (51%) are active
Globally, at least 1 in 4 adults fails to
achieve the minimum recommendation ofdaily physical activity

10/8/2015
5
9
What is Sedentary Behaviour?
Wilmot et al., 2015
Any waking sitting or lying behaviour with low energy expenditure
10Physical Activity Resource Centre & Ontario Physical Education Association, 2015
10/8/2015
6
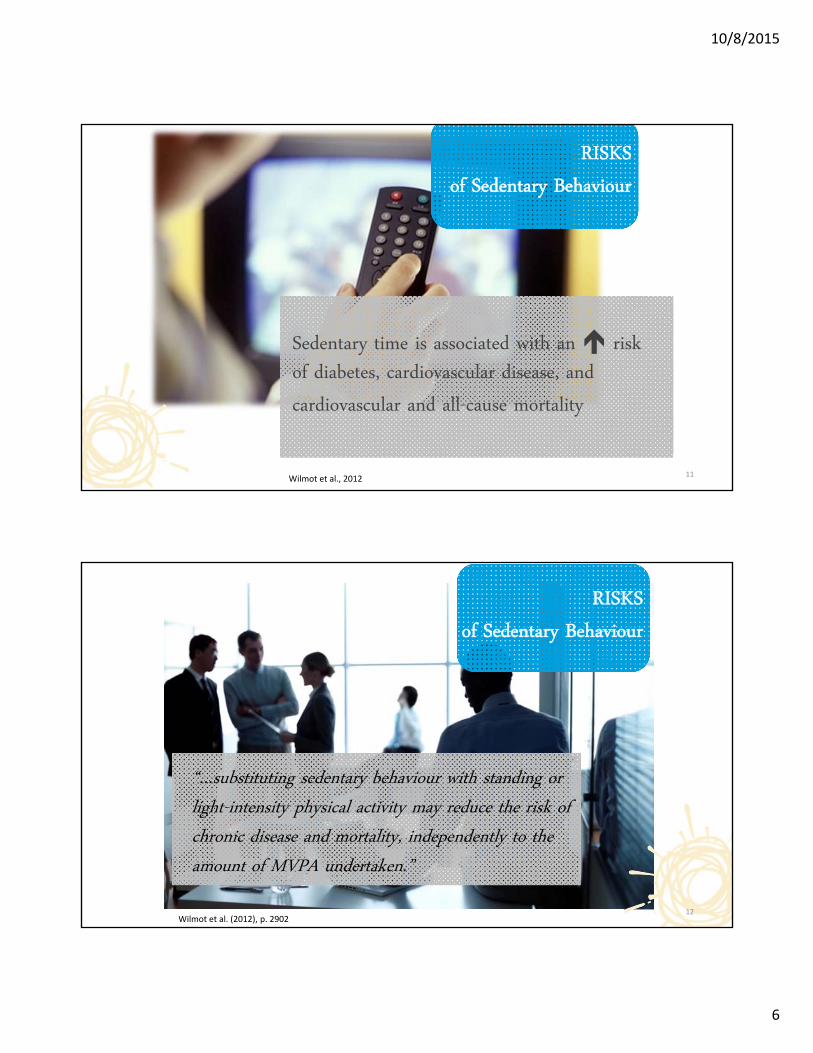
RISKSof Sedentary Behaviour
Sedentary time is associated with an risk of diabetes, cardiovascular disease, and cardiovascular and all-cause mortality
11Wilmot et al., 2012
12
RISKSof Sedentary Behaviour
“…substituting sedentary behaviour with standing or light-intensity physical activity may reduce the risk of chronic disease and mortality, independently to the amount of MVPA undertaken.”
Wilmot et al. (2012), p. 2902

10/8/2015
7
The estimated total health care costs of physical inactivity in Canada in 2009 were $6.8 billion
13Janssen (2012)
Economic Impact of Physical Inactivity
Moving forward…
14

10/8/2015
8
Move More/Sit Less Workplace Initiatives
A purposeful approach is the key to greater success.
15
16
10/8/2015
9
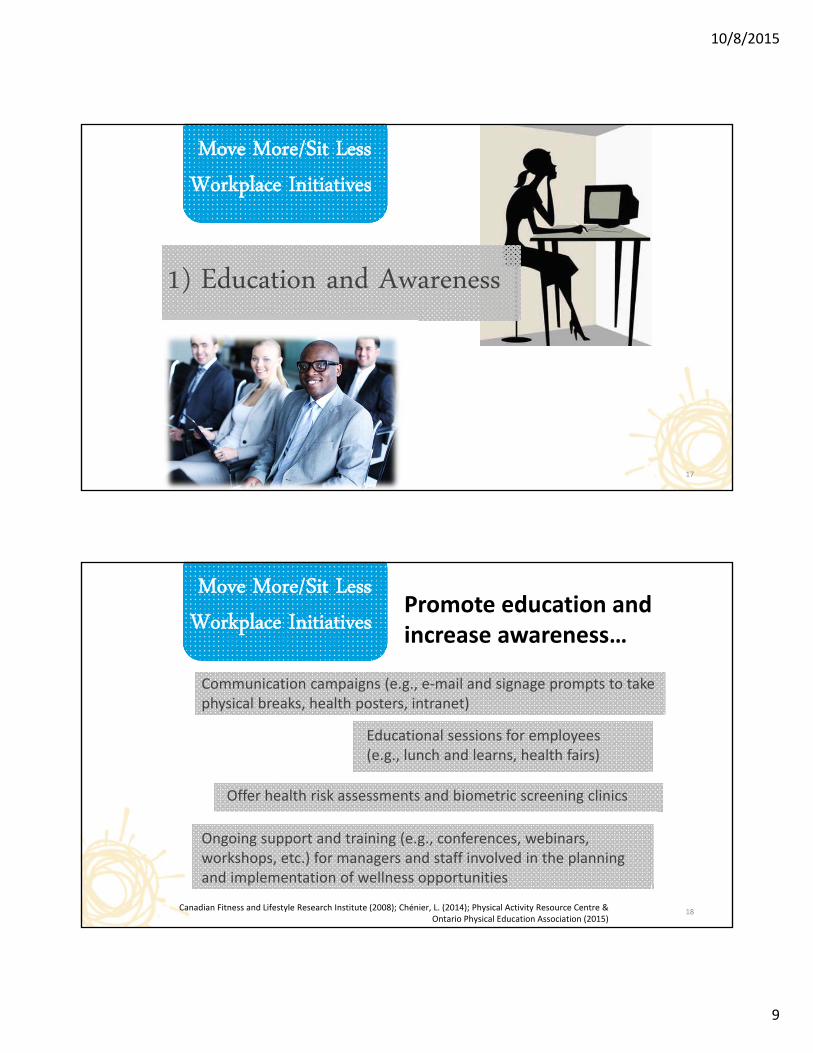
Move More/Sit Less Workplace Initiatives
1) Education and Awareness
17
Communication campaigns (e.g., e‐mail and signage prompts to take physical breaks, health posters, intranet)
Offer health risk assessments and biometric screening clinics
18
Educational sessions for employees (e.g., lunch and learns, health fairs)
Move More/Sit Less Workplace Initiatives Promote education and
increase awareness…
Ongoing support and training (e.g., conferences, webinars, workshops, etc.) for managers and staff involved in the planning and implementation of wellness opportunities
Canadian Fitness and Lifestyle Research Institute (2008); Chénier, L. (2014); Physical Activity Resource Centre & Ontario Physical Education Association (2015)

10/8/2015
10
Move More/Sit Less Workplace Initiatives
2) Supportive Environment
19
Improve stairwell appearance and signage to encourage stair use
20
Move More/Sit Less Workplace Initiatives
Provide on‐site gym facilities or local gym discounts
Organize active lunch time activities
Encourage healthy snacks during meetings
Create a health library/resource centre, online resources, newsletters
Create a favourable and supportive environment for wellness…
Sponsor community events, local sports teams, or activity‐related sessions in the community (e.g., free public skating or swimming)
Canadian Fitness and Lifestyle Research Institute (2008); Chénier, L. (2014); Physical Activity Resource Centre & Ontario Physical Education Association (2015)

10/8/2015
11
Move More/Sit Less Workplace Initiatives
3) Create a “Sit Less” Environment
21
Encourage employees to get up from their desks every 20‐30 minutes
Provide extra‐long telephone cords or telephone headsets
22
Promote standing or walking meetings
Chénier, L. (2014); Physical Activity Resource Centre & Ontario Physical Education Association (2015)
Move More/Sit Less Workplace Initiatives
Introduce height‐adjustable desks
Organize work tasks so employees can stand or sit while working
Introduce short stretch breaks every 30 minutes during meetings
Make it easy to “sit less” at work…
30

10/8/2015
12
Move More/Sit Less Workplace Initiatives
23
4) Healthy Policies
24
Organizational Change Model
Crossan, Rouse, Fry, & Killing (2013)
OrganizationalChange
Behaviour
Behaviour
Behaviour
Culture
Culture
Culture
Leverage Point
ManagementProcesses
Leverage Point
LeadershipBehaviour
Leverage Point
OrganizationStructure

10/8/2015
13
25Canadian Fitness and Lifestyle Research Institute (2008); Chénier, L. (2014); Physical Activity Resource Centre &
Ontario Physical Education Association (2015)
Move More/Sit Less Workplace Initiatives
Start a wellness committee (and allow those who participate to do so during work hours)
Create healthy policies…
Include employees in the development of wellness policies, programs, and opportunities to ↑ interest and participation
Establish policies to overcome barriers to physical activity (e.g., flexible hours, active breaks, telecommuting, etc.)
Consider an employee survey to identify barriers and enablers
Encourage senior staff and managers to be active
Move More/Sit Less Workplace Initiatives
5) Group-Based Initiatives
26

10/8/2015
14
27Burke et al. (2006)
“Home‐basedprograms”
“Group‐basedprograms”
Home‐basedContact
Home‐basedIsolation
“True” Groups
Collectives
28Burke et al. (2006)
True Groups
Collectives
ES = .74* (n = 10)
Home – Isolation
ES = .72*(n = 6)
Home – Contact
ES = .09(n = 18)
* p < .05
Intervention protocols fall along a continuum of effectiveness:
10/8/2015
15
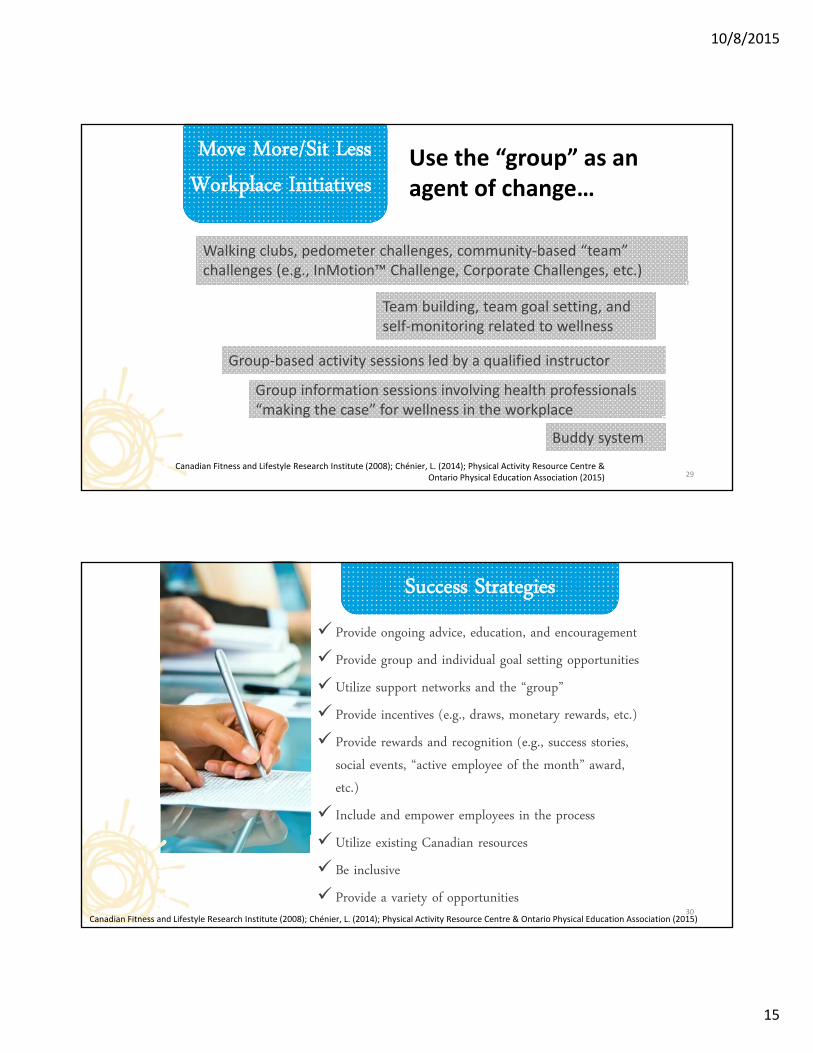
Walking clubs, pedometer challenges, community‐based “team” challenges (e.g., InMotion™ Challenge, Corporate Challenges, etc.)
29
Move More/Sit Less Workplace Initiatives
Team building, team goal setting, and self‐monitoring related to wellness
Group‐based activity sessions led by a qualified instructor
Use the “group” as an agent of change…
Group information sessions involving health professionals “making the case” for wellness in the workplace
Canadian Fitness and Lifestyle Research Institute (2008); Chénier, L. (2014); Physical Activity Resource Centre & Ontario Physical Education Association (2015)
Buddy system
Success Strategies Provide ongoing advice, education, and encouragement Provide group and individual goal setting opportunities Utilize support networks and the “group” Provide incentives (e.g., draws, monetary rewards, etc.) Provide rewards and recognition (e.g., success stories,
social events, “active employee of the month” award, etc.)
Include and empower employees in the process Utilize existing Canadian resources Be inclusive Provide a variety of opportunities
30Canadian Fitness and Lifestyle Research Institute (2008); Chénier, L. (2014); Physical Activity Resource Centre & Ontario Physical Education Association (2015)

10/8/2015
16
Seizing the Opportunity Requires both…
The Health Caseand
The Business Case for Wellness
31
• Strategic alliance between Sun Financial and Ivey Business School to determine the impact of workplace wellness on employee and organizational health as well as company costs
THE STUDY

10/8/2015
17
IVEY RESEARCH TEAM
Project Manager: Elisa M. Yaquian, MScData Analyst: Rodney T. Tembo, MSc MSc student: Shivani Parihar Student volunteer: Jaymie O. Varenbut
Professors: Dr. Greg Zaric, Dr. Sisir Sarma, Dr. Michael J. Rouse,Dr. Shauna Burke, Dr. Charlice Hurst
Postdoctoral fellows: Dr. Adebayo Aderounmu & Dr. Josephine JacobsPhD students: Vivek Astvansh, Ellen Choi, Ken Xiao
STUDY MILESTONES
20122011
STUDY INITIATED ANALYSIS OF RESULTS
PRELIMINARY RESULTS
FINAL RESULTS
2016201520142013
(Q2 2015 – Q1 2016)(Q2 2011 – Q2 2012)
PHASE 1 (Complete)A meta-analysis of global workplace wellness research meeting strict criteria
PHASE 2 (Complete)In-field study including a two-year wellness program
implemented by six organizations
(Q1 2013 – Q2 2015)

10/8/2015
18
PHASE 1 OVERVIEWMeta-analysis of global workplace wellness research meeting strict criteria
Analysis | Differences in differences
‐ Treatment Grouptime1 2 3 4
This wellness stuff looks great!!
‐ Control Group
This wellness stuff IS great!!

10/8/2015
19
PHASE 1 RESULTS
Wellness programs save
1.5 – 1.7 days of absenteeism(ROI Study, Phase 1)
Absenteeism ranges from 4.7 to 11.2 days
(Statistics Canada, 2011)
PHASE 2 OVERVIEW & MEASURES
• Wellness program participation
• Health habits
• Productivity
• Biometric measures
• Benefit claims data
• Absence
• Employee retention
• Organizational Wellness Index

10/8/2015
20
PHASE 2 OVERVIEWA two year in-field study of a comprehensive wellness program
• Implemented in 6 organizations
• Treatment & control groups
• Distinct locations
• Multiple Sites
INDUSTRIES & JOB CATEGORIES
14%
9%
4%1%
24%10%
37%
1%
Job Category Administrative support
Customer service/Sales
Executive
Fabrication/Machine operation,assembly, or inspectionManager/Supervisor
Other
Professional/Technical
Transportation or material moving
51% Treatment; 60% Control indicated plan to stay +8 years or the rest of their careers
12%
14%
18%
24%
14%
18%
Industry
Software Development
IT Solutions & Integration
Logistics
IT Communication Technology
Specialized Trades
Government

10/8/2015
21
OVERALL STUDY DEMOGRAPHICS
Gender%
MedianAge
Canadian MedianAge 1*
Mean BMI (kg/m2)
(sd)
SmokerCanadianSmokers/gender2
Female 46% 44 48 27.6 (6.1)
20% 18%
Male 54% 43 40 27.4 (4.8)
13% 22%
Health Canada BMI Guidelines ‐ Underweight BMI < 18.5‐ Normal BMI 18.5 ‐ 24.9‐ Overweight BMI 25 ‐ 29.9‐ Obese BMI ≥ 30
1. https://www12.statcan.gc.ca/census‐recensement/2011/dp‐pd/hlt‐fst/as‐sa/index‐eng.cfm?Lang=E(Canada Median *Entire Population not just labour force) (2011)2. http://www.statcan.gc.ca/tables‐tableaux/sum‐som/l01/cst01/health74b‐eng.htm ( smokers, by sex, province and territories (%) 2011)
• Comprehensive wellness program– Same in all organizations using same time line (though not dates)
• Claims data, surveys, biometric screening clinics
• Treatment, Control 1 and Control 2 -- Hawthorne effect
• Rigorous Analysis– Wellness index, mathematical models (difference in differences, multiple
regression analysis, generalized linear modeling with a log-link and gamma response probability distribution, predictive modeling)
METHODOLOGYExperimental Treatment & Control Design

10/8/2015
22
• Wellness Index
• Overall health results
• Comparison of two companies
• Health outcomes compared across time
• Looking forward– What is in the works
EARLY OBSERVATIONS FROM PHASE 2
Organizational Wellness
Stress
Physical Activity Habits
Workforce Engagement, Productivity & Health Wellness Culture
Employee Assistance Program
Nutrition Habits
Alcohol & TobaccoHabits
Physical Activity11%
Nutrition 11%
Workforce Wellness 44%
Stress22%
Alcohol & Tobacco11%
ComponentsWeighting
Sub‐ Components
WELLNESS INDEX OVERVIEW
10/8/2015
23
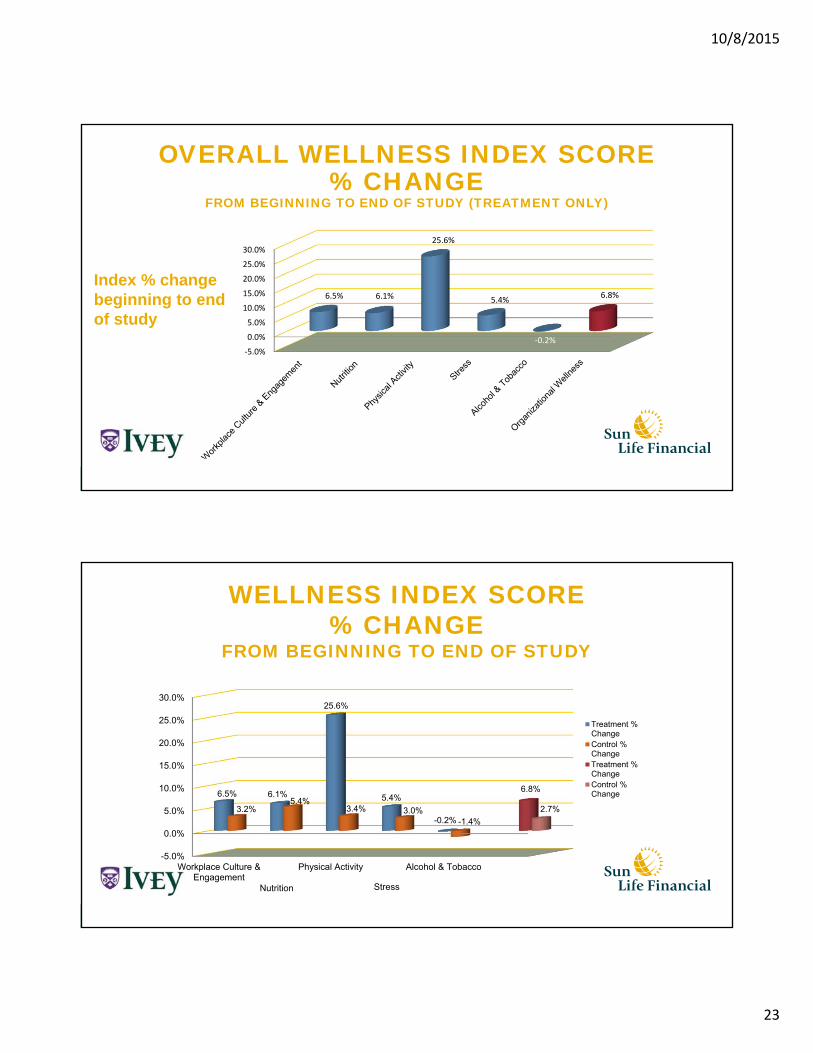
OVERALL WELLNESS INDEX SCORE % CHANGE
FROM BEGINNING TO END OF STUDY (TREATMENT ONLY)
‐5.0%
0.0%
5.0%
10.0%
15.0%
20.0%
25.0%
30.0%
6.5% 6.1%
25.6%
5.4%
‐0.2%
6.8%
Index % change beginning to end of study
-5.0%
0.0%
5.0%
10.0%
15.0%
20.0%
25.0%
30.0%
Workplace Culture &Engagement
Physical Activity Alcohol & Tobacco
6.5% 6.1%
25.6%
5.4%
-0.2%3.2%
5.4%3.4% 3.0%
-1.4%
6.8%
2.7%
Treatment %ChangeControl %ChangeTreatment %ChangeControl %Change
WELLNESS INDEX SCORE % CHANGE
FROM BEGINNING TO END OF STUDY
Nutrition Stress

10/8/2015
24
OVERALL WELLNESS SCORE % CHANGE: A COMPARISON
-2.0%
0.0%
2.0%
4.0%
6.0%
8.0%
10.0%
12.0%
14.0%
16.0%
18.0%
Company X Company Y
16.2%
-1.5%
2.3%
0.2%
Treatment % Change
Control % Change
Structural FactorsShift in organizational focus
Organization uncertainties
Restructuring
Redefining organizational culture
Org. Climate Factors Managerial turnover
Turmoil
Future uncertainties
Increasing workloads
Stress
Low morale
+ Alcohol & tobacco consumption
Low satisfaction
High turnover
NEGATIVE CONTRIBUTING FACTORSResult

10/8/2015
25
ACCOMPLISHED HEALTH OUTCOMES
0% 10% 20% 30% 40% 50% 60%
Increased energy
Became physically active
Increased my physical activity level
Improved my nutrition
Drank more water
Lost weight (please specify how much weight you lost below)
Managed stress better
Increased amount of restful sleep
Improved communication with others
23%
22%
53%
51%
59%
23%
16%
14%
15%
What health outcomes did you accomplish during this program? (select all that apply)
BARRIERS TO MAINTAINING A HEALTHY LIFESTYLE?
0% 20% 40% 60% 80% 100%
Lack of time
Lack of energy
Family/personal demands
Your lack of interest/low motivation
Lack of healthy food choices at work
Lack of resources
Lack of access to fitness resources
An existing health condition
Lack of knowledge
Lack of support at home
83%
71%
67%
66%
45%
44%
41%
38%
38%
32%
21%
% Participants indicated somewhat and big barrier to a healty lifestyle beginning of study
Lack of healthy food choice in your community

10/8/2015
26
0% 10% 20% 30% 40% 50% 60% 70% 80% 90%
Lack of time
Lack of energy
Family/personal demands
Your lack of interest/low motivation
Lack of healthy food choices at work
Lack of resources
Lack of access to fitness resources
An existing health condition
Lack of knowledge
Lack of support at home
Lack of healthy food choices in your community
81%
68%
68%
58%
37%
37%
40%
33%
29%
38%
15%
83%
71%
67%
66%
45%
44%
41%
38%
38%
32%
21%
% Participants indicated somewhat and big barrier to a healty lifestyle beginning of study
% Participants indicated somewhat and big barrier to a healty lifestyle end of study
BARRIERS TO MAINTAINING A HEALTHY LIFESTYLE?
6 points
9 points
7 points8 points
8 points
• Testing mathematical models to determine a rigorous ROI
• Mathematical forecasting to predict ROI “if” the wellness workplace program runs longer (e.g., 5 years)
• Effectiveness of initiatives of the wellness program
• Which initiatives reached the expectations & which didn't
• Impact of Mindfulness on error reduction in high reliability organizations
LOOKING FORWARD

10/8/2015
27
Leadership commitment and visibility
An understanding of the health issues facing the organization
A strong communication strategy that connects the dots for employees
Appealing incentives
Continuous evaluation of program value and outcomes
GETTING THE GREATEST VALUE FOR YOUR INVESTMENT
Taking a strategic approach
Michael RouseAssociate Professor, Strategy and Organization, and Principal Researcher of the Study
Ivey Business School at Western University
THANK YOU
www.ivey.ca
sunlife.ca/healthandwellness
Shauna BurkeAssistant Professor, School of Health Studies
and Project Team Member
Western University
Group Benefits are offered by Sun Life Assurance Company of Canada, a member of the Sun Life Financial group of companies.