
Simultaneous-Fault Diagnosis of Gearboxes Using ...
19
sensors Article Simultaneous-Fault Diagnosis of Gearboxes Using Probabilistic Committee Machine Jian-Hua Zhong, Pak Kin Wong and Zhi-Xin Yang * Department of Electromechanical Engineering, University of Macau, Macao, China; [email protected] (J.-H.Z.); [email protected] (P.K.W.) * Correspondence: [email protected]; Tel.: +853-8822-4456; Fax: +853-8822-2426 Academic Editor: Vittorio M. N. Passaro Received: 23 October 2015; Accepted: 22 January 2016; Published: 2 February 2016 Abstract: This study combines signal de-noising, feature extraction, two pairwise-coupled relevance vector machines (PCRVMs) and particle swarm optimization (PSO) for parameter optimization to form an intelligent diagnostic framework for gearbox fault detection. Firstly, the noises of sensor signals are de-noised by using the wavelet threshold method to lower the noise level. Then, the Hilbert-Huang transform (HHT) and energy pattern calculation are applied to extract the fault features from de-noised signals. After that, an eleven-dimension vector, which consists of the energies of nine intrinsic mode functions (IMFs), maximum value of HHT marginal spectrum and its corresponding frequency component, is obtained to represent the features of each gearbox fault. The two PCRVMs serve as two different fault detection committee members, and they are trained by using vibration and sound signals, respectively. The individual diagnostic result from each committee member is then combined by applying a new probabilistic ensemble method, which can improve the overall diagnostic accuracy and increase the number of detectable faults as compared to individual classifiers acting alone. The effectiveness of the proposed framework is experimentally verified by using test cases. The experimental results show the proposed framework is superior to existing single classifiers in terms of diagnostic accuracies for both single- and simultaneous-faults in the gearbox. Keywords: simultaneous-fault diagnosis; Hilbert-Huang transform; pairwise-coupling probabilistic committee machine 1. Introduction In the rotating machinery, gearboxes are widely used to transmit power from the prime mover to the load. If any failure occurs in the gearbox, it may interrupt normal machine operation and endanger users. Consequently, it is of great significance to develop a reliable and accurate intelligent system to diagnose the main components of the gearbox, such as gears and bearings. There are two main challenges in gearbox diagnosis. One is the existence of simultaneous faults, that is, multiple single faults that appear concurrently. The other is that no unique sensor can detect all the machine faults. To accurately detect more faults, many kinds of sensors and signals may be involved at the same time. However, it is difficult to analyze different kinds of signals simultaneously and make a decision. In the [1–7], various gearbox diagnostic systems have been proposed. In these systems, the fault diagnosis procedures are mainly divided into two stages: (1) signal processing and (2) fault identification/classification. The existing problems in signal processing of these systems are that the signals usually contain high-dimensional data and suffer from background noise interference, which degenerates the accuracy and fault identification time. Besides, the gearbox usually has many rotating components working together, such as bearings, gears and spindles, so the diagnosis of the gearbox is a simultaneous fault problem. In traditional gearbox fault diagnostic methods, simultaneous faults are usually considered Sensors 2016, 16, 185; doi:10.3390/s16020185 www.mdpi.com/journal/sensors
Transcript of Simultaneous-Fault Diagnosis of Gearboxes Using ...

sensors
Article
Simultaneous-Fault Diagnosis of Gearboxes UsingProbabilistic Committee MachineJian-Hua Zhong, Pak Kin Wong and Zhi-Xin Yang *
Department of Electromechanical Engineering, University of Macau, Macao, China; [email protected] (J.-H.Z.);[email protected] (P.K.W.)* Correspondence: [email protected]; Tel.: +853-8822-4456; Fax: +853-8822-2426
Academic Editor: Vittorio M. N. PassaroReceived: 23 October 2015; Accepted: 22 January 2016; Published: 2 February 2016
Abstract: This study combines signal de-noising, feature extraction, two pairwise-coupled relevancevector machines (PCRVMs) and particle swarm optimization (PSO) for parameter optimization toform an intelligent diagnostic framework for gearbox fault detection. Firstly, the noises of sensorsignals are de-noised by using the wavelet threshold method to lower the noise level. Then, theHilbert-Huang transform (HHT) and energy pattern calculation are applied to extract the faultfeatures from de-noised signals. After that, an eleven-dimension vector, which consists of theenergies of nine intrinsic mode functions (IMFs), maximum value of HHT marginal spectrum andits corresponding frequency component, is obtained to represent the features of each gearbox fault.The two PCRVMs serve as two different fault detection committee members, and they are trained byusing vibration and sound signals, respectively. The individual diagnostic result from each committeemember is then combined by applying a new probabilistic ensemble method, which can improve theoverall diagnostic accuracy and increase the number of detectable faults as compared to individualclassifiers acting alone. The effectiveness of the proposed framework is experimentally verified byusing test cases. The experimental results show the proposed framework is superior to existing singleclassifiers in terms of diagnostic accuracies for both single- and simultaneous-faults in the gearbox.
Keywords: simultaneous-fault diagnosis; Hilbert-Huang transform; pairwise-coupling probabilisticcommittee machine
1. Introduction
In the rotating machinery, gearboxes are widely used to transmit power from the prime moverto the load. If any failure occurs in the gearbox, it may interrupt normal machine operation andendanger users. Consequently, it is of great significance to develop a reliable and accurate intelligentsystem to diagnose the main components of the gearbox, such as gears and bearings. There are twomain challenges in gearbox diagnosis. One is the existence of simultaneous faults, that is, multiplesingle faults that appear concurrently. The other is that no unique sensor can detect all the machinefaults. To accurately detect more faults, many kinds of sensors and signals may be involved at thesame time. However, it is difficult to analyze different kinds of signals simultaneously and makea decision. In the [1–7], various gearbox diagnostic systems have been proposed. In these systems,the fault diagnosis procedures are mainly divided into two stages: (1) signal processing and (2) faultidentification/classification.
The existing problems in signal processing of these systems are that the signals usually containhigh-dimensional data and suffer from background noise interference, which degenerates the accuracyand fault identification time. Besides, the gearbox usually has many rotating components workingtogether, such as bearings, gears and spindles, so the diagnosis of the gearbox is a simultaneous faultproblem. In traditional gearbox fault diagnostic methods, simultaneous faults are usually considered
Sensors 2016, 16, 185; doi:10.3390/s16020185 www.mdpi.com/journal/sensors

Sensors 2016, 16, 185 2 of 19
as an independent label for the classifier, which will result in a high cost in acquiring exponentiallyincreased simultaneous fault signals. For example, with d single-faults (labels) and one normalcondition, there are 2d ´ (d + 1) artificial simultaneous fault labels [8–10]. To solve this problem, aneffective signal de-noising method and a proper feature extraction technique which can find the singlefault pattern features in simultaneous fault patterns are studied together.
Currently, some methods, including spectral subtraction, least squares, and wavelet thresholdmethods, are widely used for signal de-nosing [11,12]. In order to effectively de-noise thenon-stationary signals of a gearbox, a soft threshold method based on the discrete wavelet transform(DWT) is adopted in this study due to its popularity.
References [8–10] reported that a simultaneous fault symptom can be identified by analyzing thesingle fault patterns only if the classifier is trained by using a proper feature extraction technique, sothat it can save a lot of resources to collect a large combination of simultaneous fault training data.Existing techniques to select a proper feature extraction technique are reviewed here. At present, thereexist many methods to extract features from fault signals, such as Fourier transform, short time Fouriertransform, and wavelet transform. The Fourier transform is only suitable for analyzing stationarysignals. However, the signals of rotating gears and bearings are non-stationary, which makes theFourier transform unsuitable for this application. The time-frequency analysis methods, such as shorttime Fourier transform (STFT) and wavelet transform, can process non-stationary signals, but theyall have limitations. STFT has a limitation in non-stationary signal processing because of its use of afixed time window which makes it impossible to achieve good resolution in the time and frequencydomains at the same time. The drawback of the wavelet transform is that it suffers from the effect ofthe energy leakage because any signal which does not well correlate with the shape of wavelet basisfunction will be masked or completely ignored. In contrast to STFT and the wavelet transform, theHilbert-Huang transform (H-HT) is the latest time-frequency signal processing technique to analyzenonlinear and non-stationary signals. The first step of a typical H-HT process is to employ the empiricalmode decomposition (EMD) algorithm to decompose a complicated signal into a series of intrinsicmode functions (IMFs), which contains the local characteristics of the original signal at different timescales, and then a Hilbert transform is applied to each intrinsic mode function (IMF) for Hilbertspectrum analysis. The high time-frequency resolution of the H-HT method can effectively describethe rules of the changing frequency compositions with time, which is a good approach for analyzingnon-stationary signals. Even though H-HT has been applied to many applications, particularly in faultdetection and diagnosis [13,14], it has some disadvantages: (1) the issue of mode mixing; and (2) theredundant intrinsic mode functions easily appear at low frequency, which can cause the distortionof the processed result [15]. To overcome these disadvantages, this study applies ensemble empiricalmode decomposition (EEMD), an improved EMD method, to deal with the mode mixing problem, anduses the correlation coefficient method to eliminate the redundant IMFs. The EEMD-based H-HT ishereafter refered to as HHT. It is well-known that different fault conditions show different amplitude-and phase-frequency characteristics in the frequency domain. In other words, fault signal energies insome frequency bands may be enhanced, while the others are restrained. It is reasonable to assumethat there are certain corresponding relationships between the signal energy changes in the frequencybands and the fault phenomena. Therefore, on the basis of HHT, energy patterns of the selectedintrinsic mode function components are considered in this study to further extract representative faultfeatures from the gearbox vibration and sound signals.
In [1,3,5], most of the existing fault classification systems for the rotating machinery areconstructed by a single classifier which is trained based on one type of signal. However, a singleclassifier-based fault diagnostic system may not give reliable fault diagnostic results due to the fact thata universal classifier is difficult to develop, especially when the data available for training the classifierare not abundant. Furthermore, a single classifier can only be trained by one type of signal. Obviously,only one type of signal may not be able to cover all the faults. To let a fault classification system generatemore reliable diagnostic result and diagnose more faults, this paper proposes a new probabilistic

Sensors 2016, 16, 185 3 of 19
committee machine (PCM) to combine the diagnostic results from vibration and sound signals. Fromthe gearbox point of view, vibration and sound signals are usually used to identify the faults becausethose signals are easily acquired and highly related to the conditions of the gearbox [16–21]. Thecommittee machine concept involves combining results acquired by individual classifiers so as toobtain a group decision that is superior to any individual classifier acting alone [22–24], because agroup decision is usually better than a single person’s decision.
Moreover, a proper classifier must be able to offer the probabilities of all possible faults so that theuser can at least trace the other possible faults according to the rank of their probabilities when thefault(s) predicted by the classifier are incorrect. Therefore, it is logical to employ a probabilistic classifierfor each member in the committee machine for simultaneous-fault diagnosis of the gearbox. Currently,there are two common probabilistic classifiers, the probabilistic neural network (PNN) [25,26] andrelevance vector machine (RVM) [27,28] available in the relevant literature. The main drawback ofPNN lies in the limited number of inputs because the complexity of the network and the training timeare heavily related to the number of inputs. Hence, RVM is selected as a probabilistic classifier tobuild each committee member in this study. Generally, the aforementioned probabilistic classifiersare suitable to solve the binary classification. Nevertheless, most of the practical applications aremulti-class classification problems. One-versus-all strategy is usually employed to fix the multi-classclassification problem. However, this strategy does not consider the correlation between every pair offaults or labels, which was verified to produce a large region of indecision [29]. To solve the multi-classclassification problem effectively and generate a probability, a suitable pairwise coupling strategyis adopted for the above probabilistic classifiers to generate a pairwise-coupled probabilistic neuralnetwork (PCPNN) and pairwise-coupled relevance vector machine (PCRVM).
After determining the methods of signal de-noising, feature extraction and committee members,there are still two major factors, the decision threshold ε and member weight w, affecting thesystem accuracy in the proposed framework. The probabilistic committee machine only producesthe probability of occurrence of each fault. To determine the occurrence of the faults, a decisionthreshold must be applied to those probabilities (e.g., output probabilistic vector P = [0.35, 0.58, 0.48,0.83], if ε = 0.5, fault labels (2, 4) are considered as faults). Besides, different committee membersusually have various reliabilities, so a fair committee machine should assign different weights totheir committee members. Hence, an efficient searching algorithm, particle swarm optimization(PSO) [30,31], to determine optimal member weights and decision threshold is considered in theproposed framework. Finally, a fair measure, F-measure, is employed to evaluate the performance ofthe proposed diagnostic framework.
In a nutshell, this paper proposes a new framework which can diagnose simultaneous faults inthe gearbox while the framework is trained using only single-fault patterns. Besides, the proposedframework can provide probabilities of all possible faults to users to trace the other possible faultsaccording to the rank of probabilities when the diagnostic result is incorrect. Furthermore, the proposedframework can generate a more reliable diagnostic result and diagnose more faults by simultaneouslyanalyzing vibration and sound signals. Even though the authors also proposed a similar frameworkfor simultaneous-fault diagnosis of automotive engines in [21], the proposed framework is targeted atthe gearbox system. Moreover, the signal patterns used in this application are totally different fromthe ones in [21]. The proposed framework is designed based on vibration and sound signals ratherthan air ratio, ignition and acoustic signals in the previous framework. Besides, the engine signalsacquired in [21] do not consider the issue of background noise which can degenerate the accuracyof the diagnostic system. Furthermore, the feature extraction and selection methods rely on EMD +domain knowledge and sample entropy, which are old, time-consuming, out of support from referencematerials, and have a risk of mode-mixing. Finally, the objective function in [21] is not well-defined thatcannot achieve good diagnostic accuracy. Therefore, the framework in [21] cannot be directly appliedand is modified significantly to suit for the gearbox, particularly in the phases of data processing and

Sensors 2016, 16, 185 4 of 19
feature selection. Table 1 summarizes the differences between the diagnostic framework in [21] andthis study.
Table 1. Differences of diagnostic framework between reference [21] and this study.
Differences Reference [21] Present Study
Application Automotive engine Gearbox
Signal patterns Air ratio, ignition and acoustic signals Vibration and sound signals
Signal de-noising None Wavelet threshold
Feature extraction EMD and domain knowledge EEMD-based Hilbert-Huang transformand energy pattern
Feature selection (IMF selection) Value of sample entropy Correlation coefficient
Objective function Fme P 0.925 ˘ 0.025 Fme ě 0.9
This paper is organized as follows: Section 2 presents the proposed framework and relatedtechniques. The experimental setup and data per-processing are discussed in Section 3. Section 4discusses the experimental results and a comparison with other approaches. Finally, conclusions aregiven in Section 5.
2. Proposed Framework
The proposed PCM framework for the gearbox simultaneous-fault diagnosis, evaluationapproach and its construction method are illustrated in Figure 1. The framework consists of foursub-modules: (1) data processing; (2) probabilistic committee machine; (3) parameter optimization;and (4) performance evaluation. The details of the four sub-modules in the framework are discussedin the following sub-sections.
Figure 1. Proposed framework of gearbox simultaneous-fault diagnosis using probabilisticcommittee machine.
In this case study, signal features are extracted from two kinds of signals xk (k = 1, 2), includingthe vibration and sound signals, which are denoted as x1 and x2, respectively. Taking the vibrationsignal as an example, the signal x1, including both single-fault patterns (S) and simultaneous-faultpatterns (SM), goes through de-noising and feature extraction. After the data processing, the processeddataset is divided into three independent groups, including validation dataset, training dataset,and test dataset which are named as x1-PTra, x1-PVal, and x1-PTes, respectively. The x1-PVal and x1-PTesinvolve the combination of both single-fault patterns and simultaneous-fault patterns, while x1-PTra
Sensors 2016, 16, 185 5 of 19
contains the single-fault patterns only. The divided datasets are used to train, validate, and test theproposed framework.
2.1. Data Processing
2.1.1. Signal De-Noising
The acquired signals are display interference from the background noise. To decrease theinterference, the acquired signals have to be de-noised. A discrete wavelet transform (DWT) technique,which is an effective de-noising technique for non-stationary signals [11,13], is selected in this paper.The DWT can be defined as:
DWTps, Rq “1?
2s
ż 8
´8
xptqψ˚pt´ 2sR
2s qdt (1)
where s and R are integers, 2s and 2sR represent the scale and translation parameters respectively,Ψ represents the mother wavelet and Ψ˚ is the complex conjugate of Ψ. The original signal intime-domain xk = x(t) goes through a set of low pass and high pass filters emerging as low frequency(approximations, a˚) and high frequency (details, d˚i ) signals. Therefore, the original signal x(t) can bewritten as:
xptq “ a˚n `nÿ
i“1
d˚i (2)
The DWT-based de-noising technique is performed in three steps: (1) signal decomposition;(2) determination of the threshold and nonlinear shrinking coefficients; and (3) signal reconstruction.In the family of mother wavelets, the Daubechies wavelet (Db) is the most popular one and hence itis employed in this study. Moreover, the soft threshold signal is defined as signpxptqqp|xptq ´ T|q, if|xptq| ą T, and otherwise is 0, where T denotes a universal threshold that equals to
a
2logplength xptqq.The detail of the de-noising is described in Section 3.2.
2.1.2. Feature Extraction Based on Hilbert-Huang Transform
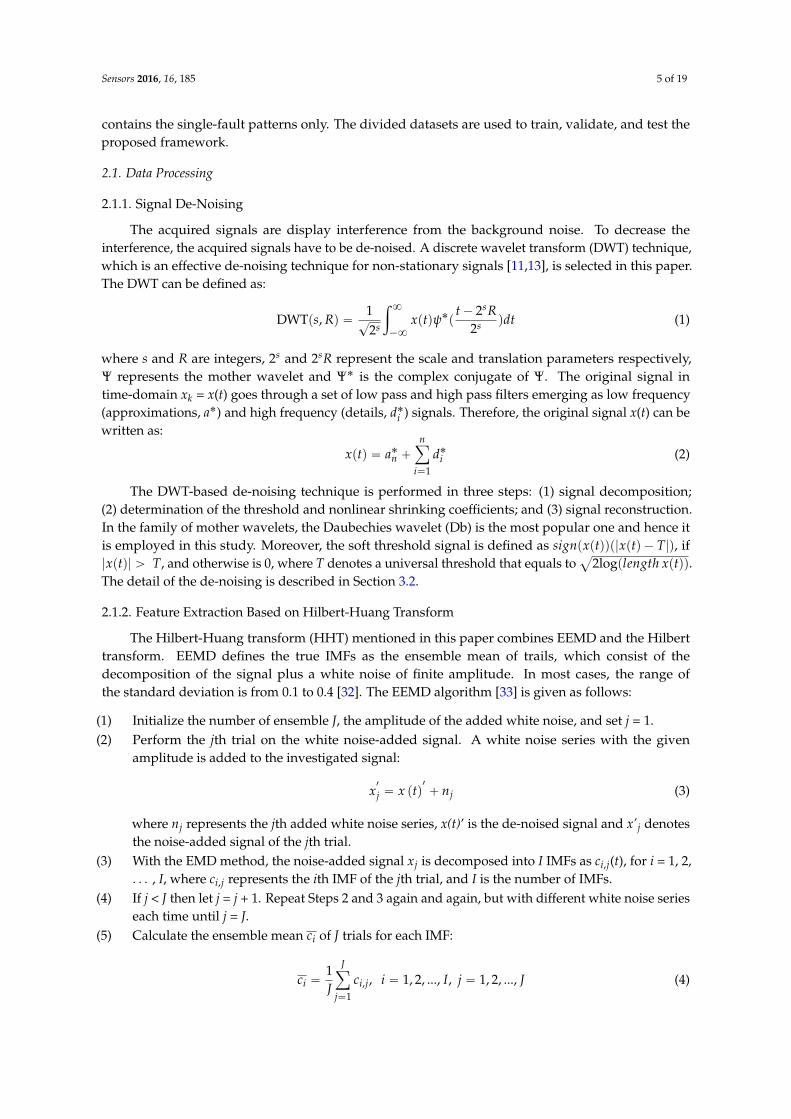
The Hilbert-Huang transform (HHT) mentioned in this paper combines EEMD and the Hilberttransform. EEMD defines the true IMFs as the ensemble mean of trails, which consist of thedecomposition of the signal plus a white noise of finite amplitude. In most cases, the range ofthe standard deviation is from 0.1 to 0.4 [32]. The EEMD algorithm [33] is given as follows:
(1) Initialize the number of ensemble J, the amplitude of the added white noise, and set j = 1.(2) Perform the jth trial on the white noise-added signal. A white noise series with the given
amplitude is added to the investigated signal:
x1
j “ x ptq1
` nj (3)
where nj represents the jth added white noise series, x(t)’ is the de-noised signal and x’j denotesthe noise-added signal of the jth trial.
(3) With the EMD method, the noise-added signal xj is decomposed into I IMFs as ci,j(t), for i = 1, 2,. . . , I, where ci,j represents the ith IMF of the jth trial, and I is the number of IMFs.
(4) If j < J then let j = j + 1. Repeat Steps 2 and 3 again and again, but with different white noise serieseach time until j = J.
(5) Calculate the ensemble mean ci of J trials for each IMF:
ci “1J
Jÿ
j“1
ci,j, i “ 1, 2, ..., I, j “ 1, 2, ..., J (4)

Sensors 2016, 16, 185 6 of 19
(6) Report the mean ci of the I IMFs as the final IMFs.
Applying the Hilbert transform to each IMF, and calculating the instantaneous frequency ωj(t)and amplitude Aj(t), the Hilbert spectrum of x(t)’, H pω, tq, is then calculated by the following equation:
Hpω, tq “ ReIÿ
j“1
Ajptqexppiż
ωjptqdtq (5)
Accordingly, the marginal spectrum of Hilbert-Huang transform, h(ω), can be defined by anintegrated spectrum with respect to time, t, i.e.:
hpωq “ż l
0Hpω, tqdt (6)
where h(ω) reflects the amplitude changing with frequency in the entire frequency range, and l is thelength of the signal x(t)’. The instantaneous frequency of IMF, which is obtained from the Hilberttransform, is well-localized in the time-frequency domain and reveals important characteristics ofthe signal.
2.2. Probabilistic Committee Machine
PCM is a group decision method which combines the results from the individual classifierand generates superior performance to any of the individual classifier acting alone. As mentionedpreviously, RVM is selected for constructing the probabilistic fault classifier. To solve the multi-labelclassification problem effectively, RVM adopts a pairwise coupling strategy which is named PCRVM.Moreover, a new ensemble method is proposed to combine the output of each committee member. Inthe proposed ensemble method, the committee members should be assigned suitable weights sinceevery member/classifier in the group usually has its own strength. The details of PCRVM algorithmand ensemble method are described in the following sections.
2.2.1. Relevance Vector Machine
RVM is a statistical learning method utilizing Bayesian learning framework and popular kernels.In this research, predicting the posterior probability of each fault tn for unseen symptoms f is conductedby RVM based on experimental data. Given a set of training data (f, t) = {fn,tn}, n = 1 to N, tn P {0, 1},and N is the number of training data. It follows the statistical convention and generalizes the linearmodel by applying the logistic sigmoid function σpypfqq “ 1{p1` expp´ypfqqq to the predicted decisiony(f) and adopting the Bernoulli distribution for P pt|Fq, the likelihood of the data is written as:
Pptˇ
ˇ
ˇF,θq “
śNn“1σ typfn ;θqtn
)
r1´ σ typfn;θqus1´tn
where ypf;θq “Nř
i“1θiKpf, fiq ` θ0
(7)
where θ “ pθ0, θ1, ..., θNqT is a weight vector and K is a kernel function. In the open literatures, three
kinds of kernel functions, radial basis function (RBF), polynomial, and Gaussian kernels, are available.Among these kernel functions, Gaussian kernel is the most popular kernel function in RVM to dealwith the issue of classification for industrial applications [34].
The optimal weight vector θ˚ for the given dataset needs to be computed so as to maximize theprobability P(θ|t, F, α)9 P(t|F, θ)P(θ˚|α), with α = [α0, α1, . . . , αN] a vector of N + 1 hyperparameters.However, the weights cannot be determined analytically. Thus, the following approximation procedureis chosen, which is based on Laplace’s method:

Sensors 2016, 16, 185 7 of 19
(1) For the current fixed values of α, the most probable weights θMP are found. Since P(θ|t, F, α) 9P(t|F, θ)P(θ|α), this step is equivalent to the following maximization.
θMP “ arg maxθ
logtP pt|F,θq Ppθ|αqu
“ arg maxθt
Nř
n“1rtnlogdn ` p1´ tnqp1´ logdnqs ´
12θTAθu
(8)
where dn “ σ typfn;θqu , A “ diagpα0, α1, ..., αNq.(2) Laplace’s method is simply a Gaussian approximation to the log-posterior around the mode of
the weights θMP. Equation (8) is differentiated twice to give:
∇θ∇θlogPpθˇ
ˇ
ˇt, F,αq
ˇ
ˇ
ˇθMP “ ´pΦTBΦ`Aq (9)
where B “ diagpβ1, β2, ..., βNq is a diagonal matrix with βn “ σ typfn;θqu r1´ σ typfn;θqus andΦ is a N ˆ (N + 1) design matrix with Φnm “ Kpfn, fm´1q and Φn0 “ 1, n = 1 to N, and m = 1 toN + 1. By inverting Equation (9), the covariance matrix
ř
“pΦTBΦ`Aq´1 can be obtained.(3) The hyperparameter vector α is updated using an iterative re-estimation equation. Firstly, αi is
randomly guessed, then γi “ 1´ aiř
ii is calculated, whereř
ii is the ith diagonal element of thecovariance matrix
ř
¨ Then, αi is re-estimated as follows:
αnew “γi
u2i
(10)
where u “ θMP “ř
ΦTBt. The first step is to set αi Ð αnewi and then γi and αnew
i are re-estimatedagain until convergence. Finally, θ “ θMP is set, so that the classification model ypf;θq “Nř
i“1θiKpf, fiq ` θ0 is obtained.
2.2.2. Pairwise-Coupled Relevance Vector Machine as Committee Member
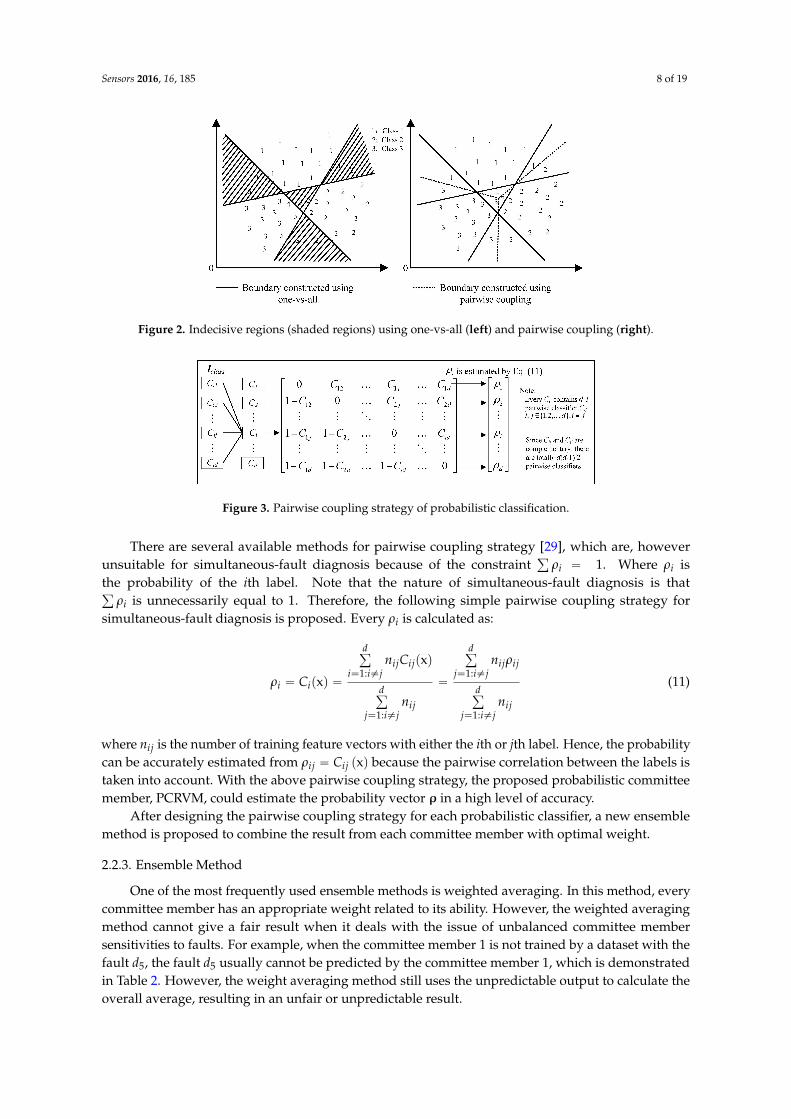
The traditional machine learning methods are designed only for the issue of binary classification,in which the output is either positive (+1) or negative (´1). However, most practical problems aremulti-classification as well as probabilistic output. Usually, one-versus-all is employed to deal withmulti-classification problems. The one-versus-all strategy constructs a group of classifiers lclass = [C1, C2,. . . , Cd] in a d-label classification problem. The one-versus-all strategy is simple and easy to implement,however, it generally gives a poor result [29,35] since one-versus-all does not consider the pairwisecorrelations which causes a much larger indecisive region than the pairwise coupling strategy (usingone-versus-one) as showed in Figure 2. The pairwise coupling strategy also constructs a group ofclassifiers lclass = [C1, C2, . . . , Cd] in a d-label classification problem. However, each Ci = [Ci1, Ci2,. . . , Cid] is composed of a set of d ´ 1 different pairwise classifiers Cij, i ‰ j. Since Cij and Cji arecomplementary, there are totally d(d ´ 1)/2 classifiers in lclass as shown in Figure 3. To solve themulti-classification and probabilistic output problems, a pairwise coupling strategy is adopted for theRVM and PNN classifiers. The strategy combines all the outputs of every pair of classes to re-estimatethe overall probability for a new instance.
Sensors 2016, 16, 185 8 of 19
Figure 2. Indecisive regions (shaded regions) using one-vs-all (left) and pairwise coupling (right).
Figure 3. Pairwise coupling strategy of probabilistic classification.
There are several available methods for pairwise coupling strategy [29], which are, howeverunsuitable for simultaneous-fault diagnosis because of the constraint
ř
ρi “ 1. Where ρi isthe probability of the ith label. Note that the nature of simultaneous-fault diagnosis is thatř
ρi is unnecessarily equal to 1. Therefore, the following simple pairwise coupling strategy forsimultaneous-fault diagnosis is proposed. Every ρi is calculated as:
ρi “ Cipxq “
dř
i“1:i‰jnijCijpxq
dř
j“1:i‰jnij
“
dř
j“1:i‰jnijρij
dř
j“1:i‰jnij
(11)
where nij is the number of training feature vectors with either the ith or jth label. Hence, the probabilitycan be accurately estimated from ρij “ Cij pxq because the pairwise correlation between the labels istaken into account. With the above pairwise coupling strategy, the proposed probabilistic committeemember, PCRVM, could estimate the probability vector ρ in a high level of accuracy.
After designing the pairwise coupling strategy for each probabilistic classifier, a new ensemblemethod is proposed to combine the result from each committee member with optimal weight.
2.2.3. Ensemble Method
One of the most frequently used ensemble methods is weighted averaging. In this method, everycommittee member has an appropriate weight related to its ability. However, the weighted averagingmethod cannot give a fair result when it deals with the issue of unbalanced committee membersensitivities to faults. For example, when the committee member 1 is not trained by a dataset with thefault d5, the fault d5 usually cannot be predicted by the committee member 1, which is demonstratedin Table 2. However, the weight averaging method still uses the unpredictable output to calculate theoverall average, resulting in an unfair or unpredictable result.

Sensors 2016, 16, 185 9 of 19
To overcome the above problem, a novel ensemble method with optimal weights and predefinednull outputs is proposed which is given by Equation (12). In Equation (12), ρj-i is set to be zero whenthe jth classifier cannot make a diagnosis for the ith fault label (i.e., the jth classifier is not trained bythe ith single-fault). In this way, the proposed method can overcome the problem of the traditionalweighted averaging method, which is one of main contributions of this research. The probability ofthe ith fault is expressed as:
Pi “
kř
j“1wj-optρj-i
kř
j“1f pwj-optq
, i “ 1, 2, ..., d & j “ 1, 2, ..., k
subject to f pwj-optq “
#
wj-opt0 : i f ρj-i “ 0
(12)
where wj-opt is the optimal weight for the jth committee member, wj-opt P r0, 1s, j = 1 to k, where k isthe number of committee members, and the sum of wj-opt is not equal to 1. ρj-i P r0, 1s is probabilityestimated from the jth classifier for the ith single-fault, i = 1 to d where d is the total number ofdetectable single-faults. Finally, the probabilistic outputs of classifiers are combined with optimalweights to generate the probability vector P = [P1, P2, ..., Pd].
Table 2. Issue of weighted averaging method for balanced and unbalanced committee membersensitivities to gearbox faults.
Balanced MemberSensitivities toGearbox Faults
Committee Member 1 Committee Member 2 Average OutputProbability (P3) for d3
Fault d3 trained trained P3 “w1ρ1´2 `w2ρ2´2
w1 `w2P
r0 1sP3 is a reasonable result
Output probability for d3 foran unseen case ρ1´3 P r0 1s ρ2´3 P r0 1s
Unbalanced MemberSensitivities toGearbox Faults
Committee Member 1 Committee Member 2 Average OutputProbability (P5) for d5
Fault d5 Unable to train trained P5 “w1ρ1´5 `w2ρ2´5
w1 `w2P5 is an
unfair/unpredictable resultOutput probability for d5 for
an unseen case ρ1´5 is unpredictable ρ2´5 P r0 1s
Remark: w1 and w2 are weights for Committee members 1 and 2 respectively; P3 and P5 are average outputprobabilities for d3 and d5 respectively.
In this application, the processed training datasets xk´PTra, are employed to train probabilisticclassifiers (PCRVM) respectively. The workflow of the PCM is shown in Figure 4.
Figure 4. Procedure for training probabilistic committee machine.

Sensors 2016, 16, 185 10 of 19
2.3. Parameter Optimization
The probability vector P = [P1, P2, . . . , Pd] can be provided to the user as a quantitative measurefor reference and further processing. However, human experts generally cannot identify the numberof simultaneous-faults directly based on the output probability of each fault. Therefore, a decisionthreshold (DT) ε is introduced to identify the simultaneous-faults from P such that:
yi “
#
0
1 if Pi ě ε(13)
where ε P r0 1s and 1 denotes that the corresponding fault occurs. For example, given an unseen inputx, if P = [0.72, 0.42, 0.51, 0.81, 0.39] and ε = 0.5, then y = DT(P) = [1, 0, 1, 1, 0]. Therefore, the unseen x isdiagnosed as a simultaneous-fault for the labels (1, 3, 4).
Obviously, the weight and the decision threshold are the major factors affecting the classificationaccuracy. By reviewing the literature [30,31], it is seen that PSO has the same effectiveness as a typicaloptimization method, genetic algorithms, in finding the global optimal solution, but with bettercomputational efficiency. Hence, PSO is adopted to determine the best weights wopt and decisionthreshold εopt in this study.
Particle Swarm Optimization
PSO is a population-based optimizer. The population is regarded as a swarm and the individualsare considered as particles. For an z-dimensional search space and a swarm consisting of H particles,the ith particle can be represented by an z-dimensional vector ui = (ui1, ui2, . . . , uiz), the velocity ofthis particle can be an z-dimensional vector vi = (vi1, vi2, . . . , viz), and the best previous positionencountered by this particle can be described as pi = (pi1, pi2, . . . , piz). Let g represent the index of theparticle that attains the best previous position among all the particles in the swarm. Then, the swarmis manipulated in accordance with the following equations:
vipj` 1q “ W f vipjq ` q1r1rpipjq ´ uipjqs ` q2r2rpgpjq ´ uipjqs (14)
uipj` 1q “ uipjq ` vipj` 1q (15)
where i is the particle index i = [1, 2, . . . , H], W f is the weight factor, q1 and q2 are positive constants,r1 and r2 are the random numbers selected between [0, 1]. The selection of the above parameters waspresented in [36]. With reference to the literature, Table 3 shows the PSO parameters selected for thiscase study.
Table 3. PSO parameters.
Number of generations 1000
Population size 50
W f 0.9
q1 2
q2 2
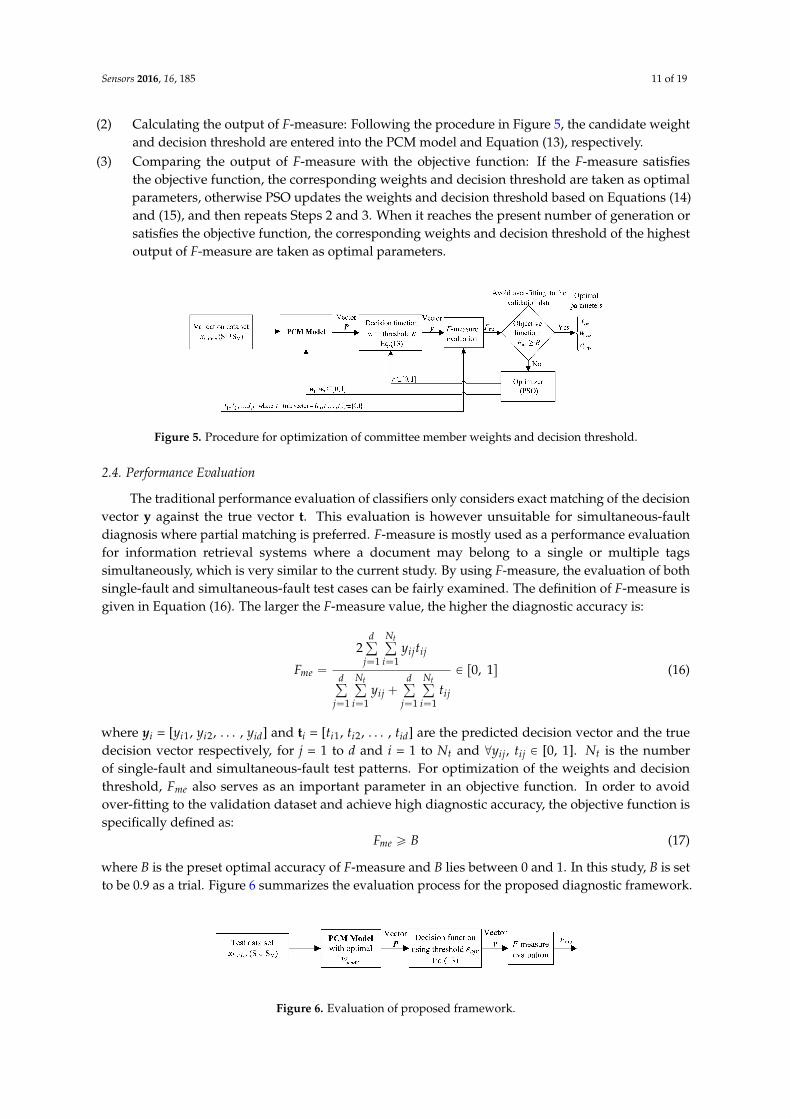
To evaluate the fitness of each iteration, a common evaluation method called F-measure [37] andan objective function described in Section 2.4 are employed. The procedure of the proposed PSOapproach is illustrated in Figure 5, which is performed in three steps:
(1) Initializing the parameters of PSO: The candidate weight (w1, w2) and decision threshold arerandomly selected from interval [0, 1].
Sensors 2016, 16, 185 11 of 19
(2) Calculating the output of F-measure: Following the procedure in Figure 5, the candidate weightand decision threshold are entered into the PCM model and Equation (13), respectively.
(3) Comparing the output of F-measure with the objective function: If the F-measure satisfiesthe objective function, the corresponding weights and decision threshold are taken as optimalparameters, otherwise PSO updates the weights and decision threshold based on Equations (14)and (15), and then repeats Steps 2 and 3. When it reaches the present number of generation orsatisfies the objective function, the corresponding weights and decision threshold of the highestoutput of F-measure are taken as optimal parameters.
Figure 5. Procedure for optimization of committee member weights and decision threshold.
2.4. Performance Evaluation
The traditional performance evaluation of classifiers only considers exact matching of the decisionvector y against the true vector t. This evaluation is however unsuitable for simultaneous-faultdiagnosis where partial matching is preferred. F-measure is mostly used as a performance evaluationfor information retrieval systems where a document may belong to a single or multiple tagssimultaneously, which is very similar to the current study. By using F-measure, the evaluation of bothsingle-fault and simultaneous-fault test cases can be fairly examined. The definition of F-measure isgiven in Equation (16). The larger the F-measure value, the higher the diagnostic accuracy is:
Fme “
2dř
j“1
Ntř
i“1yijtij
dř
j“1
Ntř
i“1yij `
dř
j“1
Ntř
i“1tij
P r0, 1s (16)
where yi = [yi1, yi2, . . . , yid] and ti = [ti1, ti2, . . . , tid] are the predicted decision vector and the truedecision vector respectively, for j = 1 to d and i = 1 to Nt and @yij, tij P [0, 1]. Nt is the numberof single-fault and simultaneous-fault test patterns. For optimization of the weights and decisionthreshold, Fme also serves as an important parameter in an objective function. In order to avoidover-fitting to the validation dataset and achieve high diagnostic accuracy, the objective function isspecifically defined as:
Fme ě B (17)
where B is the preset optimal accuracy of F-measure and B lies between 0 and 1. In this study, B is setto be 0.9 as a trial. Figure 6 summarizes the evaluation process for the proposed diagnostic framework.
Figure 6. Evaluation of proposed framework.

Sensors 2016, 16, 185 12 of 19
3. Experimental Setup and Data Preprocessing
To verify the effectiveness of the proposed framework, experiments were carried out. The detailof the experimental set up is presented in the following subsections. All the proposed methods wereimplemented by using MatLab R2008a and executed on a computer with a Core 2 Duo E6750 @ 2.13GHz with 4 GB RAM.
3.1. Test Rig and Sample Data Acquisition
The experiments were performed on a test rig as shown in Figure 7, which can simulate mostof the faults in a gearbox. In this study, some common gearbox faults, including gear faults, bearingfaults, and structural faults, are introduced. In the experiments, the gear faults include a broken toothwith whole tooth damage, a chipped tooth with 1/4 tooth damage, and a gear crack with a 5 mm crackon the tooth face, whereas the bearing faults include medium wear on the rolling elements and outerraces. The structural faults contain unbalance, looseness, and misalignment, which are simulated byrespectively adding one eccentric mass on the output shaft, unfastening some screws of the gearbox,and adjusting one height of the gearbox with shims. In the test rig, the signal acquisition module(NI 9234) with accelerometers and a microphone acquires the vibration and sound signals, respectively.The accelerometer is used to record the vibration signals along the vertical direction. In this study,a total of 12 cases, including eight single-faults and four simultaneous faults which are described inTable 4, are simulated in the test rig in order to generate sample training and test datasets. Accordingto practical experience, a machine cannot be operated if there are too many faults at the same time.Therefore, the type of simultaneous faults is an experimental selection in this case study. Besides, therelationship between simulated faults and signal types is presented in Table 5, which explains thatone kind of signal can only detect a limited number of faults. For example, previous experimentshave found that the vertical vibration signal cannot be used to detect d4 and d5 because the loadingon the tapered roller bearing along the vertical direction is insignificant. Moreover, the sound signalis relatively unaffected by structural resonance [38], so the structural failures (d1, d2 and d3) cannotbe easily detected using the sound signal. To extend the number of detectable faults and enhance thereliability of the fault diagnostic system, the vibration and sound signals are therefore simultaneouslyemployed to diagnose the simultaneous-faults in the gearbox.
Figure 7. Collection of fault patterns from a rotating machinery.

Sensors 2016, 16, 185 13 of 19
Table 4. Description of single-faults and simultaneous-faults.
Case No. Single-Faults Case No. Simultaneous-Faults
d1 Unbalance si9 Broken gear tooth & Chipped toothd2 Looseness
d3 Mechanical misalignment si10Chipped tooth & Bearing with
worn outer raced4 Bearing with worn rolling elements
d5 Bearing with worn outer race si11Broken gear tooth & Bearing with
worn rolling elementsd6 Broken gear tooth
d7 Gear crack si12Bearing with worn rolling elements
& Bearing with worn outer raced8 Chipped tooth
Table 5. Relationship of single-faults and signal types.
d1 d2 d3 d4 d5 d6 d7 d8
Verticalvibration
‘ ‘ ‘ ‘ ‘ ‘
Sound‘ ‘ ‘ ‘ ‘
To construct and test the proposed diagnostic framework, the samples for each single fault andsimultaneous fault were repeated 200 times under two testing conditions (800 rpm and 1500 rpm).Each time, 1 s of raw signal, including the vibration and sound signals,wa simultaneously recordedwith a sampling rate of 25.6 kHz. In other words, one case of each type of signal has 25,600 samplingdata points. For each type of signal xk (k = 1, 2), there are 1600 single-fault sample data (i.e., eight kindsof single faults ˆ 200 samples) and 800 simultaneous fault sample data (i.e., four kinds of simultaneousfaults ˆ 200 samples). In order to evaluate the diagnostic performance for both single faults andsimultaneous faults, each sample data is divided into different subsets as shown in Table 6.
Table 6. Division of sample dataset into different subsets.
Type of Dataset Single-Faults (1600) Simultaneous-Faults (800)
Raw sample data (xk)Validation dataset Dk´Val (800) Dk´Val (600)Training dataset Dk´Tra (600)
Test dataset Dk´Tes (200) Dk´Tes (200)
After feature extractionValidation dataset Dk´PVal (800) Dk´PVal (600)Training dataset Dk´PTra (600)
Test dataset Dk´PTes (200) Dk´PTes (200)
3.2. Data Processing and Signal De-Noising in Case Study
In order to obtain the feature vector, the IMF energy pattern based on HHT is calculatedwith the following steps: (1) signal de-noising; (2) IMF component selection; and (3) IMF energypattern calculation.
(1) Signal de-noising. In the signal de-noising phase, the mother wavelet and the level ofdecomposition L are selected according to a trial-and-error method. In this case study, four Daubechieswavelets (Db3, Db4, Db5, and Db6) are tried and the range of L is set from 3 to 5. Moreover, the softthreshold T is equal to 4.476 according to the equation T “
a
2 log plength x ptqq. The effectiveness ofde-noising using Db wavelets is verified by using signal to noise ratio (SNR) which is given as follows:
SNR “ 10ˆ log10pSσ
Nσq (18)
where Sσ and Nσ are the standard deviation of de-noised signal and noise signal respectively. A largevalue of SNR means more noise is eliminated. Considering the sound signal of d6 as an example, the

Sensors 2016, 16, 185 14 of 19
de-noised result is shown in Table 7. It demonstrates that the SNR of Db5 with Level 3 is the highest,so it is suitable to de-noise the signal.
Table 7. Signal to noise ratio under different combinations of Db wavelets.
SNR Level 3 Level 4 Level 5
Db3 12.689 db 11.041 db 10.191 dbDb4 12.690 db 11.090 db 10.207 dbDb5 12.847 db 11.126 db 10.271 dbDb6 12.720 db 11.118 db 10.272 db
(2) IMF component selection. After de-noising the signals, the IMFs of all de-noised signals arecalculated by using EEMD in which the ensemble number and white noise amplitude of EEMD are setas 100 and 0.3 time of the standard deviation of the investigated signal respectively [33]. In this casestudy, EEMD decomposes the de-noised sound signal into ten IMFs and a residual signal. To selectthe proper number of IMFs, the correlation coefficient method [13] is used. The correlation coefficientbetween an IMF component Ii(t) and its de-noised signal x(t)’ can be defined as:
Coexptq1 ,Iiptq“
Mř
i“1pxptq
1´ xqpIiptq ´ Iiq
d
Mř
i“1pxptq1 ´ xq2
d
Mř
i“1pIiptq ´ Iiq
2(19)
where x and Ii is the mean values of the x(t)’ and Ii(t) respectively and M is the number of IMFs. A largeCoexptq,Iiptq value means a high correlation between Ii(t) and x(t)’, and also implies that Ii(t) containsmore fault information. A signal of correlation coefficients of de-noised sound signal of d6 is presentedin Table 8 as a demonstration in which the correlation coefficient of IMF I10 is obviously smaller thanthe others. Thus, only the IMFs from levels 1–9 are considered to extract the energy pattern in thiscase study.
Table 8. Correlation coefficients of each IMF component for an example of de-noised signal of d6.
De-noisedsoundof d6
IMF Component
I1 I2 I3 I4 I5 I6 I7 I8 I9 I10
Correlationcoefficient 0.2054 0.2089 0.2132 0.2375 0.2489 0.3475 0.3134 0.2876 0.2273 0.0274
(3) IMF energy pattern calculation. In this case study, the energy patterns of selected IMFs areconsidered to extract the fault features. The energy of the ith IMF, Ei, can be calculated by using thefollowing equation:
Ei “
nÿ
j“1
rpj ¨ ∆tq ¨ |Iipj ¨ ∆tq|2s (20)
where ∆t is the time interval, n and j are the total number and index of data points respectively,and Ii pj ¨ ∆tq denotes the decomposition coefficient of the ith IMF at the moment of j ¨ ∆t. Anine-dimensional energy feature vector is extracted as E = [E1, E2, . . . , E9]. Furthermore, underdifferent fault conditions, the HHT marginal spectra show various maximum values and correspondingfrequencies in the patterns. To enrich the fault information, the maximum amplitude of a marginalspectrum of HHT, Am, and its corresponding frequency, fm, are added to the feature vector E. Therefore,the extracted feature vector is extended to an eleven-dimensional vector, which can be rewritten asE = [E1, E2, . . . , E9, Am, fm]. The procedure of data processing is illustrated in Figure 8.

Sensors 2016, 16, 185 15 of 19
Figure 8. Flowchart of proposed feature extraction approach.
4. Experimental Results and Discussion
4.1. Performance of Various Combinations of Feature Extraction Techniques
In the experiments, two typical feature extraction methods, fast Fourier transform (FFT) andwavelet package transform with principal component analysis (WPT + PCA) are compared with HHT.For those feature extraction methods, some settings are necessary. For the wavelet package transform(WPT), the Daubechies wavelet is the most popular one, so it is employed. In this case study, Db4 withlevel 4 decomposition is employed after carrying out many trials. Besides, two classification techniquesare used to compare with the proposed PCM framework, including PCPNN and PCRVM. There aretwo hyper-parameters, spread S˚ and width W* in the kernel function, which are necessary to bedefined in PCPNN and PCRVM respectively. Meanwhile, PCRVM is employed as a committee memberof PCM, so PCM and PCRVM share the same hyper-parameter width W*. By using a trial-and-errormethod, S˚ and W* are set to be 0.3 and 0.64 respectively.
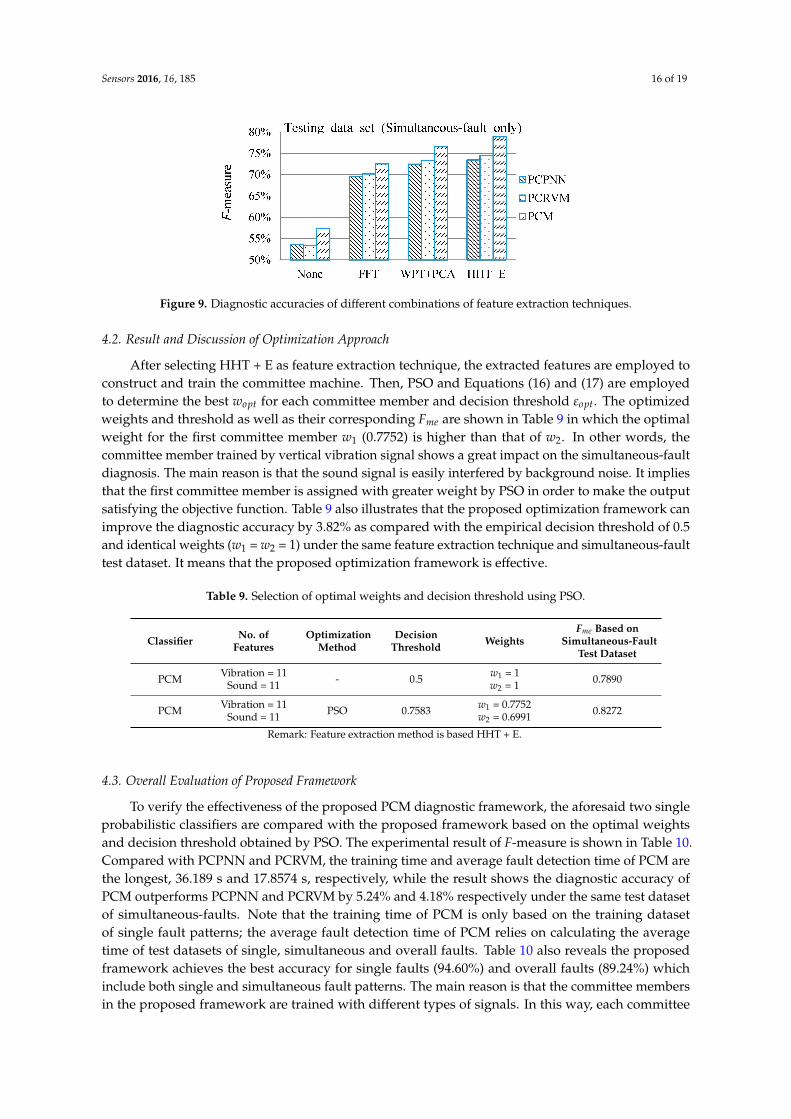
After determining the configurations of the feature extraction and classification techniques, thereasonable combinations of feature extraction techniques are tested as shown in Figure 9, in which theweight of each committee member and decision threshold are predefined as 1 (i.e., w1 = w2 = 1) and 0.5respectively. Note that PCPNN and PCRVM determine their F-measures by combining all the featuresextracted from vibration and sound signals as their input vectors, whereas PCM employs two PCRVMcommittee members to analyze the respective extracted features.
Figure 9 illustrates that the feature extraction techniques are effective. Taking the proposed PCMframework as an example, the feature extraction techniques, FFT, WPT + PCA, and Hilbert-Huangtransform + energy pattern (HHT + E) give 14.12%, 18.18%, and 21.48% improvement respectivelyas compared with the method without any feature extraction. By using PCPNN and PCRVM asclassifiers, the feature extraction methods also improve the diagnostic accuracy from 16.06% to 21.16%as compared with the method without feature extraction. Note that the classifiers only employ atraining set of single-fault patterns to construct the classifiers while the performance is evaluated usingsimultaneous-fault test patterns. Figure 9 also indicates that no matter which classification techniqueis, HHT + E gives the best performance. The reason is that extracting the energy from HHT canreflect not only the energy amount of each IMF, but also the energy distribution of each IMF changingwith time, which can provide more faulted component information. This result also verifies that theproposed feature extraction technique (HHT + E) is effective to extract the features of single-faultsfrom simultaneous-fault patterns of the gearbox.
Sensors 2016, 16, 185 16 of 19
Figure 9. Diagnostic accuracies of different combinations of feature extraction techniques.
4.2. Result and Discussion of Optimization Approach
After selecting HHT + E as feature extraction technique, the extracted features are employed toconstruct and train the committee machine. Then, PSO and Equations (16) and (17) are employedto determine the best wopt for each committee member and decision threshold εopt. The optimizedweights and threshold as well as their corresponding Fme are shown in Table 9 in which the optimalweight for the first committee member w1 (0.7752) is higher than that of w2. In other words, thecommittee member trained by vertical vibration signal shows a great impact on the simultaneous-faultdiagnosis. The main reason is that the sound signal is easily interfered by background noise. It impliesthat the first committee member is assigned with greater weight by PSO in order to make the outputsatisfying the objective function. Table 9 also illustrates that the proposed optimization framework canimprove the diagnostic accuracy by 3.82% as compared with the empirical decision threshold of 0.5and identical weights (w1 = w2 = 1) under the same feature extraction technique and simultaneous-faulttest dataset. It means that the proposed optimization framework is effective.
Table 9. Selection of optimal weights and decision threshold using PSO.
Classifier No. ofFeatures
OptimizationMethod
DecisionThreshold Weights
Fme Based onSimultaneous-Fault
Test Dataset
PCM Vibration = 11Sound = 11 - 0.5 w1 = 1
w2 = 1 0.7890
PCM Vibration = 11Sound = 11 PSO 0.7583 w1 = 0.7752
w2 = 0.6991 0.8272
Remark: Feature extraction method is based HHT + E.
4.3. Overall Evaluation of Proposed Framework
To verify the effectiveness of the proposed PCM diagnostic framework, the aforesaid two singleprobabilistic classifiers are compared with the proposed framework based on the optimal weightsand decision threshold obtained by PSO. The experimental result of F-measure is shown in Table 10.Compared with PCPNN and PCRVM, the training time and average fault detection time of PCM arethe longest, 36.189 s and 17.8574 s, respectively, while the result shows the diagnostic accuracy ofPCM outperforms PCPNN and PCRVM by 5.24% and 4.18% respectively under the same test datasetof simultaneous-faults. Note that the training time of PCM is only based on the training datasetof single fault patterns; the average fault detection time of PCM relies on calculating the averagetime of test datasets of single, simultaneous and overall faults. Table 10 also reveals the proposedframework achieves the best accuracy for single faults (94.60%) and overall faults (89.24%) whichinclude both single and simultaneous fault patterns. The main reason is that the committee membersin the proposed framework are trained with different types of signals. In this way, each committee

Sensors 2016, 16, 185 17 of 19
member becomes different from each other, which can improve the classification accuracy of theensemble. For example, considering an ensemble of k trained classifiers [C1, C2, ..., Ck], if the classifiersare trained using different subsets and their errors are uncorrelated, then even when Ci is wrong, mostof the other classifiers Cj (where i ‰ j) may still be correct.
In a nutshell, the proposed framework is an effective approach to detect the simultaneous-faultswithout costly simultaneous-fault training patterns. Moreover, the proposed method employs vibrationand sound signals to train the diverse committee members, which can ensure the diagnostic resultto be more reliable and accurate. Therefore, it can be concluded that the proposed framework is aneffective technique to overcome both challenges in fault diagnosis of the gearbox.
Table 10. Evaluation result of PCM, PCPNN and PCRVM.
Classifier FeatureNumber
DecisionThreshold
OptimalWeight
Accuracies for Test Cases (Fme)
Single-Faults
Simultaneo-Us-Faults
Overall-Faults
AverageFault
DetectionTime (s)
PCPNN 11 + 11 = 22 0.6830 - 0.9163 0.7717 0.8563 8.8014
PCRVM 11 + 11 = 22 0.6754 - 0.9141 0.7823 0.8642 9.7685
PCM Vibration = 11Sound = 11 0.7583 w1 = 0.7752
w2 = 0.6991 0.9460 0.8241 0.8924 17.8574
Remark: Feature extraction method is based on HHT + E.
5. Conclusions
In this paper, a new framework, which combines signal de-noising, feature extraction, probabilisticcommittee machine, parameter optimization and F-measure, has successfully been developed toovercome the challenges of simultaneous fault diagnosis and multiple signal analysis in a gearbox. Inconsideration of the features of vibration and sound signals in this application, DWT and HHT + Eare used for signal de-noising and feature extraction, respectively, so that the diagnostic system caneffectively capture the single fault components from the noise-polluted simultaneous fault patterns. Itimplies that the acquisition of large amount of simultaneous fault signals can be avoided. Moreover,PSO is effective for optimizing the weight of each committee member and decision threshold in thePCM framework. To verify the effectiveness of the proposed probabilistic committee machine andmake a comparison, the single probabilistic classifiers, PCPNN and PCRVM, are also employed todiagnose the simultaneous faults. Although the results show that those machine learning methodscan diagnose the simultaneous faults in the gearbox, it is found that the proposed PCM frameworkis superior to the single classifiers. Therefore, the proposed PCM framework is suitable to detect thesimultaneous faults in the gearbox.
In practice, most mechanical faults can be diagnosed by analyzing vibrations, sounds, currents,oil debris and temperature signals. As the number and type of committee members in the proposedframework can be adjusted by the user, the proposed framework can be applied to other similardiagnostic applications.
Acknowledgments: The authors would like to thank the financial support from the University of Macau, grantNumbers: MYRG2014-00178-FST, MYRG079(Y1-L2)-FST13-YZX, and MYRG2015-00077-FST. The authors wouldalso like to thank the support from Yueqiao Chen.
Author Contributions: Pak Kin Wong and Jian-Hua Zhong conceived and designed the experiments;Jian-Hua Zhong performed the experiments; Jian-Hua Zhong and Zhi-Xin Yang analyzed the data; Zhi-Xin Yangcontributed reagents/materials/analysis tools; Pak Kin Wong and Jian-Hua Zhong wrote the paper.
Conflicts of Interest: The authors declare no conflict of interest.

Sensors 2016, 16, 185 18 of 19
References
1. Hu, Q.; He, Z.; Zhang, Z.; Zi, Y. Fault diagnosis of rotating machinery based on improved wavelet packagetransform and svms ensemble. Mech. Syst. Signal Process. 2007, 21, 688–705. [CrossRef]
2. Lei, Y.; He, Z.; Zi, Y.; Hu, Q. Fault diagnosis of rotating machinery based on multiple anfis combination withgas. Mech. Syst. Signal Process. 2007, 21, 2280–2294. [CrossRef]
3. Sanz, J.; Perera, R.; Huerta, C. Fault diagnosis of rotating machinery based on auto-associative neuralnetworks and wavelet transforms. J. Sound Vib. 2007, 302, 981–999. [CrossRef]
4. Widodo, A.; Yang, B.-S. Application of nonlinear feature extraction and support vector machines for faultdiagnosis of induction motors. Expert Syst. Appl. 2007, 33, 241–250. [CrossRef]
5. Widodo, A.; Yang, B.S. Support vector machine in machine condition monitoring and fault diagnosis.Mech. Syst. Signal Process. 2007, 21, 2560–2574. [CrossRef]
6. Wong, P.K.; Yang, Z.; Vong, C.M.; Zhong, J. Real-time fault diagnosis for gas turbine generator systems usingextreme learning machine. Neurocomputing 2014, 128, 249–257. [CrossRef]
7. Santos, P.; Villa, L.F.; Reñones, A.; Bustillo, A.; Maudes, J. An SVM-based solution for fault detection in windturbines. Sensors 2015, 15, 5627–5648. [CrossRef] [PubMed]
8. Vong, C.M.; Wong, P.K.; Ip, W.F. A new framework of simultaneous-fault diagnosis using pairwiseprobabilistic multi-label classification for time-dependent patterns. IEEE Trans. Ind. Electron. 2013, 60,3372–3385. [CrossRef]
9. Yang, Z.; Wong, P.K.; Vong, C.M.; Zhong, J.; Liang, J. Simultaneous-fault diagnosis of gas turbine generatorsystems using a pairwise-coupled probabilistic classifier. Math. Probl. Eng. 2013, 2013. [CrossRef]
10. Yélamos, I.; Escudero, G.; Graells, M.; Puigjaner, L. Simultaneous fault diagnosis in chemical plants usingsupport vector machines. In Computer Aided Chemical Engineering; Valentin, P., Paul Serban, A., Eds.; Elsevier:Philadelphia, PA, USA, 2007; Volume 24, pp. 1253–1258.
11. Wang, Y.S.; Lee, C.M.; Kim, D.G.; Xu, Y. Sound-quality prediction for nonstationary vehicle interior noisebased on wavelet pre-processing neural network model. J. Sound Vib. 2007, 299, 933–947. [CrossRef]
12. Ahn, J.H.; Kwak, D.H.; Koh, B.H. Fault detection of a roller-bearing system through the emd of a waveletdenoised signal. Sensors 2014, 14, 15022–15038. [CrossRef] [PubMed]
13. Wang, Y.; Ma, Q.; Zhu, Q.; Liu, X.; Zhao, L. An intelligent approach for engine fault diagnosis based onhilbert–huang transform and support vector machine. Appl. Acoust. 2014, 75, 1–9. [CrossRef]
14. Soualhi, A.; Medjaher, K.; Zerhouni, N. Bearing health monitoring based on hilbert–huang transform,support vector machine, and regression. IEEE Trans. Instrum. Meas. 2015, 64, 52–62. [CrossRef]
15. Jiang, L.L.; Li, B.B.; Li, X.J. An Improved hht Method and Its Application in Fault Diagnosis of Roller Bearing.Appl. Mech. Mater. 2013, 273, 264–268. [CrossRef]
16. Wu, J.D.; Liu, C.H. Investigation of engine fault diagnosis using discrete wavelet transform and neuralnetwork. Expert Syst. Appl. 2008, 35, 1200–1213. [CrossRef]
17. Wu, J.D.; Chan, J.J. Faulted gear identification of a rotating machinery based on wavelet transform andartificial neural network. Expert Syst. Appl. 2009, 36, 8862–8875. [CrossRef]
18. Loutas, T.H.; Sotiriades, G.; Kalaitzoglou, I.; Kostopoulos, V. Condition monitoring of a single-stagegearbox with artificially induced gear cracks utilizing on-line vibration and acoustic emission measurements.Appl. Acoust. 2009, 70, 1148–1159. [CrossRef]
19. Yang, Y.; Yu, D.; Cheng, J. A fault diagnosis approach for roller bearing based on imf envelope spectrum andsvm. Measurement 2007, 40, 943–950. [CrossRef]
20. Cerrada, M.; Sánchez, R.V.; Cabrera, D.; Zurita, G.; Li, C. Multi-stage feature selection by using geneticalgorithms for fault diagnosis in gearboxes based on vibration signal. Sensors 2015, 15, 23903–23926.[CrossRef] [PubMed]
21. Wong, P.K.; Zhong, J.; Yang, Z.; Vong, C.M. Sparse bayesian extreme learning committee machine for enginesimultaneous fault diagnosis. Neurocomputing 2016, 174, 331–343. [CrossRef]
22. Tresp, V. A bayesian committee machine. Neural Comput. 2000, 12, 2719–2741. [CrossRef] [PubMed]23. Chen, S.; Wang, W.; van Zuylen, H. Construct support vector machine ensemble to detect traffic incident.
Expert Syst. Appl. 2009, 36, 10976–10986. [CrossRef]24. Hansen, L.K.; Salamon, P. Neural network ensembles. IEEE Trans. Pattern Anal. Mach. Intell. 1990, 12,
993–1001. [CrossRef]

Sensors 2016, 16, 185 19 of 19
25. Wu, J.D.; Chiang, P.H.; Chang, Y.W.; Shiao, Y.J. An expert system for fault diagnosis in internal combustionengines using probability neural network. Expert Syst. Appl. 2008, 34, 2704–2713. [CrossRef]
26. Wang, C.; Zhou, J.; Qin, H.; Li, C.; Zhang, Y. Fault diagnosis based on pulse coupled neural network andprobability neural network. Expert Syst. Appl. 2011, 38, 14307–14313. [CrossRef]
27. Wang, G.; Yang, Y.; Xie, Q.; Zhang, Y. Force based tool wear monitoring system for milling process based onrelevance vector machine. Adv. Eng. Softw. 2014, 71, 46–51. [CrossRef]
28. Zio, E.; Di Maio, F. Fatigue crack growth estimation by relevance vector machine. Expert Syst. Appl. 2012, 39,10681–10692. [CrossRef]
29. Wu, T.F.; Lin, C.J.; Weng, R.C. Probability estimates for multi-class classification by pairwise coupling.J. Mach. Learn. Res. 2004, 5, 975–1005.
30. Robinson, J.; Rahmat-Samii, Y. Particle swarm optimization in electromagnetics. IEEE Trans. Antennas Propag.2004, 52, 397–407. [CrossRef]
31. Trelea, I.C. The particle swarm optimization algorithm: Convergence analysis and parameter selection.Inf. Process. Lett. 2003, 85, 317–325. [CrossRef]
32. Wu, Z.; Huang, N.E. Ensemble empirical mode decomposition: A noise-assisted data analysis method.Adv. Adapt. Data Anal. 2009, 1, 1–41. [CrossRef]
33. Lei, Y.; He, Z.; Zi, Y. Application of the eemd method to rotor fault diagnosis of rotating machinery.Mech. Syst. Signal Process. 2009, 23, 1327–1338. [CrossRef]
34. Widodo, A.; Yang, B.-S. Application of relevance vector machine and survival probability to machinedegradation assessment. Expert Syst. Appl. 2011, 38, 2592–2599. [CrossRef]
35. Hastie, T.; Tibshirani, R. Classification by pairwise coupling. Ann. Stat. 1998, 26, 451–471. [CrossRef]36. Wong, P.K.; Tam, L.M.; Li, K.; Vong, C.M. Engine idle-speed system modelling and control optimization
using artificial intelligence. Proc. Inst. Mech. Eng. Part D J. Automob. Eng. 2010, 224, 55–72. [CrossRef]37. Hripcsak, G.; Rothschild, A.S. Agreement, the f-measure, and reliability in information retrieval. J. Am. Med.
Inform. Assoc. 2005, 12, 296–298. [CrossRef] [PubMed]38. Qu, Y.; He, D.; Yoon, J.; van Hecke, B.; Bechhoefer, E.; Zhu, J. Gearbox tooth cut fault diagnostics using
acoustic emission and vibration sensors—A comparative study. Sensors 2014, 14, 1372–1393. [CrossRef][PubMed]
© 2016 by the authors; licensee MDPI, Basel, Switzerland. This article is an open accessarticle distributed under the terms and conditions of the Creative Commons by Attribution(CC-BY) license (http://creativecommons.org/licenses/by/4.0/).