Simple TVSS design UL 1449 listed
26
PSERC 1 Grid Effects of Cloud-Induced Variation in Solar Photovoltaic Generation Ward Jewell Wichita State University Power Systems Engineering Research Center [email protected]
Transcript of Simple TVSS design UL 1449 listed
PSERC
1
Grid Effects of Cloud-Induced Variation in Solar Photovoltaic Generation
Ward JewellWichita State University
Power Systems Engineering Research Center
PSERC
2
17
18
19
20
21
22
23C
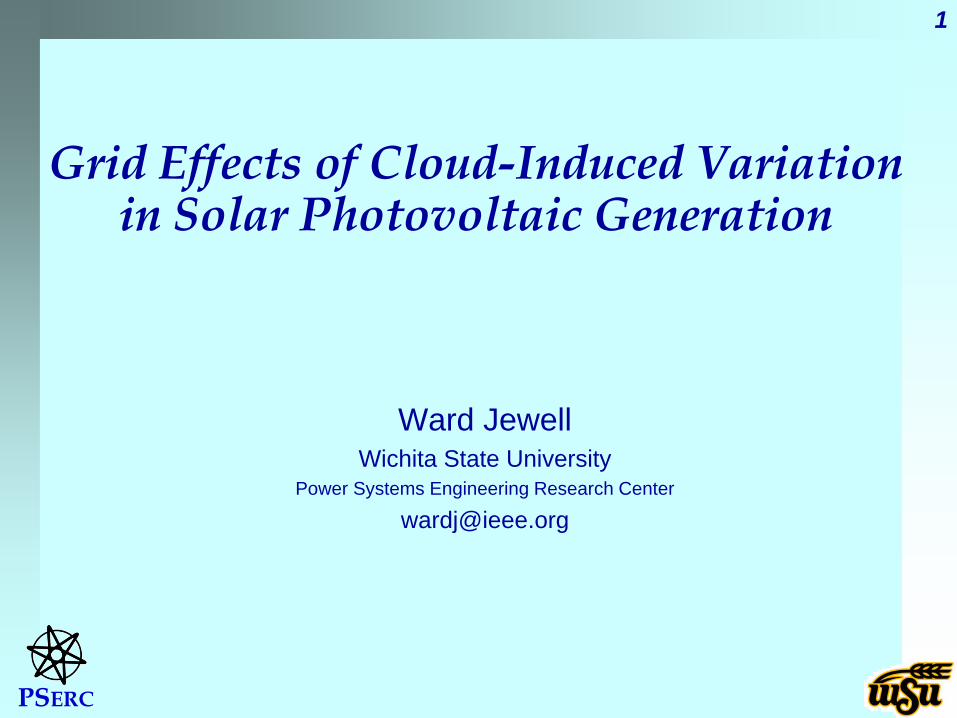
ost o
f PV
Gen
erat
ed
Elec
tric
ty (c
ents
/kW
h)
Year
September 2010:– Modules: $4.08 / W -- Inverters: $0.715 / WSolarBuzz Solar Electricity Prices, Sept. 2010, www.solarbuzz.com/SolarPrices.htm
PSERC
3
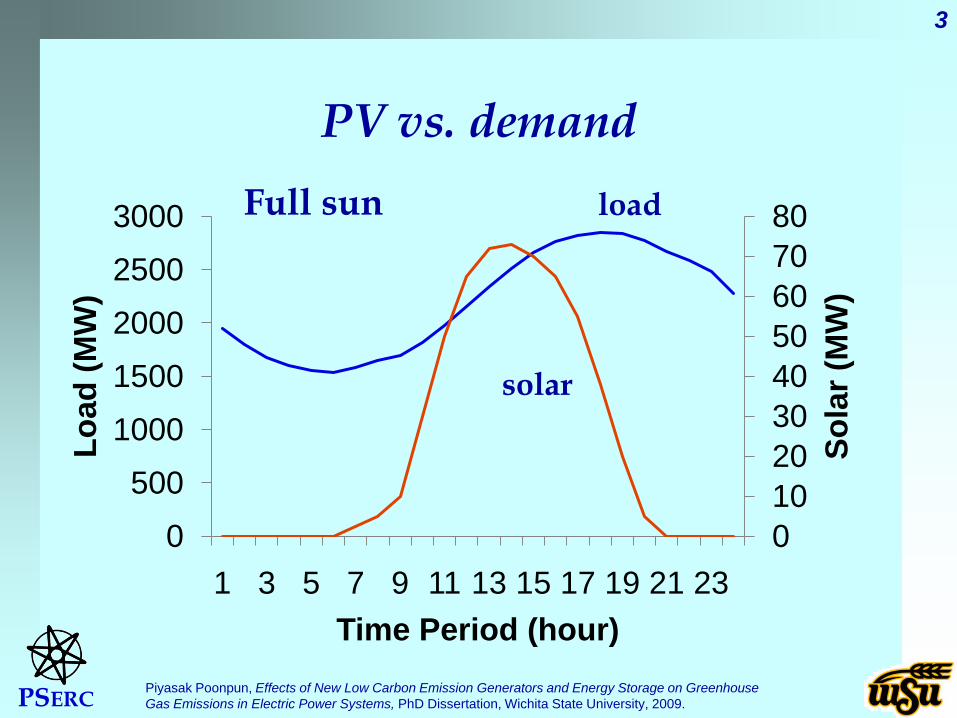
PV vs. demand
01020304050607080
0
500
1000
1500
2000
2500
3000
1 3 5 7 9 11 13 15 17 19 21 23
Sola
r (M
W)
Load
(MW
)
Time Period (hour)Piyasak Poonpun, Effects of New Low Carbon Emission Generators and Energy Storage on Greenhouse Gas Emissions in Electric Power Systems, PhD Dissertation, Wichita State University, 2009.
Full sun load
solar
PSERC
4
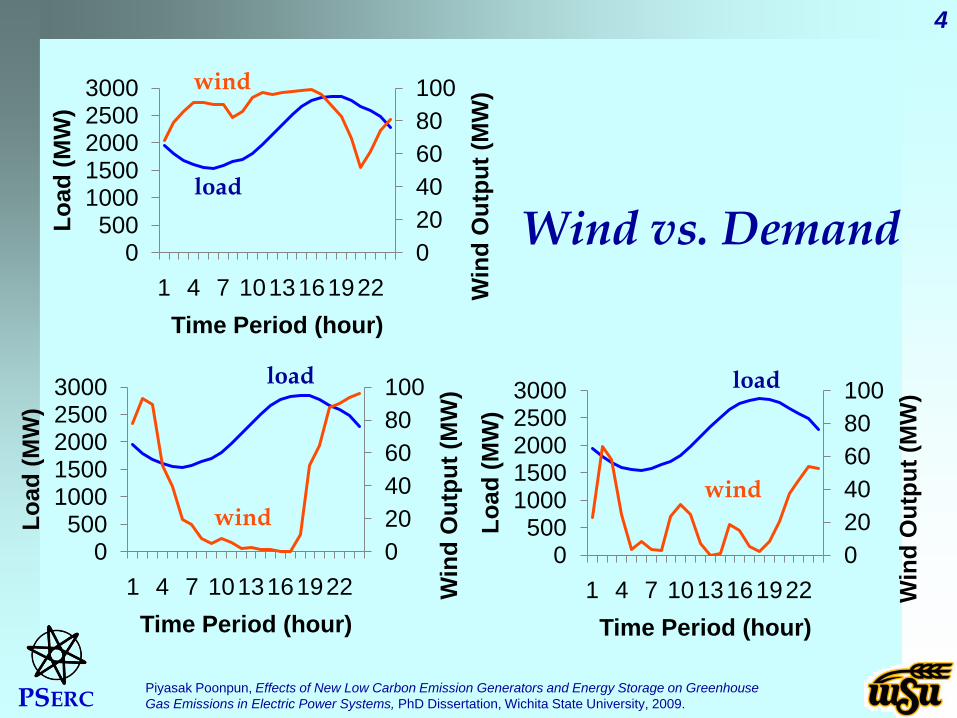
Wind vs. Demand020406080100
0500
10001500200025003000
1 4 7 1013161922 Win
d O
utpu
t (M
W)
Load
(MW
)
Time Period (hour)
020406080100
0500
10001500200025003000
1 4 7 1013161922 Win
d O
utpu
t (M
W)
Load
(MW
)
Time Period (hour)
020406080100
0500
10001500200025003000
1 4 7 1013161922 Win
d O
utpu
t (M
W)
Load
(MW
)
Time Period (hour)
Piyasak Poonpun, Effects of New Low Carbon Emission Generators and Energy Storage on Greenhouse Gas Emissions in Electric Power Systems, PhD Dissertation, Wichita State University, 2009.
load
load load
wind
windwind
PSERC
5
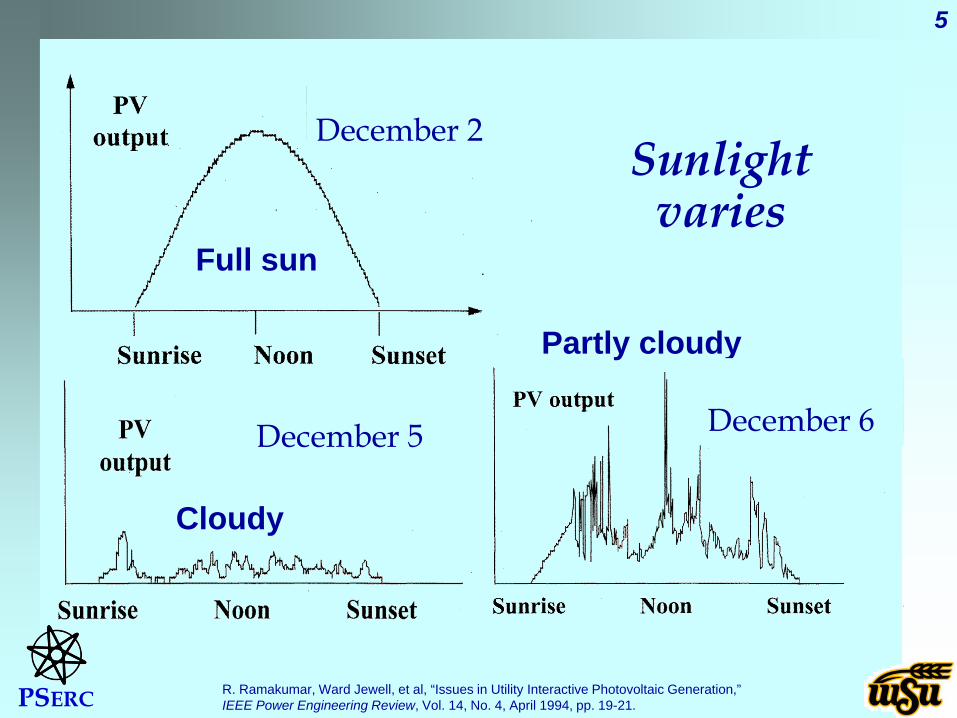
Sunlightvaries
R. Ramakumar, Ward Jewell, et al, “Issues in Utility Interactive Photovoltaic Generation,” IEEE Power Engineering Review, Vol. 14, No. 4, April 1994, pp. 19-21.
Full sun
Cloudy
Partly cloudy
December 2
December 5 December 6

PSERC
6
Operating Reserves
Typical capacity credits– Coal, nuclear, natural gas, oil, hydro: 100%– Solar 60-90%– Geothermal 80-100%– Wind 20-40%
PSERC
7
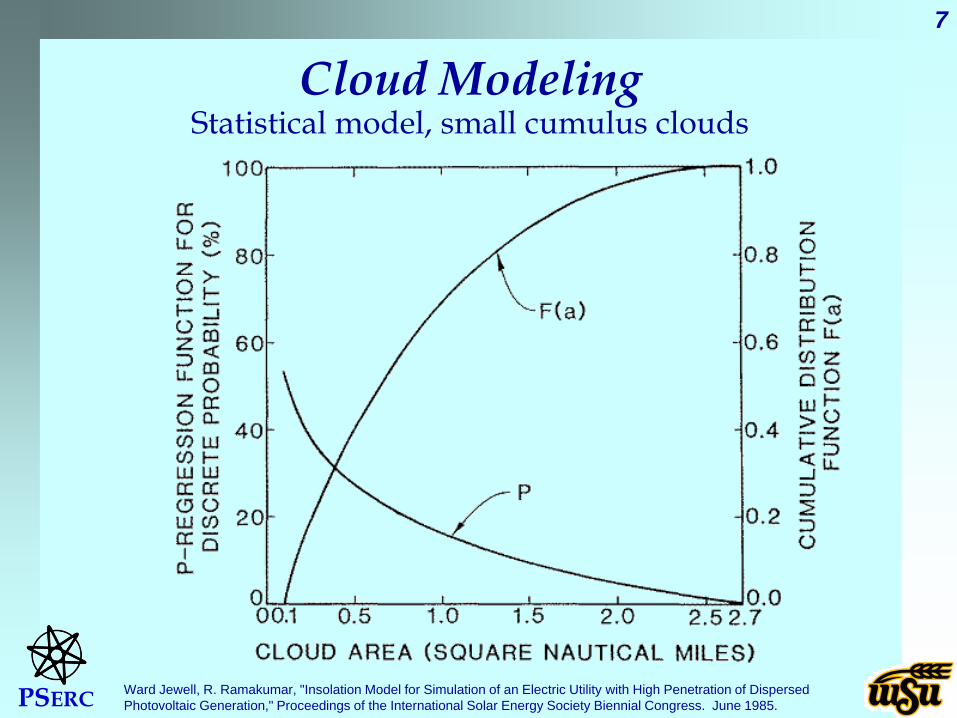
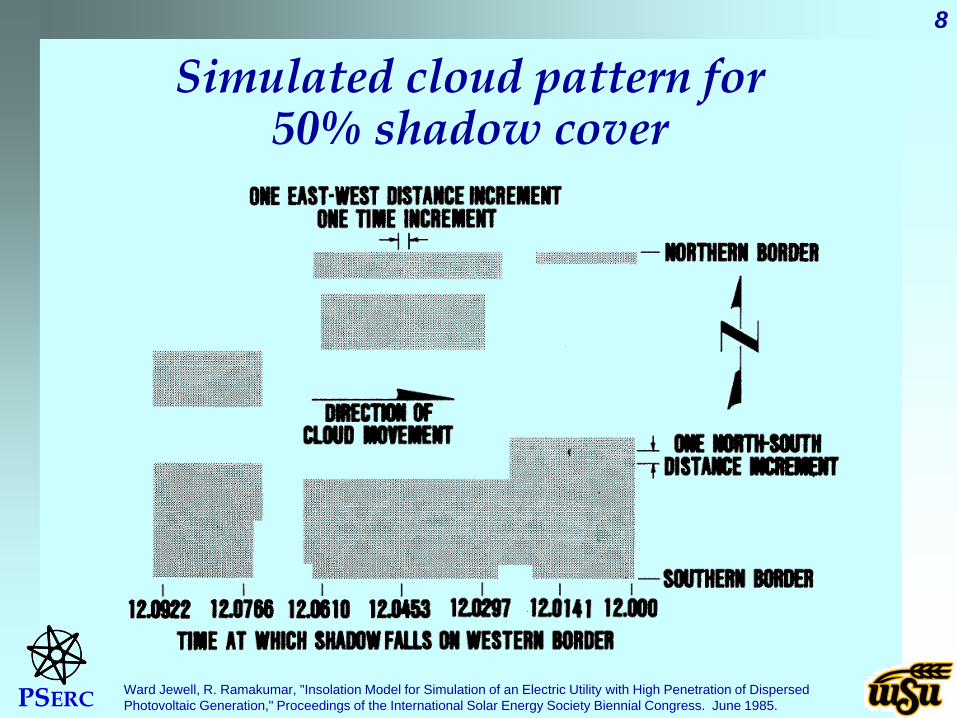
Cloud ModelingStatistical model, small cumulus clouds
Ward Jewell, R. Ramakumar, "Insolation Model for Simulation of an Electric Utility with High Penetration of Dispersed Photovoltaic Generation," Proceedings of the International Solar Energy Society Biennial Congress. June 1985.
PSERC
8
Simulated cloud pattern for 50% shadow cover
Ward Jewell, R. Ramakumar, "Insolation Model for Simulation of an Electric Utility with High Penetration of Dispersed Photovoltaic Generation," Proceedings of the International Solar Energy Society Biennial Congress. June 1985.
PSERC
9
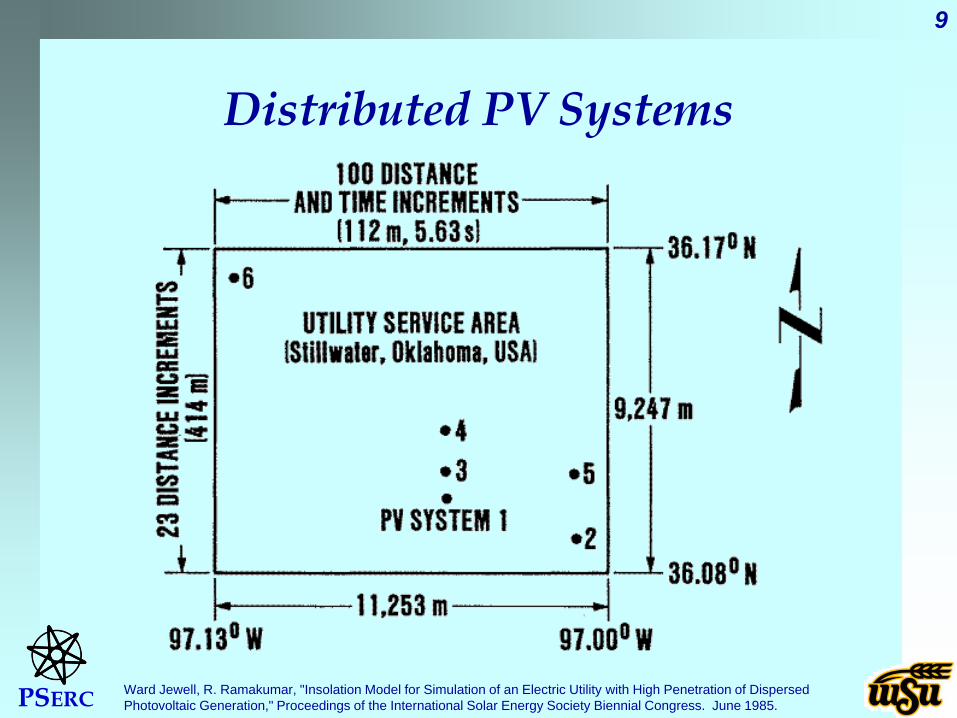
Distributed PV Systems
Ward Jewell, R. Ramakumar, "Insolation Model for Simulation of an Electric Utility with High Penetration of Dispersed Photovoltaic Generation," Proceedings of the International Solar Energy Society Biennial Congress. June 1985.
PSERC
10
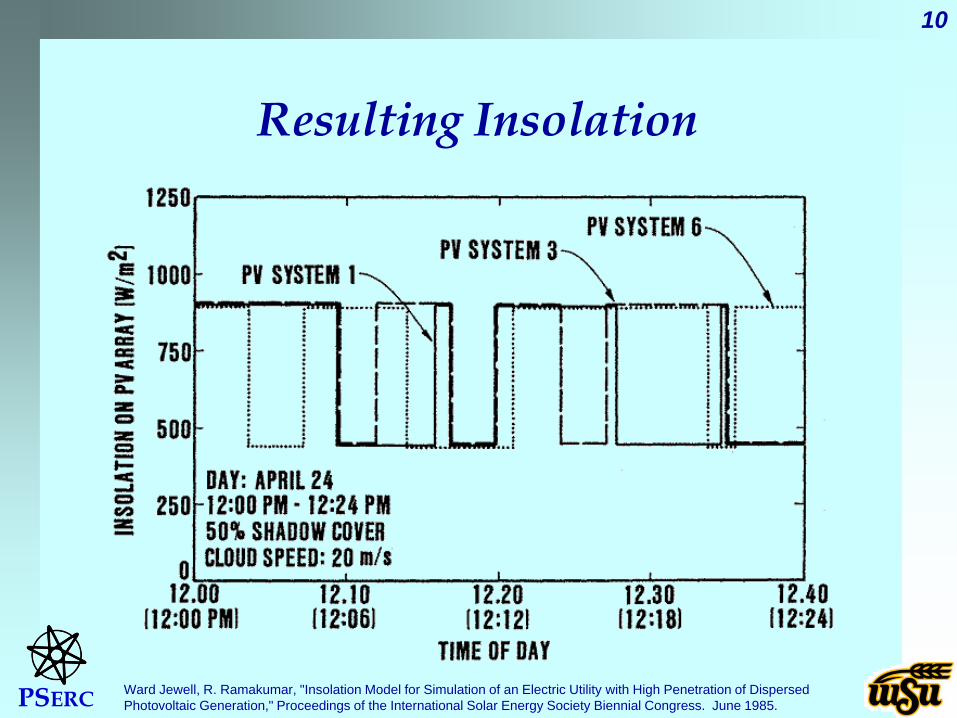
Resulting Insolation
Ward Jewell, R. Ramakumar, "Insolation Model for Simulation of an Electric Utility with High Penetration of Dispersed Photovoltaic Generation," Proceedings of the International Solar Energy Society Biennial Congress. June 1985.
PSERC
11
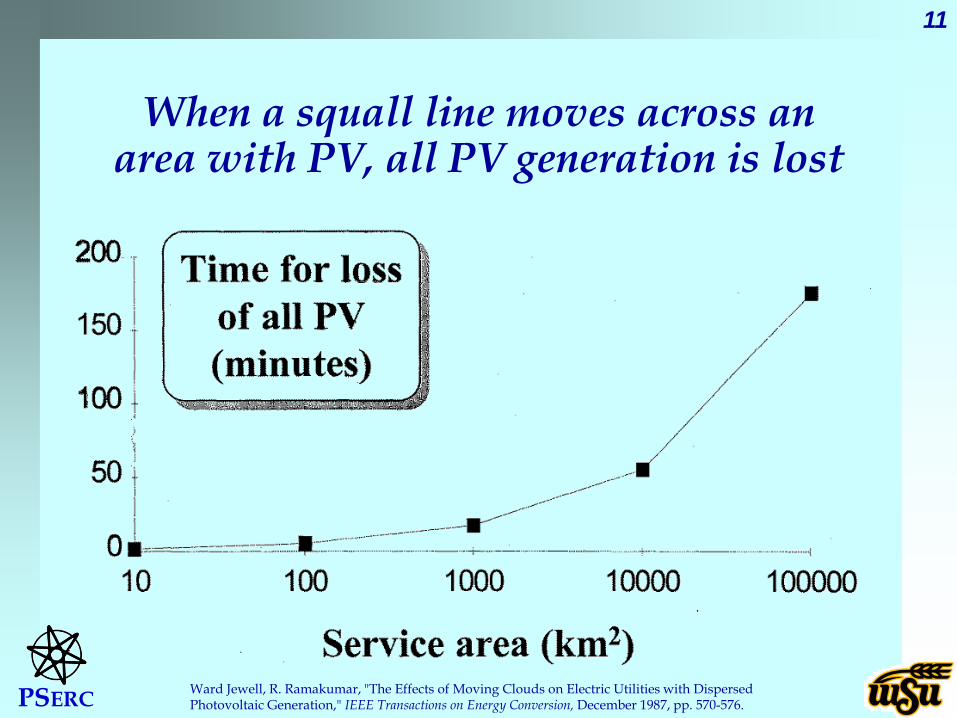
When a squall line moves across an area with PV, all PV generation is lost
Ward Jewell, R. Ramakumar, "The Effects of Moving Clouds on Electric Utilities with Dispersed Photovoltaic Generation," IEEE Transactions on Energy Conversion, December 1987, pp. 570-576.
PSERC
12
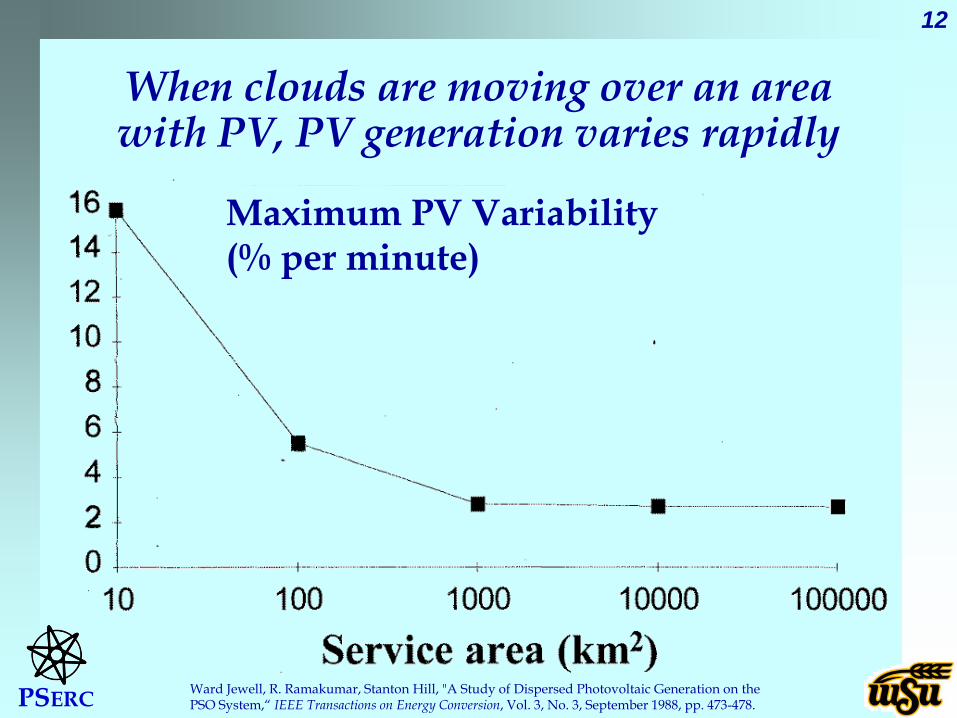
When clouds are moving over an area with PV, PV generation varies rapidly
Ward Jewell, R. Ramakumar, Stanton Hill, "A Study of Dispersed Photovoltaic Generation on the PSO System,“ IEEE Transactions on Energy Conversion, Vol. 3, No. 3, September 1988, pp. 473-478.
Maximum PV Variability(% per minute)
PSERC
13
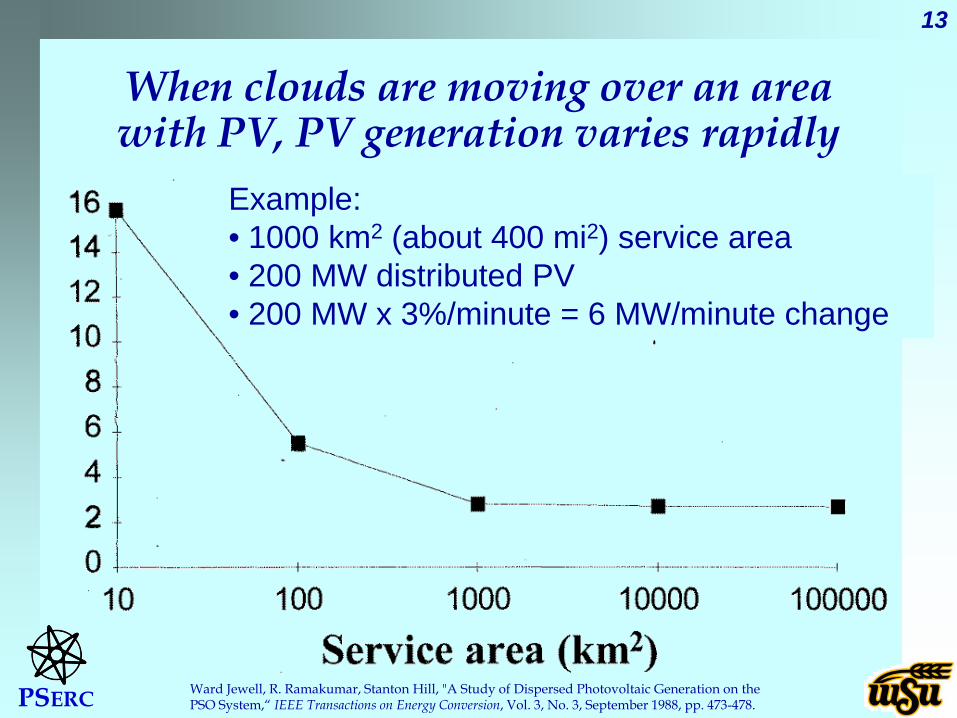
When clouds are moving over an area with PV, PV generation varies rapidly
Ward Jewell, R. Ramakumar, Stanton Hill, "A Study of Dispersed Photovoltaic Generation on the PSO System,“ IEEE Transactions on Energy Conversion, Vol. 3, No. 3, September 1988, pp. 473-478.
Example: • 1000 km2 (about 400 mi2) service area• 200 MW distributed PV• 200 MW x 3%/minute = 6 MW/minute change
PSERC
14
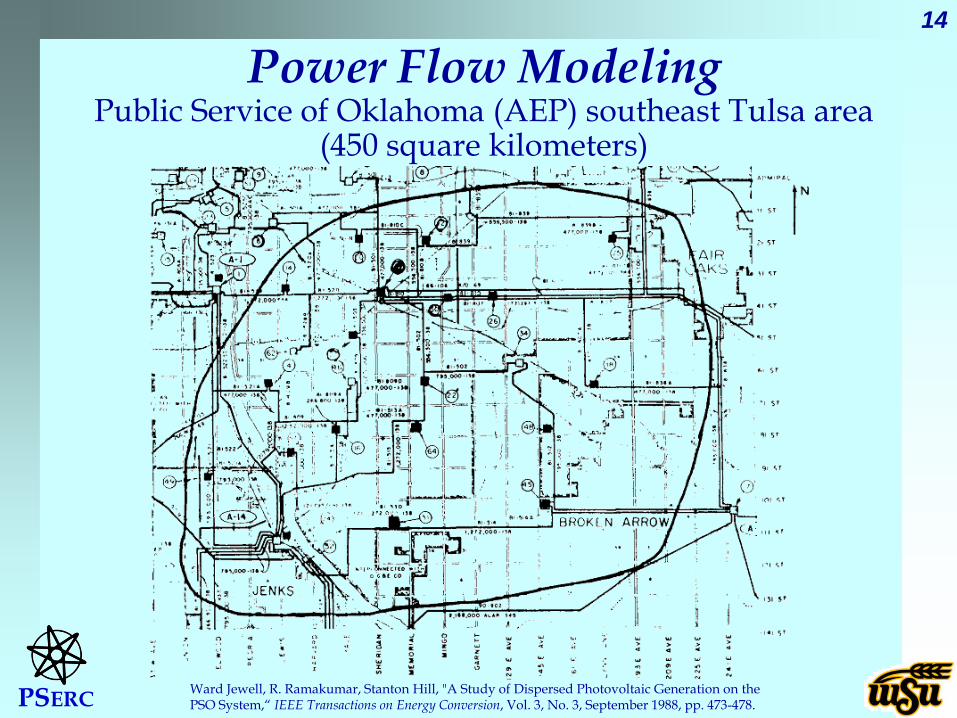
Power Flow ModelingPublic Service of Oklahoma (AEP) southeast Tulsa area
(450 square kilometers)
Ward Jewell, R. Ramakumar, Stanton Hill, "A Study of Dispersed Photovoltaic Generation on the PSO System,“ IEEE Transactions on Energy Conversion, Vol. 3, No. 3, September 1988, pp. 473-478.
PSERC
15
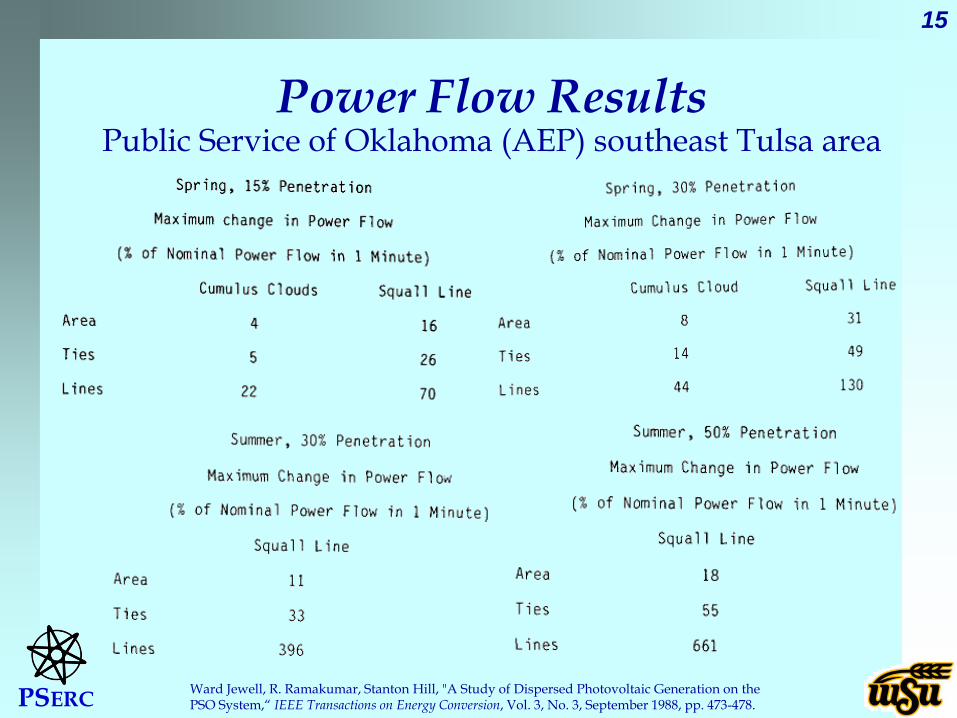
Power Flow ResultsPublic Service of Oklahoma (AEP) southeast Tulsa area
Ward Jewell, R. Ramakumar, Stanton Hill, "A Study of Dispersed Photovoltaic Generation on the PSO System,“ IEEE Transactions on Energy Conversion, Vol. 3, No. 3, September 1988, pp. 473-478.
PSERC
16
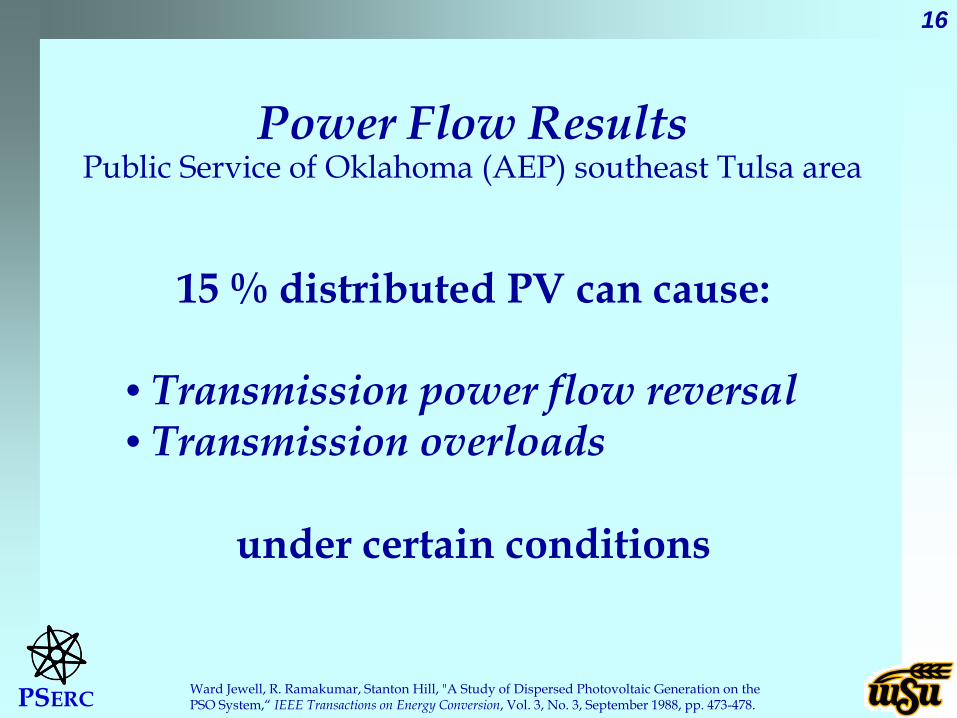
Power Flow ResultsPublic Service of Oklahoma (AEP) southeast Tulsa area
Ward Jewell, R. Ramakumar, Stanton Hill, "A Study of Dispersed Photovoltaic Generation on the PSO System,“ IEEE Transactions on Energy Conversion, Vol. 3, No. 3, September 1988, pp. 473-478.
15 % distributed PV can cause:
• Transmission power flow reversal• Transmission overloads
under certain conditions
PSERC
17
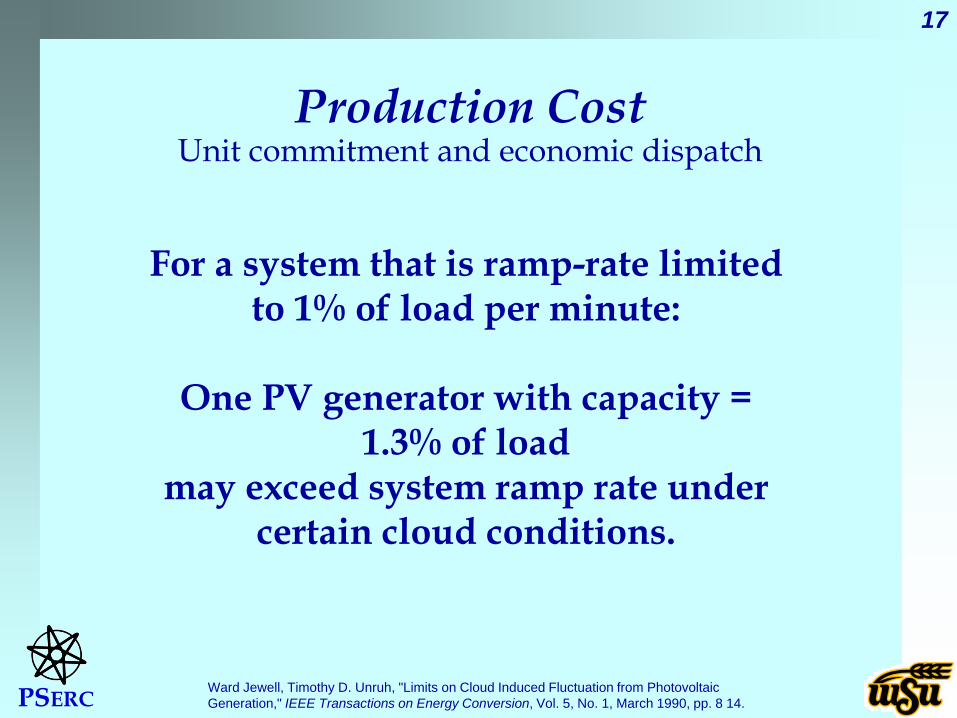
Production CostUnit commitment and economic dispatch
Ward Jewell, Timothy D. Unruh, "Limits on Cloud Induced Fluctuation from Photovoltaic Generation," IEEE Transactions on Energy Conversion, Vol. 5, No. 1, March 1990, pp. 8 14.
For a system that is ramp-rate limitedto 1% of load per minute:
One PV generator with capacity = 1.3% of load
may exceed system ramp rate under certain cloud conditions.
PSERC
18
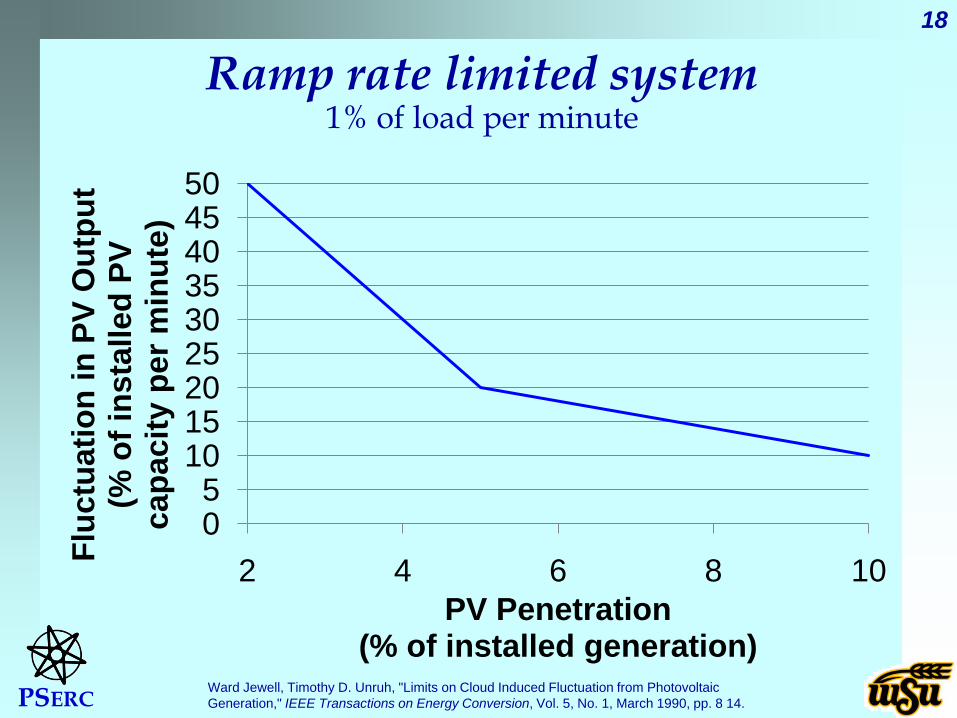
Ramp rate limited system1% of load per minute
Ward Jewell, Timothy D. Unruh, "Limits on Cloud Induced Fluctuation from Photovoltaic Generation," IEEE Transactions on Energy Conversion, Vol. 5, No. 1, March 1990, pp. 8 14.
05
101520253035404550
2 4 6 8 10Fluc
tuat
ion
in P
V O
utpu
t (%
of i
nsta
lled
PV
capa
city
per
min
ute)
PV Penetration (% of installed generation)
PSERC
19
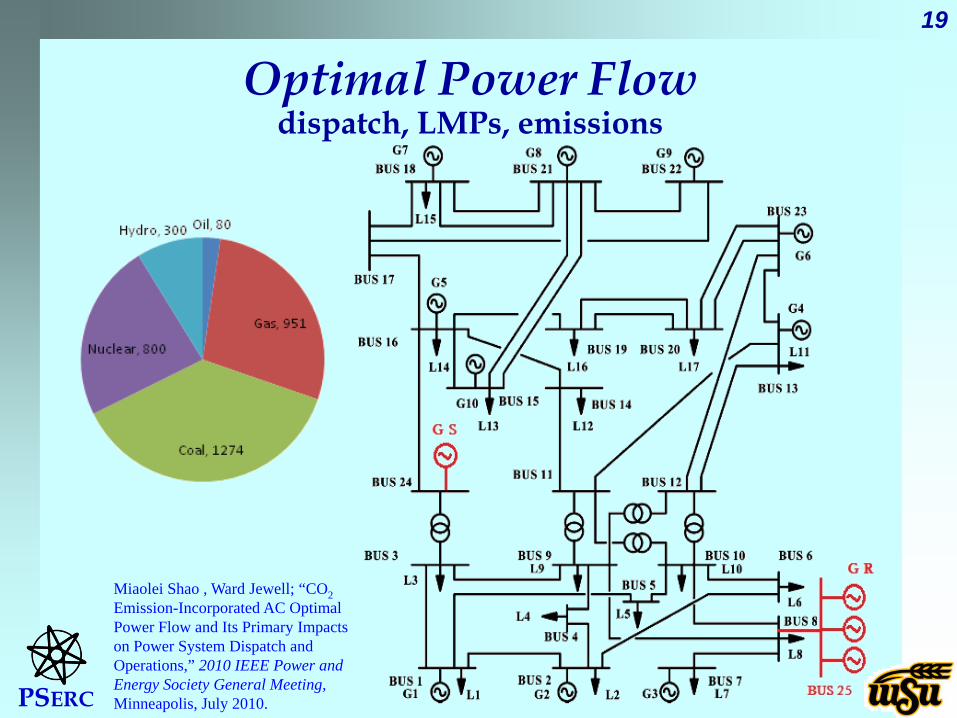
Optimal Power Flowdispatch, LMPs, emissions
Miaolei Shao , Ward Jewell; “CO2Emission-Incorporated AC Optimal Power Flow and Its Primary Impacts on Power System Dispatch and Operations,” 2010 IEEE Power and Energy Society General Meeting, Minneapolis, July 2010.
PSERC
20
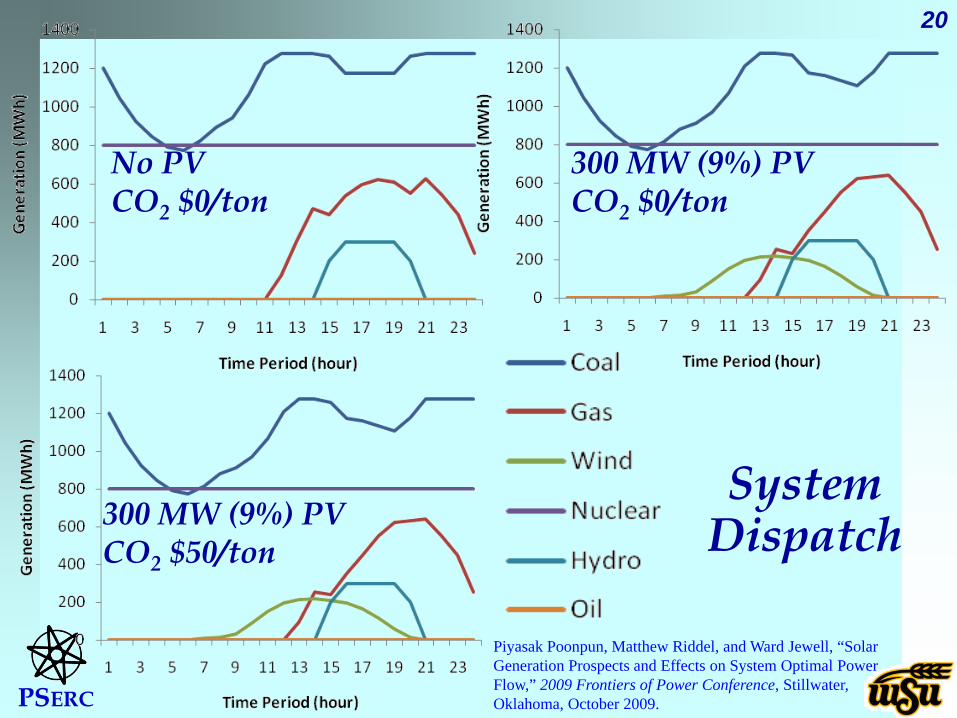
SystemDispatch
No PVCO2 $0/ton
300 MW (9%) PVCO2 $0/ton
300 MW (9%) PVCO2 $50/ton
Piyasak Poonpun, Matthew Riddel, and Ward Jewell, “Solar Generation Prospects and Effects on System Optimal Power Flow,” 2009 Frontiers of Power Conference, Stillwater, Oklahoma, October 2009.

PSERC
21
Marginal Pricesat PV bus
No PVCO2 $0/ton
300 MW (9%) PVCO2 $0/ton
300 MW (9%) PVCO2 $50/ton
PSERC
22
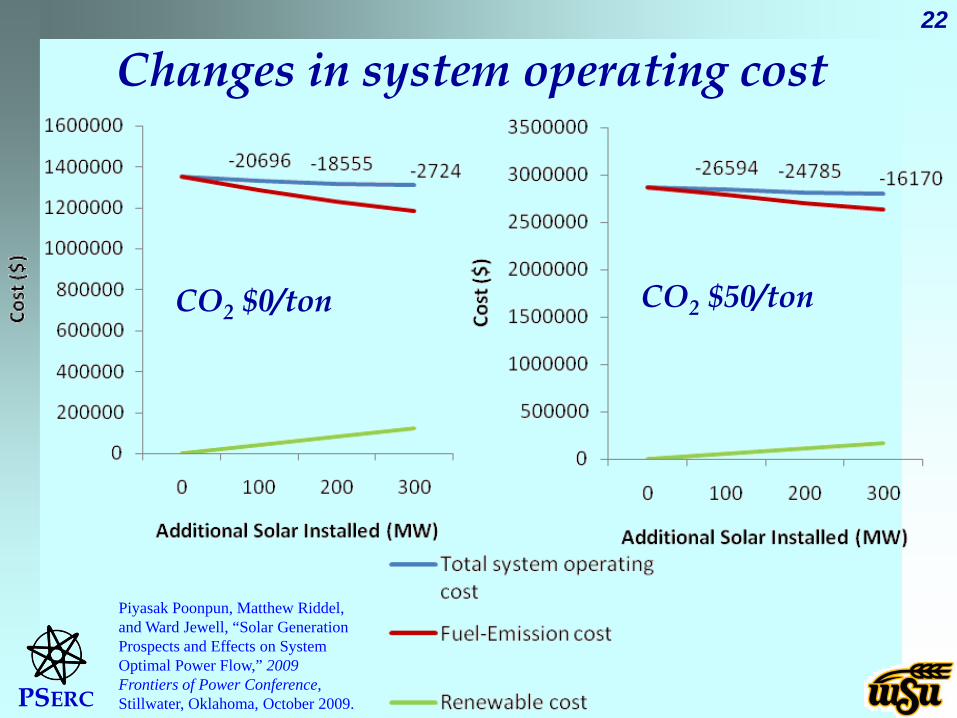
Changes in system operating cost
CO2 $50/tonCO2 $0/ton
Piyasak Poonpun, Matthew Riddel, and Ward Jewell, “Solar Generation Prospects and Effects on System Optimal Power Flow,” 2009 Frontiers of Power Conference, Stillwater, Oklahoma, October 2009.

PSERC
23
Changes in CO2 emissions
CO2 $50/tonCO2 $0/ton
Piyasak Poonpun, Matthew Riddel, and Ward Jewell, “Solar Generation Prospects and Effects on System Optimal Power Flow,” 2009 Frontiers of Power Conference, Stillwater, Oklahoma, October 2009.
PSERC
24
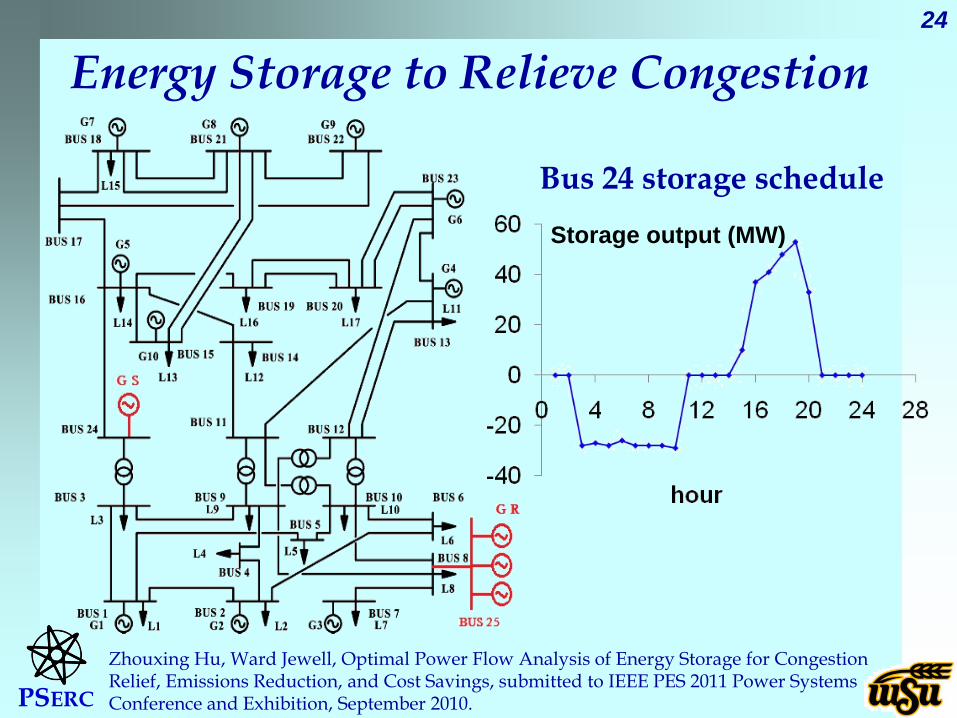
Energy Storage to Relieve Congestion
Storage output (MW)
Bus 24 storage schedule
Zhouxing Hu, Ward Jewell, Optimal Power Flow Analysis of Energy Storage for Congestion Relief, Emissions Reduction, and Cost Savings, submitted to IEEE PES 2011 Power Systems Conference and Exhibition, September 2010.
PSERC
25
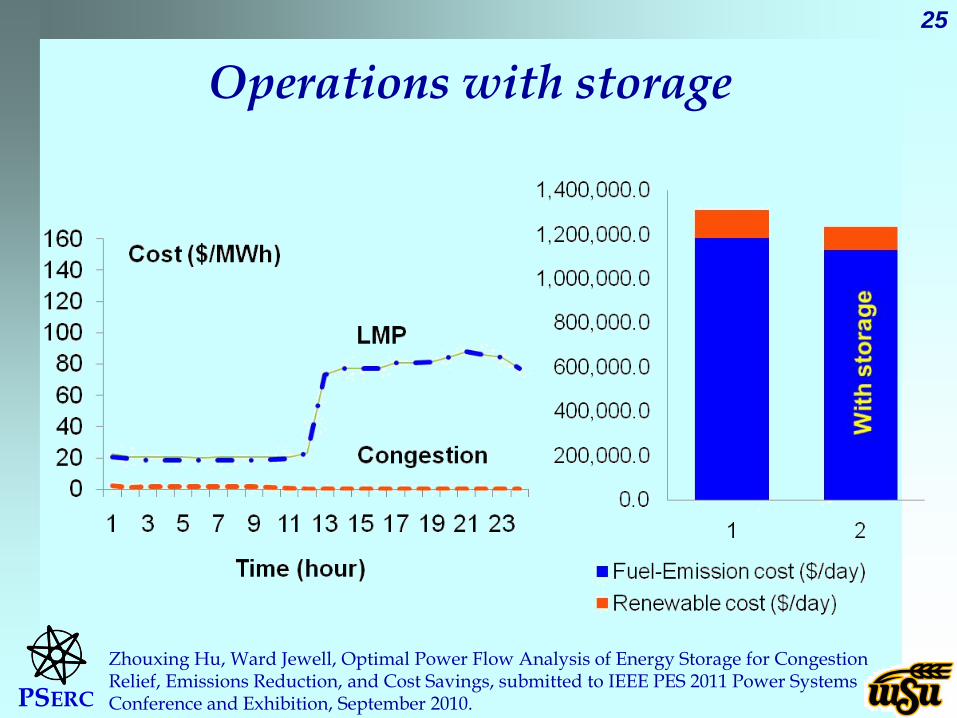
Operations with storage
Zhouxing Hu, Ward Jewell, Optimal Power Flow Analysis of Energy Storage for Congestion Relief, Emissions Reduction, and Cost Savings, submitted to IEEE PES 2011 Power Systems Conference and Exhibition, September 2010.
PSERC
26
Research supported byPower Systems Engineering Research Center
(pserc.org)Kansas Electric Utilities Research Program
Public Service of Oklahoma (AEP)
Ward JewellWichita State University
Power Systems Engineering Research Center