Should Workers Care about Firm Size?1 · Should Workers Care about Firm Size?1 ... We apply GMM...
34
Should Workers Care about Firm Size? 1 Ana Ferrer University of British Columbia 2 St´ ephanie Lluis University of Minnesota 3 January 2004 1 We thank seminar participants at the university of British Columbia and the university of Minnesota for valuable comments on earlier versions of this paper. 2 Department of Economics, 997-1873 East Mall, Vancouver, BC V6T 1Z1, Canada. Tel: (604) 822 8606, e-mail: [email protected] 3 Industrial Relations Center, 321 19th Avenue South, Minneapolis, MN 55455, USA. Tel: (612) 624 4171, e-mail: [email protected]
Transcript of Should Workers Care about Firm Size?1 · Should Workers Care about Firm Size?1 ... We apply GMM...
Should Workers Care about Firm Size?1
Ana Ferrer
University of British Columbia2
Stephanie Lluis
University of Minnesota3
January 2004
1We thank seminar participants at the university of British Columbia and the university of Minnesota
for valuable comments on earlier versions of this paper.2Department of Economics, 997-1873 East Mall, Vancouver, BC V6T 1Z1, Canada. Tel: (604) 822
8606, e-mail: [email protected] Relations Center, 321 19th Avenue South, Minneapolis, MN 55455, USA. Tel: (612) 624
4171, e-mail: [email protected]

Abstract
The question of wage differentials by firm size has been studied for several decades with no
commonly accepted explanations for why large firms pay more. In this paper, we reexamine
the relationship between firm-size and wage outcomes by estimating the returns to unmea-
sured ability between large and small firms. Our empirical methodology, based on non linear
instrumental variable estimations, allows us to directly estimate the returns to unmeasured
ability by firm size and therefore to test the two main theories of wage determination proposed
to explain the relationship between firm size and wages, namely ability sorting and job screen-
ing. We use data from the Survey of Labour and Income Dynamics (SLID) which provides
longitudinal information on workers and firms characteristics including establishment and firm
size. We find significant differences in the returns to unmeasured ability across firm size. In
particular, we find that the returns to unmeasured ability seem to follow a non linear pattern.
The returns to unmeasured ability are significantly higher in medium size (above 500 but below
1000 workers) firms relative to small firms. However, the returns to unmeasured ability are
not significantly greater in large firms relative to medium or small firms. Overall, it seems that
ability sorting dominates for moves from small to medium size firms in that ability is more
productive and therefore more rewarded in the latter than the former. On the other hand,
when firms become “too large”, the monitoring costs hypothesis seems to dominate in that
ability is not more rewarded than in smaller firms.
JEL codes: J31 J33 J41 J62
Key words: Firm Size, Comparative Advantage, Self-selection, Job Screening, Ability Sorting

1
1 Introduction
The existence of firm-size wage differentials, the observation that firms of different sizes pay
different wages for observationally equivalent workers, is a widely documented fact in the
empirical literature on wage determination. These studies generally find that none of the ex-
planatory variables used in the wage equation can account for the existence of a size-wage gap. 1
As a result, the literature has concluded that the explanation resides in unmeasured factors
in the error term. This term might capture intrinsic differences in individual ability affecting
workers decisions to join a large or a small firm. It may also represent differences between large
and small firms’ decisions to reward the various aspects of the workers’ skills. Two plausible
theories of wage determination offer suggestions as to what this unmeasured factor might be.
The first one is ability sorting, in which high ability workers have a comparative advantage in
larger firms, and the second is job screening, according to which greater monitoring costs in
larger firms implies lower reward associated with ability or any individual traits, difficult to
measure on the job. So far, the literature has not been able to test any of these theories as
the empirical methods used either did not include an unmeasured ability term (simple OLS)
or attempted to difference it out using fixed-effects.
In this paper, we reexamine the relationship between firm-size and wage outcomes by
emphasizing the role of unmeasured (to the econometrician) ability and the non random allo-
cation of workers into firms of different sizes. We apply GMM techniques to longitudinal data
on wages and benefits and employer size to estimate and test for differences in the returns to
unmeasured ability between large and small firms. The method based on non linear instru-1Even in the most recent empirical literature using richer data on human capital aspects such as the presence
of training opportunities (Hu (2003)), on-the-job-search (Winter-Ebmer and Zweimuller (1999)) or better in-
formation on the employer side using matched employer-employee data (Troske (1999)), the size-wage premium
cannot be fully explained by any of the factors analyzed.
2
mental variables permits a direct estimation of the returns to unmeasured aspects of skills.
This will allow us to test the two main theories of wage determination proposed to explain the
relationship between firm size and wages, namely ability sorting and job screening.
The estimated size-wage premium is about 15% in the United States and 10% in Canada.
Empirical studies investigating the source of this wage differential have analyzed the explana-
tory power of various factors related to worker and firm characteristics such as education,
unionization and industry type.2 These studies have been limited in two ways. First, they do
not allow for the possibility that human capital attributes may not be equally valued in large
and small firms. By doing so, they restrict the effect of firm size on wages to being only a
shift parameter. Second, the use of fixed-effect estimations allows one to eliminate the bias
caused by the ability term (assuming it is time invariant and equally rewarded in large and
small firms) to estimate the effects of other parameters. On the other hand, it does not allow
an estimation of ability effects. Moreover, if large and small firms have different wage policies
concerning their treatment of measured and unmeasured skills, then the fixed-effect method
does not eliminate the effect of unmeasured ability on wage outcomes.
This paper addresses the particular role of ability in the wage policy decisions of large and
small firms in a framework of non random assignment of workers into firms of different sizes.
On the employer side, firms of different size have distinct wage policies regarding the evaluation
of the various dimensions of human capital. On the workers side, individuals with a particular
set of skills have a comparative advantage in companies of a given size. In this framework,
both measurable (education and experience) and unmeasurable (initiative, ambition, loyalty)
human capital attributes are differently rewarded across firms of different sizes. Therefore,
individuals will self-select into large and small firms according to such policies and their own
endowment of measured and unmeasured skills.2See Oi and Idson (1999) for a review of the literature on firm size and wages in the US.
3
The two leading theories of wage determination used to explain the relationship between
firm size and wage outcomes, ability sorting and job screening, can be tested in a wage equa-
tion framework because each theory provides different predictions in terms of the returns to
unmeasured skills or ability. According to the ability sorting argument, large firms attract high
ability workers because they need better workers as the execution of the different production
processes in large firms is more complex than in small firms. 3 In addition, large firms have
more ways to attract better workers than small firms by providing promotion opportunities,
training and career development. 4 As a result, returns to unmeasured skills or ability should
be greater in large firms than in small ones. In the job screening hypothesis, larger firms have
higher monitoring costs than small firms which leads large firms to more highly value directly
observed skills (like education and experience) and value less unobservable skills compared to
small firms. 5 As a result, returns to ability should be smaller in large than in small firms, a
prediction opposite to the ability or productivity hypothesis.
The importance of worker self-selection in the analysis of firm size on wages has been
previously analyzed by Idson and Feaster (1990) using cross-sectional data from the 1979 May3See Oi (1983) and Oi and Idson (1999) for a theoretical and empirical analysis of the productivity explanation
of the size-wage gap.4See Gibbons (1998) for a review of the empirical literature on wage dynamics within organizations and the
role of ability in career development (fast-tracks). More recently, Agell (2003) conducts an empirical analysis
of the differences in compensation policies between small and large U.S. firms. The author finds evidence that
career ladders and the use of performance pay increases with firm size.5See Garen (1985) for a theoretical model and an empirical test supporting this prediction. Barron, Black
and Loewenstein (1987) present evidence of a related implication of the monitoring costs hypothesis. They
find that large employers screen applicants more extensively compared to small employers and provide higher
starting wages. More recently, Hu (2003) uses cross-sectional data from the Benefits supplement of the CPS to
show that large employers hire younger workers than small employers and that the size-wage premium for newly
hired workers disappears for workers older than 35. Both empirical studies are consistent with the idea that
large firms use pre-hiring screening practices to reduce monitoring costs associated with on-the-job screening.
4
CPS and Lluis (2003) comparing the size-wage structure in the U.S. and Canada with data
from the U.S. CPS and the Canadian LFS for the year 1998. The latter author finds a similar
wage structure in both countries as well as evidence of non random selection of workers into
firms of different sizes. In both of these studies, the method used to characterize non random
selection is the Heckman two-step method. Although this method provides evidence of the
presence of workers non random selection, it does not provide any quantitative information on
the importance of unmeasured ability in the selectivity mechanism. Moreover, the selection
model is one-sided in that it characterizes workers’ decisions to join a firm but remains silent
on firms’ selection decisions. However, the overall effect of firm size on wages depends on both
which types of workers tend to choose to work in a large or a small firm as well as the effect
of firm size on the wages of different types of workers.
The method we use in the paper relies on a panel data estimator estimated using GMM
techniques. It is appropriate for the analysis of multi-sector models of wage determination in
which the time-invariant component of the error term is differentially rewarded and selection
comes from both sides of the market. 6 This type of analysis requires panel data where a
sufficiently large number of individuals can be observed for at least three time periods. Our
analysis is applied to longitudinal data from the Canadian Survey of Labour and Income
Dynamics (SLID) conducted over the period 1993 to 1998. This household survey provides
an extensive set of individual, job and firm characteristics and its panel aspect constitutes
a unique source of information for an analysis of the dynamic interactions of workers, firm
size, and wages. Previous studies analyzing the size-wage gap in Canada and the U.S. have
used cross-sectional data or only 2-year panels. 7 More recently, Troske (1999) analyzes the6Lemieux (1998) applies the method to analyze the effects of union sector choice on wages. Gibbons, Katz,
Lemieux and Parent (2002) use this method to analyze inter-occupation and inter-industry wage differentials.
Lluis (2002) uses the method to analyze the wage dynamics associated with worker choices of job ranks within
a company.7See Oi and Idson (1999) for a review of the U.S. studies and Morissette (1993) for a study of the Canadian
5
question using U.S. matched employer-employee data but reaches the same conclusions as the
preceding literature, finding a significant size-wage premium after ruling out the usual suspects
and concluding on the possible importance of unmeasured workforce quality. Abowd, Finer
and Kramarz (1999) and Abowd, Kramarz and Margolis (1999) estimate a wage equation that
includes person-specific and firm-specific unobserved components using longitudinal data on
workers and firms in the state of Washington and France respectively. In the latter study,
they decompose the firm-size effect into a size effect due to an unobserved person effect and an
unobserved firm effect. Their estimation results show that the firm-size-average person effect
explains better the size-wage gap than does the firm-size-average firm effect.
The paper is organized as follows. Section two describes the framework of analysis. In the
first part of this section, a statistical model of wage determination with non random assignment
of workers into firms of different sizes is presented and the different interpretations of the size-
wage structure arising from ability sorting and job screening are discussed. The second part
of section two presents the estimation method used to estimate the statistical model. Section
three describes the data providing information on the sample selection rules, worker mobility
across firm size and an analysis of the size-wage gap in the same spirit as the empirical literature
on firm size and wage outcomes. Section four presents the results emphasizing the estimated
returns to measured skills and unmeasured ability and section five concludes.
2 Analytical Framework
In its attempt to explain the size-wage gap, the empirical literature on the effect of firm size
on wages has not considered the possibility that large and small firms may have different wage
policies in terms of rewarding workers skills. On the other hand, two main theories of wage
determination can justify differences in wage policies by firm size and in particular, differences
case.
6
in the returns to measured and unmeasured skills based on the following assumptions. On the
one hand, ability sorting assumes that skills (measured and unmeasured) are not identically
productive across firms of different sizes and in particular, high ability workers have a com-
parative advantage in large firms. On the other hand, job screening assumes that monitoring
costs increase with the size of the firm so that large firms put less weight on unmeasured
ability relative to small firms as it is harder to identify. This section summarizes these two
approaches in a statistical model of wage determination and present the econometric method
used to estimate the returns to ability and evaluate the importance of the ability sorting versus
job screening hypothesis in explaining the relationship between firm size and wages.
2.1 Implications of Ability Sorting and Screening in Wage Policy by Firm
Size
This section presents a statistical model of wage determination which integrates the notions
of ability sorting and job screening. The ability sorting argument follows the literature on
job assignment and workers comparative advantage first proposed by Roy (1951) and later
formalized by Sattinger (1995). 8 The main assumption in this framework is that different
skills (measured and unmeasured) are not equally productive across sectors and in the present
context, across firms of different sizes. Utility maximizing workers, in this framework, choose
the size of employer for which their abilities are best suited. In particular, high ability workers
are better suited in large firms. As a result, the returns to ability are greater in large firms
compared to small firms. Job screening and its implications for the analysis of the size-wage
relationship was theoretically developed by Garen (1985). The model relies on the assumption
that monitoring/evaluation costs increase with firm size. As a result, large firms acquire less8See also Neal and Rosen (1998) for more details on selection models and their implications for the earnings
distribution.

7
accurate information about the abilities of their workers, and thus will rely less heavily on their
own evaluation of workers than do small firms and more on other indicators of ability such as
schooling or experience.
The assumptions common to the two types of approaches are the following: There are
two types of firms which differ by size. Firms are indexed by j = S(small), L(large). The
only input is labor, given in efficiency units per worker. Workers, indexed by i = 1, ..., N , are
characterized by a vector of productive skills, (SKi, θi), where SKi denotes the observed skills
of worker i and θi represents traits that are unmeasured by the econometrician (these could
include innate ability, initiative, ambition, loyalty).
It is assumed that the production technology of firm j exhibits constant returns to scale
with respect to labor: 9
Qj =Nj∑i=1
nji (SKi)βj (θi)λj , j = S, L (1)
where N j is the total number of employees in firm j and nji is the number of employees in firm
j endowed with (SKi, θi). There is one type of output, the price of which is normalized to
one. The profit maximizing condition for both types of firms implies the following conditions
on the marginal product of workers with skills (SKi, θi):
wij =∂Qj
∂nji
= (SKi)βj (θi)λj (2)
In the ability sorting model, it is assumed that ability is perfectly observed by firms. 10
9It is assumed that firms of different size have different production technologies in terms of the sensitivity to
the skills required. The fact that both have constant returns to scale simplifies the analysis. Other assumptions
on returns to scale would involve finding the optimal size for both firms which is beyond the scope of this paper.10The model could be generalized to include imperfect information about ability and learning effects in
the same spirit as the analysis in Gibbons, Katz, Lemieux and Parent (2001) for the effect of industry and
occupational choice on wage outcomes.
8
Moreover, worker skills, (SKi, θi), are exogenously given so that investment in human capital
is ignored. Workers then choose to work in a large (small) firm because they have a comparative
advantage in that type of firm.
In the job screening model, Garen (1985) proposes a model explaining the size-wage re-
lationship based on the same idea that firms of different sizes have different wage policies.
The assumption used for justifying these differences in compensation policy is not based on
differences in skill sensitivity to technology (as it is in the ability model above) but on dif-
ferences in monitoring costs. It is assumed that large firms rely less heavily on their own
evaluation of workers ability than do small firms but instead rely more on more easily observed
other indicators of ability such as schooling or experience when making pay decisions. In this
approach, the effect of measured and unmeasured skills on wage outcomes will vary by firm
size depending upon the degree of accuracy with which workers skills can be evaluated. More
precisely, firms face a cost to evaluating workers ability which increases with the size of the
firm. This assumption implies that large firms will reward schooling more and ability less
and their wage schedule will have a larger intercept. Note that Garen’s model goes beyond
the simple characterization of the compensation policies of firms of different sizes in that it
endogenizes schooling decisions. This part of the model is not detailed in the present paper
as it is not directly relevant to the empirical question of the returns to ability in the size-wage
relationship.
The idea of different wage policies by firm size can be summarized in the following wage
equation:
wijt = αj + βjSKit + λjθi, j = S, L (3)
where (αj , βj , λj) is the vector of rewards to unmeasured and measured skills. The different
restrictions on the coefficients resulting from the two types of models can be described in terms
of the size-wage premium. The size-wage premium or equivalently, the gain from joining a large
9
firm is characterized by:
Pit = (αL − αS) + (βL − βS)SKit + (λL − λS)θi (4)
According to the ability sorting model, the size-wage premium previously captured in the
empirical literature by the differential in the intercepts αj is in fact the result of the differential
returns to ability or the difference λL − λS . In a one-factor hierarchical ability model with
comparative advantage, it is assumed that λL > λS and αL < αS . Intuitively, small firms
have jobs for which the productivity required and therefore wage paid relies less on individual
ability than large firms. Note that in this model, there is no a-priori restrictions on the returns
to measured skills and both may be equal unless one assumes a particular correlation between
unmeasured and measured skills. One may expect ability to be positively correlated with
schooling and experience but other dimensions of ability like ambition or initiatives may not
be.
The size-wage structure implied by the job screening hypothesis results in the following
restrictions in the parameters: βL > βS , λL > λS and αL < αS . 11 A test of the job screening
versus ability sorting hypothesis in this context is therefore a test based on the comparison of
the α coefficients or the returns to unmeasured skills by firm size. 12
2.2 Estimation Method
This section describes the estimation method used to estimate wage equation (3) described in
the previous section. Defining Dijt as a dummy variable indicating whether individual i is in
11Note that the job screening model can be viewed as a version of a non hierarchical ability or multi-factor
ability sorting.12Interpretation of the estimated constant and returns to measured skills are difficult to make since each one
depends on the level of ability at which they are estimated which is unknown.

10
firm of size J at time t, the empirical version of (3) can be written as follows:
wijt =J∑
j=1
Dijtαj +J∑
j=1
DijtSKitβj +J∑
j=1
Dijtλjθi + µit (5)
where J is a discrete variable describing different categories of firm size and µit is a measurement
error independent of a worker’s choice of firm size. 13
Estimating equation (5) with OLS would give inconsistent estimates. Indeed, the compar-
ative advantage hypothesis implies that firm size assignment is endogenous, so θi is correlated
with the firm size dummies. In addition, this term cannot be eliminated by first-differencing
(5) because it is interacted with the Dijt terms.
Holtz-Eakin, Newey and Rosen (1988) analyze models in which a fixed effect is interacted
with year dummies and show that consistent estimates can be obtained by quasi-differencing
the equation of interest and using appropriate instrumental-variable techniques. This technique
has been used previously by Lemieux (1998) in the case where the return to a time-invariant
unobserved characteristic is different in the union and non-union sector. We also apply this
technique to estimate the returns to ability by firm size.
The quasi-differencing method consists of isolating the unmeasured ability term θi as fol-
lows:
θi =wijt −
∑Jj Dijtαj −
∑Jj DijtSKitβj − µit∑J
j Dijtλj
(6)
Innate ability is time-invariant so its period t version is also equal to its lag version. To
obtain the quasi-difference, the first lag version of (6) is substituted into equation (5) as follows:13In the empirical analysis, we will consider three types of size categories: small, medium and large. The
categorization of the firm size variable will be explained in more details in the data section.

11
wijt =J∑
j=1
Dijtαj +J∑
j=1
DijtSKitβj +
∑Jj Dijtλj∑J
j Dijt−1λj
∗ [ wijt−1 −J∑
j=1
Dijt−1αj +J∑
j=1
Dijt−1SKit−1βj ] + eit (7)
where eit = µit +∑J
j Dijtλj∑Jj Dijt−1λj
µit−1 (8)
This equation cannot be estimated using non-linear least squares because wijt−1 is correlated
with µit−1. This problem can be solved by choosing appropriate instruments for wijt−1 in
which case consistent estimates will be obtained. The set of instruments, Zi, has to satisfy the
following condition:
E(eitZi) = 0 (9)
The objective is then to minimize the following quadratic form:
minγ
e(γ)′Z(Z ′ΩZ)−1Z ′e(γ) (10)
where Z ′ΩZ is the covariance matrix of the vector of moments Z ′e(γ), Ω is the covariance
matrix of the error term eit and γ is the vector of parameters. An efficient estimator can be
obtained by estimating equation (5) in a first step with Ω = I.
Finally, the unmeasured ability term θeit in the error term of equation (5) is normalized to
zero for the parameters to be identified. 14 This is done by adding the following equation as a
constraint on the optimization of (10):
(1/TN)∑
i
∑t
θit = 0 (11)
where N is the number of individuals, T is the number of periods for each individual and θit
satisfies equation (6).14A proof of the necessity of this constraint is given in Lemieux (1998).
12
Instruments are chosen using the identification assumption for estimation of panel data
equations that imposes strict exogeneity of right-hand side variables. More formally:
E(µit/SKi1...SKiT , Dij1...DijT , θi) = 0 (12)
The elimination of θi resulting from the quasi-differencing corrects the problem of endo-
geneity in the assignment of workers to firms of different sizes. The equation still needs to be
instrumented due to the presence of the lagged wage on the right-hand side which is corre-
lated with µit−1. Equation (12) states that conditional on observed innate ability, individual
characteristics and firm size assignments each period are uncorrelated with the error term in
the wage equation (5). Therefore, this condition provides a set of potentially valid instruments
with the property that they are not correlated with the µ terms in the e term from equation
(8). In particular, the history of previous period firm size assignments (interaction terms be-
tween Dijt−1 and Dijt) as well as previous period firm size assignment interacted with skills
should help predict wages.
3 Data and Preliminary Analysis
In this section we describe the data focusing, in particular, on worker mobility across firms
of different sizes. We also present an analysis of the size-wage gap in the same spirit as the
empirical literature on firm size and wage outcomes. We use data from the Survey of Labour
and Income Dynamics (SLID). The SLID data is collected by Statistics Canada in the form
of a 6 year panel containing information about individuals. In particular, an extensive set of
individual and job characteristics are available for each of the six years of each panel, which
runs from 1993 to 1998. We select individuals between 20 and 64 years of age, working for
positive wages in sectors other than construction, and for whom we have observations on
at least three consecutive years. We limit the sample to those who answered questions about
13
wages, education and firm size. These restrictions leave us with a sample of 17,766 observations
(worker-year) of which around 24% are associated with a change in firm size.
Following other work in the area, we categorize firm size as large (more than 1000 employ-
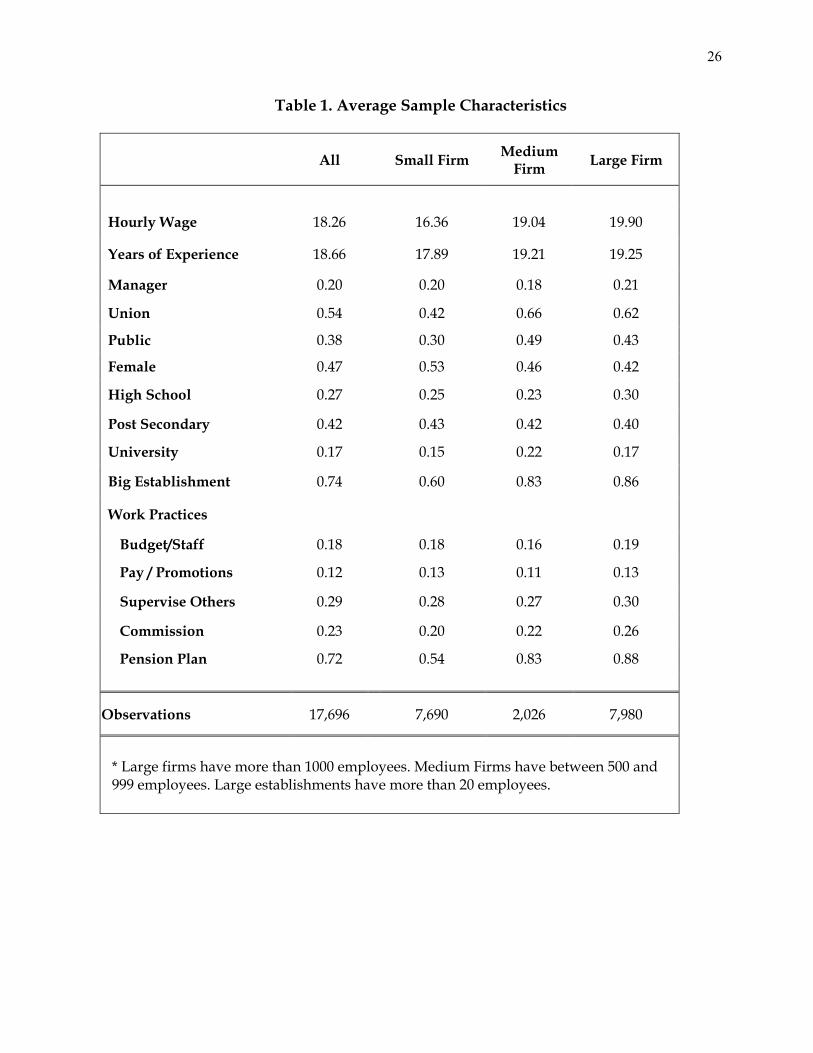
ees) medium (between 500 and 999 employees) and small (less than 500 employees). Table
1 shows different firm and worker characteristics by firm size. In general, wages in large and
medium firms are about 21% higher than in small firms. However, workers in large and medium
firms have higher levels of education and more experience as well. Additionally, there is evi-
dence in the literature that union coverage may be a factor affecting the size wage gap. Indeed,
unionization increases by half in large firms, where it covers 62% of the workers, relative to
small firms, where unionization rate is 42%.
In the analysis hereafter, we consider the distribution of other job characteristics that could
be related to wage dispersion across firm size. In particular, we contemplate the possibility that
large and small firms make different use of complementary forms of compensation, like receiving
a pension plan or commissions and tips. This is in fact the case looking at the descriptive
statistics in table 1, since large (and medium) firms are more likely to offer a pension plan.
Workers in large firms are also more likely to obtain commissions. We also consider other work
practices, not related to compensation, that may make a job more (less) attractive. These
are mainly related to job responsibilities, like whether the worker has the ability to influence
budget or staff decisions, if he/she is involved in pay and promotion decisions, or whether
he/she supervise others. These, however, do not show a distinct pattern by firm size.
3.1 Analysis of Firm Size Changes
To explore whether individuals perceive firm size to be a relevant variable in their choice of
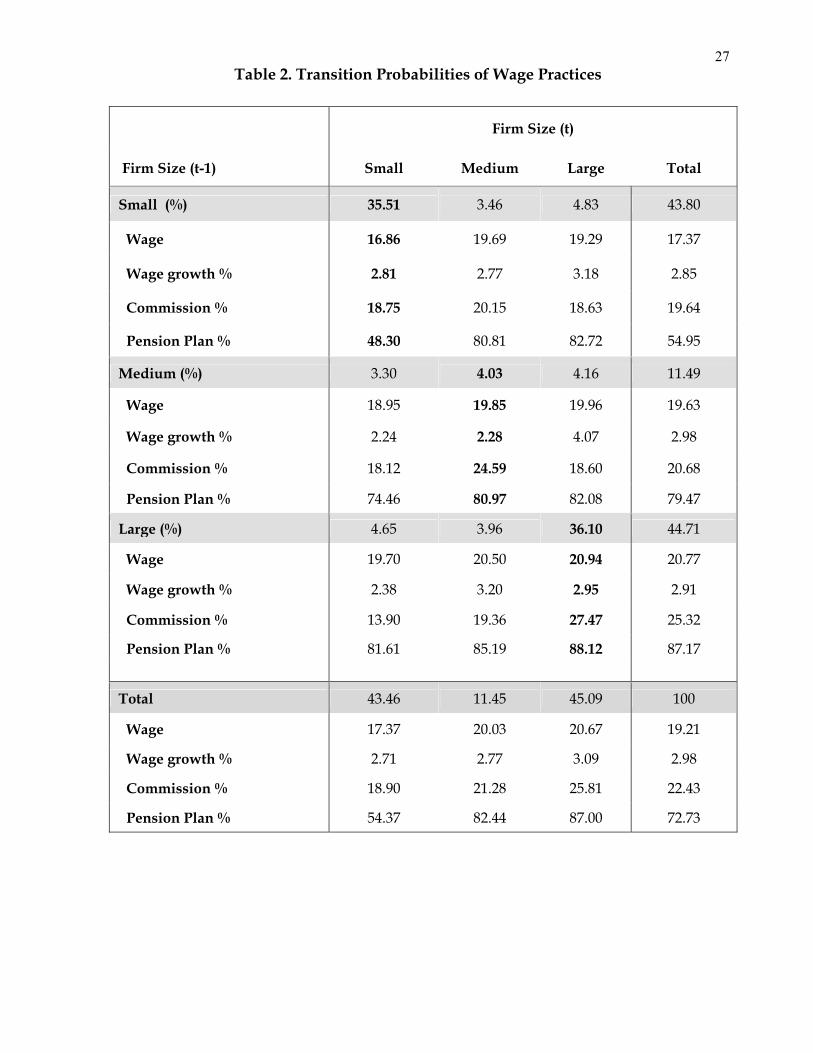
job, we take a further look at workers that report a change in firm size. Table 2 presents the
transition probabilities of firm size change, together with the average wage levels and rate of

14
growth. Overall, 43.5% of the observations are in small firms, 11.4% in medium firms and
45.1% in large firms in period t. Interestingly, the percentages of moves out of any categories
(small, large or medium) is very similar varying between 3.3% and 4.6%. In other words, the
24% of observations reporting changes are evenly distributed across firm size.
In terms of average gains associated with moving, one can see that moves to large firms
(either out of medium or small firms) are associated with greater average wages and greater
wage growth. Interestingly, moving out of large firms does not necessarily imply a cut in wage
growth. This observation is in line with a selection model in which workers move out of “bad”
matches and into better matches. Note also that there does not seem to be a monotonic pattern
of increase in average wages or wage growth when comparing moves to a larger firm (small to
medium, medium to large) in that although moves from medium to large firms are associated
with greater gains (in level and growth), moves from small to medium are not. This suggests
the presence of asymmetry in the characteristics influencing firm size changers.
Because some of the moves may not reflect a worker move but either misclassification in
firm size between two years or the fact that the same firm is expanding or shrinking over time
(due to substantial hiring or layoffs), we are interested in analyzing further the relevance of
the reported moves. We therefore looked into the factors that may influence the probability of
moving to a firm of a different size. To this effect we run a probit estimation on firm size change
that includes education, experience, union status, and different forms of past compensation
among the main explanatory variables to be used as possible factors correlated with moves.
We consider the possibility that moving to a larger firm represents a different type of choice
for the workers than moving to a smaller firm and the dependent variable is an indicator for
whether the worker moved to a larger firm. 15
15Moving to a smaller firm shows similar returns, except that the coefficient for the commission variable is
not significant. These results are available from the authors upon request.
15
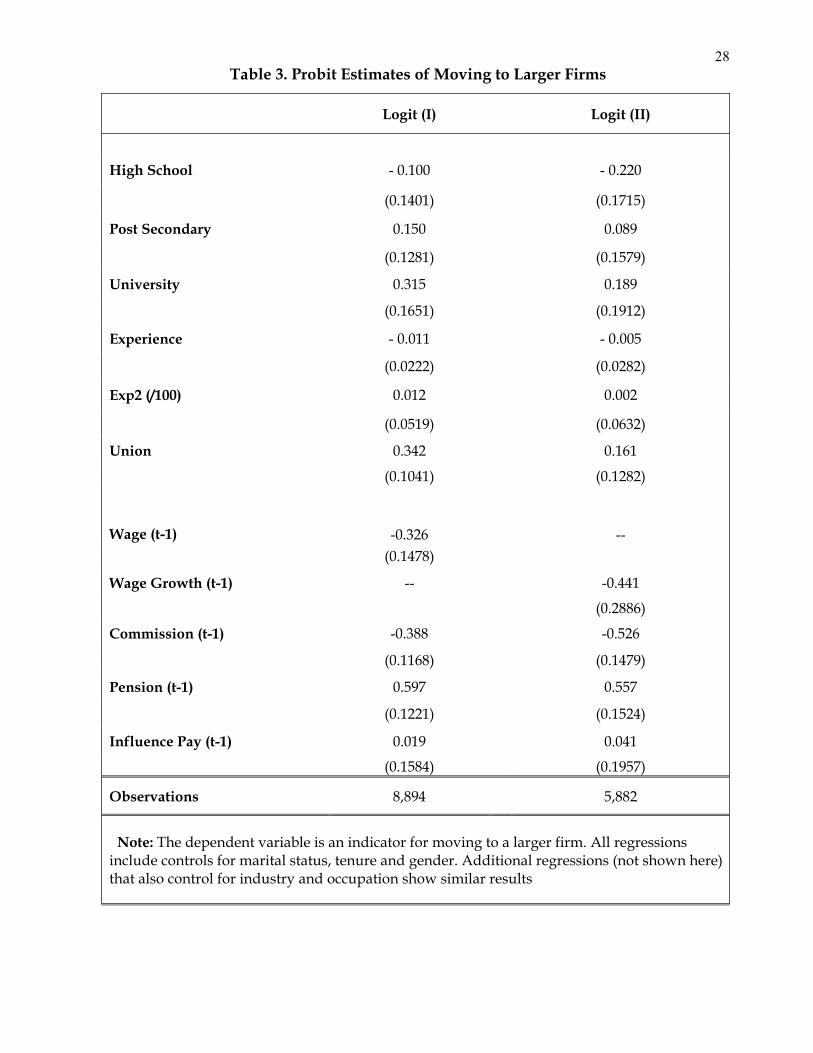
The results of the probit analysis are presented in table 3. In general, low levels of education
and experience are negatively correlated with the probability of moving to larger firms, whereas
unionization is positively correlated. These effects were also apparent in the raw data. The
most interesting results come from the variables related to work compensation. In the first
column we use past wages (in levels) to measure the main form of compensation, and in the
second column we use past wage growth for this purpose. In both columns, the main form
of compensation (either past wage or past wage growth) have a (strong) negative influence in
the probability of moving to larger firms, suggesting that most moves are related to improved
pay opportunities. Other forms of compensation also appear to significantly influence the
probability of moving to larger firms. Those that received tips or commissions in the past are
less likely to move. This is likely to happen because these forms of compensation are usually
linked to the development of a clientele or other firm-specific investments. It is worth noting
that these variables are not significant when we analyze the probability of moving to small
firms, 16 which again points to asymmetries in the type of firm size changers.
Overall, the above examination of the data seems to support the idea that observable skills
are rewarded differently among large and small firms. There also seems to exist an asymmetry
in the moves to large and small firms, in terms of wage compensation. Finally, the results from
the probit analysis are intuitive in that movers to larger firms are on average more educated,
less experienced and that moves follow from poor pay outcomes at the current firm.
3.2 The Size-Wage Gap
In this section we replicate the analysis performed in previous empirical studies analyzing
the links between firm size and wages. Empirical studies on the determinants of wage and
wage growth have analyzed possible departures from the basic Mincer-type wage equation16Results available upon request.

16
that explains wages as a function of education and a quadratic in experience. Since the wage
equation is originally derived from a model of optimal investment in human capital, it does not
offer a complete representation of the labor market as it only describes the supply side of the
market. Most studies add variables to the wage equation that describe and capture variations
in wages related to the demand side of the labor market. In particular, industry, occupation,
unionization, establishment and firm size dummies are the main variables employed. This type
of analysis allows one to obtain an estimate of the average size-wage gap.
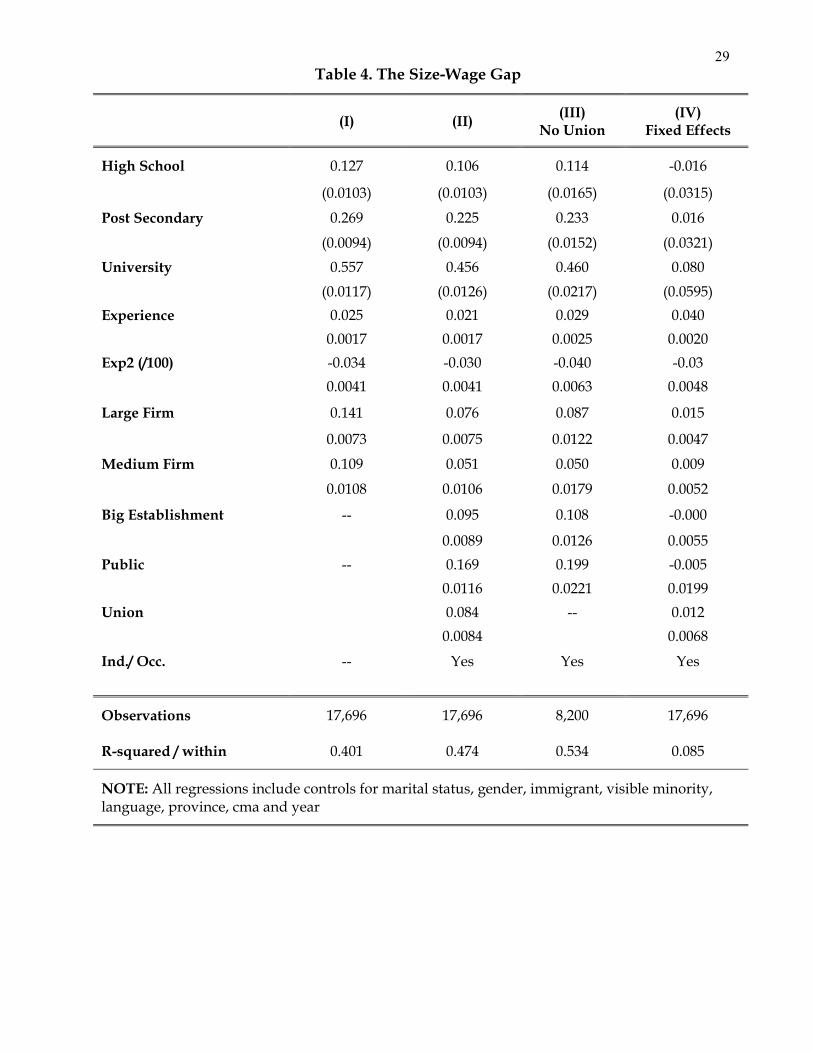
Table 4 presents the results of a cross-sectional OLS estimation of employer-size wage
differentials in the spirit of the empirical literature on firm size and wage outcomes. Overall, the
results are similar to those reported elsewhere in the literature. Column (I) shows the average
size-wage gap in the absence of other firm controls. The coefficient associated with the dummy
for a large and a medium firm gives a wage differential of 15% and 12% respectively. This is
similar to those estimated in Morissette (1993) using the Canadian Labour Market Activity
Survey (LMAS) for 1986, which suggests that the magnitude of the gaps has not changed over
time. Column (II) shows the results when controls for big establishment, unionized worker,
industry, occupation, and public sector workers are added to the wage equation. The size of the
coefficients associated with firm size drops substantially to 8 % and 5% for large and medium
firms respectively. Overall, and similarly to others in the literature, we find that employment
characteristics, such as a public sector, unionization or big establishment explain a sizeable
portion (around 50%) of the size wage gap. Industry and occupation variables have additional
though limited effects.
The literature on firm size suggests that unionization has an important effect in reducing
wage dispersion and that pay practices or other firm policies will differ among unionized and
non unionized firms. Therefore, this is a factor that should be considered in our analysis.
Table A1 in the appendix compares the average wage by education level and firm size between

17
unionized and non unionized firms. Note that the average union wage gap is much greater
among small firms than among large firms implying different size effects on wages for unionized
and non unionized workers. 17 Given these findings, we perform the same type of OLS analysis
concentrating only on the sub-sample of non union firms. The size-wage gap is indeed greater,
but only slightly, among large non unionized firms (9%).
Finally and most importantly, we exploit the temporal dimension of our data set to in-
vestigate the potential importance of unmeasured ability by comparing the OLS results with
the results of fixed-effect estimations. Column (IV) presents the estimates of the fixed effect
regression. Note how the coefficient associated with the large firm dummy variable drops sub-
stantially, although remains statistically significant. This indicates that the estimates of the
previous regressions (including our estimates on firm size) are very likely to suffer from ability
bias. This result is also consistent with the literature. In the next section, the role of ability
in the relationship between firm size and wages is investigated in greater detail following the
statistical model presented in section 2.
4 Results
In this section we present the results of estimations of wage equation (5) in which firm size
is interacted with measured skills and unmeasured ability implying different wage policies for
firms of different sizes and workers sorting based on comparative advantage and firms screening.
Table 5 summarizes the results. We also assess the robustness of the method by performing
tests of the validity and predictive power of the instruments.17See Lluis (2002) and Pearce (1990) for more details on this particular point for the Canadian case and
American case respectively.
18
4.1 Returns to Unmeasured Ability by Firm Size
In the first column of table 5, simple OLS are applied to estimate the wage equation assuming
unmeasured ability is equally rewarded in all firms. This first empirical model serves as a
basis for comparison with the case where both measured and unmeasured skills are differently
rewarded across firms of different sizes. Note that we summarized workers characteristics into
a skill index to obtain a global measure of skills. 18 To do so, we estimated a regression of
the log wage on education, marital status, sex, nationality, experience and squared experience,
industry and occupation type for the entire original sample of workers. We then use the
estimated coefficients related to education, marital status, gender, nationality and experience to
compute the estimated or predicted log wage based on these characteristics. The resulting skill
variable has been normalized to 0. Columns II to VI present the results of GMM estimations
of equation (7) based on the quasi-differencing method described in section 2.2. Column II
uses the full sample while column III considers younger workers, column IV and V use the
samples of non unionized workers in managerial and non managerial positions respectively.
The last column corresponds to an analysis check of the identification test we will describe in
more details at the end of this section.
The results of the OLS estimation in column I show that the large firm dummy variable
or intercept is still significant and that the returns to measured skills by firm size are also
significant. On the other hand, a test of equality of these returns to measured skills cannot
reject the hypothesis that they are all equal. When unmeasured ability is considered (column
II-V), the returns to measured skills as well as the large firm effect are substantially reduced,
as was the case in table 4 when comparing the OLS and fixed-effect estimations. This result
confirms the importance of unmeasured ability in the relationship between firm size and wages.18Given the focus on comparative advantage, this technique provides a way to minimize the number of
parameters to be estimated. It is similarly used in Gibbons, Katz, Lemieux, Parent (2002) and Lluis (2002),
19
It is worth noticing the effect of other wage policy characteristics, such as pension plan
availability and commission, whose effects are both substantial and significant in the OLS
estimation in column I but drop in magnitude once ability is controlled for (column II-V).
Note, however, the significant but small effect of having a pension plan for non unionized
workers in columns IV and V, which suggests that pension plan holders are high-wage workers
even after controlling for ability. Also interestingly, after controlling for ability, the effect of
commissions reduces base pay for younger workers (column III).
The most interesting results of table 5 relates to the returns to unmeasured skills. These
returns are significant and more importantly, significantly different from one another according
to the tests of equality of the coefficients. They are also consistent across the different sub-
samples studied (columns II-V) suggesting that the effect is robust to different sub-sample
related to workers’ age, union status or occupation.
In terms of the differential in returns, it is interesting to note the non monotonic relationship
between firm size and the level of the returns previously conjectured in the raw data. The
returns to unmeasured ability are the highest in medium size firms (above 500 and below 1000
workers). In other words, unmeasured ability is significantly more rewarded in medium size
firms relative to small firms. On the other hand, unmeasured ability is not significantly more
rewarded in large firms relative to medium or small firms. The first result is in accordance
with an explanation based on ability sorting while the second piece is more consistent with
an explanation based on monitoring costs. Overall, it seems that ability sorting dominates for
moves from small to medium size firms in that ability is more productive and therefore more
rewarded in the latter than the former. On the other hand, when firms become“too large”,
the monitoring costs hypothesis seems to dominate in that ability is not more rewarded than
in small firms. 19
19The same analysis has been performed for different categorizations of small, medium and large sizes and the
20
4.2 Analysis of Instruments
To assess the robustness of the preceding results, we analyzed the predictive power of the
instruments used. To do so, we performed a F-test for the joint significance of the instruments
when the instrumented variable (previous wages) is regressed on the instruments, including all
the exogenous variables in the right-hand side of the wage equation. The value of the F-test
statistic is 3.96 which is above the critical value at the 95% confidence level. One can therefore
conclude that firm size affiliation between t− 1 and t as well as interactions between firm size
affiliation and skills are good instruments for workers’ previous period wage.
In terms of the validity of the instruments used to perform the estimation, the test is
rejected for the models represented in columns II to IV and not rejected only in the case
of non unionized non managerial workers (column V). Note that as explained in details in
Gibbons, Katz, Lemieux and Parent (2002), the non-linearity in the model estimated can
make the overidentification test fail either because the instruments are invalid or because the
instruments are valid but the model is misspecified. One possible reason for misspecification
is the restriction we have imposed that the wage model is a single-index model in that both
measured and unmeasured skills are uni-dimensional. Our model, like the one in Gibbons,
Katz, Lemieux and Parent (2002), is a multiple sector model for which a single measured
skills and ability index may be too restrictive. In addition, in this type of model, there are
different identification strategies for estimating the slope and intercept associated with each
firm size variables. For example, moves to large firms can be identified both through moves
out of medium firms as well as moves out of small firms. Table 2 shows that about 5% of
the observations corresponds to these types of moves in each case which is substantial. We
follow Gibbons, Katz, Lemieux and Parent (2002) strategy to estimate the model with only
observations on adjacent moves. We perform the analysis on the sample of non unionized
results are similar with only weaker significance levels. These results are not shown but available upon request.
21
managerial workers (whose results are shown in column IV) to which we drop observations on
non-adjacent moves (small to large firms and vice-versa). One can see that the value of the
statistic of the overidentification test decreases by half with a p-value such that the assumption
of valid instruments now cannot be rejected.
5 Conclusion
In this paper we have re-examined the relationship between firm-size and wages by analyzing
differences in the way firms of different sizes evaluate workers’ skills and in particular unmea-
sured ability. Using a non linear instrumental variable estimator, we are able to estimate the
differential wage impact of unmeasured ability across firms of different sizes. Our data come
from the Survey of Labour and Income Dynamics (SLID) over the years 1996 to 2001. The
results can be summarized into three following main points:
A preliminary analysis of the data illustrated some differences in the compensation policies
of small, medium and large firms. In particular, large and medium firms are more likely to
offer a pension plan and workers in large firms are also more likely to obtain commissions.
Also an analysis of the extent of firm size changes shows that 24% of observations report a
move to a firm of a different size. These moves are evenly distributed across firm size in that
a similar proportion of moves are reported out of small, medium and large firms. In terms
of average gains associated with moving, moves to large firms (either out of medium or small
firms) is associated with greater average wage and wage growth. Interestingly, moving out of
large firms does not necessarily imply a cut in wage growth. Moreover, there does not seem to
be a monotonic pattern of increase in average wages or wage growth when comparing moves
to a larger firm (small to medium, medium to large) in that although moves from medium
to large firms are associated with greater gains (in level and growth), moves from small to
22
medium are not. This suggests the presence of asymmetry in the characteristics influencing
firm size changers. Finally, a probit analysis for the determinants of firm size changes shows
intuitive correlations between workers and compensation characteristics and moves to larger
firms. Indeed, movers to larger firms are on average more educated, less experienced and we
also find that moves follow from poor pay outcomes at the current firm.
From the GMM estimation of the statistical wage model, we find significant differences in
the returns to unmeasured ability across firm size. In particular, we find that the returns to
unmeasured ability are the highest in medium size firms (above 500 but below 1000 workers).
In other words, the returns to unmeasured ability are significantly greater in medium size firms
relative to small firms but are not significantly greater in large firms relative to medium or
small firms. Overall, it seems that ability sorting dominates for moves from small to medium
size firms in that ability is more productive and therefore more rewarded in the latter than
the former. When firms become “too large”, however, the monitoring costs hypothesis seems
to dominate in that ability is not more rewarded than in small firms.
23
References
Abowd J. M., Finer H. and Kramarz F. (1999) “Individual and Firm Heterogeneity in
Compensation: An Analysis of Matched Longitudinal Employer Employee Data for the State
of Washington”, in “The Creation and Analysis of Employer-Employee Matched Data” (J.
Haltiwanger, J. Lane, J. Spletzer, and K. Troske, Eds), 3-24, North-Holland, Amsterdam.
Abowd J. M., Kramarz F. and Margolis D. (1999) “High Wage Workers and High Wage
Firms”, Econometrica vol. 67, 251-333.
Agell J. (2003) “Why Are Small Firms Different? Managers’ Views”, Working paper, Stock-
holm University.
Brown C. and Medoff J. (1989) “The Employer Size-Wage Effect”, Journal of Political
Economy vol. 97, 1027-1059.
Garen J. (1985) “Worker heterogeneity, Job Screening, and Firm Size”, Journal of Political
Economy vol. 93, 715-739.
Gibbons, R., Katz, L.F., Lemieux, T. and Parent, D. (2002) “Comparative Advantage,
Learning, and Sectoral Wage Determination”. NBER Working Paper n.8889.
Idson, T.L. and Feaster, D.J. (1990) “A Selectivity Model of Employer Size-Wage Differ-
entials”. Journal of Labor Economics, vol. 8 (1) Part 1. pp.99-122.
Lemieux, T. (1998) “Estimating the Effects of Unions on Wage Inequality in a Panel Data
Model with Comparative Advantage and Nonrandom Selection”. Journal of Labor Economics,
vol 16 (2). pp.261-91.
Lluis, S. (2003) “Wage Structure by Firm Size: Evidence from Canada and the United States”,
Human Resource Research Institute Working Paper #02-03, University of Minnesota.
Lluis, S. (2002) “The Role of Comparative Advantage and Learning in Wage Dynamics and

24
Intra-firm Mobility: Evidence from Germany, Human Resource Research Institute Working
Paper #01-03, University of Minnesota.
Hu, L. (2003) “The Hiring Decisions and Compensation Structures of Large Firms”, Industrial
and Labor Relations Review, vol 56 (4). pp.663-81.
Morissette, R., (1993) “Canadian Jobs and Firm Size: Do Smaller Firms Pay Less?”, The
Canadian Journal of Economics, vol.26 (1) pp.159-74.
Neal, D. and Rosen, S. (2000) “Theories of the Distribution of Labor Earnings” in Handbook
of Income Distribution vol. 1 Ed. Elsevier
Oi, W. (1983) “Heterogenous Firms and the Organization of Production”, Economic Inquiry,
vol 21, pp. 147-69.
Oi, W. and Idson, T (1999) “Firm Size and Wages” in Handbook of Labor Economics,
vol.3B. Ed. Elsevier
Pearce, J. E. (1990) “Tenure, Unions, and the Relationship between Size and Wages”, Journal
of Labor Economics, vol 8, pp. 251-69.
Roy, A.D (1951) “Some Thoughts on the Distribution of Earnings”. Oxford Economic Papers
(New SEries) vol. 3, pp.135-46.
Sattinger, M. (1993) “Assignment Models of the Distribution of Earnings”, Journal of Eco-
nomic Literature vol.31 (2). pp.830-880.
Shouyong Shi (2003) “Product Market Differentiation and the Size-Wage Differential”. Forth-
coming International Economic Review.
Troske, K. (1999) “Evidence on the Employer Size-Wage Premium from Worker-Establishment
Matched Data”, The Review of Economics and Statistics, vol 81, pp. 15-26.
Winter-Ebmer, R. and Zweimuller, J. (1999) “Firm Size and Wages”, The American

25
Economic Review, vol 89, pp. 90-93.
26
Table 1. Average Sample Characteristics
All Small Firm Medium
Firm Large Firm
Hourly Wage 18.26 16.36 19.04 19.90
Years of Experience 18.66 17.89 19.21 19.25
Manager 0.20 0.20 0.18 0.21
Union 0.54 0.42 0.66 0.62
Public 0.38 0.30 0.49 0.43
Female 0.47 0.53 0.46 0.42
High School 0.27 0.25 0.23 0.30
Post Secondary 0.42 0.43 0.42 0.40
University 0.17 0.15 0.22 0.17
Big Establishment 0.74 0.60 0.83 0.86
Work Practices
Budget/Staff 0.18 0.18 0.16 0.19
Pay / Promotions 0.12 0.13 0.11 0.13
Supervise Others 0.29 0.28 0.27 0.30
Commission 0.23 0.20 0.22 0.26
Pension Plan 0.72 0.54 0.83 0.88
Observations 17,696 7,690 2,026 7,980
* Large firms have more than 1000 employees. Medium Firms have between 500 and 999 employees. Large establishments have more than 20 employees.
27Table 2. Transition Probabilities of Wage Practices
Firm Size (t)
Firm Size (t-1) Small Medium Large Total
Small (%) 35.51 3.46 4.83 43.80
Wage 16.86 19.69 19.29 17.37
Wage growth % 2.81 2.77 3.18 2.85
Commission % 18.75 20.15 18.63 19.64
Pension Plan % 48.30 80.81 82.72 54.95
Medium (%) 3.30 4.03 4.16 11.49
Wage 18.95 19.85 19.96 19.63
Wage growth % 2.24 2.28 4.07 2.98
Commission % 18.12 24.59 18.60 20.68
Pension Plan % 74.46 80.97 82.08 79.47
Large (%) 4.65 3.96 36.10 44.71
Wage 19.70 20.50 20.94 20.77
Wage growth % 2.38 3.20 2.95 2.91
Commission % 13.90 19.36 27.47 25.32
Pension Plan % 81.61 85.19 88.12 87.17
Total 43.46 11.45 45.09 100
Wage 17.37 20.03 20.67 19.21
Wage growth % 2.71 2.77 3.09 2.98
Commission % 18.90 21.28 25.81 22.43
Pension Plan % 54.37 82.44 87.00 72.73
28Table 3. Probit Estimates of Moving to Larger Firms
Logit (I) Logit (II)
High School - 0.100 - 0.220
(0.1401) (0.1715)
Post Secondary 0.150 0.089
(0.1281) (0.1579)
University 0.315 0.189
(0.1651) (0.1912)
Experience - 0.011 - 0.005
(0.0222) (0.0282)
Exp2 (/100) 0.012 0.002
(0.0519) (0.0632)
Union 0.342 0.161
(0.1041) (0.1282) Wage (t-1)
-0.326
-- (0.1478)
Wage Growth (t-1) -- -0.441
(0.2886)
Commission (t-1) -0.388 -0.526
(0.1168) (0.1479)
Pension (t-1) 0.597 0.557
(0.1221) (0.1524)
Influence Pay (t-1) 0.019 0.041
(0.1584) (0.1957)
Observations 8,894 5,882
Note: The dependent variable is an indicator for moving to a larger firm. All regressions include controls for marital status, tenure and gender. Additional regressions (not shown here) that also control for industry and occupation show similar results
29Table 4. The Size-Wage Gap
(I) (II) (III) No Union (IV)
Fixed Effects
High School 0.127 0.106 0.114 -0.016
(0.0103) (0.0103) (0.0165) (0.0315)
Post Secondary 0.269 0.225 0.233 0.016
(0.0094) (0.0094) (0.0152) (0.0321) University 0.557 0.456 0.460 0.080 (0.0117) (0.0126) (0.0217) (0.0595) Experience 0.025 0.021 0.029 0.040 0.0017 0.0017 0.0025 0.0020 Exp2 (/100) -0.034 -0.030 -0.040 -0.03 0.0041 0.0041 0.0063 0.0048
Large Firm 0.141 0.076 0.087 0.015
0.0073 0.0075 0.0122 0.0047
Medium Firm 0.109 0.051 0.050 0.009
0.0108 0.0106 0.0179 0.0052
Big Establishment -- 0.095 0.108 -0.000
0.0089 0.0126 0.0055 Public -- 0.169 0.199 -0.005 0.0116 0.0221 0.0199 Union 0.084 -- 0.012 0.0084 0.0068
Ind./ Occ. -- Yes Yes Yes
Observations 17,696 17,696 8,200 17,696
R-squared / within 0.401 0.474 0.534 0.085
NOTE: All regressions include controls for marital status, gender, immigrant, visible minority, language, province, cma and year

30Table 5. Returns to Unmeasured Skills by Firm Size
I OLS
All Wkrs II GMM All Wkrs
III GMM Age <=45
IV GMM Managerial Wkrs Non unionized
V GMM Non Managerial Wkrs Non unionized
VI GMM Sample IV but Adjacent Moves only
Medium Firm
0.000
0.003
-0.003
0.045
-0.023
0.074
(0.008) (0.017) (0.023) (0.045) (0.025) (0.052 Large Firm 0.041*** 0.014* 0.012 -0.000 0.029** 0.054 (0.005) (0.008) (0.013) (0.021) (0.014) (0.050) Commission 0.023*** -0.009 -0.015*** -0.003 -0.007 -0.005 (0.005) (0.004) (0.005) (0.009) (0.007) (0.009) Pension Plan 0.157*** 0.004 0.001 0.022* 0.021*** 0.018 (0.157) (0.006) (0.007) (0.013) (0.008) (0.013) Returns to Measured Skills
Small Firm 0.359*** 0.161*** 0.166*** 0.153*** 0.181*** 0.189*** (0.008) (0.048) (0.043) (0.061) (0.073) (0.064) Medium Firm 0.335*** 0.002 0.097 0.014 0.119 0.049 (0.016) (0.067) (0.079) (0.109) (0.138) (0.114) Large Firm 0.363*** 0.092* 0.093* 0.210*** 0.186*** 0.137*** (0.007) (0.051) (0.058) (0.069) (0.071) (0.110) Test for Equality of Returns
S=M 1.73 3.46 0.46 1.18 0.10 1.09 (p-value) (0.18) (0.06) (0.49) (0.28) (0.75) (0.29) M=L 2.29 0.90 0.00 1.92 0.12 0.26 (p-value) (0.13) (0.34) (0.97) (0.17) (0.72) (0.60) Returns to Unmeasured Skills
Small Firm 1 1 1 1 1 Medium Firm 1.473*** 1.585*** 1.533*** 1.329*** 1.523*** (0.218) (0.228) (0.264) (0.255) (0.303) Large Firm 1.164*** 1.263*** 0.922*** 0.915*** 0.966*** (0.205) (0.220) (0.204) (0.161) (0.373) Tests for Equality of Returns
S=M 4.68 6.58 4.07 1.66 2.98 (p-value) (0.03) (0.01) (0.00) (0.19) (0.08) M=L 3.61 2.71 8.65 4.39 5.20 (p-value) (0.05) (0.09) (0.00) (0.03) (0.02) Overidentification Test
66.00 56.71 62.10 30.76 30.10
(p-value) (0.00) (0.00) (0.00) (0.50) (0.50) N 17696 17696 12030 3288 4912 3016 NOTE: All regressions include controls for marital status, gender, immigrant, visible minority, language, province, cma and year. The tests for equality of returns are c2 tests.

31
Table A1. Average Wage by Education, Firm Size and Union Status
Non Union Union TOTAL
Small Medium Large Total Small Medium Large Total Small Medium Large
Less than HS 11.75 13.01 13.65 12.26 14.37 15.15 17.91 16.31 12.73 14.4 16.79
High School 13.47 16.54 17.05 15.16 16.25 16.70 19.11 18.04 14.38 16.63 18.24
Post Secondary 15.28 17.43 18.94 16.75 18.26 19.17 20.05 19.30 16.53 18.59 19.64
University 22.31 27.63 27.26 25.27 24.07 24.37 24.62 24.37 23.36 25.32 25.67
Average 14.83 18.45 19.36 16.80 18.50 19.35 20.23 19.53 16.36 19.04 19.90
Observations 4,494 698 3,008 8,200 3,196 1,328 4,972 9,496 7,690 2,026 7,980

32