
Large hail is not a killer, but does considerable damage Hail.
Paper to be presented at
DRUID15, Rome, June 15-17, 2015
(Coorganized with LUISS)
All Hail Large Firm Innovation: Reconciling the Firm Size and Innovation
DebateAnne Marie Knott
Washington UniversityOlin Business School
Carl ViereggerUniversity of Illinois
AbstractSince Schumpeter, there has been a long-standing debate regarding the optimal firm size for innovation. Empiricalresults have settled into a puzzle: studies consistently find that R&D spending increases with scale, however studies ofR&D productivity indicate product and patent counts decrease with scale. Thus firms appear irrational: spending isdecreasing in productivity. We propose the puzzle stems from measurement problems. Drawing on recent theorysuggesting that size affects the type of R&D that firms conduct, we propose that product and patent counts undercountlarge firm innovation (incremental and process). To date we have had limited ability to test these more nuanced viewsbecause we lacked firm-level data on the type of R&D firms conduct. Additionally we lacked a universal measure of R&Dproductivity that could accommodate all types of R&D. Using recently available NSF BRDIS survey data tosolve the former problem and a recent measure of R&D productivity (RQ) to solve that latter problem, we find that bothR&D spending and R&D productivity increase with scale. We further find that while large firms and small firms differ inthe types of R&D they conduct, there is no type whose returns decrease in scale?there are merely types for which thesmall firm penalty isless severe. This raises a new question: why do small firms conduct R&D? The answer appears to be they rely onspillovers. Thus not only do large firms provide the bulk of innovation in the economy, their spillovers subsidize smallfirms? innovation.
Jelcodes:A10,-

Page 1 !
!!!
All Hail Large Firm Innovation:
Reconciling the Firm Size and Innovation Debate
By ANNE MARIE KNOTT AND CARL VIEREGGER*
"#$%&!'()!(*'+!
!
Since Schumpeter, there has been a long-standing debate regarding the optimal firm size for
innovation. Empirical results have settled into a puzzle: studies consistently find that R&D
spending increases with scale, however studies of R&D productivity indicate product and patent
counts decrease with scale. Thus firms appear irrational: spending is decreasing in
productivity. We propose the puzzle stems from measurement problems. Drawing on recent
theory suggesting that size affects the type of R&D that firms conduct, we propose that product
and patent counts undercount large firm innovation (incremental and process). To date we have
had limited ability to test these more nuanced views because we lacked firm-level data on the
type of R&D firms conduct. Additionally we lacked a universal measure of R&D productivity
that could accommodate all types of R&D. Using recently available NSF BRDIS survey data to
solve the former problem and a recent measure of R&D productivity (RQ) to solve that latter
problem, we find that both R&D spending and R&D productivity increase with scale. We further
find that while large firms and small firms differ in the types of R&D they conduct, there is no
type whose returns decrease in scale—there are merely types for which the small firm penalty is
less severe. This raises a new question: why do small firms conduct R&D? The answer appears
to be they rely on spillovers. Thus not only do large firms provide the bulk of innovation in the
economy, their spillovers subsidize small firms’ innovation.
!
!
!
Knott: Washington University, One Brookings Drive, Campus Box 1133, St Louis, MO 63130 (email:[email protected]), Vieregger: University of
Illinois 350 Wohlers Hall,1206 South Sixth Street, Champaign, IL 61820 (email: [email protected]). We gratefully acknowledge support under
NSF Award 1246893: The Impact of R&D Practices on R&D Effectiveness.
DISCLAIMERS: Any opinions and conclusions expressed herein are those of the author(s) and do not necessarily represent the views of the
U.S. Census Bureau. All results have been reviewed to ensure that no confidential information is disclosed. I have a financial interest in
amkANALYTICS, a subscription database of firm RQs.

Page 2 !
I. Introduction
The firm size and R&D hypothesis is one of the two main hypotheses in innovation
economics, the other being market structure. Both hypotheses are attributed to Schumpeter
(1942) who asserted that large firms are the major engine of economic growth. The most
important advantage of size is scale economies--at a minimum, larger scale amortizes the fixed
cost per innovation over a larger number of units. Accordingly, the returns to innovation should
be greater for large firms. This then is an argument about ability to exploit innovation.
A companion argument considers the impact of firm size on ability to conduct R&D. On
one side of the argument, large firms are viewed to be more effective with their R&D. This
could occur for a number of reasons. First, there may be minimum efficient scales for some
R&D projects, e.g., there is only one super-collider. Second, R&D projects are known to be
stochastic, Stevens and Burley (1997) report that on average for Industrial Research Institute
member firms, it takes 125 funded projects to achieve one commercial success. Large firms are
better able to pool risk because they can carry a broader portfolio of projects. Having a broad
portfolio confers another advantage: technical diversity—typically more projects implies a
broader set of problems and associated expertise (Nelson 1959). This increases the likelihood of
having any required expertise in-house. Finally, large scale implies a broader set of product
markets. Drawing again upon the stochastic nature of R&D, this increases the likelihood that
projects that fail for a given application, might have other applications elsewhere in the firm.
On the flip side of the size debate are arguments suggesting small firms are more
productive with their R&D. Indeed colloquially, people use the term “entrepreneurial”
(conveying small start-up firms) to connote innovativeness. The small firm arguments typically
rely on governance advantages. Fewer employees implies decision makers are closer both to the
technology as well as the customer, thus they can better link technological possibilities to market
needs. Relatedly, fewer employees also implies closer proximity between technical workers,
which facilitates problem solving (Allen 1977). Finally, small firms have fewer levels of
hierarchy, so decision-making can be more rapid.
Thus there appear to be compelling arguments for either size to be more effective in
conducting R&D. This likely explains why both large and small firms conduct R&D. If either
size had a substantial advantage, the other size would be unlikely to conduct R&D. Accordingly,
more recent theories attempt to reconcile the co-existence of large firm and small firm R&D.
Page 3 !
These theories suggest the two sizes differ in the type of R&D they conduct, and that the returns
to type vary with firm size. In essence they argue that choice of R&D strategy is endogenous--
firms choose the strategy most likely to be effective given their size. Rosen (1991) for example
suggests that large firms do incremental innovation, while small firms do radical innovation.
Cohen and Klepper (1996) suggest large firms do process innovation, while small firms do
product innovation. Finally, Knott (2003) suggests that large firm innovation relies more heavily
on firms’ own R&D, while small firm innovation relies more heavily on spillovers.
There is a substantial empirical literature testing the size hypothesis (see Cohen 2010 for
a summary). Tests of innovative behavior indicate that R&D investment increases with scale,
e.g., Baldwin and Scott 1987, Scherer and Ross 1990. Assuming firm rationality, these results
imply large firm R&D is more productive than small firm R&D. However, most studies of
innovative outcomes find small firms are more productive, e.g., Scherer 1965, Pavitt et al 1987,
Acs and Audretsch 1988, 1990. One limitation of these outcome studies is they rely on product
counts or patent counts as the measure of R&D performance. However, if choice of R&D
strategy is endogenously determined by firm size (as the more recent theories suggest), these
tests will undercount large firm innovation, since theory expects it to be incremental and process.
Moreover, these studies ignore the contributions of spillovers or rival R&D—thus overstate the
contributions of own R&D.
Accordingly important questions in the firm size and innovation debate remain
unresolved: 1) Why is investment behavior inconsistent with returns? 2) why if one size has
higher returns, do we see both large firms and small firms conduct R&D? What’s required to
resolve these questions and the firm size debate, are empirical models that explicitly consider the
endogenous choice of R&D strategy. This in turn requires data on R&D practices as well as a
more comprehensive measure of productivity that captures all forms of R&D.
We exploit recently available NSF BRDIS survey data and a recent measure of R&D
productivity (RQ) in an effort to resolve the firm size debate. We find that both R&D spending
and R&D productivity increase with scale (thus resolving the first question of seemingly
irrational behavior). We further find that while large firms and small firms differ in the types of
R&D they conduct, there is no type whose returns decrease in scale—there are merely types for
which the small firm penalty is less severe. This leads to the second question: why then do small
firms conduct R&D? The answer appears to be they rely more heavily on spillovers. Thus not

Page 4 !
only do large firms provide the bulk of innovation in the economy, they provide the spillovers on
which small firm innovation free-rides.
!
II. Empirical Approach
This study is an effort to resolve the firm size debate by testing the more nuanced
theories of firm size and R&D. To do so we exploit recently collected data on firms’ R&D
practices from the National Science Foundation (NSF) Business R&D and Innovation Survey
(BRDIS) as well as a recent measure of R&D effectiveness, RQ (short for research quotient)
that captures all forms of R&D.
BRDIS Data
BRDIS is an annual survey of firms’ R&D behavior conducted by the National Science
Foundation (NSF) in conjunction with the U.S Census Bureau. BRDIS is a more expansive
successor to the Survey of Industrial Research and Development (SIRD), which was conducted
from fiscal years 1953 to 2007. Both surveys address the industry component of the NSF
mandate "...to provide a central clearinghouse for the collection, interpretation, and analysis of
data on scientific and engineering resources and to provide a source of information for policy
formulation by other agencies of the Federal government."
The more expansive survey was deemed necessary because the bulk of R&D is now
funded by industry, whereas in the 1950s, when the SIRD was created, the majority of R&D
was funded by the US government. Thus greater insight into firm R&D behavior was
warranted. In addition the new survey better matches the Community Innovation Survey (CIS)
conducted by the EU countries. Accordingly, BRDIS data supports comparisons of innovative
behavior between the US and other countries.
BRDIS is mailed annually to approximately 40,000 companies. The BRDIS sample is
intended to represent the approximately 1.5 million for-profit companies in the United States
with five or more domestic employees, both publicly or privately held. The overall response
rate in the 2008 survey was 77.4%, and the response rate for the top 500 domestic R&D-
performing companies was 92.6%. Of these responding firms, approximately 3% reported
performing and/or funding R&D.
Page 5 !
BRDIS gathers data on a number of R&D variables (see the full survey for 2010).
However we focus attention on the variables related to firm size, firm R&D strategy, as well as
financials required to derive firm RQ. With regard to the strategy variables, we examine the
three R&D strategies hypothesized to affect or be affected by scale:
1) Portfolio horizon: “What percentage of R&D paid for and performed by your company
was for:
a. Basic research: planned, systematic pursuit of new knowledge without
specific immediate commercial application
b. Applied research: planned, systematic pursuit of new knowledge aimed at
solving a specific problem or meeting a specific commercial objective
c. Development: the systematic use of research and practical experience to
produce new or significantly improved goods, services or processes”.
2) Riskiness: “What percentage of this year’s sales were from goods/services introduced in
the past three years that were:
a. New (or significantly improved) to your market
b. New (or significantly improved) only to your company
c. Unchanged or only marginally modified”
3) Form: “Did your company introduce any of the following in the prior three years:
a. New (or significantly improved) goods
b. New (or significantly improved) services
c. New (or significantly improved) processes (methods of producing goods
or services, distributions systems for inputs or outputs of your goods or services,
support activities)”
RQ estimation
RQ is the firm-specific output elasticity of R&D in the firm’s production function
(Knott 2008). Thus it represents the percentage increase in revenues from a 1% increase in
R&D, holding constant other inputs and their elasticities. Accordingly, RQ conforms with the

Page 6 !
most common means to measure returns to R&D (Hall, Mairesse and Mohnen 2010). Where
RQ departs from prior measures of returns to R&D is that it captures them at the firm-level
rather than at the industry or economy level. This departure stems from both the realization
that there is substantial firm heterogeneity even within an industry (see Syverson 2011 for a
review), and the availability of data and methods to estimate firm-level parameters.
The advantages of RQ over prior firm-based measures of R&D performance stem from
universality, uniformity and reliability. Universality refers to the fact that RQ can be
constructed for any firm conducting R&D. This stands in contrast to patent measures which
can only be constructed for the 50% of firms who patent their R&D. Uniformity stems from
the fact that RQ is unitless—it is essentially a nuanced ratio of revenues over R&D. This
allows direct comparison of all forms of innovation. In contrast, patents have highly variable
value—10% of patents account for 85% of the economic value of all patents (Scherer and
Harhoff 2000). Finally reliability refers to the fact that RQ is empirically consistent with
expectations from endogenous growth theory (Romer 1990, Thompson 1996, Lentz and
Mortensen 2011). R&D investment, growth and market value all increase in RQ, while all
three measures decrease in patent intensity (Knott and Vieregger 2014).
We derive RQ using random coefficients estimation of the firm’s production function
(Equation 1) in accordance with the general methodology described in Knott (2008) for
Compustat data.1 A random coefficients model (Longford 1993) represents a general functional
form model which treats coefficients as being non-fixed (across members of a cross-section or
over time) and potentially correlated with the error term. Random coefficient models are those
in which each coefficient has two components: 1) the direct effect of the explanatory variable,
!! and 2) the random component that proxies for the effects of omitted variables, !!!.
Accordingly, each firm’s RQ is the sum !3 + !3i in Equation 1.
Note that RC is a general functional form of which fixed effects is a restricted form
where only the intercept is treated as a random coefficient. One complication with estimation
using the BRDIS data is its input variables differ from those collected from firms’10-K filings
(the source for Compustat data). While revenues and R&D expenditures are the same in both
datasets, BRDIS collects capital expenditures rather than property, plant and equipment, and
does not collect advertising. Accordingly we employ a model of the following form:
!!!!!!!!!!!!!!!!!!!!!!!!!!!!!!!!!!!!!!!!!!!!!!!!!!!!!!!!!!!!!'!,-./!.&01!201%3110-4!5-66-71!%6-1/68!70.&!.&#.!04!94-..!(**:;!

Page 7 !
(1)! ! ln Yit = (!0 + !0i ) + (!1 + !1i ) ln Kit + (!2 + !2i ) ln Lit + (!3 + !3i ) ln Rit-1
+(!4 + !4i ) ln Sit-1 + " it
Firm level data items include (in $MM unless otherwise stated): revenues (Yit), capital
expenditures (Kit), labor as full-time equivalent employees (1000)(Lit), and R&D (Rit). From
these primary data, we derive a secondary measure: firm-specific spillovers (Sit) which is
computed as the sum of the differences in knowledge between focal firm i and rival firm j for all
firms in the four digit SIC industry with more knowledge (R&D) than the focal firm:
(7) !!!" ! !!"!!! ! !!"!!!!!" ! !!" !
This construction mimics the spillover construct in endogenous growth models with
heterogeneous firms, e.g., Jovanovic and MacDonald 1994. It is a density measure that takes into
account the number of firms with superior knowledge as well as the amount of each firm’s
surfeit of knowledge relative to the focal firm. In essence it represents the likelihood and extent
of discovering superior knowledge in a random encounter with a rival firm. Both R&D and
spillovers are lagged one year. 2
We validated the abbreviated RQ estimation with Compustat data using the full set of
Compustat inputs as well as the restricted set of BRDIS inputs. That comparison indicates that
RQs are 91.7% correlated across the two equations.
A second restriction of the BRDIS data is that is has only been released for years 2008-
2011. Accordingly the maximum window size per RQ estimate is four-years, whereas prior
estimates of RQ (Knott 2008, Knott and Vieregger 2014) used seven and ten-year windows.
Accordingly, we tested the impact of window size using Compustat data, just as we tested the
impact from a restricted set of inputs. Comparisons of RQs generated with Compustat data in a
window surrounding the year 2000 indicate RQ estimates with a four-year window are 75.8%
correlated with those estimated with seven-year window. Of these, 6.2% of RQs from the four-
year window are significant, versus 17.7% for the seven-year window. Thus the shorter window
will make it more difficult for us to obtain significant results. However if we do obtain significant
results, the high correlation makes it likely results will hold and be more significant with the
!!!!!!!!!!!!!!!!!!!!!!!!!!!!!!!!!!!!!!!!!!!!!!!!!!!!!!!!!!!!!(!<&/$/!01!4-!10=4050%#4.!2055/$/4%/!>/.7//4!-4/!#42!.7-!8/#$!6#=1;!!<&01!504204=!?#.%&/1!.7-!/?@0$0%#6!$/=36#$0.0/1A!
/%-4-?/.$0%!/B30C#6/4%/!>/.7//4!1.-%D!#42!56-7!?-2/61!#42!/%-4-?/.$0%!/B30C#6/4%/!-5!?-2/61!70.&!2055/$/4.!
6#=1!EF$060%&/1!#42!"#0$/11/!'G:H)!I2#?1!#42!J#55/!'GGKL;!!!
Page 8 !
longer window.
Firm Size Tests
Our firm size tests have three components: The main effects of scale, the choice and
impact of R&D strategy, and treatment effects of strategy on outcomes.
Main Effects of scale. We begin firm size testing by examining the main effects of firm
size on behavior (R&D spending) and performance (RQ). If as we expect, firm size drives R&D
strategy, the coefficients on size will be biased in these estimations. Thus the main role of these
tests is to generate results that can be compared to prior studies. Because we only have one
observation for RQ (the 4 year mean), we form four-year averages of our scale variables, R&D as
well as the practice variables. Because this leaves one observation per firm, we conduct cross-
sectional tests using OLS.
Choice and Impact of R&D Strategy. To begin teasing apart how scale drives behavior
and performance, we next examine R&D strategy. As mentioned previously, firm R&D strategy,
as captured in the BRDIS data, has three components: portfolio horizon (basic, applied,
development), riskiness (new to market, new to firm, incremental), and type (product, service,
process). For each of the nine uni-dimensional strategies, we first test the impact of scale on
choice of strategy. We then test the effect of the strategy on behavior (R&D spending) and
performance (RQ), while controlling for scale. We allow strategy to have both a direct effect and
an effect that varies with scale. The interaction allows us to examine whether certain strategies
favor certain sizes, as both Rosen (1991) and Cohen and Klepper (1996) suggest. Again, if firm
size affects choice of strategy, these estimates will be biased.
Treatment Effects. Given the bias concerns, our primary tests attempt to control for the
endogenous impact of size on firm R&D strategy through two-stage selection models. Before
conducting these tests however, we first examine whether firms’ R&D strategies are better
characterized as bundles rather than uni-dimensional decisions. We use cluster analysis to
construct strategy “archetypes” for portfolio horizon, riskiness, and form.
Once we define the archetypes, we first replicate the tests of uni-dimensional strategies--
examining the impact of firm size on choice of strategy Because we expect these analyses to
indicate size drives choice of archetype, we then employ a two-stage treatment model, using Stata
command, treatreg to determine if there are treatment effects from the strategy after controlling

Page 9 !
for the selection effects of size on archetype.
The treatment model comprises two stages: a first stage model of strategy choice, and a
second stage model of outcomes. It is essentially a switching regression model that explicitly
states there are two regimes: treatment and non-treatment. Accordingly, there are separate
models for the outcome under each regime, both of which are estimated using maximum
likelihood.
III. Results
Main Effects of Scale. Table 1 presents results for the impact of size on behavior (R&D
spending) (Models 1-4) as well as performance (RQ) (models 5-6). For each test, we examine two
alternative measures of firm scale (revenues and employees).
------------------------------------
Insert Table 1 about here
------------------------------------
Regarding the impact of scale on R&D investment, results indicate that scale is positive and
highly significant. Indeed scale explains approximately 48% of intra-firm variance in R&D. The
best fitting model is one using ln(employees) (Model 2). The coefficient estimate of 0.717 implies
that a 10% increase in the number of employees increases R&D 7.2%. These results match stylized
facts (Cohen 2010).
Because prior tests have examined R&D intensity (R&D/Sales) rather than R&D levels,
we examine that as well (Models 3 and 4). Those tests indicate R&D intensity decreases with
scale, also matching prior results.
Regarding the impact of scale on performance (RQ), we also find scale is positive and
significant. Here however the best fitting model uses ln(revenues) rather than ln(employees). The
coefficient estimate of 0.014 implies that a 10% increase in firm revenues increases R&D
productivity (RQ) 0.14%. As with R&D investment, scale explains 41% of the variance in RQ.
These results conflict with prior tests using patents (Bound et al 1984) and product counts (Acs
and Audretsch 1988, 1990) as the measures of performance.
Thus our results using BRDIS data and the RQ measure yield firm behavior and
performance that are consistent with one another: large firms have higher returns to R&D, and also

Page 10 !
invest more. While these results resolve our first question of prior inconsistency between behavior
and returns, they leave open the second question of coexistence of large and small firm R&D.
Accordingly we now examine the more nuanced theories regarding differential R&D strategies
across firm size.
Impact of Scale on Uni-dimensional R&D Strategy. As noted previously, we would like to
formally account for the impact of scale on choice of firm strategy via treatment models. However
prior to estimating those models, we first conduct separate tests of the impact of scale on choice of
uni-dimensional strategy and the impact of strategy on behavior and performance. Table 2 presents
results for simple tests of size on R&D strategy; Table 3 presents results for simple tests of R&D
strategy on R&D spending; and Table 4 presents results for simple tests of R&D strategy on RQ.
Table 2 reveals there are a number of strategies that appear to be correlated with scale. In
particular, scale increases the extent of basic research, the likelihood of product, service and
process innovation and the extent of sales from incremental innovation. In contrast, scale decreases
the extent of sales from new to market innovation.
The basic research result is consistent with expectations from Nelson (1959), the process
innovation result is consistent with expectations and Cohen and Klepper (1996) and the incremental
innovation result is consistent with Rosen (1991). Thus scale does indeed affect choice of R&D
strategy in the manner suggested by theory.
------------------------------------
Insert Tables 2-4 about here
------------------------------------
Looking next at the impact of strategy on behavior (R&D investment), Table 3 reveals that
R&D investment increases with scale for all strategies at about the same rate (combined coefficient
for scale and scale*strategy are roughly 0.6 to 0.7 for all strategies.
Looking next at performance, Table 4 reveals that all R&D strategies have comparable
returns to scale within class, e.g., for type, the coefficient is about 0.02, and for riskiness it’s about
0.015. The exception is horizon: development (0.022) has about twice the returns of basic (0.014)
and applied research (0.013). Most importantly, there is no strategy whose returns decrease in scale
(the coefficient on scale is always positive). In other words, there is no strategy that favors small
firms. There are merely strategies that penalize small firms less.
It is evident from Table 2 that firm strategy is substantially driven by firm size—thus the

Page 11 !
results in Tables 3 and 4 are likely biased. To account for that, we perform two stage selection
tests. However before doing so, we rethink the strategy variables. Results in tables 2 through 4
implicitly assume that firms treat each uni-dimensional strategy as independent. It seems more
likely strategies are complementary such that firms choose strategy bundles. We examine that
possibility before proceeding.
R&D Strategy archetypes. We conduct cluster analysis of the three uni-dimensional
strategies within each main strategy category (horizon, riskiness and form) to create strategy
“archetypes”. To generate the archetypes, we follow a two-step process. In the first step, we create
nine separate groupings, ranging from a minimum of two clusters to a maximum of ten, and
compare the Cali!sky and Harabasz pseudo-F index across each grouping. Because the F-scores are
similar across several groupings, in the second step we examine the content of each grouping in
selecting our final cluster sizes. The objective of this second step is to ensure that the automatically-
generated clusters also conform to observed strategic groupings in management practice. While
our reported clusters are based on kmeans partition cluster analysis, we also test groupings based on
kmedians, agglomerative hierarchical clustering methods, and the examination of dendograms,
which produce qualitatively similar results. The analysis yields five archetypes for horizon, six for
riskiness and seven for form. These archetypes are characterized in Table 5.
------------------------------------
Insert Table 5 about here
------------------------------------
Table 5a reveals that horizon clustered into five archetypes: BAD1 through BAD5. Each
archetype has a fairly intuitive interpretation. BAD1: principally development, with some applied
research; BAD2: applied/development balance; BAD3: exclusively development; BAD4:
principally basic research; and BAD5: principally applied research. Note that BAD4 and BAD5
are rare, comprising 30 and 60 firms, respectively, while BAD3 is most prevalent (50% of firms).
Table 5b reveals that riskiness clustered into six archetypes: OWN1 through OWN6. As
with horizon, each archetype has a fairly intuitive interpretation. OWN1: principally new to
market; OWN2: principally new to firm; OWN3: new to market/incremental balance; OWN4: New
to firm/incremental balance; OWN5: exclusively incremental; OWN6: principally incremental.
OWN1 and OWN2 are relatively rare, comprising 90 and 70 firms, respectively, while OWN5 is
most prevalent with 47% of firms.

Page 12 !
Finally, Table 5c reveals that type clustered into seven archetypes: PSP1 through PSP6. As
with horizon, each archetype has a fairly intuitive interpretation. PSP1: balance across all types;
PSP2: exclusively product; PSP3: exclusively process; PSP4: exclusively service; PSP5:
product/service balance; PSP6: product/process balance; PSP7: service/process balance. PSP3, 4, 6
and 7 are relatively rare, comprising 10, 20, 80 and 60 firms, respectively, while PSP1 is most
prevalent with 52% of firms.
Having defined the strategy archetypes, we now estimate the two-stage treatment models to
understand the extent to which strategy (rather than scale) is driving behavior and performance.
We construct separate models for each of the eighteen archetypes. In each model, stage 1 captures
the selection effects of scale (Sales) on choice of strategy archetype, and stage 2 captures the
treatment effect of the strategy archetype on behavior and performance. We estimate each model
using Stata command, treatreg. Results for the two-stage treatment tests are captured in Tables 6-8.
------------------------------------
Insert Tables 6-8 about here
------------------------------------
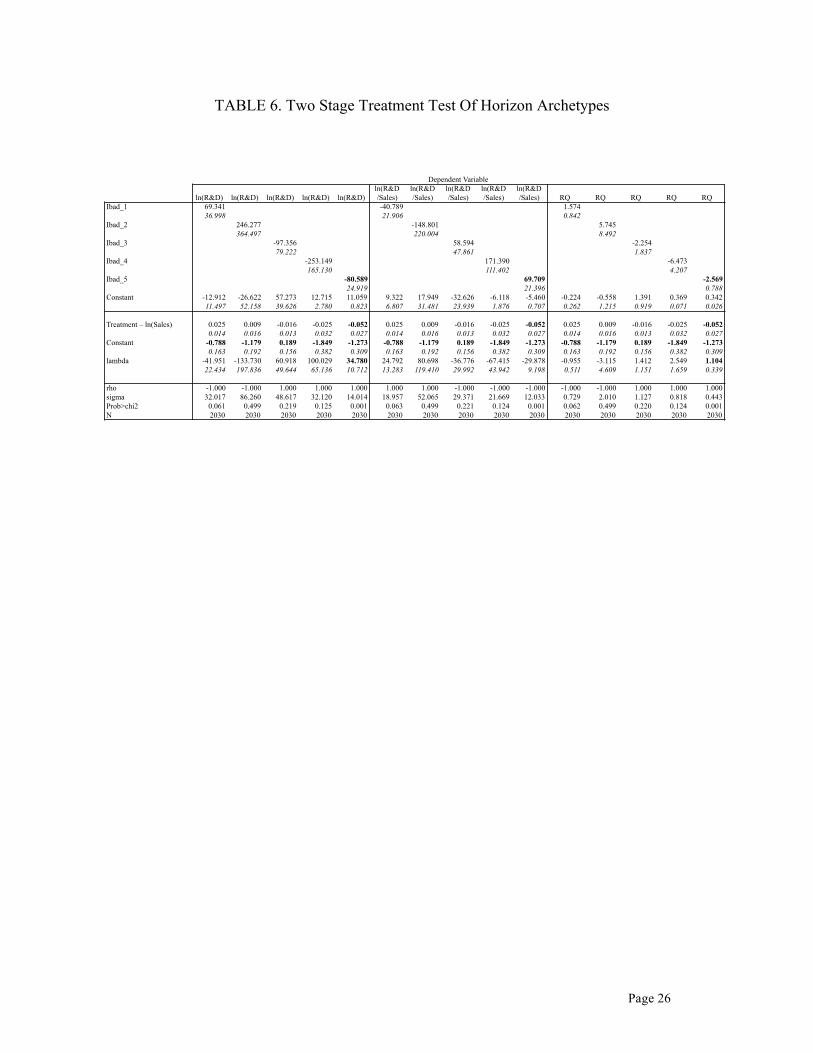
Table 6 presents the treatment model for the horizon archetypes. The results indicate that
the only significant treatment effects are for BAD5 (principally applied). The stage 1 models
indicate that likelihood of choosing BAD5 decreases with scale, and that it leads to lower R&D and
lower RQ after taking into account the impact of firm size on choice of strategy. Moreover, BAD5
generates lower returns per dollar of R&D. Thus BAD5 appears to be a preferred strategy for small
firms, and while it is associated with lower R&D investment (Model 5), it has lower returns per
dollar of R&D (Model 15). While the results are not significant, the strategy with the highest RQ
appears to be BAD2 (balance). Moreover, its likelihood increases with scale.
Table 7 presents the treatment model for the riskiness archetypes. The Stage 1 models
indicate that scale increases the likelihood of choosing OWN5 (exclusively incremental). The
stage 2 models indicate that OWN 5 has significantly higher returns even after controlling for the
selection by larger firms. The stage 1 models also indicate small firms are more likely to follow
new product archetypes (OWN1-3). The stage 2 models indicate these strategies have lower
returns after controlling for selection by smaller firm size.
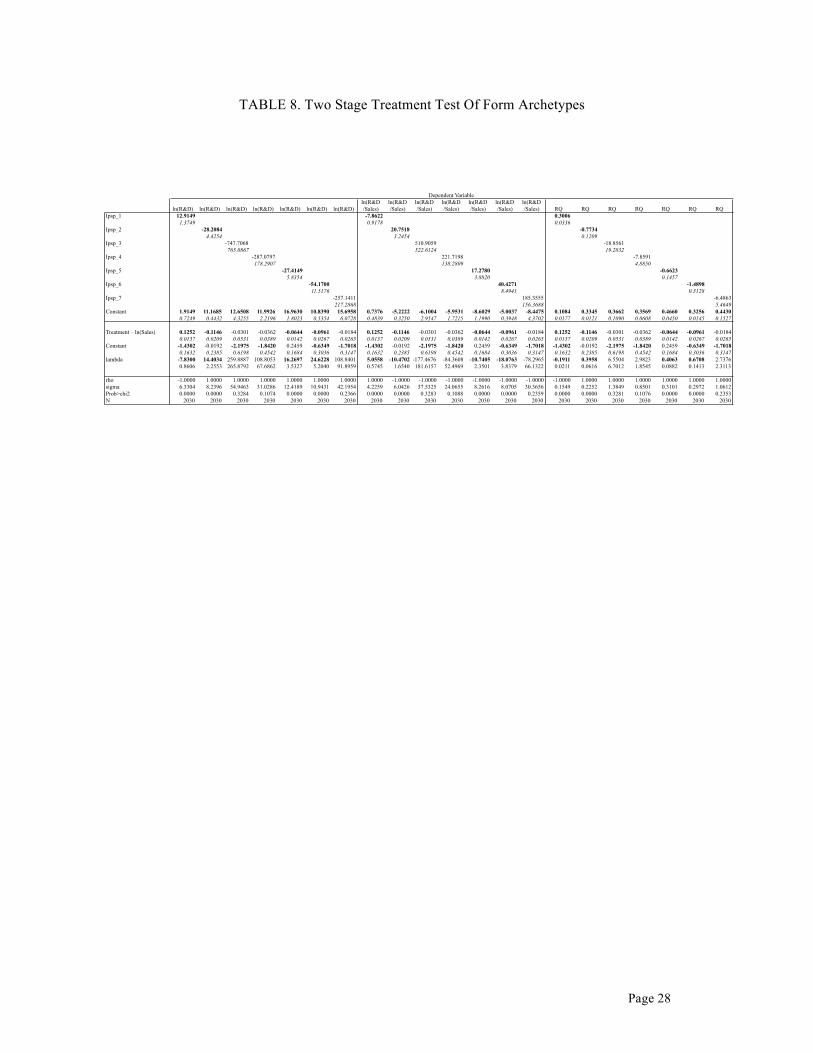
Table 8 presents the treatment model for the form archetypes. The Stage 1 models indicate
that scale increases the likelihood of choosing PSP1 (balance across product, service and process
Page 13 !
innovation). The stage 2 models indicate that PSP1 has significantly higher returns even after
controlling for the selection by larger firms. The stage 1 models also indicate small firms are more
likely to follow product archetypes (PSP2, 5, 6), and that these strategies have lower returns after
controlling for selection by smaller firm size.
Thus the treatment models reinforce results from the tests of main effects. Large firms
choose strategies whose returns increase most with scale. Thus firms are rational in their choice of
R&D strategy. The treatment models also indicate there are no strategies that favor small firms.
Small firms choose strategies whose returns are lower even after accounting for their smaller size.
IV. Summary
Our main tests of firm size replicated prior results indicating R&D spending increases
with size, but conflicted with prior results indicating small firms have higher R&D productivity.
Our results indicate R&D productivity, like R&D spending, increases with firm size. Thus large
firms are behaving rationally. The difference in our results versus prior results likely stem from
use of RQ, an outcome measure that accommodates all forms of R&D, versus product/patent
counts (which largely ignore process and incremental innovation). Accordingly our results
resolve the first question of the seemingly irrational behavior of large firms.
This leaves the second question of why small firms conduct R&D. To understand that,
we first turned to recent theory suggesting that small firms and large firms differ in their type of
R&D, and that the returns to type might vary with size. Accordingly we examined choice of
R&D strategy as well as the productivity of R&D strategies as a function of firm size. We
indeed found that firm size affected choice of R&D strategy. In particular, scale increased the
likelihood of incremental R&D (consistent with Rosen), 1991, process R&D (consistent with
Cohen and Klepper, 1996) and balanced horizon (consistent with Nelson 1959). However we
also found scale increased the likelihood of product and service R&D—indeed the most likely
large firm “type” strategy was a balance across product/service/process. This result differs from
Cohen and Klepper who found that small firms preferred product R&D. The difference likely
stems from the fact that the BRDIS measures for type are fairly crude: “did you introduce an
innovation (of the given type) in past three years?” In contrast Cohen and Klepper measure the
extent of product and process R&D.

Page 14 !
Somewhat surprisingly each of these strategies had higher returns even after controlling
for selection effects. Thus while Rosen and Cohen and Klepper are correct that small firms
choose different strategies, it is not the case these strategies favor small firms. Rather the
strategies appear to be ones for which the small firm penalty is less severe.
Thus we are still left with the question of why small firms conduct R&D. Theory offers
one additional insight—spillovers. Spence (1984) presented a theory of spillovers as a substitute
for R&D. However his model and much of the subsequent empirics have assumed the spillover
pool is shared equally by all firms in the industry—both the size of the pool (excluding the focal
firm), and the ability to exploit knowledge in the pool. If correct, then spillovers won’t
compensate for the small firm disadvantage.
However more recent work, motivated by macro models of heterogeneous firms, e.g.,
Jovanovic and MacDonald 1994, has proposed that spillover pools are asymmetric (Knott 2003).
In this view, flows are directional, such that firms at the frontier have no one to learn from, while
small firms can learn from almost the entire industry. In addition to work proposing spillovers
are asymmetric, is work proposing firms differ in their ability to exploit spillover pools (Cohen
and Levinthal 1989, Acs, Audretsch and Feldman 1994, Knott 2003). Empirical work supports
both hypotheses (Knott, Posen and Wu 2009). Given that, we next test the extent to which
spillovers compensate for small firm disadvantages with their own R&D.
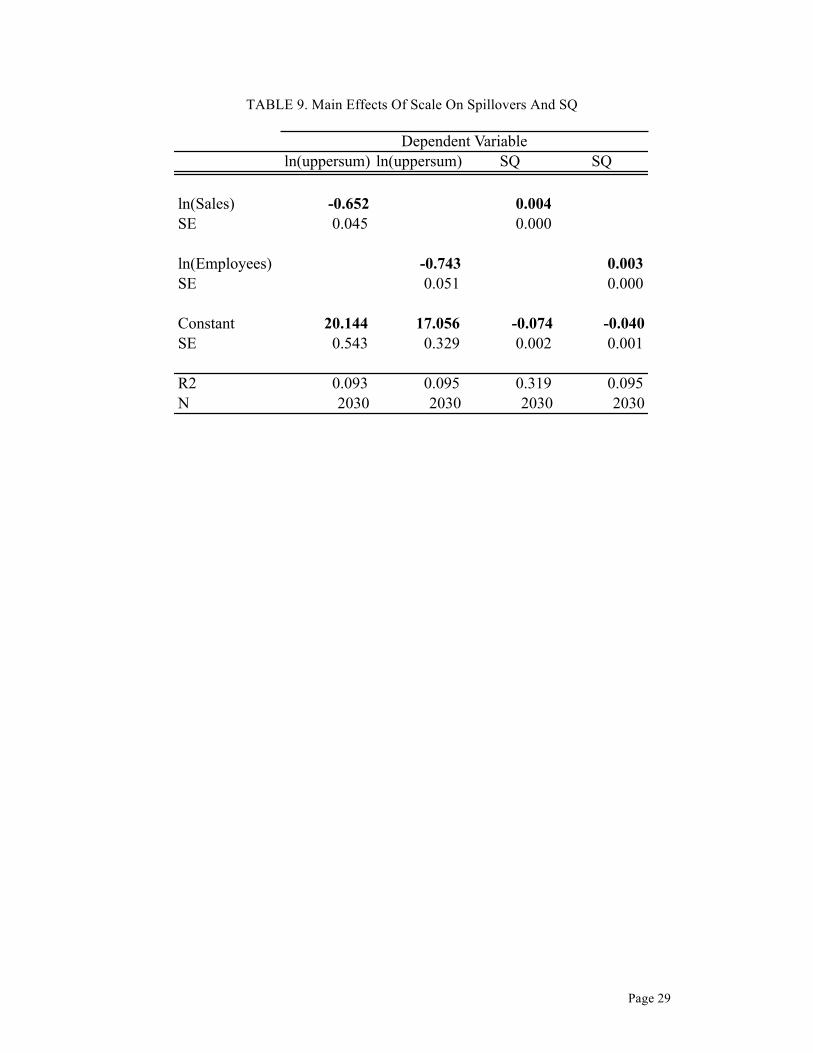
Table 9 mimics Table 1, but examines the spillover pool (ln(uppersum) and SQ rather
than own R&D and RQ). SQ (short for spillover quotient) is the estimated firm-specific output
elasticity of spillovers (the sum of ("4 + "4i ) in equation 1. Thus it is the percentage increase in
output associated with a 1% increase in spillovers. Table 9 indicates the coefficient on scale in
the spillover pool regression is negative and significant. This is largely due to the manner in
which spillover pools are constructed. Thus the role of the regression is principally to define
expected pool size as a function of scale. In contrast, the coefficient on scale in the SQ
regression is positive and significant. The combination of results indicates that while the size of
the spillover pool decreases with size that the ability to exploit the pool increases with size.
Looking across all our results, the spillover pool is the only variable whose effect decreases with
scale. Thus spillovers are the only “strategy” of those tested, that favors small firms.
Accordingly, spillovers can partially explain why small firms conduct R&D despite their scale

Page 15 !
disadvantages.
------------------------------------
Insert Table 9 about here
------------------------------------
V. Conclusion
There has been a long-standing debate regarding the impact of firm size on innovation.
Stylized facts indicate R&D spending increases with size, while R&D productivity decreases
with size. This creates a puzzle of large firm irrationality. One possible explanation for the
puzzle is that firm size affects the type of R&D firms conduct, and that the productivity of types
differs with firm size. Until recently, we have been unable to comprehensively test these views
because we lacked firm-level data on the type of R&D firms conduct, and because the most
common measures of R&D outcomes (product and patent counts) embed type.
We exploited recent developments to test these more nuanced views of innovation and firm
size. In particular, we utilized a recently created dataset (BRDIS) to solve the data availability
problem and a recent measure of R&D productivity (RQ) to solve the measurement problem.
The BRDIS data and the RQ measure allowed us to conduct a series of tests examining the
relationship between firm size, R&D strategy, R&D investment and R&D performance (RQ).
We found first that R&D spending and R&D productivity both increase with firm size.
This reconciles the puzzle of large firm irrationality. While the spending result is consistent with
prior studies, the productivity result conflicts with them. We believe the conflict stems from the
fact that prior results rely upon “type-specific” (product and patent count) measures of R&D
productivity that undercount the types of R&D done by large firms.
We found second that firm size does indeed affect choice of R&D strategy as expected in
theories proposed by Nelson, Rosen and Cohen & Klepper. All three theories correctly predicted
the strategies preferred by large firms. However the unexpected finding was that no strategy
favored small firms, there were merely strategies that penalized their scale less. This left the
question, “why do small firms conduct R&D?”
Given there was no strategy favoring small firms, we could identify only one other factor

Page 16 !
that might account for small firms conducting R&D—that they benefit disproportionately from
spillovers. We explored that possibility by characterizing the impact of scale on both the size of
a firm’s spillover pool and the elasticity of output with respect to that spillover pool. We found
that the size of the spillover pool decreases with scale, but that the elasticity of the pool increases
with scale. Thus small firms do appear to have one advantage relative to large firms—larger
spillover pools.
Beyond reconciling the first puzzle of irrational large firms, and providing insight into the
second puzzle of why small firms conduct R&D, our results offer a broader implication: that
large firms are the chief engine of innovation (and accordingly economic growth). Thus
Schumpeter (1942) was correct. Not only do large firms (using the US Small Business
Association definition of greater than 500 employees) conduct 5.75 more R&D in aggregate than
small firms, they have 13% higher productivity with that R&D. However this merely captures
their private returns to R&D. Perhaps an even greater benefit of large firm R&D is that it
generates the spillovers upon which small firm innovation free-rides.
!

Page 17 !
REFERENCES
Acs, Z. and D. Audretsch 1988. “Innovation in Large and Small Firms: An Empirical Analysis”, American Economic Review, 78 (4): 678-690. Acs, Z. and D. Audretsch 1990. Innovation and Small Firms, Cambridge: MIT Press Acs, Z., D. Audretsch and M. Feldman 1994. “R&D Spillovers and Recipient Firm Size”
Review of Economics and Statistics, 336-340. Allen, T. 1977 Managing the Flow of Technology: Technology Transfer and the
Dissemination of Technological Information Within the R&D Organization. Cambridge, MA: MIT Press Baldwin and Scott 1987 Market Structure and Technological Change, New York: Harwood Academic Publishers Bound, J., C. Cummins, Z. Griliches, B. Hall and A. Jaffe 1984. “Who Does R&D and Who Patents?” in Z. Griliches (ed), R&D, Patents and Productivity, Chicago, IL: University of Chicago Press, 21-54 Cohen, W. 2010 “Fifty Years of Empirical Studies of Innovative Activity and Performance,' in B.H. Hall and N. Rosenberg, eds., Handbook of Economics of Innovation, Amsterdam: North Holland Elsevier. Cohen, W. and S. Klepper 1996 "Firm Size and the Nature of Innovation within Industries: The Case of Process and Product R&D," The Review of Economics and Statistics, 78(2): 232-43 Hall, B. and J. Mairesse and P. Mohnen. 2010. “Measuring the Returns to R&D”. in B.H. Hall and N. Rosenberg, eds., Handbook of Economics of Innovation, Amsterdam: North Holland Elsevier. Henderson 1993 Jovanovic, B.,and G. M. MacDonald. 1994. "The Life Cycle of a Competitive 1ndustty", Journal of Political Economy 102(2): 322—47 Knott, A.M. 2003 “Persistent Heterogeneity and Sustainable Innovation”, Strategic
Management Journal, 24 (8) 687-705. Knott, A.M. 2008 “R&D Returns Causality: Absorptive Capacity or Organizational IQ” Management Science 54 (12) 2054-2067 Knott, A.M. and C. Vieregger 2014 "An Empirical Test of Endogenous Firm Growth" SSRN
Page 18 !
Working paper 2382885. Knott, A.M., H. Posen and B. Wu 2009. “Spillover asymmetry and why it matters” Management Science, 55(3): 373-388. Lentz, R. and D. Mortensen. 2008. An Empirical Model of Growth Through Product Innovation. Econometrica 76(6), 1317-1373. Link, A. 1982. “An analysis of the composition of R&D spending”, Southern Economic
Journal, 342-349 Richard R. Nelson, 1959. "The Simple Economics of Basic Scientific Research," Journal of
Political Economy, 67: 297. Pavitt, K., M. Robson and J. Townsend 1987. “The Size Distribution of Innovating Firms in the U.K.: 1945-1983”, The Journal of Industrial Economics, 55: 291-316. Romer, P. 1990. Endogenous Technological Change. Journal of Political Economy, 98(5), 71-102. Rosen, H. 1991 "Research and Development with Asymmetric Firm Sizes," RAND Journal of
Economics, 22(3): Scherer, F.M. 1965 “Firm Size, Market Structure, Opportunity and the Output of Patented Inventions”, American Economic Review, 55: 1097-1125 Scherer, FM and D. Harhoff. 2000. Technology policy for a world of skew-distributed outcomes. Research Policy 29, 559-566. Scherer, FM and Ross 1990. Industrial market structure and economic performance (3rd ed.) Boston: Houghton Mifflin Schumpeter, J. 1942 Capitalism, Socialism, and Democracy, New York: Harper and Row. Spence, A.M. 1984 "Cost Reduction, Competition, and Industry Performance', Econometrica, 52(1) 101-122 Stevens, G. and J. Burley.1997. “3,000 Raw Ideas Equals 1 Commercial Success!” Research-
Technology Management, 40,(3) : Syverson, C. 2011. What Determines Productivity. Journal of Economic Literature 49(2), 326-365. Thompson, P. 1996. Technological Opportunity and the Growth of Knowledge: A Schumpeterian Approach to Measurement. Journal of Evolutionary Economics 6(1), 77-97

Page 19 !

Page 20 !
TABLE 0. Data Summary
Observations=2030
Variable Mean Std. Dev.
Sales (4-year average, log) 11.803 2.137
Employees (4-year average, log) 6.193 1.900
R&D (4-year average, log) 8.595 1.951
spillover (log) 12.450 4.570
R&D Intensity (4-year average) 0.259 2.993
RQ (4-year average) 0.264 0.048
SQ (4-year average) -0.024 0.016
Development R&D (4-year average, percent) 4.198 9.074
Applied R&D (4-year average, percent) 14.711 17.811
Basic R&D (4-year average, percent) 81.091 20.826
Process R&D (4-year average, percent) 0.582 0.370
Product R&D (4-year average, percent) 0.771 0.322
Service R&D (4-year average, percent) 0.330 0.368
R&D Incremental (4-year average, percent) 76.879 25.613
R&D New-to-Market (4-year average, percent) 12.022 19.079
R&D New-to-Firm (4-year average, percent) 11.099 17.382

Page 21 !
TABLE 1. Main Effects of Firm Size
ln(R&D) ln(R&D)
ln(R&D
/Sales)
ln(R&D
/Sales) RQ RQ
ln(Sales) 0.621 -0.374 0.014
0.019 0.019 0.001
ln(Employees) 0.717 -0.325 0.009
0.018 0.019 0.001
Constant 1.263 4.152 1.081 -1.318 0.094 0.210
0.219 0.111 0.217 0.124 0.006 0.004
R-squared 0.463 0.488 0.239 0.143 0.412 0.120
N 2030 2030 2030 2030 2030 2030
All variables are four year (2008-2011) means
Dependent Variable

Page 22 !
TABLE 2. Main Effects Of Firm Size On Uni-Dimensional R&D Strategy
%basic %basic%
applied
%
applied
%
Develo
pment
%
Develo
pment
prob:
product
prob:
product
prob:
service
prob:
service
prob:
process
prob:
process
New to
market-
%sales
New to
market-
%sales
New to
firm-
%sales
New to
firm-
%sales
incre
mental-
%sales
incre
mental-
%sales
ln(Sales) 0.760 0.221 -0.338 0.086 0.177 0.219 -1.047 -0.329 1.624
SE 0.177 0.242 0.275 0.043 0.022 0.032 0.264 0.249 0.306
ln(Employees) 0.909 0.280 -0.445 0.069 0.229 0.278 -0.756 -0.280 1.336
SE 0.199 0.272 0.310 0.048 0.026 0.038 0.299 0.279 0.345
Constant -11.704 -8.364 8.386 9.248 88.680 87.447 1.614 2.187 -1.802 -1.129 -0.865 0.010 19.629 11.940 10.441 8.283 59.359 70.256
SE 2.177 1.346 2.917 1.779 3.321 2.024 0.503 0.302 0.266 0.162 0.364 0.220 3.177 1.940 3.000 1.815 3.667 2.231
R2 0.002 0.002 0.000 0.000 0.000 0.000 0.004 0.002 0.024 0.031 0.029 0.034 0.001 0.000 0.000 0.000 0.002 0.001
observations 2030 2030 2030 2030 2030 2030 2030 2030 2030 2030 2030 2030 2030 2030 2030 2030 2030 2030
Dependent Variable

Page 23 !
TABLE 3. Impact Of Uni-dimensional R&D Strategy On R&D Spending
Dependent variable=ln(R&D)
%basic % applied
%
Development P(product) P(service) P(process)
New to
market-
%sales
New to firm-
%sales
incremental-
%sales
strategy 0.007 0.048 -0.038 -4.047 -2.050 -2.889 0.027 -0.021 -0.015
0.017 0.009 0.008 0.556 0.479 0.510 0.007 0.010 0.006
strategy*ln(sales) 0.000 -0.003 0.003 0.337 0.210 0.218 -0.001 0.002 0.000
0.001 0.001 0.001 0.047 0.039 0.043 0.001 0.001 0.001
ln(sales) 0.609 0.672 0.373 0.346 0.506 0.478 0.639 0.583 0.614
0.017 0.020 0.056 0.040 0.022 0.032 0.018 0.018 0.041
constant 1.337 0.563 4.316 4.487 2.390 3.043 0.780 1.558 2.323
0.203 0.241 0.659 0.467 0.261 0.367 0.217 0.218 0.469
R-squared 0.431 0.439 0.437 0.446 0.446 0.442 0.461 0.438 0.461
strategy

Page 24 !
TABLE 4. Impact Of Uni-dimensional R&D Strategy On RQ
Dependent variable=RQ
%basic % applied
%
Development P(product) P(service) P(process)
New to
market-
%sales
New to firm-
%sales
incremental-
%sales
strategy -0.00060 -0.00130 0.00100 0.08500 0.06100 0.07200 -0.00100 0.00060 0.00060
0.00040 0.00020 0.00020 0.01400 0.01200 0.01300 0.00010 0.00025 0.00010
strategy*ln(sales) 0.00004 0.00010 -0.00009 -0.00700 -0.00700 -0.00700 0.00007 -0.00007 -0.00003
0.00004 0.00002 0.00002 0.00100 0.00090 0.00100 0.00001 0.00002 0.00001
ln(sales) 0.014 0.013 0.022 0.020 0.018 0.019 0.013 0.015 0.016
0.000 0.001 0.001 0.001 0.001 0.001 0.000 0.000 0.001
constant 0.097 0.116 0.008 0.028 0.062 0.047 0.114 0.088 0.052
0.005 0.006 0.016 0.011 0.006 0.009 0.005 0.005 0.012
R-squared 0.412 0.421 0.420 0.423 0.442 0.423 0.434 0.417 0.430
strategy

Page 25 !
Table 5. Strategy Archetypes
CLUSTER MEANS (STDEV)
Firms BASIC % APPLIED %
DEVELOP
MENT %
BAD1 630 5.13 16.96 77.91
6.75 6.26 6.32
BAD2 290 8.12 37.42 54.46
8.60 9.65 8.64
BAD3 1020 0.89 2.85 96.27
2.31 3.60 4.37
BAD4 30 51.17 14.53 34.30
23.91 13.78 19.89
BAD5 60 5.57 79.79 14.63
8.27 15.29 12.09
TOTAL 2030 4.20 14.71 81.09
9.07 17.81 20.83
CLUSTER MEANS (STDEV)
Firms
NEW TO
MARKET %
NEW TO
FIRM %
INCRE-
MENTAL %
OWN1 90 81.01 6.08 12.91
13.93 9.80 11.15
OWN2 70 12.31 78.94 8.75
17.19 20.16 11.10
OWN3 160 39.77 14.29 45.94
9.90 12.96 12.53
OWN4 180 8.70 33.54 57.76
8.04 10.14 10.35
OWN5 960 2.17 2.48 95.35
2.92 3.19 4.10
OWN6 570 11.25 9.82 78.93
7.94 6.85 5.76
TOTAL 2030 12.02 11.10 76.88
19.08 17.38 25.61
CLUSTER MEANS (STDEV)
Firms PRODUCT SERVICE PROCESS
PSP1 1050 0.81 0.70 0.56
0.29 0.32 0.32
PSP2 190 0.73 0.00 0.00
0.30 0.00 0.00
PSP3 10 0.00 0.00 0.50
0.00 0.00 0.30
PSP4 20 0.00 0.47 0.00
0.00 0.26 0.00
PSP5 620 0.84 0.64 0.00
0.24 0.30 0.00
PSP6 80 0.69 0.00 0.49
0.31 0.00 0.28
PSP7 60 0.00 0.67 0.68
0.00 0.28 0.32
TOTAL 2030 0.77 0.33 0.58
0.32 0.37 0.37
Page 26 !
TABLE 6. Two Stage Treatment Test Of Horizon Archetypes
ln(R&D) ln(R&D) ln(R&D) ln(R&D) ln(R&D)
ln(R&D
/Sales)
ln(R&D
/Sales)
ln(R&D
/Sales)
ln(R&D
/Sales)
ln(R&D
/Sales) RQ RQ RQ RQ RQ
Ibad_1 69.341 -40.789 1.574
36.998 21.906 0.842
Ibad_2 246.277 -148.801 5.745
364.497 220.004 8.492
Ibad_3 -97.356 58.594 -2.254
79.222 47.861 1.837
Ibad_4 -253.149 171.390 -6.473
165.130 111.402 4.207
Ibad_5 -80.589 69.709 -2.569
24.919 21.396 0.788
Constant -12.912 -26.622 57.273 12.715 11.059 9.322 17.949 -32.626 -6.118 -5.460 -0.224 -0.558 1.391 0.369 0.342
11.497 52.158 39.626 2.780 0.823 6.807 31.481 23.939 1.876 0.707 0.262 1.215 0.919 0.071 0.026
Treatment – ln(Sales) 0.025 0.009 -0.016 -0.025 -0.052 0.025 0.009 -0.016 -0.025 -0.052 0.025 0.009 -0.016 -0.025 -0.052
0.014 0.016 0.013 0.032 0.027 0.014 0.016 0.013 0.032 0.027 0.014 0.016 0.013 0.032 0.027
Constant -0.788 -1.179 0.189 -1.849 -1.273 -0.788 -1.179 0.189 -1.849 -1.273 -0.788 -1.179 0.189 -1.849 -1.273
0.163 0.192 0.156 0.382 0.309 0.163 0.192 0.156 0.382 0.309 0.163 0.192 0.156 0.382 0.309
lambda -41.951 -133.730 60.918 100.029 34.780 24.792 80.698 -36.776 -67.415 -29.878 -0.955 -3.115 1.412 2.549 1.104
22.434 197.836 49.644 65.136 10.712 13.283 119.410 29.992 43.942 9.198 0.511 4.609 1.151 1.659 0.339
rho -1.000 -1.000 1.000 1.000 1.000 1.000 1.000 -1.000 -1.000 -1.000 -1.000 -1.000 1.000 1.000 1.000
sigma 32.017 86.260 48.617 32.120 14.014 18.957 52.065 29.371 21.669 12.033 0.729 2.010 1.127 0.818 0.443
Prob>chi2 0.061 0.499 0.219 0.125 0.001 0.063 0.499 0.221 0.124 0.001 0.062 0.499 0.220 0.124 0.001
N 2030 2030 2030 2030 2030 2030 2030 2030 2030 2030 2030 2030 2030 2030 2030
Dependent Variable

Page 27 !
TABLE 7. Two Stage Treatment Test Of Riskiness Archetypes
ln(R&D) ln(R&D) ln(R&D) ln(R&D) ln(R&D) ln(R&D)
ln(R&D
/Sales)
ln(R&D
/Sales)
ln(R&D
/Sales)
ln(R&D
/Sales)
ln(R&D
/Sales)
ln(R&D
/Sales) RQ RQ RQ RQ RQ RQ
Iown_1 -36.84 26.75 -1.07
6.18 4.23 0.17
Iown_2 -91.85 59.62 -2.25
29.65 19.00 0.72
Iown_3 -65.16 42.87 -1.63
21.05 13.68 0.52
Iown_4 -988.35 519.94 -20.56
4614.19 2425.38 95.91
Iown_5 31.17 -18.63 0.72
8.23 4.75 0.18
Iown_6 -2505.41 1458.84 -56.14
46932.04 27328.10 1051.61
Constant 10.16 11.81 13.80 96.81 -6.08 716.48 -4.46 -5.42 -6.75 -49.73 5.44 -415.52 0.31 0.34 0.39 2.10 -0.07 16.13
0.31 1.11 1.73 411.87 3.89 13260.41 0.22 0.71 1.12 216.49 2.25 7721.41 0.01 0.03 0.04 8.56 0.09 297.13
Treatment – ln(Sales) -0.08 -0.05 -0.05 0.00 0.05 0.00 -0.08 -0.05 -0.05 0.00 0.05 0.00 -0.08 -0.05 -0.05 0.00 0.05 0.00
0.02 0.03 0.02 0.02 0.01 0.01 0.02 0.03 0.02 0.02 0.01 0.01 0.02 0.03 0.02 0.02 0.01 0.01
Constant -0.75 -1.21 -0.84 -1.31 -0.67 -0.57 -0.75 -1.21 -0.84 -1.31 -0.67 -0.57 -0.75 -1.21 -0.84 -1.31 -0.67 -0.57
0.27 0.30 0.23 0.22 0.16 0.17 0.27 0.30 0.23 0.22 0.16 0.17 0.27 0.30 0.23 0.22 0.16 0.17
lambda 17.21 40.54 32.50 497.93 -19.80 1502.15 -11.59 -25.85 -21.04 -261.72 11.35 -874.69 0.47 0.98 0.81 10.35 -0.44 33.66
2.79 12.99 10.44 2324.06 5.15 28139.10 1.91 8.32 6.78 1221.61 2.98 16385.14 0.08 0.31 0.26 48.31 0.12 630.52
rho 1.00 1.00 1.00 1.00 -1.00 1.00 -1.00 -1.00 -1.00 -1.00 1.00 -1.00 1.00 1.00 1.00 1.00 -1.00 1.00
sigma 7.82 17.06 17.82 281.86 15.81 1128.01 5.35 10.93 11.58 148.15 9.13 656.83 0.21 0.41 0.44 5.86 0.35 25.28
Prob>chi2 0.00 0.00 0.00 0.83 0.00 0.96 0.00 0.00 0.00 0.83 0.00 0.96 0.00 0.00 0.00 0.83 0.00 0.96
N 2030 2030 2030 2030 2030 2030 2030 2030 2030 2030 2030 2030 2030 2030 2030 2030 2030 2030
Dependent Vaariable
Page 28 !
TABLE 8. Two Stage Treatment Test Of Form Archetypes
ln(R&D) ln(R&D) ln(R&D) ln(R&D) ln(R&D) ln(R&D) ln(R&D)
ln(R&D
/Sales)
ln(R&D
/Sales)
ln(R&D
/Sales)
ln(R&D
/Sales)
ln(R&D
/Sales)
ln(R&D
/Sales)
ln(R&D
/Sales) RQ RQ RQ RQ RQ RQ RQ
Ipsp_1 12.9149 -7.8622 0.3006
1.3749 0.9178 0.0336
Ipsp_2 -28.2084 20.7518 -0.7734
4.4254 3.2454 0.1209
Ipsp_3 -747.7068 510.9059 -18.8561
765.0867 522.6124 19.2832
Ipsp_4 -287.0797 221.7198 -7.8591
178.2907 138.2809 4.8850
Ipsp_5 -27.4149 17.2780 -0.6623
5.8354 3.8820 0.1457
Ipsp_6 -54.1700 40.4271 -1.4898
11.5176 8.4941 0.3128
Ipsp_7 -257.1411 185.3555 -6.4863
217.2868 156.3688 5.4649
Constant 1.9149 11.1685 12.6508 11.9926 16.9630 10.8390 15.6958 0.7376 -5.2222 -6.1004 -5.9531 -8.6029 -5.0037 -8.4475 0.1084 0.3345 0.3662 0.3569 0.4660 0.3256 0.4430
0.7249 0.4432 4.3255 2.2196 1.8023 0.5354 6.0728 0.4839 0.3250 2.9547 1.7215 1.1990 0.3948 4.3702 0.0177 0.0121 0.1090 0.0608 0.0450 0.0145 0.1527
Treatment – ln(Sales) 0.1252 -0.1146 -0.0301 -0.0362 -0.0644 -0.0961 -0.0184 0.1252 -0.1146 -0.0301 -0.0362 -0.0644 -0.0961 -0.0184 0.1252 -0.1146 -0.0301 -0.0362 -0.0644 -0.0961 -0.0184
0.0137 0.0209 0.0531 0.0389 0.0142 0.0267 0.0265 0.0137 0.0209 0.0531 0.0389 0.0142 0.0267 0.0265 0.0137 0.0209 0.0531 0.0389 0.0142 0.0267 0.0265
Constant -1.4302 -0.0192 -2.1975 -1.8420 0.2459 -0.6349 -1.7018 -1.4302 -0.0192 -2.1975 -1.8420 0.2459 -0.6349 -1.7018 -1.4302 -0.0192 -2.1975 -1.8420 0.2459 -0.6349 -1.7018
0.1632 0.2385 0.6198 0.4542 0.1684 0.3036 0.3147 0.1632 0.2385 0.6198 0.4542 0.1684 0.3036 0.3147 0.1632 0.2385 0.6198 0.4542 0.1684 0.3036 0.3147
lambda -7.8300 14.4034 259.8887 108.8053 16.2697 24.6228 108.8401 5.0558 -10.4702 -177.4676 -84.3608 -10.7405 -18.0763 -78.2965 -0.1911 0.3958 6.5504 2.9823 0.4063 0.6708 2.7376
0.8606 2.2553 265.8792 67.6862 3.5327 5.2040 91.8959 0.5745 1.6540 181.6157 52.4969 2.3501 3.8379 66.1322 0.0211 0.0616 6.7012 1.8545 0.0882 0.1413 2.3113
rho -1.0000 1.0000 1.0000 1.0000 1.0000 1.0000 1.0000 1.0000 -1.0000 -1.0000 -1.0000 -1.0000 -1.0000 -1.0000 -1.0000 1.0000 1.0000 1.0000 1.0000 1.0000 1.0000
sigma 6.3304 8.2396 54.9463 31.0286 12.4189 10.9431 42.1954 4.2259 6.0426 37.5325 24.0655 8.2616 8.0705 30.3656 0.1549 0.2252 1.3849 0.8501 0.3101 0.2972 1.0612
Prob>chi2 0.0000 0.0000 0.3284 0.1074 0.0000 0.0000 0.2366 0.0000 0.0000 0.3283 0.1088 0.0000 0.0000 0.2359 0.0000 0.0000 0.3281 0.1076 0.0000 0.0000 0.2353
N 2030 2030 2030 2030 2030 2030 2030 2030 2030 2030 2030 2030 2030 2030 2030 2030 2030 2030 2030 2030 2030
Dependent Variable
Page 29 !
TABLE 9. Main Effects Of Scale On Spillovers And SQ
ln(uppersum) ln(uppersum) SQ SQ
ln(Sales) -0.652 0.004
SE 0.045 0.000
ln(Employees) -0.743 0.003
SE 0.051 0.000
Constant 20.144 17.056 -0.074 -0.040
SE 0.543 0.329 0.002 0.001
R2 0.093 0.095 0.319 0.095
N 2030 2030 2030 2030
Dependent Variable