Sept 2018 - leg.mt.gov
19
HELPING MONTANA’S POOREST- PERFORMING STUDENTS: ENGLISH LEARNERS FINAL REPORT TO THE 66 TH MONTANA LEGISLATURE Sept 2018 Research conducted by Hope Stockwell and Pad McCracken for the State-Tribal Relations Committee
Transcript of Sept 2018 - leg.mt.gov

HELPING MONTANA’S POOREST- PERFORMING STUDENTS:
ENGLISH LEARNERS
FINAL REPORT TO THE 66TH MONTANA LEGISLATURE
Sept 2018
Research conducted by Hope Stockwell and Pad McCracken for the State-Tribal Relations Committee

MONTANA LEGISLATIVE SERVICES DIVISION i
STATE-TRIBAL RELATIONS COMMITTEE MEMBERS
Before the close of each legislative session, the House and Senate leadership appoint lawmakers to interim committees. The members of the State-Tribal Relations Committee, like most other interim committees, serve one 20-month term. Members who are reelected to the Legislature, subject to overall term limits and if appointed, may serve again on an interim committee. This information is included in order to comply with 2-15-155, MCA.
Senate Members Senator Jen Gross PO Box 30821 Billings, MT 59107-0821 Ph: 406-696-0649 Email: [email protected] Senator Steve Hinebauch 610 Road 118 Wibaux, MT 59353-9058 Ph: 406-365-7967 Email: [email protected] Senator Jason Small HC 42 Box 560 Busby, MT 59016-9703 Ph: 406-690-0923 Email: [email protected] Senator Frank Smith PO Box 729 Poplar, MT 59255-0729 Ph: 406-942-0615 Email: [email protected]
House Members Representative Alan Doane, Vice Chair 268 County Road 521 Bloomfield, MT 59315-9500 Ph: 406-583-7546 Email: [email protected] Representative James O’Hara 5254 Frenchman Ridge Rd Fort Benton, MT 59442-8817 Ph: 406-799-2992 Representative Rae Peppers PO Box 497 Lame Deer, MT 59043-0497 Ph: 406-697-0565 Email: [email protected] Representative Sharon Stewart-Peregoy, Chair PO Box 211 Crow Agency, MT 59022-0211 Ph: 406-639-2198 Email: [email protected]
MONTANA LEGISLATIVE SERVICES DIVISION ii
P.O. Box 201706 Helena, MT 59620-1706 Phone: (406) 444-3064 Fax: (406) 444-3971
Website: http://leg.mt.gov/tribal
State-Tribal Relations Committee Staff Laura Sankey Keip, Attorney | Hope Stockwell, Research Analyst |Laura Sherley, Secretary
MONTANA LEGISLATIVE SERVICES DIVISION iii
MONTANA LEGISLATIVE SERVICES DIVISION iv
This report is a summary of the work of the State-Tribal Relations Committee specific to the committee’s 2017-2018 work pertaining to improving American Indian student achievement as outlined in the committee’s work plan. Members received additional information and public testimony on the subject, and this report is an effort to highlight key information and the processes followed by the committee in reaching its conclusions. To review additional information, including audio minutes and exhibits, visit the committee’s website: http://leg.mt.gov/tribal.

MONTANA LEGISLATIVE SERVICES DIVISION v
TABLE OF CONTENTS Introduction ......................................................................................................................................................................... 1
Facts and Figures ................................................................................................................................................................ 2
English Learners in a Nutshell ........................................................................................................................................ 11
Other Considerations .................................................................................................................................................. 12
Conclusions ........................................................................................................................................................................ 13
IMPROVING INDIAN STUDENT ACHIEVEMENT
MONTANA LEGISLATIVE SERVICES DIVISION
Office of Research and Policy Analysis 1
INTRODUCTION
According to the Fall 2016 Montana American Indian Student Achievement Data Report produced by the Office of Public Instruction, 14 percent of the students enrolled in Montana’s K-12 public schools in the 2015-2016 school year were Indian. Among those students, the special education rate was 15.1 percent compared to 9.7 percent for white students. On statewide assessments for English language arts, math, and science that school year, Indian students’ proficiency rates were 28.5 percent to 34 percent lower than those of white students. While dropout rates declined slightly overall in 2014-2015, the dropout rate for Indian students remained significantly higher at 9.5 percent in grades 9-12 when compared to 2.6 percent for white students.
In the 2015-2016 interim, the State-Tribal Relations Committee studied the impact of public charter schools on reservations in other states and reviewed data on the existing public and private educational systems for Indian students in Montana on and off the reservations. The STRC also reviewed data on student attendance, performance, and other educational outcomes. In addition, the STRC looked at charter schools serving Indian students in other states and the available research on the resulting educational outcomes.
This interim, the STRC endeavored to look more broadly at improving Indian student success, including the intersections between school, community, and home life, how nutrition and health issues impact Indian students in Montana, and how tribal colleges are or could be involved in improving student outcomes.
Through the course of its work, the STRC honed in on helping English learners, students who are not proficient in English and have another language of impact spoken at home.
IMPROVING INDIAN STUDENT ACHIEVEMENT
MONTANA LEGISLATIVE SERVICES DIVISION
Office of Research and Policy Analysis 2
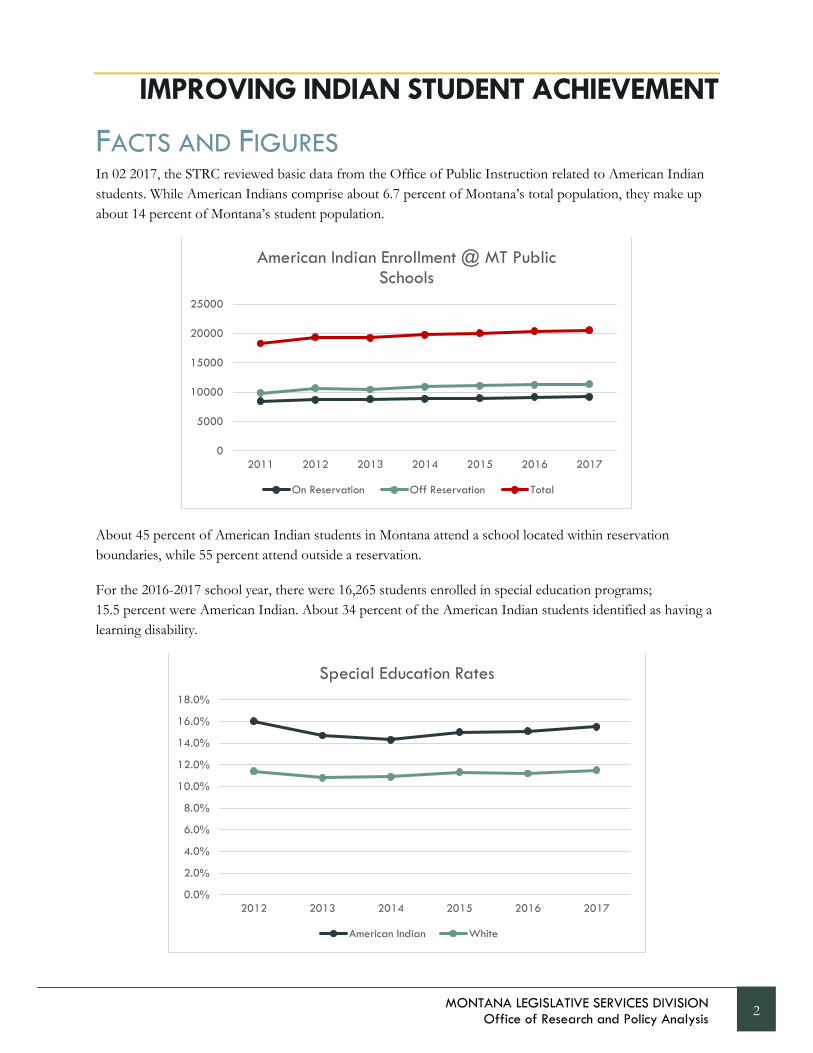
FACTS AND FIGURES In 02 2017, the STRC reviewed basic data from the Office of Public Instruction related to American Indian students. While American Indians comprise about 6.7 percent of Montana’s total population, they make up about 14 percent of Montana’s student population.
About 45 percent of American Indian students in Montana attend a school located within reservation boundaries, while 55 percent attend outside a reservation.
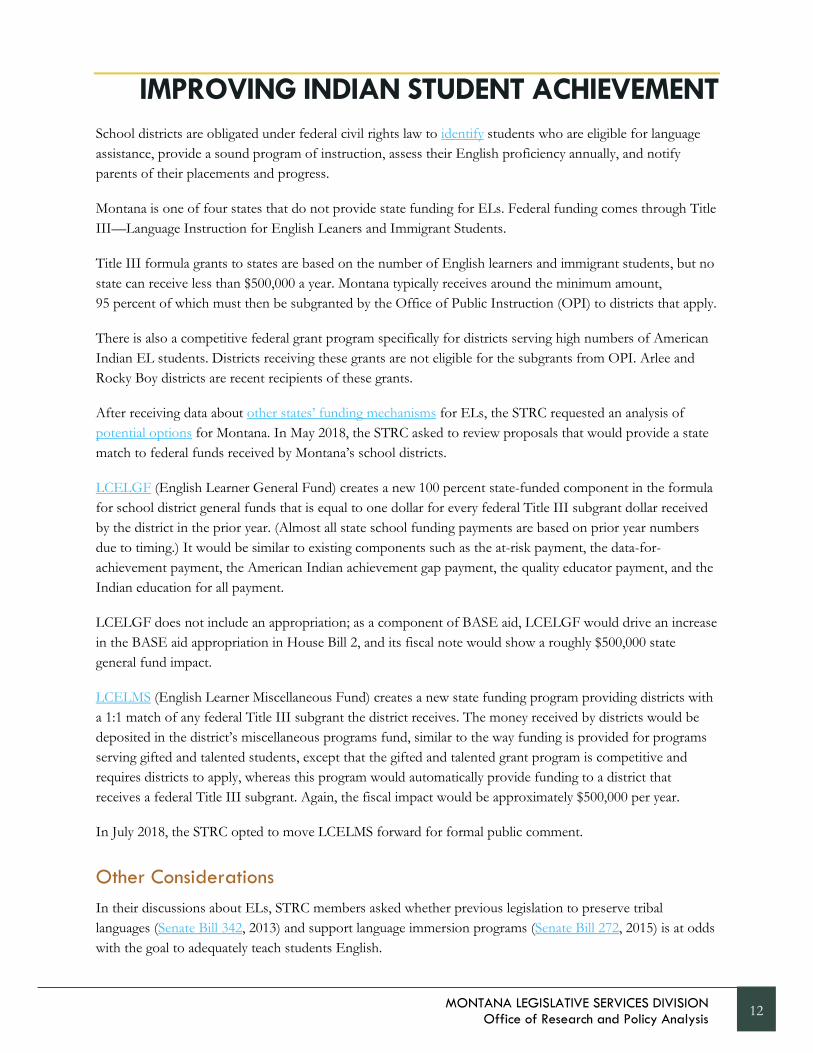
For the 2016-2017 school year, there were 16,265 students enrolled in special education programs; 15.5 percent were American Indian. About 34 percent of the American Indian students identified as having a learning disability.
0
5000
10000
15000
20000
25000
2011 2012 2013 2014 2015 2016 2017
American Indian Enrollment @ MT Public Schools
On Reservation Off Reservation Total
0.0%
2.0%
4.0%
6.0%
8.0%
10.0%
12.0%
14.0%
16.0%
18.0%
2012 2013 2014 2015 2016 2017
Special Education Rates
American Indian White

IMPROVING INDIAN STUDENT ACHIEVEMENT
MONTANA LEGISLATIVE SERVICES DIVISION
Office of Research and Policy Analysis 3
Although Montana has no statewide or defined attendance policy, the Office of Public Instruction says studies show missing more than 10 percent of school directly affects a student’s grade level reading and harms student academic growth exponentially. As shown below, American Indian students overall had an attendance rate of about 88 percent in 2016.
Attendance is lower for American Indian students attending school on a reservation. While their average attendance at schools located on a reservation was 85.5 percent in 2016, there were 12 schools on reservations where the American Indian attendance rate was less than 85.5 percent that year. Three of those schools had attendance rates of less than 80 percent, which means every student at those schools missed, on average, at least 1 day of school per week.
Note: “Urban” includes students in Kalispell, Butte, Bozeman, Havre, Billings, Missoula, Helena, and Great Falls.
80.0%
82.0%
84.0%
86.0%
88.0%
90.0%
92.0%
94.0%
96.0%
2012 2013 2014 2015 2016
Attendance
Am Indian White Urban Am Indian
Am Indian, On Reservation Am Indian, Off Reservation

IMPROVING INDIAN STUDENT ACHIEVEMENT
MONTANA LEGISLATIVE SERVICES DIVISION
Office of Research and Policy Analysis 4
After 5 years of steady increases, 2016 saw the first decrease in graduation rates for all students and for American Indian students in their 4-year cohort. In 2016, the American Indian graduation rate dropped from a high of 67.3 percent to 66.0 percent; white students stayed the same at 88.7 percent.
Dropout rates are declining. However, American Indians continue to drop out at a rate three times higher than white students. Also, American Indian students drop out in much larger percentages at the seventh and eighth grade levels compared to white students.
55.0%
60.0%
65.0%
70.0%
75.0%
80.0%
85.0%
90.0%
95.0%
2012 2013 2014 2015 2016
Graduation
American Indian White
0.0%
2.0%
4.0%
6.0%
8.0%
10.0%
12.0%
14.0%
2008 2009 2010 2011 2012 2013 2014 2015 2016
Dropout
AI flag White

IMPROVING INDIAN STUDENT ACHIEVEMENT
MONTANA LEGISLATIVE SERVICES DIVISION
Office of Research and Policy Analysis 5
Montana’s American Indian students are suspended more often than white students, correlating with national indicators that students of color tend to be suspended and expelled at higher rates than their white peers.
9.6
2.6
12.4
5.46.6
2.5
AmericanIndian
White AmericanIndian
White AmericanIndian
White
Statewide On Reservation Off Reservation
Percent of Students Suspended by Group

IMPROVING INDIAN STUDENT ACHIEVEMENT
MONTANA LEGISLATIVE SERVICES DIVISION
Office of Research and Policy Analysis 6
The Smarter Balanced assessment given to students in third through eighth grades during the 2015-2016 school year shows American Indian students lag behind and regardless of whether they attend school on or off a reservation.
Smarter Balanced Test Scores, 2016
0.0%
10.0%
20.0%
30.0%
40.0%
50.0%
60.0%
Novice Nearing Proficiency Proficient Advanced
Math
American Indian White
0.0%
10.0%
20.0%
30.0%
40.0%
50.0%
60.0%
Novice Nearing Proficiency Proficient Advanced
English Language Arts
American Indian White

IMPROVING INDIAN STUDENT ACHIEVEMENT
MONTANA LEGISLATIVE SERVICES DIVISION
Office of Research and Policy Analysis 7
American Indian Smarter Balanced Test Scores, 2016 By Geographic Area
0.0%
10.0%
20.0%
30.0%
40.0%
50.0%
60.0%
70.0%
80.0%
90.0%
100.0%
Math
Novice Nearing Proficiency Proficient Advanced Proficient and Advanced
0.0%10.0%20.0%30.0%40.0%50.0%60.0%70.0%80.0%90.0%
100.0%
English Language Arts
Novice Nearing Proficiency Proficient Advanced Proficient and Advanced

IMPROVING INDIAN STUDENT ACHIEVEMENT
MONTANA LEGISLATIVE SERVICES DIVISION
Office of Research and Policy Analysis 8
For English learners (ELs), students who are not proficient in English and have another language of impact spoken at home, the achievement gap is more pronounced.
American Indian Smarter Balanced Test Scores, 2016 By Type of Learner
0.0%
10.0%
20.0%
30.0%
40.0%
50.0%
60.0%
70.0%
80.0%
90.0%
Novice Nearing Proficiency Proficient Advanced
Math
Not EL EL
0.0%
10.0%
20.0%
30.0%
40.0%
50.0%
60.0%
70.0%
80.0%
90.0%
Novice Nearing Proficiency Proficient Advanced
English Language Arts
Not EL EL

IMPROVING INDIAN STUDENT ACHIEVEMENT
MONTANA LEGISLATIVE SERVICES DIVISION
Office of Research and Policy Analysis 9
Math scores from 2013 CRT tests show that ELs are the lowest-performing subgroup of students in Montana, lower than students receiving special education. While this chart is dated, 2017 Smarter Balanced data lead to the same conclusion, with less than 7 percent of ELs scoring proficient or higher on English language arts or math assessments. Roughly 50 percent of non-EL students score proficient or higher in English language arts and 40 percent in math.

IMPROVING INDIAN STUDENT ACHIEVEMENT
MONTANA LEGISLATIVE SERVICES DIVISION
Office of Research and Policy Analysis 10
Disaggregated graduation rates tell a similar story – English learners have the lowest graduation rates of any subgroup in Montana.
English learners are typically the lowest-performing subgroup nationally, which is why the federal Every Student Succeeds Act (ESSA) requires states to focus on EL achievement in their accountability plans. ESSA requires schools to demonstrate the progress of ELs toward English language proficiency and to show that they are making gains in academic achievement.
Montana’s current achievement data for ELs led the STRC to focus much of the rest of its Indian student achievement study on this particular group of students.

IMPROVING INDIAN STUDENT ACHIEVEMENT
MONTANA LEGISLATIVE SERVICES DIVISION
Office of Research and Policy Analysis 11
ENGLISH LEARNERS IN A NUTSHELL There are about 3,000 students identified as ELs in Montana, accounting for about 2 percent of Montana’s 150,000 public school students. Most ELs are from households where an American Indian language is spoken. The second-largest group is from German-speaking Hutterite colonies. Students from Spanish-speaking families are the third-largest group.
Number of Students by Language of Impact
12%
7%3%
2%
76%
ELs' Primary Languages of Impact in Montana
German
Spanish
Other
Russian
Indigenous Languages
0100200300400500600700800900
IMPROVING INDIAN STUDENT ACHIEVEMENT
MONTANA LEGISLATIVE SERVICES DIVISION
Office of Research and Policy Analysis 12
School districts are obligated under federal civil rights law to identify students who are eligible for language assistance, provide a sound program of instruction, assess their English proficiency annually, and notify parents of their placements and progress.
Montana is one of four states that do not provide state funding for ELs. Federal funding comes through Title III—Language Instruction for English Leaners and Immigrant Students.
Title III formula grants to states are based on the number of English learners and immigrant students, but no state can receive less than $500,000 a year. Montana typically receives around the minimum amount, 95 percent of which must then be subgranted by the Office of Public Instruction (OPI) to districts that apply.
There is also a competitive federal grant program specifically for districts serving high numbers of American Indian EL students. Districts receiving these grants are not eligible for the subgrants from OPI. Arlee and Rocky Boy districts are recent recipients of these grants.
After receiving data about other states’ funding mechanisms for ELs, the STRC requested an analysis of potential options for Montana. In May 2018, the STRC asked to review proposals that would provide a state match to federal funds received by Montana’s school districts.
LCELGF (English Learner General Fund) creates a new 100 percent state-funded component in the formula for school district general funds that is equal to one dollar for every federal Title III subgrant dollar received by the district in the prior year. (Almost all state school funding payments are based on prior year numbers due to timing.) It would be similar to existing components such as the at-risk payment, the data-for-achievement payment, the American Indian achievement gap payment, the quality educator payment, and the Indian education for all payment.
LCELGF does not include an appropriation; as a component of BASE aid, LCELGF would drive an increase in the BASE aid appropriation in House Bill 2, and its fiscal note would show a roughly $500,000 state general fund impact.
LCELMS (English Learner Miscellaneous Fund) creates a new state funding program providing districts with a 1:1 match of any federal Title III subgrant the district receives. The money received by districts would be deposited in the district’s miscellaneous programs fund, similar to the way funding is provided for programs serving gifted and talented students, except that the gifted and talented grant program is competitive and requires districts to apply, whereas this program would automatically provide funding to a district that receives a federal Title III subgrant. Again, the fiscal impact would be approximately $500,000 per year.
In July 2018, the STRC opted to move LCELMS forward for formal public comment.
Other Considerations In their discussions about ELs, STRC members asked whether previous legislation to preserve tribal languages (Senate Bill 342, 2013) and support language immersion programs (Senate Bill 272, 2015) is at odds with the goal to adequately teach students English.

IMPROVING INDIAN STUDENT ACHIEVEMENT
MONTANA LEGISLATIVE SERVICES DIVISION
Office of Research and Policy Analysis 13
Montana’s Constitution in Article X, section 1, provides for a system of education that will develop the full educational potential of each person and guarantees equality in educational opportunity. Article X, section 1, also recognizes the distinct and unique cultural heritage of American Indians and commits to preserving their cultural integrity in Montana’s educational goals.
Research finds that there can be a number of benefits in speaking two languages, including improved attention and executive function, boosts in overall school performance and engagement, and greater reading comprehension. Other research calls some of these claims into question, but a number of states are supporting dual language immersion classrooms. Utah, for example, points to the following as “proven benefits” of dual language immersion:
• Second language skills: students achieve high proficiency in the immersion language. • Improved performance on standardized tests: immersion students perform as well as or better than
nonimmersion students on standardized tests of English and math administered in English. • Enhanced cognitive skills: immersion students typically develop greater cognitive flexibility,
demonstrating increased attention control, better memory, and superior problem solving skills as well as an enhanced understanding of their primary language.
• Increased cultural sensitivity: immersion students are more aware of and show more positive attitudes toward other cultures and an appreciation of other people.
• Long-term benefits: immersion students are better prepared for the global community and job markets where a second language is an asset.
At its May 2018 meeting, the STRC opted to draft proposals that would extend the termination dates for both SB 342 (2013) and SB 272 (2015), which are set to expire on June 30, 2019. In July 2018, the committee also put these proposals (LCMILP and LCCICA) out for formal public comment.
CONCLUSIONS At its September 2018 meeting, the STRC adopted all three legislative proposals put out for formal public comment in July 2018. They include:
• LCELMS (assigned as LC 314, 2019): providing funding for school district programs serving English Learners via a 1:1 match of any federal Title III subgrant the district receives. The bill includes a $500,000 annual appropriation.
• LCMILP (assigned as LC 315, 2019): extending the termination date of the Montana Indian Language Preservation Program by 4 years to June 30, 2023.
• LCCICA (assigned as LC 318, 2019): extending the termination date of the Cultural Integrity and Commitment Act, which supports language immersion programs, by 4 years to June 30, 2023.
CL0106 8274HSIA.DOCX