Seminar on Global Economy
42
Contemporary Global Economy “Nothing endures but change” (Hereclitis, 5 th century B.C. Greek Philosopher ) Professor John Saee, PhD Editor-in-Chief Journal of Management Systems (USA) Email address: professorsaee@ao l.com Copy right: Professor John Saee 2011
-
Upload
branialina -
Category
Documents
-
view
220 -
download
0
Transcript of Seminar on Global Economy

8/6/2019 Seminar on Global Economy
http://slidepdf.com/reader/full/seminar-on-global-economy 1/42
Contemporary Global Economy
“Nothing endures but change”
(Hereclitis, 5 th century B.C. Greek Philosopher )
Professor John Saee, PhDEditor-in-Chief
Journal of Management Systems (USA)Email address: [email protected]
Copyright: Professor John Saee 2011

8/6/2019 Seminar on Global Economy
http://slidepdf.com/reader/full/seminar-on-global-economy 2/42
Overview
1. The World Business Challenge:The Diverse International Marketplace
2. Definitions of Globalization
3. Main Catalysts for Globalization:A Macro-level of Analysis
4. Sources of Motivations Behind the Globalization:
A Micro-level of Analysis5. Dynamics of Economics: Changing Demographics of the
Global Economy;Facts and Figures
5.1 Globalization waves in the 19th and 20th century
5.2 Foreign trade in goods and services
5.3 Foreign direct investment
6. Globalization: Prosperity or Impoverishment?
5.3 MNCs` influence in the global economy
Copyright: Professor John Saee 2011

8/6/2019 Seminar on Global Economy
http://slidepdf.com/reader/full/seminar-on-global-economy 3/42
1. The World Business Challenge:The Diverse International Marketplace
• Political diversity (Chiefs, Kings, dictators, one-partygovernment and democracies)
• Economic diversity ( national wealth diversities vary from$100 per capita (Somalia) to almost $40,000 per capita(Switzerland)
• Regional diversity (distribution of wealth and population:North America has 5-6 % of the world population, but controlsone-third of the world GDP: Asia almost 60 % of the worldpopulation, but only about a quarter of world GDP (less than10 % without Japan and China)
• Cultural and linguistic diversity (world’s 200 nations with
10,000 linguistic/cultural groups)
Copyright: Professor John Saee 2011

8/6/2019 Seminar on Global Economy
http://slidepdf.com/reader/full/seminar-on-global-economy 4/42
•
Diversities in country size and population (at the turn of the 20th century, 60 countries ONLY and now 200 countries;China 1.3 billion inhabitants to 43 countries with less thanone million population)
• Developmental diversities between industrialized nations
(80 % urban populations, 3 % of their GDP from agriculture)and developing countries, e.g. Sub-Saharan Africa and Asia(30 % are urbanized but receive 30 % of GDPs fromagriculture).
1. The World Business Challenge:The Diverse International Marketplace
Copyright: Professor John Saee 2011

8/6/2019 Seminar on Global Economy
http://slidepdf.com/reader/full/seminar-on-global-economy 5/42
2. Definitions of Globalization
What is globalization?
•
Sociologists’ definition:“ Globalisation is the intensification of worldwide social
relations which link distant localities in such a way that local happenings are shaped by events occurring many miles away and
vice versa.” (Giddens, cited in Hoogvelt, 1997)
•Economists’ definitions:Globalization is a drive toward the “ commercial integration of
world economies”
Globalization as a move away from “an economic system in which
national barriers are district entities, isolated from each other by trade barriers and barriers of distance, time and culture, and
toward a system in which national markets are merging
into one huge global marketplace ” . (Hill, 2004)
Copyright: Professor John Saee 2011
8/6/2019 Seminar on Global Economy
http://slidepdf.com/reader/full/seminar-on-global-economy 6/42
Definition of globalization describing fundamentaleconomic dynamics:
Increasingly moving away from a world in which nationaleconomies being relatively isolated from each other (by barriersto cross-border trade and investment, by distance, time zones
and language, and by national differences in governmentregulation, culture, and business systems)
to moving toward a world in which national economies aremerging into an interdependent global economic system,
commonly referred to as globalization (Hill, 2004).
2. Definitions of Globalization
Copyright: Professor John Saee 2011

8/6/2019 Seminar on Global Economy
http://slidepdf.com/reader/full/seminar-on-global-economy 7/42
3. Main Catalysts for Globalization:A Macro-level of Analysis
Environmental change and globalization provide firms withthe motivation to internationalize their operations. There arevarious catalysts for globalization:
•Technological forces
•Social Forces
•Political and legal forces
•Economic forces
Copyright: Professor John Saee 2011

8/6/2019 Seminar on Global Economy
http://slidepdf.com/reader/full/seminar-on-global-economy 8/42
Technological forces:•Industrialization Increased role and improvements of technology:
– Communications
– Transportation
– Information processing (Fisher et al., 2006).
• The second half of the twentieth century has witnessed theadvent of jet aircraft, computers and satellites.
3. Main Catalysts for Globalization:A Macro-level of Analysis
Copyright: Professor John Saee 2011

8/6/2019 Seminar on Global Economy
http://slidepdf.com/reader/full/seminar-on-global-economy 9/42
The Role of Technological Change:
• Microprocessors and telecommunications: enabled theexplosive growth of high-power, low-cost computing, vastlyincreasing the amount of information that can be processed byindividuals and firms.
•
The Internet and World Wide Web: phenomenal recent growthof the Internet and the associated World Wide Web. (In 1990,fewer than 1 million users were connected to the Internet.)
• The expanding volume of Web-based electronic commerce (e-commerce) is increasingly a growing percentage of cross-bordertransactions.
• Transportation technology: the most important are thedevelopment of commercial jet aircraft and super-freighters andthe introduction of containerization, which greatly simplifiestransshipment from one mode of transport to another andsignificantly lowers the costs of shipping.
3. Main Catalysts for Globalization:A Macro-level of Analysis
Copyright: Professor John Saee 2011
8/6/2019 Seminar on Global Economy
http://slidepdf.com/reader/full/seminar-on-global-economy 10/42
Social forces:•Consumerism
•Convergence in consumers’ tastes and preferences in differentparts of the world, for example:
•Education and training
3. Main Catalysts for Globalization:A Macro-level of Analysis
Copyright: Professor John Saee 2011

8/6/2019 Seminar on Global Economy
http://slidepdf.com/reader/full/seminar-on-global-economy 11/42
Political and legal forces:•Reduced barriers to trade and investment:
General Agreement on Tariffs and Trade: Treaty designed toremove barriers to the free flow of goods, services, and capitalbetween nations; often referred to as GATT.
World Trade Organization (WTO): Agency established byagreement of more than 120 economies at the Uruguay Round in1993 to police the international trading system;
•Dramatic increase in the number of bilateral investment treatiesdesigned to protect and promote investment between two
countries;•Increased protection of the intellectual property;
•Reduction of the government interference in the economy andprivatization;
3. Main Catalysts for Globalization:A Macro-level of Analysis
Copyright: Professor John Saee 2011

8/6/2019 Seminar on Global Economy
http://slidepdf.com/reader/full/seminar-on-global-economy 12/42
Political and legal forces:Deregulation in the world economy led to an unprecedentedexpansion of international trade;
Meanwhile, recent decades witnessed the most remarkableinstitutional harmonization and economic integration amongnations in the world history. While economic integration wasincreasing throughout the 1970s and 1980s, the extent of integration has come sharply into focus only since the collapse of communism in 1989. By 1995, one dominant global economicsystem was emerging.
3. Main Catalysts for Globalization:A Macro-level of Analysis
Copyright: Professor John Saee 2011
8/6/2019 Seminar on Global Economy
http://slidepdf.com/reader/full/seminar-on-global-economy 13/42
Economic forces:• Classic internationalization process:
Incremental process of increasing commitment andunderstanding of foreign market (Uppsala Model).
Today many companies shortcut this process:In an internet age, many are even “Born Global”;
• Increased competition, trade, incomes;
• Institutional developments and arrangements;
• New forms of industrial organization.
3. Main Catalysts for Globalization:A Macro-level of Analysis
Copyright: Professor John Saee 2011

8/6/2019 Seminar on Global Economy
http://slidepdf.com/reader/full/seminar-on-global-economy 14/42
4. Sources of Motivations Behind the
Globalization: A Micro-level of Analysis
1. To increase profits and sales by entering new markets –
emerging new markets, creation of large new markets due toeconomic integration, faster-growing foreign markets;
2. The ability to reduce costs of factors of production (such as labor,energy, land, and capital) – economies of scope and scale, together with focused production, reduce the cost of products and services;
3. The ability to provide higher quality (because of economies of scale and scope);
4. Enhanced customer awareness and loyalty due to the interactionof three forces: global availability, serviceability and recognition;
5. Increased competitive leverage over competitors by globalcompanies bringing resources of the worldwide network to bear onthe competitive situation in individual countries;
Copyright: Professor John Saee 2011
8/6/2019 Seminar on Global Economy
http://slidepdf.com/reader/full/seminar-on-global-economy 15/42
6. Greater access to human skills and knowledge, because globalcompanies can access the best people in the world, irrespective of nationality;
7. Increased access to financial resources and capital, including morefrequent access to a variety of world stock exchanges;
8. Increased availability of information resources is often the competitive edge;
9. Longer and more diversified use of equipment and technology, which includes flexible manufacturing using Computer AssistedDesign and Manufacturing (CAD/CAM). Communication technologyis initially expensive, but has little or no maintenance costs after
installation;
10. Broader customer base, so global companies do not rely too heavilyon one market, such as the original domestic market;
4. Sources of Motivations Behind the
Globalization: A Micro-level of Analysis
Copyright: Professor John Saee 2011

8/6/2019 Seminar on Global Economy
http://slidepdf.com/reader/full/seminar-on-global-economy 16/42
11. Geographic flexibility gives choices regarding market and factorysites;
12. Bargaining power becomes enhanced because of the ability to switchproduction between a variety of manufacturing sites;
13. Cultural synergies mean that cultural diversity is seen as a major
source of innovative ideas;14. Enhanced image and reputation comes from public perception that
global companies “must have” better products and services;
15. Opportunities for alliances and partnerships occur because greaterchoices are available; and
16. Power as a global learning organization is closely tied in with thebusiness goals of the company.
4. Sources of Motivations Behind the
Globalization: A Micro-level of Analysis
Copyright: Professor John Saee 2011

8/6/2019 Seminar on Global Economy
http://slidepdf.com/reader/full/seminar-on-global-economy 17/42
5. Changing Demographics of the GlobalEconomy: Facts and Figures
The importance of international business has changed dramatically overtime:
• The volume of cross-border trade and foreign investment havegrown more rapidly than the global output.
•Large MNC play increasingly important role in the world economy.
• National economies are becoming more closely integrated into a
single, interdependent, global economic system.
In their drive to expand activities across borders companies areconstantly forced to choose between:
Foreign trade in goods and services,
Foreign investment,
Strategic alliances.
Copyright: Professor John Saee 2011

8/6/2019 Seminar on Global Economy
http://slidepdf.com/reader/full/seminar-on-global-economy 18/42
5.1 Globalization waves in the 19th and 20th
century
Table 1: Globalization waves in the 19th and 20th century(Percentage change unless indicated otherwise). a Refers to period 1870-1913.Source: Maddison (2001), Lewis (1981), UNCTAD (2007), WTO (2007a).
•Globalization has not been a smooth process: periods of acceleratedintegration (as observed in the 19th century and in the second half of the20th century) and periods of dramatic reversals (as in the inter-warperiod) sometimes with costly consequences.
• Two most recent episodes of globalization: increased integration in
trade, capital flows and movement of labor.Copyright: Professor John Saee 2011

8/6/2019 Seminar on Global Economy
http://slidepdf.com/reader/full/seminar-on-global-economy 19/42
• 1950-73 period: long period of record expansion with worldmerchandise exports rising by more than 8 % per annum in realterms. Trade growth slowed thereafter (impact of two oil price shocks,burst of inflation).
• In the 1990s: trade expanded again more rapidly, partly driven byinnovations in the IT sector.
• 1950-2007 period: trade expanded on average by 6.2 %, which ismuch stronger than in the first wave of globalization from 1850 to1913.
• Foreign trade in goods and services has since the 2nd World War,expanded at nearly double pace of world real GDP. As a result thevolume of world trade in goods and services (the sum of both exportsand imports) rose from barely one-tenth of world GDP in 1950 toabout one-third of world GDP in 2000.
• Trade in goods and services is approaching $9 trillion. With worldGDP $30 trillion, it means that nearly one quarter of everythingproduced in the world is exported (Saee, 2005).
5.1 Globalization waves in the 19th and 20th
century
Copyright: Professor John Saee 2011

8/6/2019 Seminar on Global Economy
http://slidepdf.com/reader/full/seminar-on-global-economy 20/42

8/6/2019 Seminar on Global Economy
http://slidepdf.com/reader/full/seminar-on-global-economy 21/42
• The most dynamic traders in the 1950-73 period were the west
European countries and Japan.
• From the 1950s onwards: European integration sustained theexpansion of intra-European trade. The share of intra-west Europeantrade in world trade rose from 18.3 % in 1953 to 31.2 % in 1973 while extraregional trade expanded somewhat less than global trade.
• In the early 1960s the United States was still by far the world`sdominant industrial power. (In 1963, for example, the United Statesaccounted for 40.3 % of world output, by 1997 only for 20.8 %.).However, the dominant share of the United States in world trade waseroded in subsequent decades.
• In 1993, after the disintegration of the Soviet Union and the demiseof the Council of Mutual Economic Assistance (CMEA) industrialcountries’ (i.e. western Europe, North America and Japan) share of
world merchandise exports reached a peak, in excess of 70 % Together with the six newly industrialized economies (NIEs), theyaccounted for more than 80 % of world trade in 1993.
5.2 Foreign trade in goods and services
Copyright: Professor John Saee 2011
8/6/2019 Seminar on Global Economy
http://slidepdf.com/reader/full/seminar-on-global-economy 22/42
• In the 1990s, Japan’s share in world exports started to shrink
significantly owing to the competitive pressure exerted by the NIEsand China.
• According to the statistics released by the World Trade Organizationand the United Nations, the volume of world trade has grownconsistently faster than the volume of world output since 1950.
• China more than tripled its share in world exports between 1990 and2007 and is about to become the number one merchandise exporter.
• Direction of Trade:Developed nations trade primarily with other developed nations andso do the developing nations.
• Trends: developed countries, especially USA and Japan, increasinglytrade with developing nations, developing nations increasingly trade with each other.
5.2 Foreign trade in goods and services
Copyright: Professor John Saee 2011
8/6/2019 Seminar on Global Economy
http://slidepdf.com/reader/full/seminar-on-global-economy 23/42
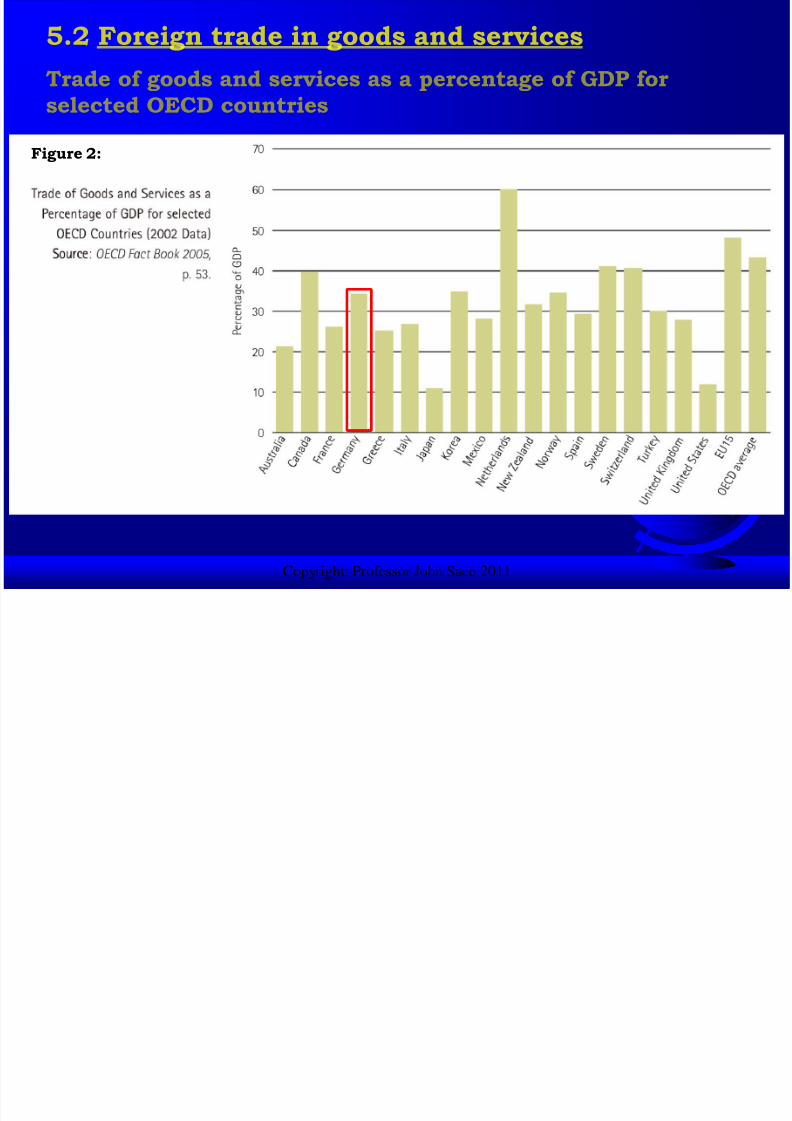
Figure 2:
5.2 Foreign trade in goods and services
Trade of goods and services as a percentage of GDP forselected OECD countries
Copyright: Professor John Saee 2011
8/6/2019 Seminar on Global Economy
http://slidepdf.com/reader/full/seminar-on-global-economy 24/42
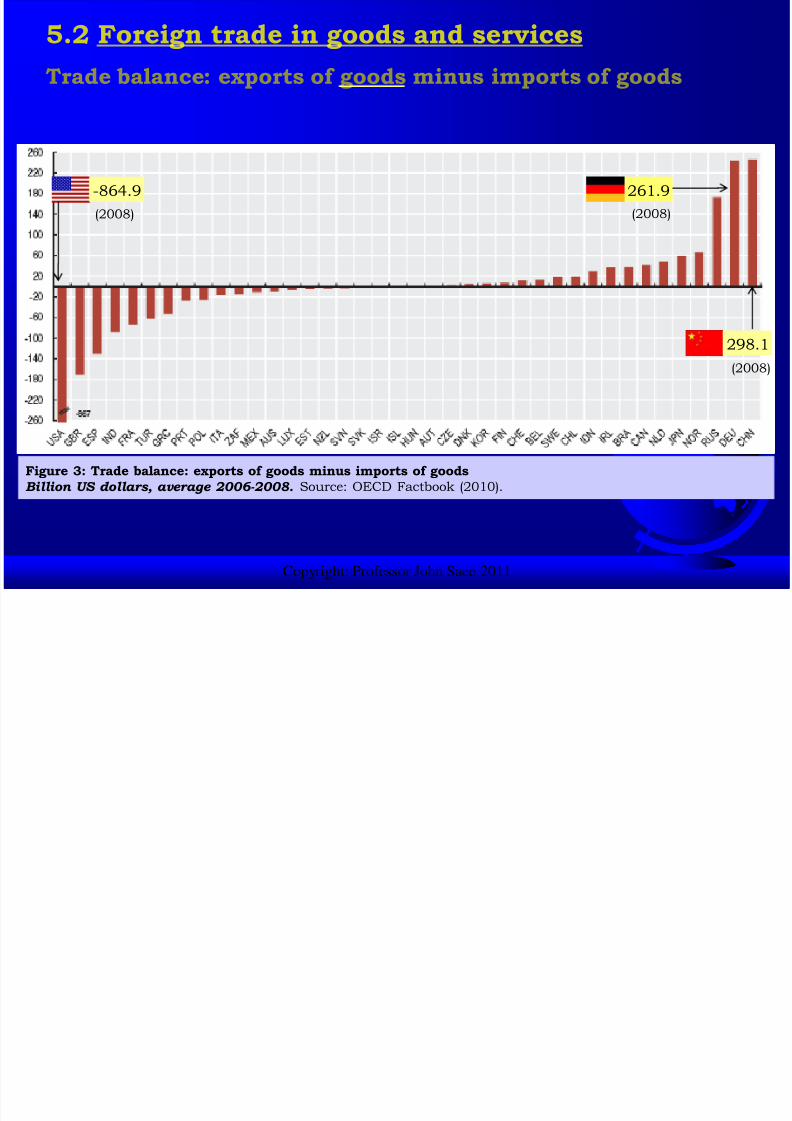
Figure 3: Trade balance: exports of goods minus imports of goodsBillion US dollars, average 2006-2008. Source: OECD Factbook (2010).
5.2 Foreign trade in goods and services
Trade balance: exports of goods minus imports of goods
261.9
(2008)
-864.9
(2008)
298.1
(2008)
Copyright: Professor John Saee 2011

8/6/2019 Seminar on Global Economy
http://slidepdf.com/reader/full/seminar-on-global-economy 25/42

8/6/2019 Seminar on Global Economy
http://slidepdf.com/reader/full/seminar-on-global-economy 26/42
Figure 5: Services trade balance: exports of services minus imports of servicesBillion US dollars, average 2006-2008. Source: OECD Factbook (2010).
5.2 Foreign trade in goods and services
Services trade balance: exports of services minus imports of services
-40.9
(2008)
144.3
(2008)
-11.8(2008)
Copyright: Professor John Saee 2011

8/6/2019 Seminar on Global Economy
http://slidepdf.com/reader/full/seminar-on-global-economy 27/42
Figure 6: Relative annual growth of imports of servicesGrowth over the period 1998-2008, OECD total = 1.0. Source: OECD Factbook (2010).
5.2 Foreign trade in goods and services
Relative annual growth of imports of services
Copyright: Professor John Saee 2011

8/6/2019 Seminar on Global Economy
http://slidepdf.com/reader/full/seminar-on-global-economy 28/42
Figure 7: The evolution of policy approaches towards foreignInvestment. Source: UNCTAD (2010).
5.3 Foreign direct investment
Evolving trends in investment policies
Copyright: Professor John Saee 2011

8/6/2019 Seminar on Global Economy
http://slidepdf.com/reader/full/seminar-on-global-economy 29/42
• 1991-1994: 94% of the 1035 changes worldwide in the laws
governing foreign direct investment created a more favorableframework for FDI. Complementing the more welcoming nationalFDI regimes, the number of bilateral investment treaties - concludedincreasingly also between developing countries – has risen from 181at the end of 1980 to 1856 at the end of 1999. Furthermore, doubletaxation treaties have also increased from 719 in 1980 to 1982 at theend of 1990.
• Financial liberalization came last, starting in the early 1980s. Thishad two dimensions: the deregulation of the domestic financialsector in the industrialized countries and the introduction of convertibility on capital account in the balance of payments. The
latter was not simultaneous. The United States, Canada, Germanyand Switzerland removed restrictions on capital movements in 1973,Britain in 1979, Japan in 1980, while France and Italy made thetransition as late as 1990. The globalization of finance, movingforward at a scorching pace since the mid-1980s, is not unrelated tothe dismantling of regulations and controls.
5.3 Foreign direct investment
Evolving trends in investment policies
Copyright: Professor John Saee 2011

8/6/2019 Seminar on Global Economy
http://slidepdf.com/reader/full/seminar-on-global-economy 30/42
Clear trends (Figure 7):
• The 1950s – 1970s focused on State-led growth and the 1980s – early2000s focused on Market-led growth.
• Recent dichotomy in policy directions: simultaneous moves tofurther liberalize investment regimes and promote foreign investmentin response to intensified competition for FDI, on the one hand, and
to regulate FDI in pursuit of public policy objectives, on the other.
• Today’s dichotomy results from a rebalancing of public and privateinterests in pursuit of market-harnessing development, withgovernments putting in place policies and mechanisms whichenable and incentivize, as well as regulate market actors to better
meet development objectives.• Multiple global crises (e.g. financial, food, energy, climate change)
have reinforced calls for better regulation of the economy –
including foreign investment – that has further spurred a series of international and domestic reform processes. Most prominent areregulatory changes in the financial sector.
5.3 Foreign direct investment
Evolving trends in investment policies
Copyright: Professor John Saee 2011

8/6/2019 Seminar on Global Economy
http://slidepdf.com/reader/full/seminar-on-global-economy 31/42
• Volume of FDI
inflows: Globalinflows are expectedto pick up to over$1.2 trillion in 2010,rise further to $1.3-1.5 trillion in 2011,and head towards$1.6-2 trillion in
2012. Figure 8: FDI inflows, globally and by groups of economies,1980-2009 (Billions of dollars). Source: UNCTAD statistics (2010).
• FDI inflows plummeted in 2009 in all three major groupings – developed, developing andtransition economies. Following their 2008 decline, FDI flows to developed countries
further contracted by 44 % in 2009. Developing and transition economies, whichproved relatively immune to the global turmoil in 2008, were not spared in 2009 but didbetter than developed countries. After six years of uninterrupted growth, FDI flows to
developing countries declined by 24 % in 2009.
• The recovery of FDI inflows in 2010 – if modest in global terms – is expected to be strongerin developing countries than in developed ones. The shift in foreign investment inflowstowards developing and transition economies is expected to accelerate (due to theseeconomies’ growth and reform, as well as their increased openness to FDI andinternational production). Developing and transition economies now account for nearly
half of global FDI inflows.
5.3 Foreign direct investment
FDI inflows, globally and by groups of economies
Copyright: Professor John Saee 2011

8/6/2019 Seminar on Global Economy
http://slidepdf.com/reader/full/seminar-on-global-economy 32/42
Figure 9: Inflows of foreign direct investment (Billion US dollars). Source: OECD Factbook (2010).
319.7
(2008)
24.9
(2008)
147.8
(2008)
5.3 Foreign direct investment
Inflows of foreign direct investment
Copyright: Professor John Saee 2011

8/6/2019 Seminar on Global Economy
http://slidepdf.com/reader/full/seminar-on-global-economy 33/42
• Industrialized nations invest primarily in other industrializednations just as they trade more with them.
• However, global rankings of the largest FDI recipients confirmthe emergence of developing and transition economies: threedeveloping and transition economies ranked among the
six largest foreign investment recipients in the world in2009.
• China was the second most popular destination (China hasreceived the greatest volume of inward FDI in recent years).While the United States maintained its position as the largest
host country in 2009.
5.3 Foreign direct investment
Inflows of foreign direct investment
Copyright: Professor John Saee 2011

8/6/2019 Seminar on Global Economy
http://slidepdf.com/reader/full/seminar-on-global-economy 34/42
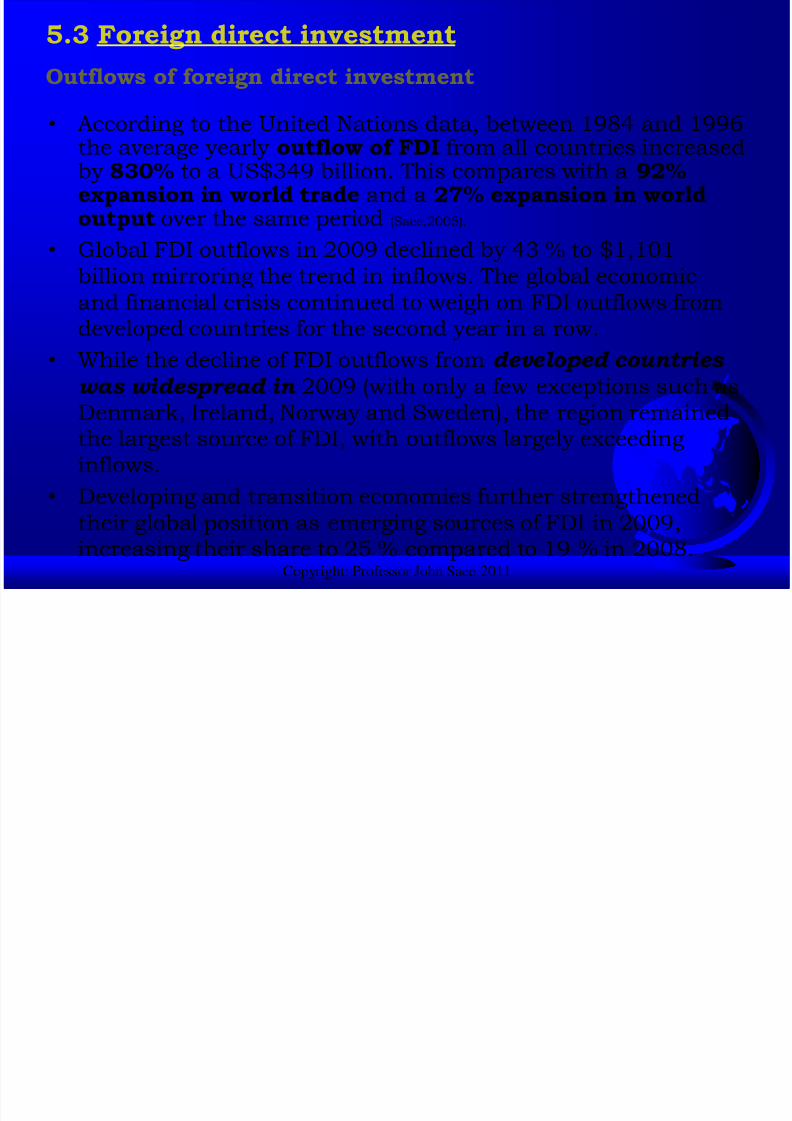
Figure 10: Outflows of foreign direct investment (Billion US dollars). Source: OECD Factbook (2010).
156.1
(2008)
53.5(2008)
332.0
(2008)
5.3 Foreign direct investment
Outflows of foreign direct investment
Copyright: Professor John Saee 2011
8/6/2019 Seminar on Global Economy
http://slidepdf.com/reader/full/seminar-on-global-economy 35/42
i di i

8/6/2019 Seminar on Global Economy
http://slidepdf.com/reader/full/seminar-on-global-economy 36/42
Table 2: Number of cross-border M&As and greenfield investment cases, by hostregion/economy, 2007 – 2010a (Percent).
5.3 Foreign direct investment
Number of cross-border M&As and greenfield investmentcases by host region/economy
Copyright: Professor John Saee 2011
5 3 i di i
8/6/2019 Seminar on Global Economy
http://slidepdf.com/reader/full/seminar-on-global-economy 37/42
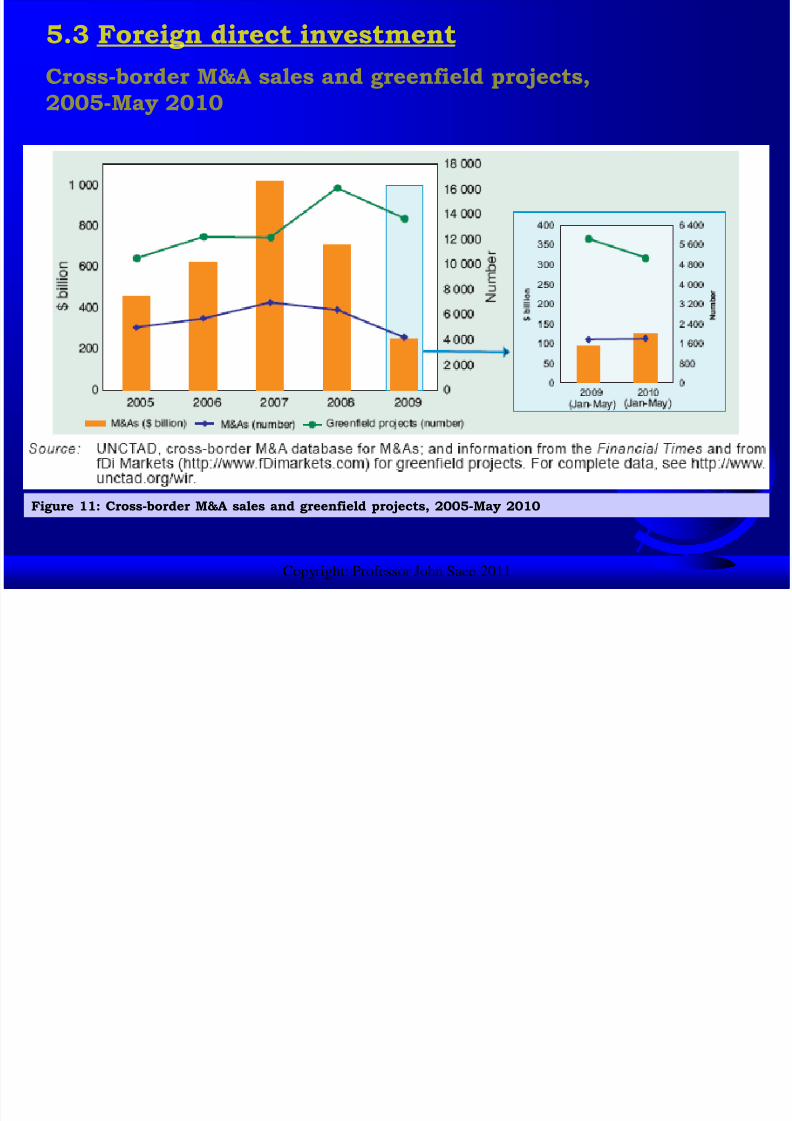
Figure 11: Cross-border M&A sales and greenfield projects, 2005-May 2010
5.3 Foreign direct investment
Cross-border M&A sales and greenfield projects,2005-May 2010
Copyright: Professor John Saee 2011
5 3 i di i

8/6/2019 Seminar on Global Economy
http://slidepdf.com/reader/full/seminar-on-global-economy 38/42
• The collapse of financial markets has curtailed companies` financing of
M&As. Banks and financial institutions have often been unable orunwilling to finance acquisitions. Moreover, the collapse of stockmarkets has reduced – and in some cases eliminated entirely – theability of companies to raise equity capital.
• Most of the drop in FDI in 2008 and 2009 was due to a substantialdecrease in M&A deals rather than greenfield operations. The number of
cross-border M&A transactions declined by 34 % (65 % in terms of value), compared with a 15 % decline in greenfield projects.
• However, this may not signal a long-term reversal of the preference forM&As as the dominant mode of FDI, which has been observed over thepast two decades or so, particularly in developed countries.
•
The rise of developing countries as FDI destinations is also likely to weigh on the choice between greenfield projects and M&As, asdeveloping-country firms become more attractive targets for acquisitions.
• The data available for the beginning of 2010 indeed indicate a moredynamic growth in M&As than in greenfield investments.
5.3 Foreign direct investment
Modes of Entry: M&As and greenfield investments
Copyright: Professor John Saee 2011
5 4 MNC ` i fl i th l b l

8/6/2019 Seminar on Global Economy
http://slidepdf.com/reader/full/seminar-on-global-economy 39/42
5.4 MNCs` influence in the global economy
• There are 63,000 MNCs with around 700,000 foreign
affiliates in the world today (Saee, 2005).
• They control close to 52% of world resources, account for40% of the world’s manufacturing and 25% of world’strade.
• 500 largest MNCs account for $ 14 trillion of total salesrevenue and they also represent 90% of the world’s stockof FDI.
• The national composition of the largest multinationals.
• Industries dominated by MNCs.
• Less than 30 countries in the world have GDPexceeding total revenues of Exxon (Saee, 2007).
Copyright: Professor John Saee 2011
5 4 MNC ` i fl i th l b l
8/6/2019 Seminar on Global Economy
http://slidepdf.com/reader/full/seminar-on-global-economy 40/42
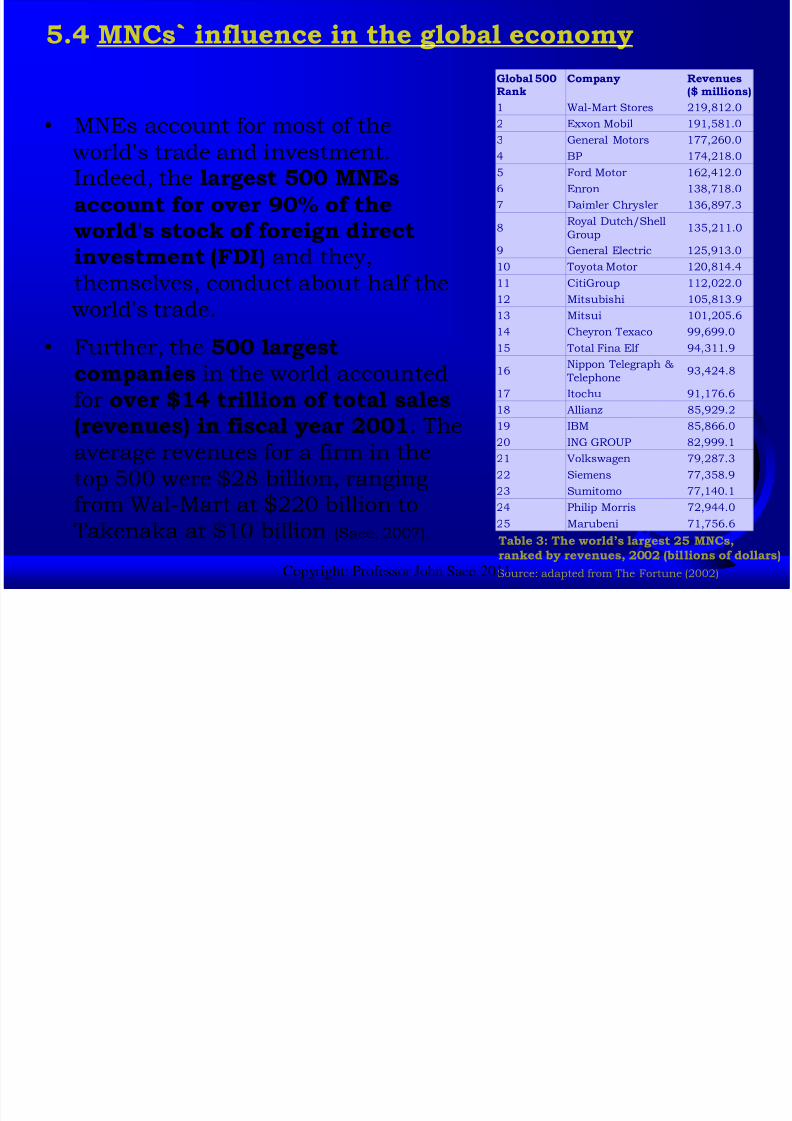
• MNEs account for most of the
world's trade and investment.Indeed, the largest 500 MNEsaccount for over 90% of theworld's stock of foreign directinvestment (FDI) and they,
themselves, conduct about half the world's trade.
• Further, the 500 largestcompanies in the world accountedfor over $14 trillion of total sales
(revenues) in fiscal year 2001. Theaverage revenues for a firm in thetop 500 were $28 billion, rangingfrom Wal-Mart at $220 billion to
Takenaka at $10 billion (Saee, 2007).
Global 500Rank
Company Revenues($ millions)
1 Wal-Mart Stores 219,812.0
2 Exxon Mobil 191,581.0
3 General Motors 177,260.04 BP 174,218.0
5 Ford Motor 162,412.0
6 Enron 138,718.0
7 Daimler Chrysler 136,897.3
8Royal Dutch/ShellGroup
135,211.0
9 General Electric 125,913.0
10 Toyota Motor 120,814.4
11 CitiGroup 112,022.012 Mitsubishi 105,813.9
13 Mitsui 101,205.6
14 Cheyron Texaco 99,699.0
15 Total Fina Elf 94,311.9
16Nippon Telegraph & Telephone
93,424.8
17 Itochu 91,176.6
18 Allianz 85,929.2
19 IBM 85,866.0
20 ING GROUP 82,999.1
21 Volkswagen 79,287.3
22 Siemens 77,358.9
23 Sumitomo 77,140.1
24 Philip Morris 72,944.0
25 Marubeni 71,756.6
Source: adapted from The Fortune (2002)
Table 3: The world’s largest 25 MNCs,
ranked by revenues, 2002 (billions of dollars)
5.4 MNCs` influence in the global economy
Copyright: Professor John Saee 2011
5 4 MNC ` i fl i th l b l
8/6/2019 Seminar on Global Economy
http://slidepdf.com/reader/full/seminar-on-global-economy 41/42
• Largest MNEs are as large as (and perhaps more influentialthan) mid-sized countries:
– Exxon Mobil value-added 2003: $72 billion
– GDP of Chile in 2003: $72 billion
• Some industries completely dominated by MNEs:
85% of all automobiles, 70% of all computers manufacturedand sold by MNEs (Saee, 2007).
• Since the 1960s, there have been two notable trends in thedemographics of the multinational enterprise:
(1) the rise of non-US multinationals, particularly Japanesemultinationals,
(2) the growth of mini-multinationals.
5.4 MNCs` influence in the global economy
Copyright: Professor John Saee 2011
6 Globali ation:

8/6/2019 Seminar on Global Economy
http://slidepdf.com/reader/full/seminar-on-global-economy 42/42
6. Globalization:Prosperity or Impoverishment?
• Impact of trade barrier removal on jobs and incomes?
Do jobs move away from wealthy advanced economies insearch of lower wage rates?
When a country embraces free trade there is always somedislocation – lost jobs – but the whole economy is better off!
• Impact of trade liberalization on labor policies and theenvironment
Do manufacturing facilities move to developing countrieswith weaker labor laws and environmental protection?
Or, do tougher environmental regulations and stricter labor
standards go hand and hand with economic progress?
• Impact on national sovereignty; losing power to theSupranational organizations
WTO, EU, UN: supplanting national governments?