Seismic Strengthening Method Using Exterior Wall · PDF fileSEISMIC STRENGTHENING METHOD WITH...
13
13 th World Conference on Earthquake Engineering Vancouver, B.C., Canada August 1-6, 2004 Paper No. 741 SEISMIC STRENGTHENING METHOD WITH EXTERIOR CONCRETE MEMBER INCLUDED STEEL PLATE Yuriko HATTORI 1 , Yasutoshi YAMAMOTO 2 , Tadaki KOH 3 SUMMARY This paper focuses on a new technique based on exterior retrofit installation to middle-rise buildings. An improved method of seismic strengthening of existing R/C buildings using reinforced exterior members has been developed in the past study. Addition of exterior reinforced concrete unit is called concrete member included plate (CMIP) which is a new method of seismic rehabilitation. This method shortens the construction period and allows residents to continue living during under construction. CMIP improves significant lateral stiffness, strength, overall ductility and energy dissipation capacity. The obvious effectiveness proves its applicability in the seismic retrofit design of R/C frame structures. Selected results are herein summarized in order to underline different parameters which influenced the behavior of the strength and/or failure mode. Experimental results are presented and discussed. INTRODUCTION In the aftermath of a destructive Hyogo-ken Nanbu earthquake in Japan, there is increased awareness for the need to evaluate and improve seismic performance of existing R/C buildings. Many R/C apartment buildings in 60s and 70s need seismic structural upgrade in order to match the minimum requirements of presented building codes[1]. Generally, the column with wing wall represents the critical and brittle elements of the seismic design which proved by past earthquake lessons. However, retrofitting of wing wall becomes effective member for the strength-resistant failure mechanism. To investigate use of wing walls as a seismic retrofit measure to prevent brittle column failure, one third of actual scale model of test programs were built and tested. The test program consists of three different specimens, which are existing typical R/C frame of one span and two stories model specimen of [B1] and seismic strengthened with CMIP specimens of [B2] and [B3]. Two cases of strengthening with CMIP are designed. The difference among the strengthened specimens relate to the level of strengthening which design to verify expected steps of the strength hierarchy. The performances of strengthened specimens are compared with the existing R/C frame specimen. The effectiveness of strengthened pattern on hysteresis response is discussed. Based on these experimental 1 Hattori Sekkei Engineering, Inc., Saitama, Japan, [email protected] 2 Dept. of Architecture, Shibaura Institute of Technology, Tokyo, Japan, [email protected] 3 Graduate School of Science and Technology, Meiji University, Tokyo, Japan, [email protected]
Transcript of Seismic Strengthening Method Using Exterior Wall · PDF fileSEISMIC STRENGTHENING METHOD WITH...

13th World Conference on Earthquake Engineering Vancouver, B.C., Canada
August 1-6, 2004 Paper No. 741
SEISMIC STRENGTHENING METHOD WITH EXTERIOR CONCRETE MEMBER INCLUDED STEEL PLATE
Yuriko HATTORI 1, Yasutoshi YAMAMOTO 2, Tadaki KOH 3
SUMMARY This paper focuses on a new technique based on exterior retrofit installation to middle-rise buildings. An improved method of seismic strengthening of existing R/C buildings using reinforced exterior members has been developed in the past study. Addition of exterior reinforced concrete unit is called concrete member included plate (CMIP) which is a new method of seismic rehabilitation. This method shortens the construction period and allows residents to continue living during under construction. CMIP improves significant lateral stiffness, strength, overall ductility and energy dissipation capacity. The obvious effectiveness proves its applicability in the seismic retrofit design of R/C frame structures. Selected results are herein summarized in order to underline different parameters which influenced the behavior of the strength and/or failure mode. Experimental results are presented and discussed.
INTRODUCTION In the aftermath of a destructive Hyogo-ken Nanbu earthquake in Japan, there is increased awareness for the need to evaluate and improve seismic performance of existing R/C buildings. Many R/C apartment buildings in 60s and 70s need seismic structural upgrade in order to match the minimum requirements of presented building codes[1]. Generally, the column with wing wall represents the critical and brittle elements of the seismic design which proved by past earthquake lessons. However, retrofitting of wing wall becomes effective member for the strength-resistant failure mechanism. To investigate use of wing walls as a seismic retrofit measure to prevent brittle column failure, one third of actual scale model of test programs were built and tested. The test program consists of three different specimens, which are existing typical R/C frame of one span and two stories model specimen of [B1] and seismic strengthened with CMIP specimens of [B2] and [B3]. Two cases of strengthening with CMIP are designed. The difference among the strengthened specimens relate to the level of strengthening which design to verify expected steps of the strength hierarchy. The performances of strengthened specimens are compared with the existing R/C frame specimen. The effectiveness of strengthened pattern on hysteresis response is discussed. Based on these experimental
1 Hattori Sekkei Engineering, Inc., Saitama, Japan, [email protected] 2 Dept. of Architecture, Shibaura Institute of Technology, Tokyo, Japan, [email protected] 3 Graduate School of Science and Technology, Meiji University, Tokyo, Japan, [email protected]

results and analytical studies, this paper explores the beneficial effects of seismic behavior of the column with wing wall seismic retrofitted by CMIP technique.
1. TEST PROGRAM 1.1. Specimen Detail In choosing the dimensions of the specimen, typical frame and geometrical ratios were taken in account even though some scaling was adopted to maintain the specimen size and weight to a manageable level. The specimen’s cross sections and the steel reinforcement used are shown in following figures. The model of existing R/C specimen design was carried out before the recommendation of a building code of 1981 as the representative of a larger number of existing apartment buildings. (1) Specimen [B-1] Frame model scaled to one third of actual scale of R/C frame structure with a span of 2000mm, and a story height of 900mm. column section with 200mm square with 50mm thickness wall with 300mm width, which column the longitudinal reinforcement consists of 3-16φ(pt=0.965%), the hoop consists of 2-4φ and the equal spacing of100mm(volumetric hoop ratio pw=0.101%),which wall the longitudinal and vertical reinforcement consists of 4φ(ps=0.251%), which opening the surrounding bar consists of 1-6φ, the
Fig.1 Existing R/C frame geometric dimensions
Shear loading
1FL
2FL
835
2,870
1,135
900
3,000
500
500
2,000
l0=450
h0=350
a)Specimen[B-1] b)Column section
3,020
335
335
250
350
350
300
150 150
50
500
200
200
500
50
300
50
150
300
300
150 150
Hoop: φ4-100@(SWM)
Bar:3-φ16(SR235)
Surrounding bar
Transverse reinforcement :φ4-100@(SWM)
200 300
50
l’=500
200
150
c)Column with wingwall section
Surrounding bar
Transverse reinforcement
50
l=300
:φ4-100@ (SWM)
:1-φ6(SWM)
d)Wall section
Stirrup
: φ4-100@(SWM)
Surrounding bar
Bar:3-φ19(SR235)
150
200
50
550
300
250
:1-φ6(SWM)
e)Spamdrel section

spandrel wall with 50mm thickness and 300mm height, the window opening with h0・l 0=350×450.The shear span ratio h0/(2l')=0.35, the center wall between openings tw・l =50×300(h0/(2l)=0.58). The details are shown in Fig.1 c)-e). (2) Specimen [B-2] CMIP retrofitted specimen [B-2] is shown in Fig.2. The strengthened area by CMIP is shown in Fig.4. Seismic strengthened specimen with CMIP is described in the following ways; both column with wing wall are strengthened with added CMIP installed anchor bolts in which contains plate (PL-1.6) welded with flange (PL-6) and stiffener (PL-3.2), while injected mortar of 10mm thickness to unite both members. The trowel mortar of 40 mm thicknesses was finished. Bonded steel anchor D13 was used for joint. A headed anchor with a nut embedded in finished mortar of 40mm thickness goes through the hole into the plate. The effective embedment length was le=35(=2.69da) with flat bottom owing to thin wall of 50mm thickness, le =130(=10 da) for columns and beams, under cutting with 45 degree. (3) Specimen [B-3] Specimen [B-3] is shown in Fig.3 and Fig.4. Installation method is the same way as specimen [B2] except for full surface with CMIP retrofitted.
a)Column with CMIP section
Fig.4 CMIP retrofitted member geometric dimensions
b)Spandrel section
Fig.3 [B-3] geometric dimensions Fig.2 [B-2] geometric dimensions
a)Existing frame b)CMIP
300
30
350
2,050
500
300
350
250
250
250
20
Welded mesh CL
:φ4-@100
a)Existing frame b)CMIP
90
200
125
150
50
300
55
105
75
450
@100
c)Column section
500
200 150
150
200
50 50
Stiffener:PL3.2(SS400)
Web:PL1.6(SS400)
Wire mesh : φ4-100@ (SWM)
Anchor:D13(SD345)
Flange:PL3.2(SS400)
300 250
550
Stiffener:PL3.2(SS400)
Anchor:D13(SD345)
Wire mesh
φ4-100@(SWM)
Flange:PL3.2(SS400)
Web:PL1.6(SS400)
150
10
40
200
50
50
550
300
250

Table1 Concrete and Mortar property
Table2 Steel and plate property
2. MECHANICAL PROPERTIES OF MATERIALS 2.1. Concrete and Mortar The concrete had compressive strength less than 18N/mm2. The testing body and the base parts were cast separately. Grouting Mortar fixed embedded anchor bolts and CMIP was finished with trowel mortar. The property of concrete and mortar are shown in Table 1. Polymer cement mortar was used, it characterize low in the strength and young’s modulus but rich in the ductility.
W eight of unitvolum e
C om pressivestrength
Split tensilestrength
Elastic m odulus
γ[kN/m3] σB[N/m m
2] σSP[N/m m
2] Es×10
4[N/m m
2]
C oncrete Existing RC 21.30 15.10 1.53 2.03
C oncrete Base part 21.60 39.20 2.87 2.34
G rout m ortar Joint 18.20 16.60 2.20 1.56
Trowel m ortar CM IP surface 18.80 22.90 2.70 1.60
Designation C ondition
2.2. Steel bars and plates The properties of steel are shown in Table 2. The yield point σy was determined by using the intersection between stress-strain curve and 0.2% shifting the strain according to indefinite the value. Steel plates give low yield strength and elasticity.
Yield strength M ax. strength Elastic m odulus Elongation
σy[N/m m2] σm ax[N/m m
2] Es×10
5[N/m m
2] [%]
4φ 386.2 519.7 1.60 12.7
6φ 622.5 690.6 2.03 -
16φ 323.8 460.9 1.90 29.2
19φ 310.0 443.2 1.85 30.3
D10 457.2 662.1 2.02 18.0
D22 383.8 589.7 1.99 14.3
4φ 426.1 457.9 1.71 -
D13 438.2 635.2 2.18 -
PL-1.6 180.6 297.5 2.00 42.0
PL-3.2 235.8 333.9 1.78 41.0
PL-6 207.7 338.1 1.77 35.0
Existing m em ber
Designation C ondition
C M IP m em ber
3. TEST PROGRAM AND OBSERVATION 3.1. Loading system and test setup Test setup was the same for all specimens which are shown in Fig.5. A constant vertical load 118kN
(σN=2.94N/mm2) was applied during shear loading. The lateral load is applied by a horizontal actuator which is manually controlled, so that a variable and proportional lateral force may be applied during the test. The load cell was positioned between the hydraulic jack and the setup frame. The setup frame was restrained from rotation with two reaction poles, tied-down to the laboratory strong floor. The ductility index F value is approximately estimated by the equation of F=0.6+100R(R: story drift angle).

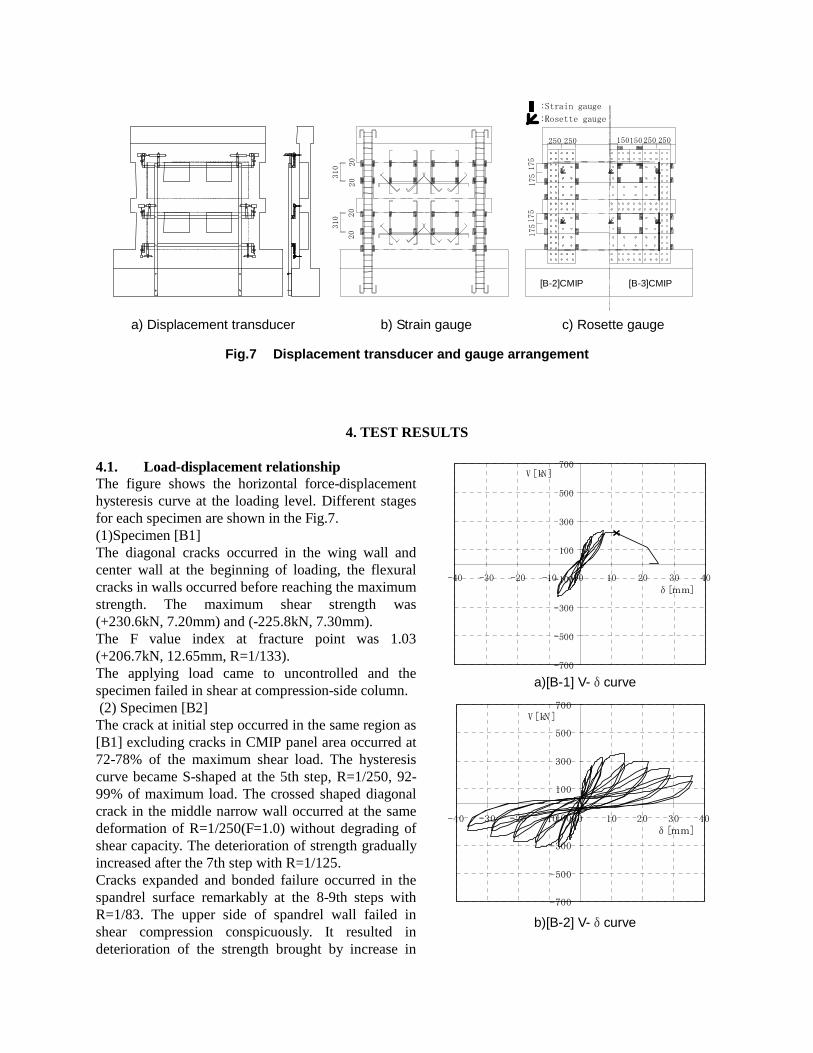
3.2. Loading arrangement The loading steps are described in Fig.6. The temporal load application recorded during the test. Each test is characterized by constant vertical load applied to the column. The lateral load was controlled by displacement at loading steps to the story drift angle R from ±1/1000 to ±1/50 until the column failure occurrence or reached the 13th step. The flexural index (F) is indicated along with values. 3.3. Displacement and strain measurement The recorded forces and displacements included those measured by the load cell and linear variable displacement transducer. Fig. 7 a) shows displacement transducer placement. The devices were installed to obtain the lateral and axial displacements of the beam column joint at the top and mid-height respectively. The strain gauge for longitudinal reinforcement and rosette gauge for steel flange arrangements are shown in Fig.7 b) and Fig. 7 c) to measure flexural stress and shear stress.
Fig.5 Test setup
Specimen
N=118kN(constant)
Hydraulic actuator
15
16
16 17
17 10
6
13 9 12 6
14
15 2 5 14 11 7 8
Universal joint
7
4
11
5
Rotation controller
12
9
1
10
8
2
5
3
Hydraulic actuator
6 7
1
8
13
3
9 12 13 10 11 15
17
12
16
18
14
4
19
2
9 10 14 8
3
7 15 11 23 1 17 13 6 2 18
1 4
4 16 3 21 28 20 24 22 29 19 5 26 27 25
3,570
3,600
2,035
2,000
Storydrift
angle
Ductilityindex
R[rad] F
Step 1 1/1000 0.7
Step 2,3 1/500 0.8
Step 4,5 1/250 1.0
Step 6,7 1/125 1.4
Step 8,9 1/83 1.8
Step 10,11 1/63 2.2
Step 12,13 1/50 2.6
Load step No.
Fig.6 Loading steps
Step
-13 -12
Final +12 +13
+3
-11
-9
-7
+1
-1
+2
-2 -3 -4 -5
-6
-8
-10
+4 +5
+6 +7
+8 +9
+10 +11
Displacement control
F δH[mm] R[rad]
1/50
0.7
1.4
1.8
2.2
2.6
1.0
0.8
1.8
14.4
21.6
28.8
36.0
7.2
3.6
1/1000
1/500
1/250
1/125
1/83
1/63
1/50
0.7
1.4
1.8
2.2
2.6
1.0
0.8
1.8
14.4
21.6
28.8
36.0
7.2
3.6
1/1000
1/500
1/250
1/125
1/83
1/63
4. TEST RESULTS
4.1. Load-displacement relationship The figure shows the horizontal force-displacement hysteresis curve at the loading level. Different stages for each specimen are shown in the Fig.7. (1)Specimen [B1] The diagonal cracks occurred in the wing wall and center wall at the beginning of loading, the flexural cracks in walls occurred before reaching the maximum strength. The maximum shear strength was (+230.6kN, 7.20mm) and (-225.8kN, 7.30mm). The F value index at fracture point was 1.03 (+206.7kN, 12.65mm, R=1/133). The applying load came to uncontrolled and the specimen failed in shear at compression-side column. (2) Specimen [B2] The crack at initial step occurred in the same region as [B1] excluding cracks in CMIP panel area occurred at 72-78% of the maximum shear load. The hysteresis curve became S-shaped at the 5th step, R=1/250, 92-99% of maximum load. The crossed shaped diagonal crack in the middle narrow wall occurred at the same deformation of R=1/250(F=1.0) without degrading of shear capacity. The deterioration of strength gradually increased after the 7th step with R=1/125. Cracks expanded and bonded failure occurred in the spandrel surface remarkably at the 8-9th steps with R=1/83. The upper side of spandrel wall failed in shear compression conspicuously. It resulted in deterioration of the strength brought by increase in
Fig.7 Displacement transducer and gauge arrangement
c) Rosette gauge b) Strain gauge a) Displacement transducer
20
20
20
310
20
310
[B-2]CMIP [B-3]CMIP
175
250
175
175
175
150 250 250 250
150
:Strain gauge
:Rosette gauge
a)[B-1] V-δcurve
b)[B-2] V-δcurve
-700
-500
-300
-100
100
300
500
700
-40 -30 -20 -10 0 10 20 30 40
δ[mm]
V[kN]
-700
-500
-300
-100
100
300
500
700
-40 -30 -20 -10 0 10 20 30 40
δ[mm]
V[kN]
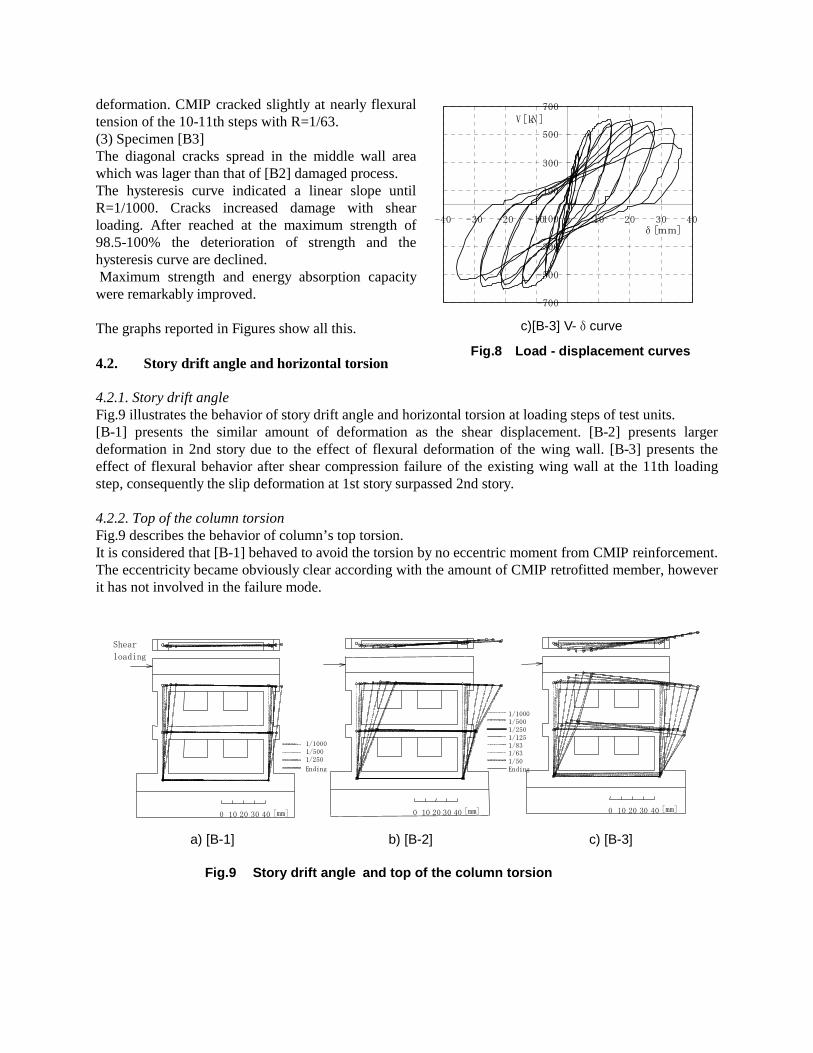
deformation. CMIP cracked slightly at nearly flexural tension of the 10-11th steps with R=1/63. (3) Specimen [B3] The diagonal cracks spread in the middle wall area which was lager than that of [B2] damaged process. The hysteresis curve indicated a linear slope until R=1/1000. Cracks increased damage with shear loading. After reached at the maximum strength of 98.5-100% the deterioration of strength and the hysteresis curve are declined. Maximum strength and energy absorption capacity were remarkably improved. The graphs reported in Figures show all this. 4.2. Story drift angle and horizontal torsion 4.2.1. Story drift angle Fig.9 illustrates the behavior of story drift angle and horizontal torsion at loading steps of test units. [B-1] presents the similar amount of deformation as the shear displacement. [B-2] presents larger deformation in 2nd story due to the effect of flexural deformation of the wing wall. [B-3] presents the effect of flexural behavior after shear compression failure of the existing wing wall at the 11th loading step, consequently the slip deformation at 1st story surpassed 2nd story. 4.2.2. Top of the column torsion Fig.9 describes the behavior of column’s top torsion. It is considered that [B-1] behaved to avoid the torsion by no eccentric moment from CMIP reinforcement. The eccentricity became obviously clear according with the amount of CMIP retrofitted member, however it has not involved in the failure mode.
Fig.8 Load - displacement curves
c)[B-3] V-δcurve
-700
-500
-300
-100
100
300
500
700
-40 -30 -20 -10 0 10 20 30 40δ[mm]
V[kN]
b) [B-2]
Fig.9 Story drift angle and top of the column torsion
c) [B-3] a) [B-1]
1/500
1/250
Ending
1/1000
20 10 0 40 30
[mm]
Shear
loading
20 10 0 40 30
[mm]
Ending
1/125
1/250
1/500
1/83
1/50
1/63
1/1000
20 10 0 40 30
[mm]

4.3. Failure process Figures illustrate final crack patterns and failure mode. (1) Specimen [B-1] Slight shear cracks have observed at R=1/500(F=0.8) without the deterioration of the strength. Increasing the crack with R value increases, the lack of confinements and shear slippage were progressed. (2) Specimen [B-2] The crossed shaped diagonal crack occurred in both front and back side at R=1/500(F=0.8). The cracks increased with approaching the maximum strength. CMIP reinforcement turned to behave as flexural deformation. After the 5th step at R=1/125(F=1.4) was the maximum strength recorded, conspicuously cracks increased in 1st story wing wall. The center wall started spalling and lost the shear capacity. Clearly the bottom wing wall at 1st story was destroyed with R=1/83(F=1.8). Subsequently, bond failure occurred in 2nd story of spandrel. Residual deformation within R=1/200 will possible to retrofit, however R=1/50(F=2.6), residual deformation over R=1/100 did remarkably decreased the strength. Therefore F value index of [B-2] was definite R=1/83(F=1.8).
Fig.11 [B-2] Final crack pattern
a)Existing member side
+ Loading
direction
b)CMIP retrofitted side
+ Loading
direction
Fig.10 [B-1] Final crack pattern
+ Loading
direction
a)Existing member side
+ Loading
direction
b)CMIP retrofitted side

(3) Specimen [B-3] Flexural and shear cracks were observed at the 1st story wing wall in tension with R=1/500(F=0.8). Expanding cracks with R value at 1/250, first cracks occurred in CMIP member and other cracks went through the stories. The frame behaved flexural yielding mode at R=1/125(F=1.4) and cracks increased. The cracks spread out at R=1/63(F=2.2), and the shear failure of wing wall under compression was showed. The column and wing wall behaved decisively shear failure at R=1/50(F=2.6). In the strengthened specimen of [B-2] and [B-3], the steel panel failure was observed before reaching the ultimate shear capacity, the ultimate column shear strength was 1.53-2.63 times of the virgin column. These results can be clearly observed in Figures. 4.4. Maximum shear strength and failure mode Table 3 presents the failure mode at the maximum shear load. However, after the ultimate state level, the response of specimen [B1] went significantly uncontrollable due to the lack of axial resistance, while specimen [B2] and [B3] were kept adequate strength until the fracture. Shear strength of CMIP contributed the shear capacity, ductility, and energy absorption to be improved.
Fig.12 [B-3] Final crack pattern
a)Existing member side
+ Loading
direction
b)CMIP retrofitted side
+ Loading
direction
Table3 Maximum load and failure mode
Ultim ate
strength
Displacem ent at
V u
Storydrift
angle atV u
Ultim atestate
levelstrength
Displacem ent at
V L
Storydrift
angle atV L
V u [kN] δu [m m ] R u [rad] V L [kN] δL [m m ] R L [rad]
+ 230.0 7.20 1/250 206.7 12.65 1/142 Shear slip at 1st story fram e
- 225.8 7.30 1/247 - - -
+ 352.6 12.48 1/144 298.9 21.72 1/83Bonded failure at 2nd story
spandrel
- 313.8 14.32 1/126 275.1 21.53 1/83Bonded failure at 2nd storyspandrel
+ 606.3 14.41 1/125 543.1 34.31 1/52Shear com pression failure at1st story bottom colum n
- 605.6 21.65 1/83 543.8 35.38 1/51Shear com pression failure at1st story bottom colum n
Failure m odeSpecim enLoadingdirection
B‐1
B‐2
B‐3

5. DISCUSSION ON TEST RESULT 5.1. Analysis of shear stress distribution for existing frame and CMIP 5.1.1. Moment curvature analysis (1)Existing R/C member Reinforced concrete analysis for axial force and bending moment is performed at the top and bottom column section to idealize the stress-strain behavior of the concrete with a rectangular stress block to simplify the calculations. The stress distribution is assumed a rectangular stress block within a distance equal to the neutral axis and a resistant force equal to the fraction of the concrete compressive strength. A unique bending moment can be calculated at this section curvature from the stress distribution. From the analysis method which calculated shear strength performance of existing R/C member is shown in Fig.13. (2) CMIP reinforcement The Shear stress of CMIP was calculated from Mohr’s circle model using strain data obtained by rosette gauge. The shear strength is accurately determined by the area of steel plate led by Tresca stress criteria.
-700
-500
-300
-100
100
300
500
700
-13 -9 -5 -1 3 7 11Loading step
V(kN)
[B -2]2F
CM IP m em ber
Existing m em ber
-700
-500
-300
-100
100
300
500
700
-13 -9 -5 -1 3 7 11
[B -2]1F
Fig.13 Comparison between theoretical value and tested shear resistance
a)Specimen [B-1]
b)Specimen [B-2]
c)Specimen [B-3]
-700
-500
-300
-100
100
300
500
700
-5 -1 3Loading step
V(kN)
Existing mem ber
Applied load
[B -1]2F
-700
-500
-300
-100
100
300
500
700
-5 -1 3
[B-1]1F
E xisting m em ber
-700
-500
-300
-100
100
300
500
700
-13 -9 -5 -1 3 7 11Loading step
V(kN)
CM IP m em ber
Existing m em ber
[B -3]2F
-700
-500
-300
-100
100
300
500
700
-13 -9 -5 -1 3 7 11
[B-3]1F
C M IP mem ber
Existing m ember

5.1.2. Determination of shear strength (1)Shear resistance calculation Fig.13 indicates shear resistance determined by moment curvature analysis which distributed by existing R/C frame member and CMIP compared with the recorded shear load. The shear load behavior roughly corresponding with the test results are verified. Approaching the final loading step, shear resistant in the existing R/C frame member was predominated in share. It means the influence of unapt application for Navier’s hypothesis. (2)Shear resistance distribution The ratio of shear strength distribution of the existing frame member and CMIP are shown in Fig.14. The shear load increased with the amount of dominant distribution ratio of CMIP. Particularly it is clearly observed at 1st story.
Fig.14 Shear force distribution value
0%
20%
40%
60%
80%
100%
-1 -3 -5 -7 -9 -11 -13
[B -2]1F(-)
0%
20%
40%
60%
80%
100%
+1 +3 +5 +7 +9 +11 +13
[B-2]1F(+)
0%
20%
40%
60%
80%
100%
-1 -3 -5 -7 -9 -11 -13
[B-2]2F(-)
0%
20%
40%
60%
80%
100%
+1 +3 +5 +7 +9 +11 +13Loading step
Existing m em ber
Shear distribution
C M IP m em ber
[B-2]2F(+)
a)[B-2]
0%
20%
40%
60%
80%
100%
-1 -3 -5 -7 -9 -11
[B-3]1F(-)
0%
20%
40%
60%
80%
100%
-1 -3 -5 -7 -9 -11
[B -3]2F(-)
0%
20%
40%
60%
80%
100%
+1 +3 +5 +7 +9 +11 +13
[B -3]1F(+)
0%
20%
40%
60%
80%
100%
+1 +3 +5 +7 +9 +11 +13
Loading step
Shear distribution
C M IP m em ber
Existing m em ber
[B-3]2F(+)
b)[B-3]

(3)Evaluation of shear resistance of existing R/C frame Fig.15 illustrates the value of shear resistant share of existing R/C frame member compared with virgin specimen and strengthened specimens. These specimens bear the similar shear capacity independent on the amount of strengthened area. The deterioration of the shear strength for [B-2] and [B-3] have not observed after surpassing the fracture value of [B-1]. Strengthened specimens maintain the shear strength after the cracks occurred in the wing wall. As the result steel anchors contribute the unity of existing and strengthened member. The shear strength distribution of CMIP member increases with the deformation. Existing R/C frame member of [B-2] and [B-3] maintain the shear strength capacity and improve the ductility. 5.2. Comparison between theoretical prediction and test result Test results confirm that the test setup works as expected and the behavior of tested specimens was consistent with the theoretical prediction. As experimentally observation, the analysis confirms that the failure mode is designed to be determined by shear slip deformation and yield of beam, unless the fracture of CMIP member. The theoretical values calculated by the diagnosis standard code in Japan[1] and safety factors are compared and shown in Table 4.
Fig.15 Shear strength contribution of existing R/C frame
-700
-500
-300
-100
100
300
500
700
-13
-11
-9 -7 -5 -3 -1 1 3 5 7 9 11 13
Loading step
B 1B 2B 3
V(kN)
-700
-500
-300
-100
100
300
500
700
-13
-11
-9 -7 -5 -3 -1 1 3 5 7 9 11 13
Loading stepB 1B 2B 3
V(kN)
a) 1st story a) 2nd story
Table 4.Comparison between theoretical prediction and test value
*1 Estimated value is given by F=0.6+100R *2 Ultimate shear strength(VSU) is given by ΣVSU=columnVSU+columnVMU+wallVSU
*3 Slip strength of punching shear column(Vslip) is given by ΣVslip=κ·τ·b·D κ: Ratio of average shear span *4 Break out anchor strength is given by top and bottom of panel anchor's resisting moment *5 Panel shear strength is given by plate formulas *6 Yielding strength of anchor is given by bottom of panel anchor’s resisting moment
Ultim atestrength
Vu/Theory
value
Ductility
index
V u [kN] Vu /V D[kN] F*1
test Shear slip 230.0 - 1.00
Ultim ate shear strength*2 268.1 0.86 1.00
Slip strength*3 223.6 1.03 0.80
test Beam shear failure 352.6 - 1.80
Beam shear failure 381.7 0.92 1.50
Shear break out strength of anchor bolt*4 328.6 1.07 -
test Flexural failure 606.3 - 2.52
Panel shear failure*5 599.3 1.01 -
Yielding strengthof anchor bolt*6 599.5 1.01 -
Specim en Value Failure m ode
theoryB‐1
B‐2theory
B‐3theory

The CMIP retrofit system was designed to yield beams in flexure prior to the column remain the shear capacity. The system showed ductile response during the test so that it assumes the column and wing wall have not fractured. The theoretical shear strength of specimen [B1] was 268.1kN and the test result was 230.0kN, the gap was modified by applying theory of shear friction. Specimen [B2] and [B3] have obtained the closer values according with the failure mode by theoretical formula.
6. CONCLUSION Results of the test program confirmed that the CMIP method promises the elastic seismic strengthening technique for wing wall in middle rise apartment buildings. In fact, CMIP member improves shear strength and ductility which proved by experimental study An important element in the design of CMIP method is the integration of the new materials with the existing materials fastened by bonded anchors. This approach has succeeded in delaying the column shear failure mechanism and shifting the beam yield failure mechanism by reduction of story drift levels. The study shows that CMIP scheme provides effective seismic resistance and identifies seismic retrofitting strategy and simplified design methodology as important areas for continued research. The goal of the project is to define a design criterion that is shear transfer mechanism through bonded steel anchors. So that, known the initial conditions and loads of CMIP and the joint anchors, it will possible to design the CMIP structural seismic upgrade which contributes the failure mode and improves the strength and ductility. The experimental research of this program continued to be developed its applicability in the seismic design of R/C frame structures by experimental study.
REFERENCES 1. Guideline for evaluation of seismic diagnosis of existing reinforced concrete buildings, Japan
Building Disaster Prevention Association, 2001 2. Y. HATTORI et al."Structural Seismic Strengthening of Columns with Wing Wall for Apartment
Buildings Part1 ", AIJ Proceedings, C-2, 2001: 745-6 3. Y.YAMAMOTO et al. "Structural Seismic Strengthening of Columns with Wing Wall for
Apartment Buildings Part2 ", AIJ Proceedings, C-2, 2001:747-8 4. M.KATO et al."Structural Seismic Strengthening of Columns with Wing Wall for Apartment
Buildings Part3 ", AIJ Proceedings, C-2,2001:749-50 5. Y.YAMAMOTO et al."Elastic Plastic analysis of Structural Seismic Strengthening of Columns with
Wing Wall using CMIP member ", JAEE Poster session, 2001. 6. Y. YAMAMOTO et al."Seismic Strengthening with Thin Additional Walls Using Special Polymer
Cement Mortar", AIJ Proceedings, 8.2003. 7. T. FUJIYAMA et al., " Structural Seismic Strengthening of Columns with Wing Wall for Apartment
Buildings Part ", AIJ Proceedings, 2002: 725-6 8. Y. YAMAMOTO et al."Structural Seismic Strengthening of Columns with Wing Wall for
Apartment Buildings Part 5 ", AIJ Proceedings, 2002:727-8 9. M. KATO et al.,"Structural Seismic Strengthening of Columns with Wing Wall for Apartment
Buildings Part 6 ", AIJ Proceedings, 2002:729-10 10. Y.YAMAMOTO et al., “Structural Seismic Strengthening of R/C Columns with Thin Wall”, 23rd
Meeting of fib SAG4”Fastening to Concrete and Masonry Structures”, Wailea Maui, 2001