Second Quarter 2021 Results - ir.charter.com
24
Second Quarter 2021 Results July 30, 2021
Transcript of Second Quarter 2021 Results - ir.charter.com
Second Quarter 2021 ResultsJuly 30, 2021
1Second Quarter 2021 Results
Cautionary Statement Regarding Forward-Looking Statements
This quarterly presentation includes forward-looking statements within the meaning of Section 27A of the Securities Act of 1933, as amended (the “Securities Act”), and Section 21E of the Exchange Act, regarding, among other things, our plans, strategies and prospects, both business and financial. Although we believe that our plans, intentions and expectations as reflected in or suggested by these forward-looking statements are reasonable, we cannot assure you that we will achieve or realize these plans, intentions or expectations. Forward-looking statements are inherently subject to risks, uncertainties and assumptions including, without limitation, the factors described under “Risk Factors” from time to time in our filings with the Securities and Exchange Commission (the “SEC”). Many of the forward-looking statements contained in this quarterly presentation may be identified by the use of forward-looking words such as “believe,” “expect,” “anticipate,” “should,” “planned,” “will,” “may,” “intend,” “estimated,” “aim,” “on track,” “target,” “opportunity,” “tentative,” “positioning,” “designed,” “create,” “predict,” “project,” “initiatives,” “seek,” “would,” “could,” “continue,” “ongoing,” “upside,” “increases,” “focused on” and “potential,” among others. Important factors that could cause actual results to differ materially from the forward-looking statements we make in this quarterly presentation are set forth in this quarterly presentation, in our annual report on Form 10-K, and in other reports or documents that we file from time to time with the SEC, and include, but are not limited to:
• our ability to sustain and grow revenues and cash flow from operations by offering video, Internet, voice, mobile, advertising and other services to residential and commercial customers, to adequately meet the customer experience demands in our service areas and to maintain and grow our customer base, particularly in the face of increasingly aggressive competition, the need for innovation and the related expenditures;
• the impact of competition from other market participants, including but not limited to incumbent telephone companies, direct broadcast satellite (“DBS”) operators, wireless broadband and telephone providers, digital subscriber line (“DSL”) providers, fiber to the home providers and providers of video content over broadband Internet connections;
• general business conditions, unemployment levels and the high level of activity in the housing sector and economic uncertainty or downturn, including the impacts of the Novel Coronavirus (“COVID-19”) pandemic to our customers, our vendors and local, state and federal governmental responses to the pandemic;
• our ability to obtain programming at reasonable prices or to raise prices to offset, in whole or in part, the effects of higher programming costs (including retransmission consents and distribution requirements);
• our ability to develop and deploy new products and technologies including mobile products and any other consumer services and service platforms;• any events that disrupt our networks, information systems or properties and impair our operating activities or our reputation;• the effects of governmental regulation on our business including subsidies to consumers, subsidies and incentives for competitors, costs, disruptions
and possible limitations on operating flexibility related to, and our ability to comply with, regulatory conditions applicable to us;• the ability to hire and retain key personnel;• our ability to procure necessary services and equipment from our vendors at reasonable costs;• the availability and access, in general, of funds to meet our debt obligations prior to or when they become due and to fund our operations and
necessary capital expenditures, either through (i) cash on hand, (ii) free cash flow, or (iii) access to the capital or credit markets; and• our ability to comply with all covenants in our indentures and credit facilities, any violation of which, if not cured in a timely manner, could trigger a
default of our other obligations under cross-default provisions.
All forward-looking statements attributable to us or any person acting on our behalf are expressly qualified in their entirety by this cautionary statement. We are under no duty or obligation to update any of the forward-looking statements after the date of this presentation.
Thomas M. RutledgeChairman and CEO, Charter Communications
3Second Quarter 2021 Results
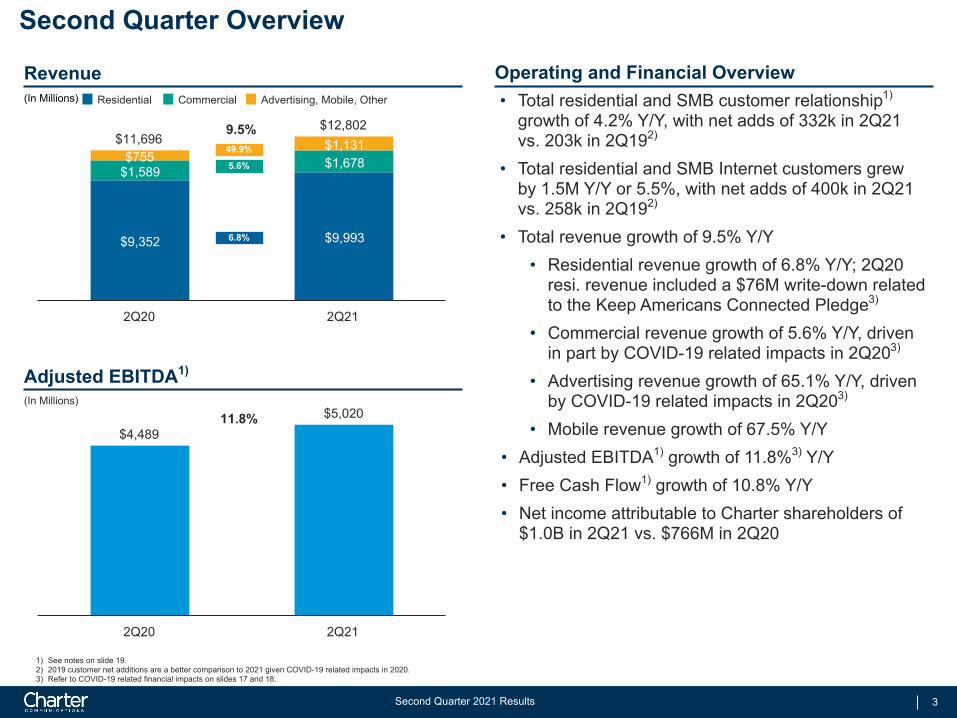
$4,489$4,489$5,020$5,020
2Q20 2Q21
$11,696$11,696$12,802$12,802
$9,352 $9,993
$1,589$1,678$755$1,131
Residential Commercial Advertising, Mobile, Other
2Q20 2Q21
Second Quarter Overview
Revenue Operating and Financial Overview
1) See notes on slide 19.2) 2019 customer net additions are a better comparison to 2021 given COVID-19 related impacts in 2020.3) Refer to COVID-19 related financial impacts on slides 17 and 18.
Adjusted EBITDA1)
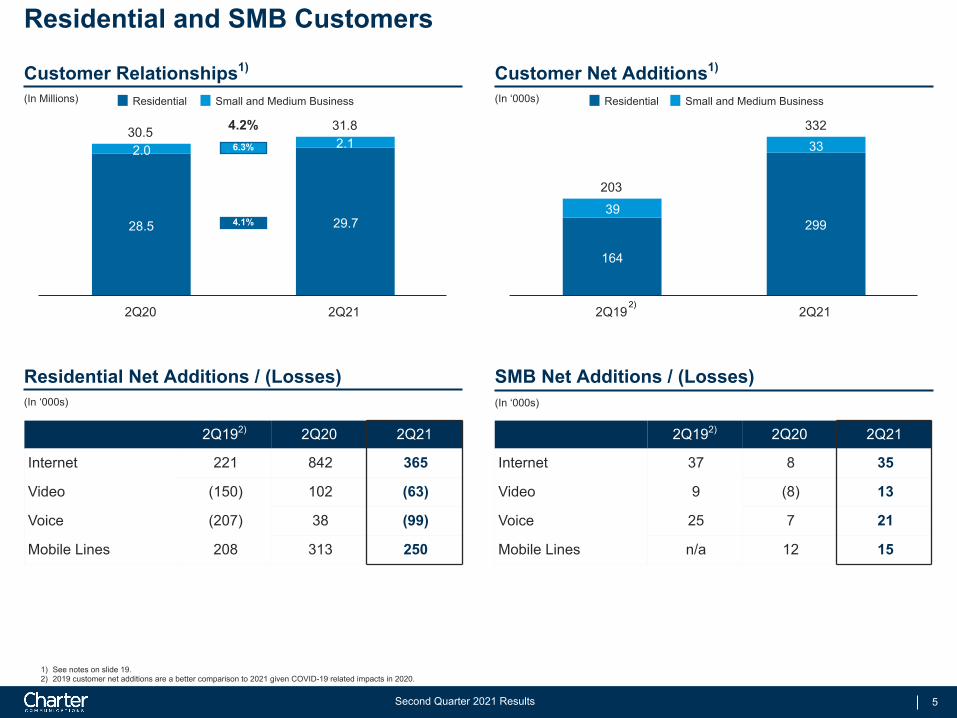
• Total residential and SMB customer relationship1) growth of 4.2% Y/Y, with net adds of 332k in 2Q21 vs. 203k in 2Q192)
• Total residential and SMB Internet customers grew by 1.5M Y/Y or 5.5%, with net adds of 400k in 2Q21 vs. 258k in 2Q192)
• Total revenue growth of 9.5% Y/Y• Residential revenue growth of 6.8% Y/Y; 2Q20
resi. revenue included a $76M write-down related to the Keep Americans Connected Pledge3)
• Commercial revenue growth of 5.6% Y/Y, driven in part by COVID-19 related impacts in 2Q203)
• Advertising revenue growth of 65.1% Y/Y, driven by COVID-19 related impacts in 2Q203)
• Mobile revenue growth of 67.5% Y/Y• Adjusted EBITDA1) growth of 11.8%3) Y/Y• Free Cash Flow1) growth of 10.8% Y/Y • Net income attributable to Charter shareholders of
$1.0B in 2Q21 vs. $766M in 2Q20
(In Millions)
6.8%
5.6%
49.9%
11.8%
(In Millions)
9.5%

Christopher L. WinfreyChief Financial Officer, Charter Communications
5Second Quarter 2021 Results
30.530.5 31.831.8
28.5 29.7
2.0 2.1
Residential Small and Medium Business
2Q20 2Q21
Residential Net Additions / (Losses)
203203
332332
164
29939
33
Residential Small and Medium Business
2Q19 2Q21
(In ‘000s)(In ‘000s)
Residential and SMB Customers
Customer Relationships1) Customer Net Additions1)
SMB Net Additions / (Losses)
(In Millions) (In ‘000s)
2Q192) 2Q20 2Q21
Internet 221 842 365
Video (150) 102 (63)
Voice (207) 38 (99)
Mobile Lines 208 313 250
2Q192) 2Q20 2Q21
Internet 37 8 35
Video 9 (8) 13
Voice 25 7 21
Mobile Lines n/a 12 15
1) See notes on slide 19.2) 2019 customer net additions are a better comparison to 2021 given COVID-19 related impacts in 2020.
4.1%
6.3%
4.2%
2)
6Second Quarter 2021 Results
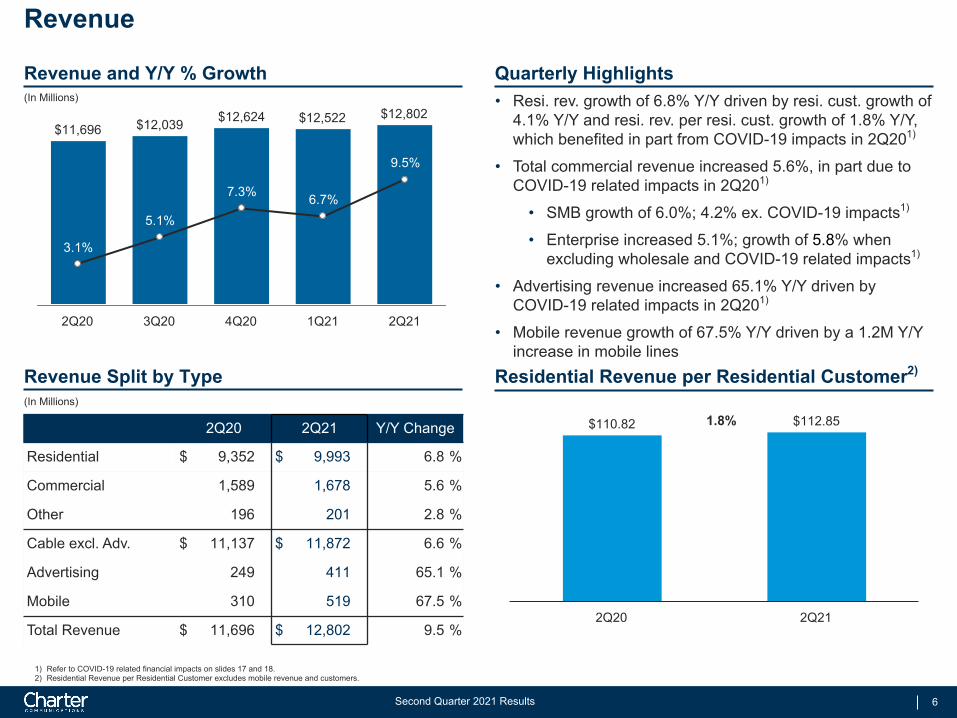
$11,696$11,696 $12,039$12,039 $12,624$12,624 $12,522$12,522 $12,802$12,802
3.1%
5.1%
7.3% 6.7%
9.5%
2Q20 3Q20 4Q20 1Q21 2Q21
Revenue
Revenue and Y/Y % Growth(In Millions)
Revenue Split by Type(In Millions)
Quarterly Highlights
Residential Revenue per Residential Customer2)
• Resi. rev. growth of 6.8% Y/Y driven by resi. cust. growth of 4.1% Y/Y and resi. rev. per resi. cust. growth of 1.8% Y/Y, which benefited in part from COVID-19 impacts in 2Q201)
• Total commercial revenue increased 5.6%, in part due to COVID-19 related impacts in 2Q201)
• SMB growth of 6.0%; 4.2% ex. COVID-19 impacts1)
• Enterprise increased 5.1%; growth of 5.8% when excluding wholesale and COVID-19 related impacts1)
• Advertising revenue increased 65.1% Y/Y driven by COVID-19 related impacts in 2Q201)
• Mobile revenue growth of 67.5% Y/Y driven by a 1.2M Y/Y increase in mobile lines
2Q20 2Q21 Y/Y Change
Residential $ 9,352 $ 9,993 6.8 %
Commercial 1,589 1,678 5.6 %
Other 196 201 2.8 %
Cable excl. Adv. $ 11,137 $ 11,872 6.6 %
Advertising 249 411 65.1 %
Mobile 310 519 67.5 %
Total Revenue $ 11,696 $ 12,802 9.5 %
1) Refer to COVID-19 related financial impacts on slides 17 and 18.2) Residential Revenue per Residential Customer excludes mobile revenue and customers.
$110.82$110.82 $112.85$112.85
2Q20 2Q21
1.8%
7Second Quarter 2021 Results
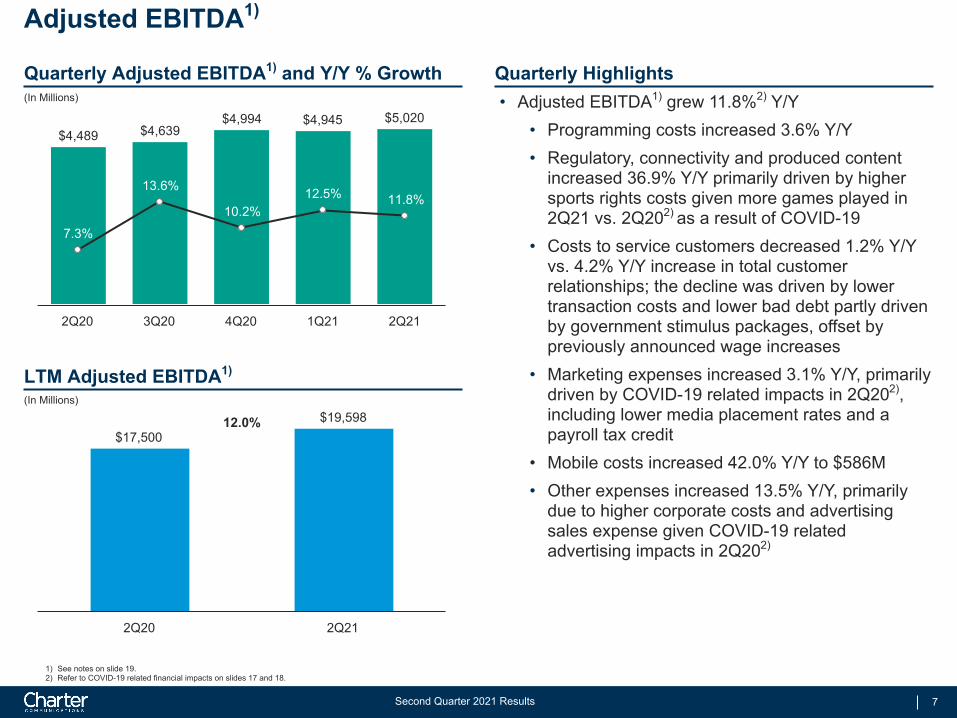
$17,500$17,500$19,598$19,598
2Q20 2Q21
$4,489$4,489 $4,639$4,639$4,994$4,994 $4,945$4,945 $5,020$5,020
7.3%
13.6%
10.2%12.5% 11.8%
2Q20 3Q20 4Q20 1Q21 2Q21
Adjusted EBITDA1)
Quarterly Adjusted EBITDA1) and Y/Y % Growth(In Millions)
LTM Adjusted EBITDA1)
(In Millions)
Quarterly Highlights• Adjusted EBITDA1) grew 11.8%2) Y/Y
• Programming costs increased 3.6% Y/Y• Regulatory, connectivity and produced content
increased 36.9% Y/Y primarily driven by higher sports rights costs given more games played in 2Q21 vs. 2Q202) as a result of COVID-19
• Costs to service customers decreased 1.2% Y/Y vs. 4.2% Y/Y increase in total customer relationships; the decline was driven by lower transaction costs and lower bad debt partly driven by government stimulus packages, offset by previously announced wage increases
• Marketing expenses increased 3.1% Y/Y, primarily driven by COVID-19 related impacts in 2Q202), including lower media placement rates and a payroll tax credit
• Mobile costs increased 42.0% Y/Y to $586M• Other expenses increased 13.5% Y/Y, primarily
due to higher corporate costs and advertising sales expense given COVID-19 related advertising impacts in 2Q202)
1) See notes on slide 19.2) Refer to COVID-19 related financial impacts on slides 17 and 18.
12.0%
8Second Quarter 2021 Results
Net Income
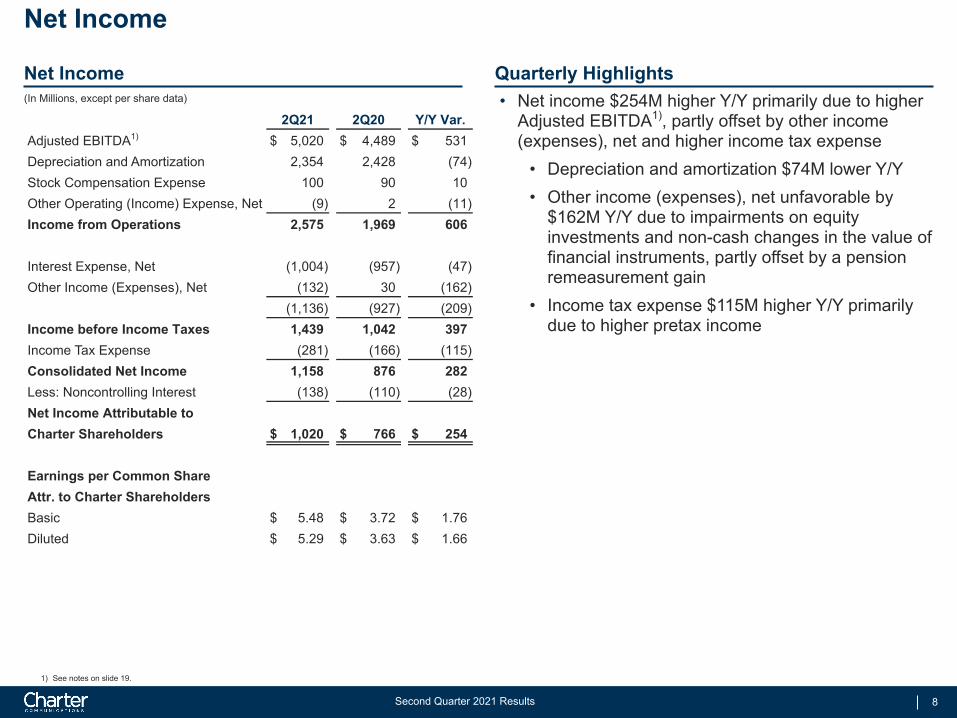
Net Income Quarterly Highlights(In Millions, except per share data) • Net income $254M higher Y/Y primarily due to higher
Adjusted EBITDA1), partly offset by other income (expenses), net and higher income tax expense
• Depreciation and amortization $74M lower Y/Y• Other income (expenses), net unfavorable by
$162M Y/Y due to impairments on equity investments and non-cash changes in the value of financial instruments, partly offset by a pension remeasurement gain
• Income tax expense $115M higher Y/Y primarily due to higher pretax income
2Q21 2Q20 Y/Y Var.Adjusted EBITDA1) $ 5,020 $ 4,489 $ 531 Depreciation and Amortization 2,354 2,428 (74) Stock Compensation Expense 100 90 10 Other Operating (Income) Expense, Net (9) 2 (11) Income from Operations 2,575 1,969 606
Interest Expense, Net (1,004) (957) (47) Other Income (Expenses), Net (132) 30 (162)
(1,136) (927) (209) Income before Income Taxes 1,439 1,042 397 Income Tax Expense (281) (166) (115) Consolidated Net Income 1,158 876 282 Less: Noncontrolling Interest (138) (110) (28) Net Income Attributable toCharter Shareholders $ 1,020 $ 766 $ 254
Earnings per Common ShareAttr. to Charter ShareholdersBasic $ 5.48 $ 3.72 $ 1.76 Diluted $ 5.29 $ 3.63 $ 1.66
1) See notes on slide 19.
9Second Quarter 2021 Results
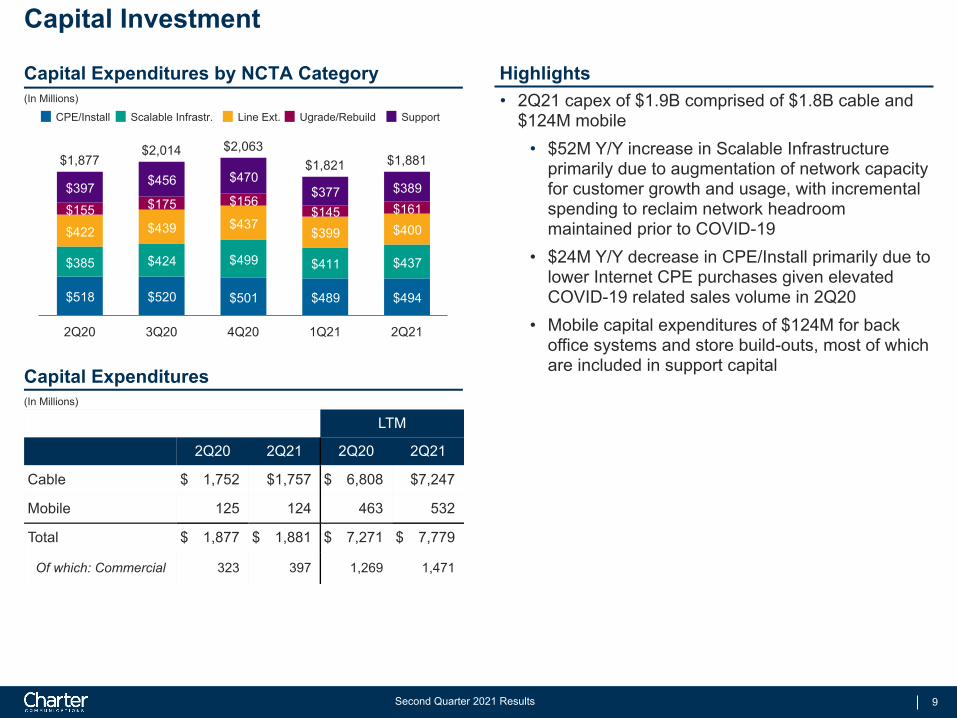
$1,877$1,877$2,014$2,014 $2,063$2,063
$1,821$1,821 $1,881$1,881
$518 $520 $501 $489 $494
$385 $424 $499 $411 $437
$422 $439 $437$399 $400
$155 $175 $156$145 $161
$397 $456 $470$377 $389
CPE/Install Scalable Infrastr. Line Ext. Ugrade/Rebuild Support
2Q20 3Q20 4Q20 1Q21 2Q21
LTM
2Q20 2Q21 2Q20 2Q21
Cable $ 1,752 $1,757 $ 6,808 $7,247
Mobile 125 124 463 532
Total $ 1,877 $ 1,881 $ 7,271 $ 7,779
Of which: Commercial 323 397 1,269 1,471
Capital Investment
Capital Expenditures by NCTA Category(In Millions)
Capital Expenditures(In Millions)
Highlights• 2Q21 capex of $1.9B comprised of $1.8B cable and
$124M mobile• $52M Y/Y increase in Scalable Infrastructure
primarily due to augmentation of network capacity for customer growth and usage, with incremental spending to reclaim network headroom maintained prior to COVID-19
• $24M Y/Y decrease in CPE/Install primarily due to lower Internet CPE purchases given elevated COVID-19 related sales volume in 2Q20
• Mobile capital expenditures of $124M for back office systems and store build-outs, most of which are included in support capital
10Second Quarter 2021 Results
Free Cash Flow1)
Free Cash Flow1) Quarterly Highlights
1) See notes on slide 19.2) Prior period amounts have been reclassified to conform with 2021 presentation methodology.3) Includes revolver availability and unrestricted cash on hand.4) Leverage is total principal amount of debt less cash and cash equivalents divided by LTM Adjusted EBITDA1) of
$19,598M and $17,500M as of 6/30/21 and 6/30/20, respectively. The leverage calculations do not reflect the leverage calculations pursuant to Charter’s indentures or credit agreements.
5) “A/N” (Advance/Newhouse) and “Liberty” (Liberty Broadband).6) On June 18, 2021, A/N’s 25M preferred partnership units in Charter Communications Holdings, LLC (“Charter Holdings”)
Partnership were converted into 9.3M common partnership units of Charter Holdings.7) Excludes 369,055 shares withheld from employees for the payment of taxes and exercise costs upon the exercise of
stock options or vesting of other equity awards during 2Q21, and 4,429,401 since Sep. 2016.8) Represents % of fully diluted shares outstanding (FDSO), as-converted, as-exchanged, as of 6/30/16.
(In Millions) Free Cash Flow1)
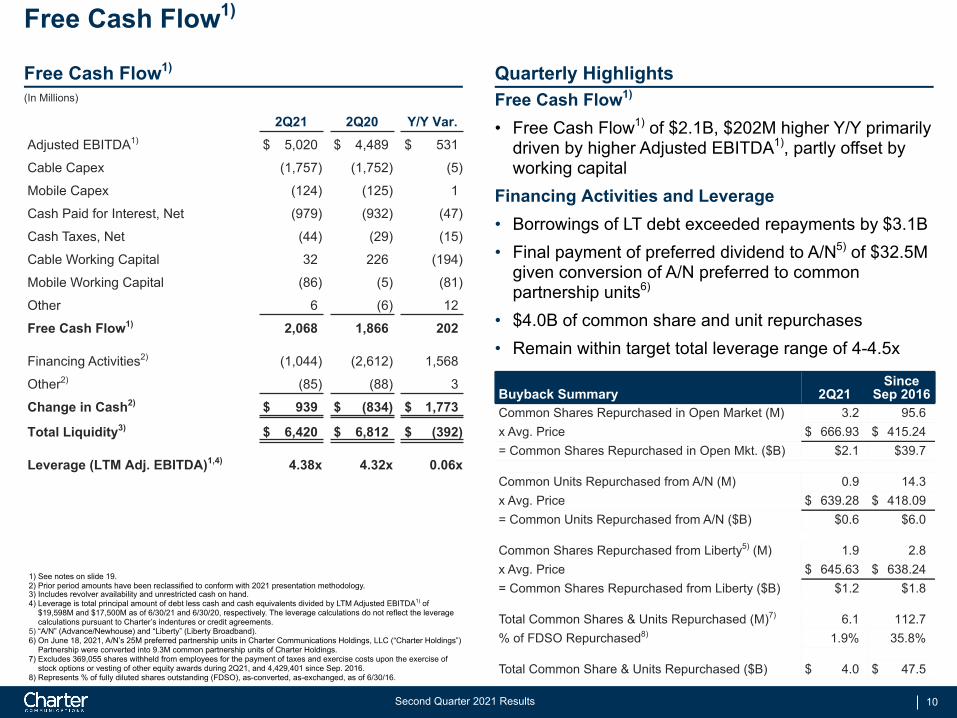
• Free Cash Flow1) of $2.1B, $202M higher Y/Y primarily driven by higher Adjusted EBITDA1), partly offset by working capital
Financing Activities and Leverage• Borrowings of LT debt exceeded repayments by $3.1B • Final payment of preferred dividend to A/N5) of $32.5M
given conversion of A/N preferred to common partnership units6)
• $4.0B of common share and unit repurchases • Remain within target total leverage range of 4-4.5x
Buyback Summary 2Q21Since
Sep 2016Common Shares Repurchased in Open Market (M) 3.2 95.6 x Avg. Price $ 666.93 $ 415.24 = Common Shares Repurchased in Open Mkt. ($B) $2.1 $39.7
Common Units Repurchased from A/N (M) 0.9 14.3 x Avg. Price $ 639.28 $ 418.09 = Common Units Repurchased from A/N ($B) $0.6 $6.0
Common Shares Repurchased from Liberty5) (M) 1.9 2.8 x Avg. Price $ 645.63 $ 638.24 = Common Shares Repurchased from Liberty ($B) $1.2 $1.8
Total Common Shares & Units Repurchased (M)7) 6.1 112.7 % of FDSO Repurchased8) 1.9 % 35.8 %
Total Common Share & Units Repurchased ($B) $ 4.0 $ 47.5
2Q21 2Q20 Y/Y Var.Adjusted EBITDA1) $ 5,020 $ 4,489 $ 531
Cable Capex (1,757) (1,752) (5)
Mobile Capex (124) (125) 1
Cash Paid for Interest, Net (979) (932) (47)
Cash Taxes, Net (44) (29) (15)
Cable Working Capital 32 226 (194)
Mobile Working Capital (86) (5) (81)
Other 6 (6) 12
Free Cash Flow1) 2,068 1,866 202
Financing Activities2) (1,044) (2,612) 1,568
Other2) (85) (88) 3
Change in Cash2) $ 939 $ (834) $ 1,773
Total Liquidity3) $ 6,420 $ 6,812 $ (392)
Leverage (LTM Adj. EBITDA)1,4) 4.38x 4.32x 0.06x
11Second Quarter 2021 Results
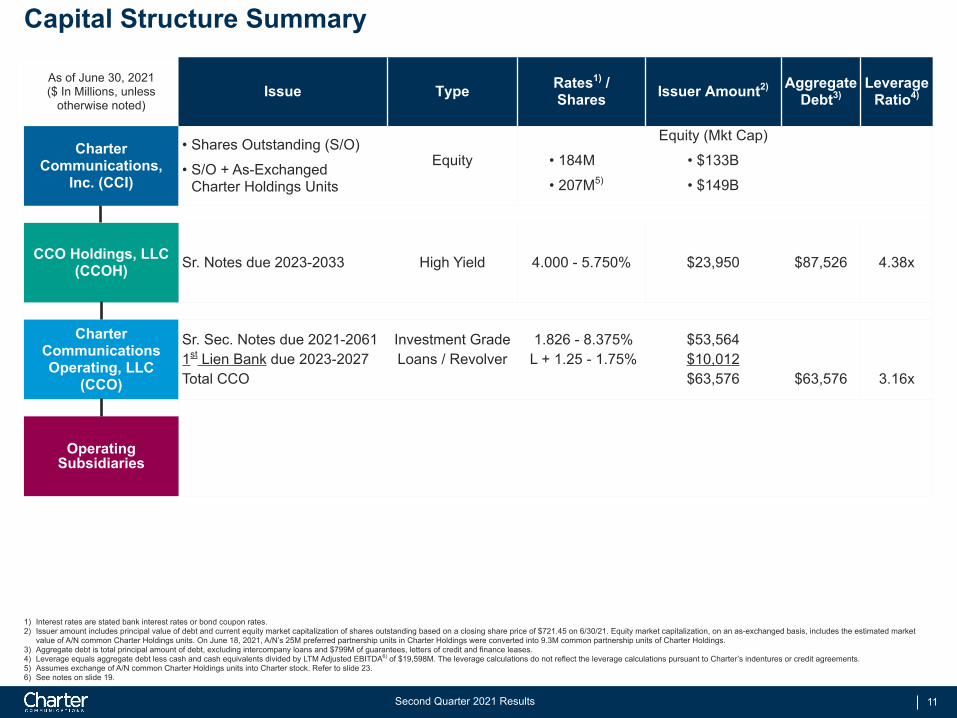
As of June 30, 2021($ In Millions, unless
otherwise noted)Issue Type Rates1) /
Shares Issuer Amount2) Aggregate Debt3)
Leverage Ratio4)
Charter Communications,
Inc. (CCI)
• Shares Outstanding (S/O)
• S/O + As-Exchanged Charter Holdings Units
Equity • 184M
• 207M5)
Equity (Mkt Cap)
• $133B
• $149B
CCO Holdings, LLC(CCOH) Sr. Notes due 2023-2033 High Yield 4.000 - 5.750% $23,950 $87,526 4.38x
Charter CommunicationsOperating, LLC
(CCO)
Sr. Sec. Notes due 2021-20611st Lien Bank due 2023-2027Total CCO
Investment GradeLoans / Revolver
1.826 - 8.375% L + 1.25 - 1.75%
$53,564$10,012$63,576 $63,576 3.16x
Operating Subsidiaries
Capital Structure Summary
1) Interest rates are stated bank interest rates or bond coupon rates. 2) Issuer amount includes principal value of debt and current equity market capitalization of shares outstanding based on a closing share price of $721.45 on 6/30/21. Equity market capitalization, on an as-exchanged basis, includes the estimated market
value of A/N common Charter Holdings units. On June 18, 2021, A/N’s 25M preferred partnership units in Charter Holdings were converted into 9.3M common partnership units of Charter Holdings.3) Aggregate debt is total principal amount of debt, excluding intercompany loans and $799M of guarantees, letters of credit and finance leases.4) Leverage equals aggregate debt less cash and cash equivalents divided by LTM Adjusted EBITDA6) of $19,598M. The leverage calculations do not reflect the leverage calculations pursuant to Charter’s indentures or credit agreements.5) Assumes exchange of A/N common Charter Holdings units into Charter stock. Refer to slide 23. 6) See notes on slide 19.
12Second Quarter 2021 Results
139139
3,2773,277
1,9361,9362,2652,265
9,8209,820
2,7882,788
6,7876,787
4,7504,750
2,7502,750
5,8005,8005,4655,465
3,9003,900
2,7502,750
2,0002,0001,5001,500
2,3002,300
1,5001,5001,2001,200
2,7502,750
2,1492,149
3,5003,500
2,5002,500 2,4502,450
1,2501,250
2,8002,800
2,0502,0502,4002,400
500500
3,2503,250
277 436 265
5,320
38
3,5373,000
1,0002,000
4,500
2,2501,250
2,465
1,000 1,000
5002,750
3,250
2,500
1,500
5,800
3,000
2,900
1,750
2021 2022 2023 2024 2025 2026 2027 2028 2029 2030 2031 2032 2033 2035 2037 2038 2039 2040 2041 2042 2045 2047 2048 2049 2050 2051 2052 2055 2061
CCO Secured Notes CCOH Unsecured Notes
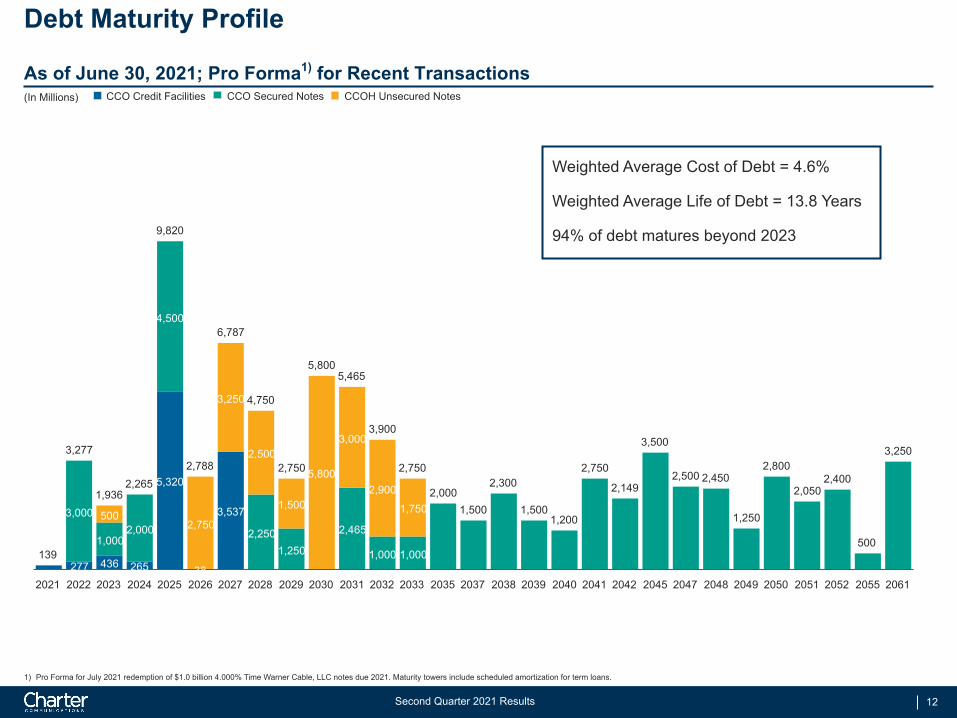
Debt Maturity Profile
As of June 30, 2021; Pro Forma1) for Recent Transactions(In Millions) CCO Credit Facilities
Weighted Average Cost of Debt = 4.6%
Weighted Average Life of Debt = 13.8 Years
94% of debt matures beyond 2023
1) Pro Forma for July 2021 redemption of $1.0 billion 4.000% Time Warner Cable, LLC notes due 2021. Maturity towers include scheduled amortization for term loans.
13Second Quarter 2021 Results
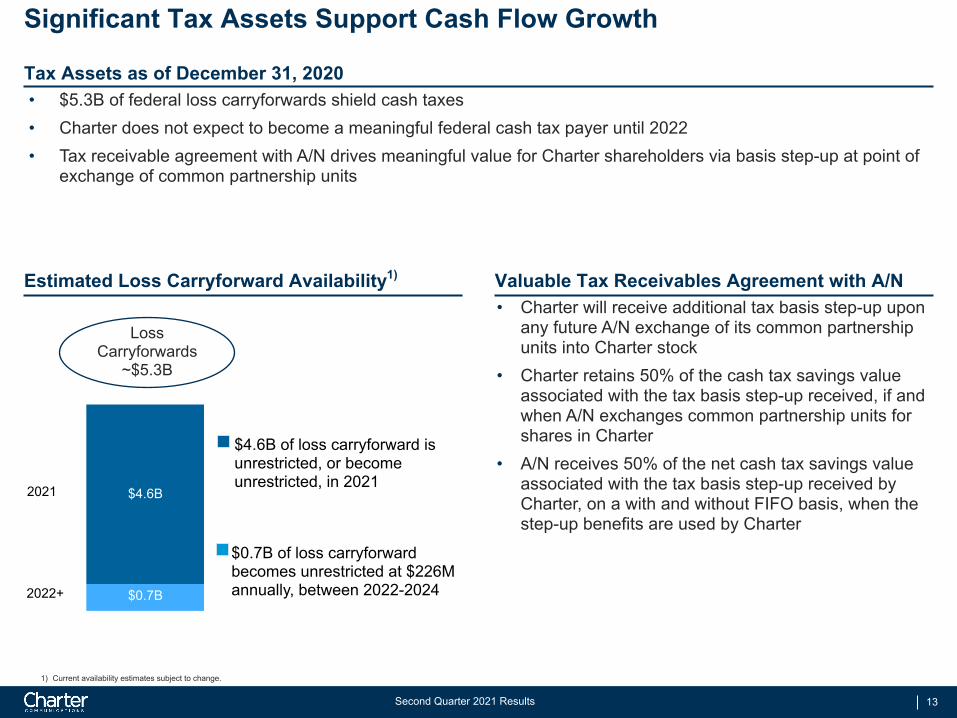
Significant Tax Assets Support Cash Flow Growth
• $5.3B of federal loss carryforwards shield cash taxes• Charter does not expect to become a meaningful federal cash tax payer until 2022• Tax receivable agreement with A/N drives meaningful value for Charter shareholders via basis step-up at point of
exchange of common partnership units
Tax Assets as of December 31, 2020
Estimated Loss Carryforward Availability1) Valuable Tax Receivables Agreement with A/N• Charter will receive additional tax basis step-up upon
any future A/N exchange of its common partnership units into Charter stock
• Charter retains 50% of the cash tax savings value associated with the tax basis step-up received, if and when A/N exchanges common partnership units for shares in Charter
• A/N receives 50% of the net cash tax savings value associated with the tax basis step-up received by Charter, on a with and without FIFO basis, when the step-up benefits are used by Charter
Loss Carryforwards
~$5.3B
1) Current availability estimates subject to change.
2021
2022+
$4.6B of loss carryforward is unrestricted, or become unrestricted, in 2021
$0.7B of loss carryforward becomes unrestricted at $226M annually, between 2022-2024
$4.6B
$0.7B
14Second Quarter 2021 Results
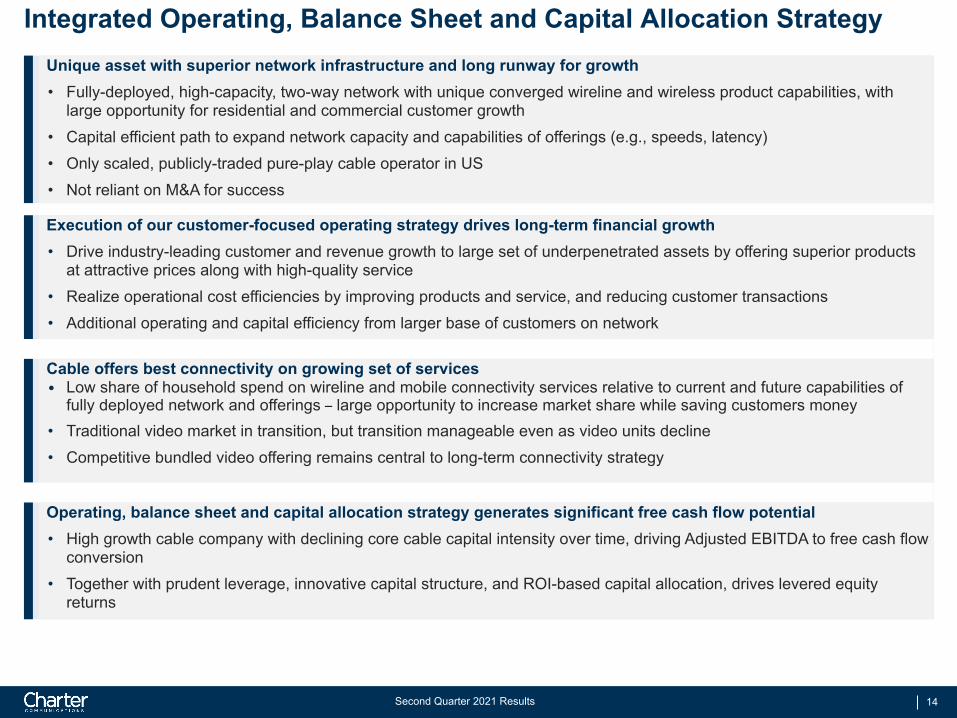
Integrated Operating, Balance Sheet and Capital Allocation StrategyUnique asset with superior network infrastructure and long runway for growth• Fully-deployed, high-capacity, two-way network with unique converged wireline and wireless product capabilities, with
large opportunity for residential and commercial customer growth• Capital efficient path to expand network capacity and capabilities of offerings (e.g., speeds, latency)• Only scaled, publicly-traded pure-play cable operator in US• Not reliant on M&A for success
Execution of our customer-focused operating strategy drives long-term financial growth• Drive industry-leading customer and revenue growth to large set of underpenetrated assets by offering superior products
at attractive prices along with high-quality service• Realize operational cost efficiencies by improving products and service, and reducing customer transactions• Additional operating and capital efficiency from larger base of customers on network
Cable offers best connectivity on growing set of services• Low share of household spend on wireline and mobile connectivity services relative to current and future capabilities of
fully deployed network and offerings – large opportunity to increase market share while saving customers money• Traditional video market in transition, but transition manageable even as video units decline• Competitive bundled video offering remains central to long-term connectivity strategy
Operating, balance sheet and capital allocation strategy generates significant free cash flow potential• High growth cable company with declining core cable capital intensity over time, driving Adjusted EBITDA to free cash flow
conversion• Together with prudent leverage, innovative capital structure, and ROI-based capital allocation, drives levered equity
returns

Investor Inquiries:Stefan Anninger | [email protected]

Appendix
17Second Quarter 2021 Results
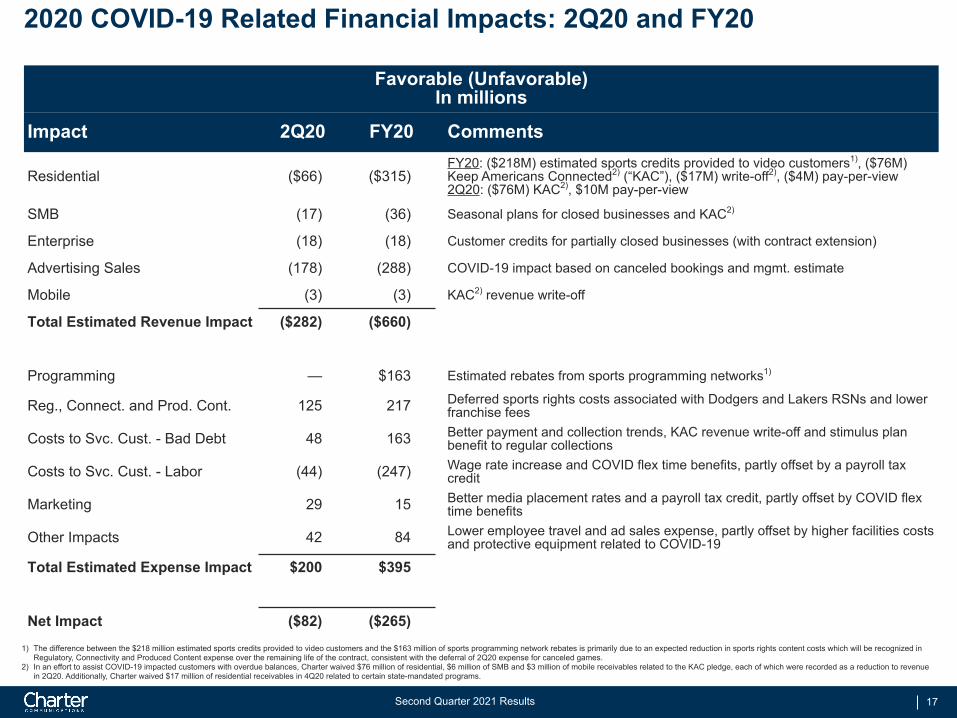
1) The difference between the $218 million estimated sports credits provided to video customers and the $163 million of sports programming network rebates is primarily due to an expected reduction in sports rights content costs which will be recognized in Regulatory, Connectivity and Produced Content expense over the remaining life of the contract, consistent with the deferral of 2Q20 expense for canceled games.
2) In an effort to assist COVID-19 impacted customers with overdue balances, Charter waived $76 million of residential, $6 million of SMB and $3 million of mobile receivables related to the KAC pledge, each of which were recorded as a reduction to revenue in 2Q20. Additionally, Charter waived $17 million of residential receivables in 4Q20 related to certain state-mandated programs.
2020 COVID-19 Related Financial Impacts: 2Q20 and FY20
Favorable (Unfavorable) In millions
Impact 2Q20 FY20 Comments
Residential ($66) ($315) FY20: ($218M) estimated sports credits provided to video customers1), ($76M) Keep Americans Connected2) (“KAC”), ($17M) write-off2), ($4M) pay-per-view2Q20: ($76M) KAC2), $10M pay-per-view
SMB (17) (36) Seasonal plans for closed businesses and KAC2)
Enterprise (18) (18) Customer credits for partially closed businesses (with contract extension)
Advertising Sales (178) (288) COVID-19 impact based on canceled bookings and mgmt. estimate
Mobile (3) (3) KAC2) revenue write-off
Total Estimated Revenue Impact ($282) ($660)
Programming — $163 Estimated rebates from sports programming networks1)
Reg., Connect. and Prod. Cont. 125 217 Deferred sports rights costs associated with Dodgers and Lakers RSNs and lower franchise fees
Costs to Svc. Cust. - Bad Debt 48 163 Better payment and collection trends, KAC revenue write-off and stimulus plan benefit to regular collections
Costs to Svc. Cust. - Labor (44) (247) Wage rate increase and COVID flex time benefits, partly offset by a payroll tax credit
Marketing 29 15 Better media placement rates and a payroll tax credit, partly offset by COVID flex time benefits
Other Impacts 42 84 Lower employee travel and ad sales expense, partly offset by higher facilities costs and protective equipment related to COVID-19
Total Estimated Expense Impact $200 $395
Net Impact ($82) ($265)
18Second Quarter 2021 Results
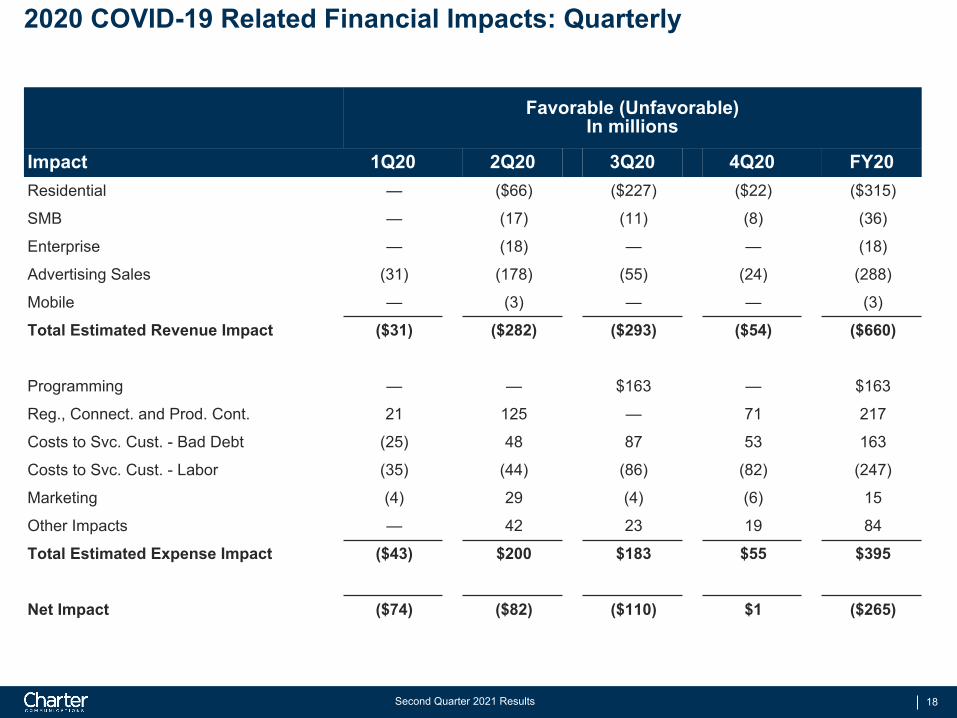
2020 COVID-19 Related Financial Impacts: Quarterly
Favorable (Unfavorable)In millions
Impact 1Q20 2Q20 3Q20 4Q20 FY20Residential — ($66) ($227) ($22) ($315)
SMB — (17) (11) (8) (36)
Enterprise — (18) — — (18)
Advertising Sales (31) (178) (55) (24) (288)
Mobile — (3) — — (3)
Total Estimated Revenue Impact ($31) ($282) ($293) ($54) ($660)
Programming — — $163 — $163
Reg., Connect. and Prod. Cont. 21 125 — 71 217
Costs to Svc. Cust. - Bad Debt (25) 48 87 53 163
Costs to Svc. Cust. - Labor (35) (44) (86) (82) (247)
Marketing (4) 29 (4) (6) 15
Other Impacts — 42 23 19 84
Total Estimated Expense Impact ($43) $200 $183 $55 $395
Net Impact ($74) ($82) ($110) $1 ($265)
19Second Quarter 2021 Results
Use of Non-GAAP Financial Metrics and Additional InformationWe use certain measures that are not defined by U.S. generally accepted accounting principles ("GAAP") to evaluate various aspects of our business. Adjusted EBITDA and free cash flow are non GAAP financial measures and should be considered in addition to, not as a substitute for, net income attributable to Charter shareholders and net cash flows from operating activities reported in accordance with GAAP. These terms, as defined by us, may not be comparable to similarly titled measures used by other companies. Adjusted EBITDA and free cash flow are reconciled to net income attributable to Charter shareholders and net cash flows from operating activities, respectively, in the appendix of this presentation.
Adjusted EBITDA is defined as net income attributable to Charter shareholders plus net income attributable to noncontrolling interest, net interest expense, income taxes, depreciation and amortization, stock compensation expense, other (income) expenses, net and other operating (income) expenses, net, such as special charges and (gain) loss on sale or retirement of assets. As such, it eliminates the significant non-cash depreciation and amortization expense that results from the capital-intensive nature of our businesses as well as other non-cash or special items, and is unaffected by our capital structure or investment activities. However, this measure is limited in that it does not reflect the periodic costs of certain capitalized tangible and intangible assets used in generating revenues and our cash cost of financing. These costs are evaluated through other financial measures.
Free cash flow is defined as net cash flows from operating activities, less capital expenditures and changes in accrued expenses related to capital expenditures.
Management and Charter's board of directors use Adjusted EBITDA and free cash flow to assess Charter's performance and its ability to service its debt, fund operations and make additional investments with internally generated funds. In addition, Adjusted EBITDA generally correlates to the leverage ratio calculation under our credit facilities or outstanding notes to determine compliance with the covenants contained in the facilities and notes (all such documents have been previously filed with the Securities and Exchange Commission (the "SEC")). For the purpose of calculating compliance with leverage covenants, we use Adjusted EBITDA, as presented, excluding certain expenses paid by our operating subsidiaries to other Charter entities. Our debt covenants refer to these expenses as management fees, which were $365 million and $642 million for the three and six months ended June 30, 2021, respectively, and $308 million and $619 million for the three and six months ended June 30, 2020, respectively.
For a reconciliation of Adjusted EBITDA and free cash flow to the most directly comparable GAAP financial measure, see slides 20, 21 and 22.
Customer relationships include the number of customers that receive one or more levels of service, encompassing video, Internet and voice services, without regard to which service(s) such customers receive. Customers who reside in residential multiple dwelling units ("MDUs") and that are billed under bulk contracts are counted based on the number of billed units within each bulk MDU. Total customer relationships exclude enterprise customer relationships and mobile-only customer relationships.
20Second Quarter 2021 Results
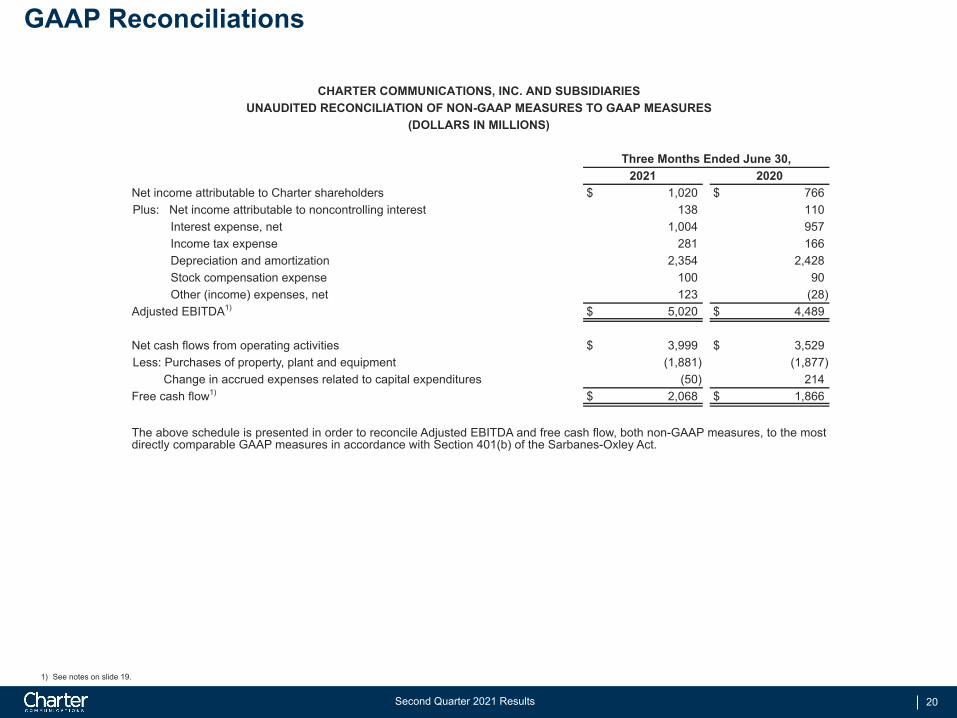
GAAP Reconciliations
CHARTER COMMUNICATIONS, INC. AND SUBSIDIARIES UNAUDITED RECONCILIATION OF NON-GAAP MEASURES TO GAAP MEASURES
(DOLLARS IN MILLIONS)
Three Months Ended June 30, 2021 2020
Net income attributable to Charter shareholders $ 1,020 $ 766 Plus: Net income attributable to noncontrolling interest 138 110
Interest expense, net 1,004 957 Income tax expense 281 166 Depreciation and amortization 2,354 2,428 Stock compensation expense 100 90 Other (income) expenses, net 123 (28)
Adjusted EBITDA1) $ 5,020 $ 4,489
Net cash flows from operating activities $ 3,999 $ 3,529 Less: Purchases of property, plant and equipment (1,881) (1,877)
Change in accrued expenses related to capital expenditures (50) 214 Free cash flow1) $ 2,068 $ 1,866
The above schedule is presented in order to reconcile Adjusted EBITDA and free cash flow, both non-GAAP measures, to the most directly comparable GAAP measures in accordance with Section 401(b) of the Sarbanes-Oxley Act.
1) See notes on slide 19.
21Second Quarter 2021 Results
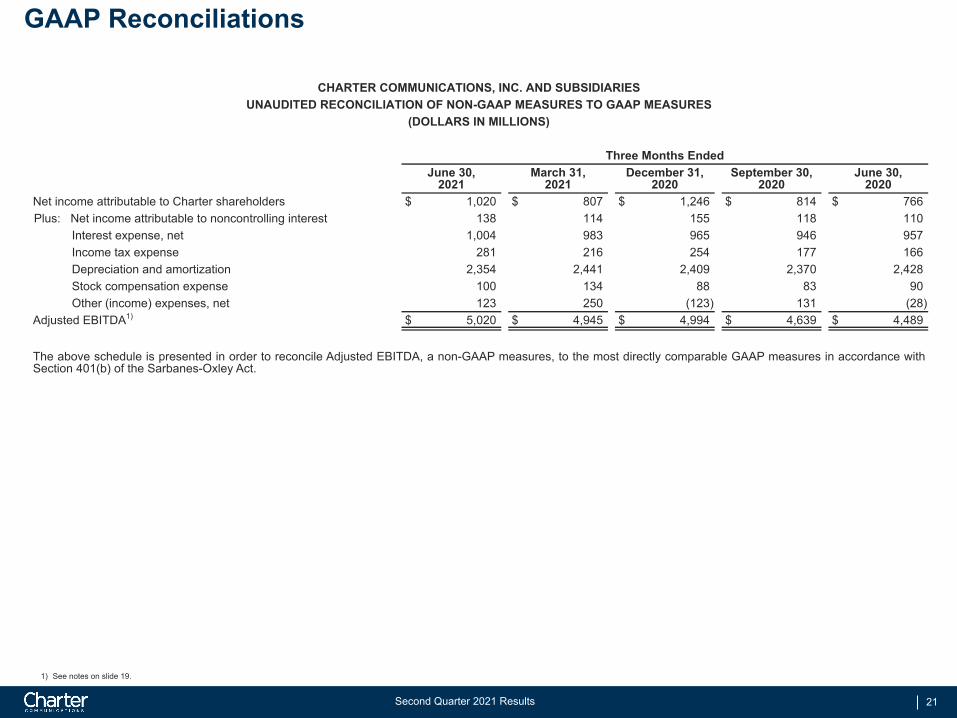
GAAP Reconciliations
1) See notes on slide 19.
CHARTER COMMUNICATIONS, INC. AND SUBSIDIARIES UNAUDITED RECONCILIATION OF NON-GAAP MEASURES TO GAAP MEASURES
(DOLLARS IN MILLIONS)
Three Months EndedJune 30,
2021March 31,
2021December 31,
2020September 30,
2020June 30,
2020Net income attributable to Charter shareholders $ 1,020 $ 807 $ 1,246 $ 814 $ 766 Plus: Net income attributable to noncontrolling interest 138 114 155 118 110
Interest expense, net 1,004 983 965 946 957 Income tax expense 281 216 254 177 166 Depreciation and amortization 2,354 2,441 2,409 2,370 2,428 Stock compensation expense 100 134 88 83 90 Other (income) expenses, net 123 250 (123) 131 (28)
Adjusted EBITDA1) $ 5,020 $ 4,945 $ 4,994 $ 4,639 $ 4,489
The above schedule is presented in order to reconcile Adjusted EBITDA, a non-GAAP measures, to the most directly comparable GAAP measures in accordance with Section 401(b) of the Sarbanes-Oxley Act.
22Second Quarter 2021 Results
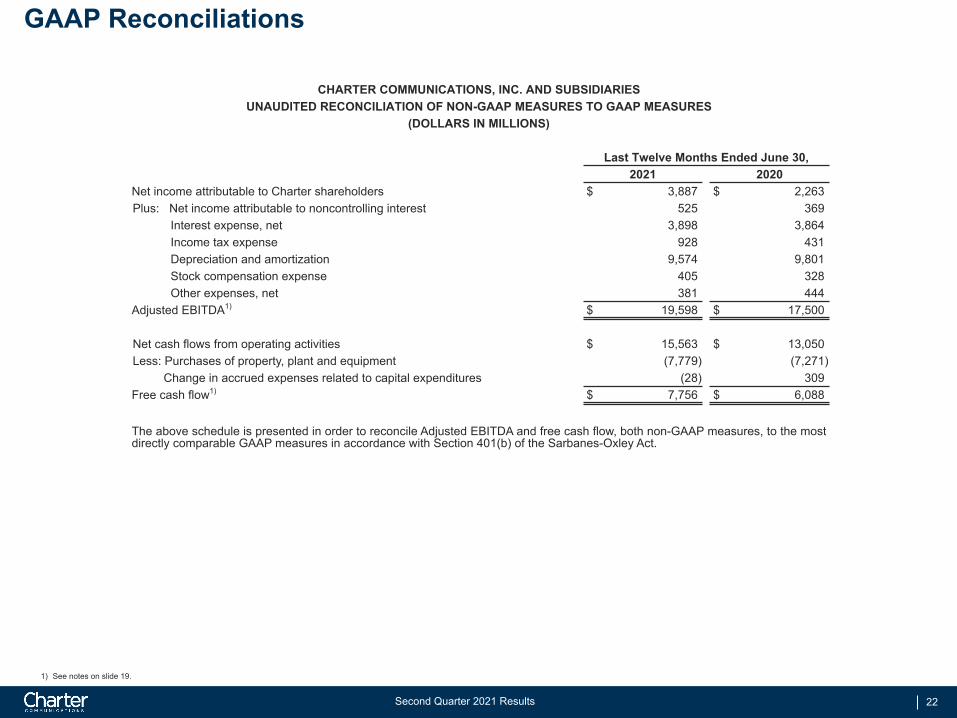
GAAP Reconciliations
1) See notes on slide 19.
CHARTER COMMUNICATIONS, INC. AND SUBSIDIARIES UNAUDITED RECONCILIATION OF NON-GAAP MEASURES TO GAAP MEASURES
(DOLLARS IN MILLIONS)
Last Twelve Months Ended June 30,2021 2020
Net income attributable to Charter shareholders $ 3,887 $ 2,263 Plus: Net income attributable to noncontrolling interest 525 369
Interest expense, net 3,898 3,864 Income tax expense 928 431 Depreciation and amortization 9,574 9,801 Stock compensation expense 405 328 Other expenses, net 381 444
Adjusted EBITDA1) $ 19,598 $ 17,500
Net cash flows from operating activities $ 15,563 $ 13,050 Less: Purchases of property, plant and equipment (7,779) (7,271)
Change in accrued expenses related to capital expenditures (28) 309 Free cash flow1) $ 7,756 $ 6,088
The above schedule is presented in order to reconcile Adjusted EBITDA and free cash flow, both non-GAAP measures, to the most directly comparable GAAP measures in accordance with Section 401(b) of the Sarbanes-Oxley Act.
23Second Quarter 2021 Results
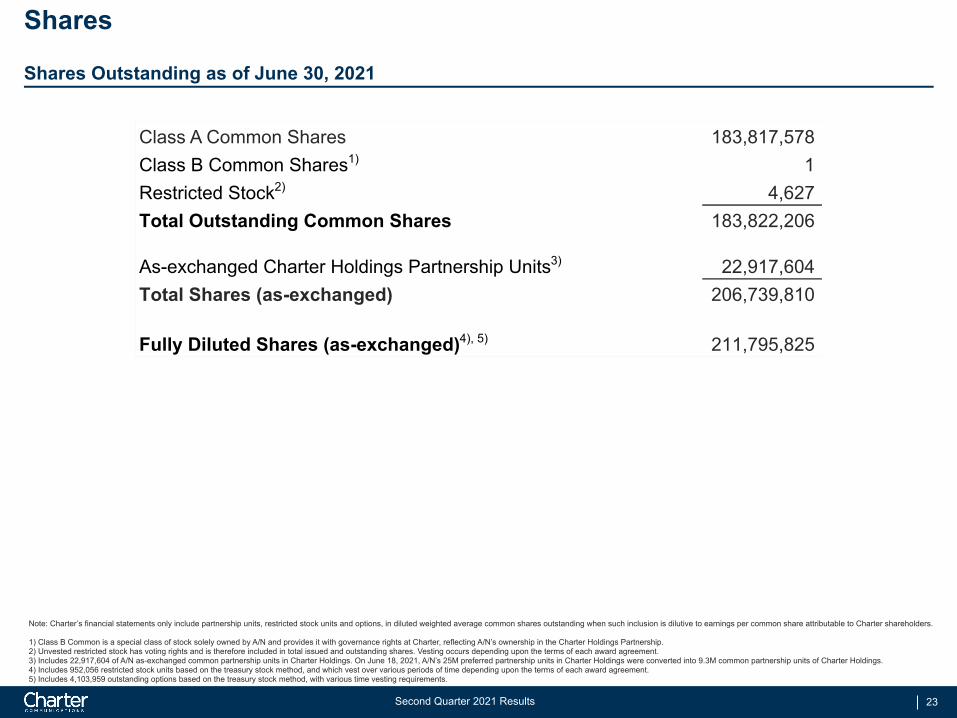
Shares
Shares Outstanding as of June 30, 2021
Class A Common Shares 183,817,578 Class B Common Shares1) 1 Restricted Stock2) 4,627 Total Outstanding Common Shares 183,822,206
As-exchanged Charter Holdings Partnership Units3) 22,917,604 Total Shares (as-exchanged) 206,739,810
Fully Diluted Shares (as-exchanged)4), 5) 211,795,825
Note: Charter’s financial statements only include partnership units, restricted stock units and options, in diluted weighted average common shares outstanding when such inclusion is dilutive to earnings per common share attributable to Charter shareholders.
1) Class B Common is a special class of stock solely owned by A/N and provides it with governance rights at Charter, reflecting A/N’s ownership in the Charter Holdings Partnership.2) Unvested restricted stock has voting rights and is therefore included in total issued and outstanding shares. Vesting occurs depending upon the terms of each award agreement.3) Includes 22,917,604 of A/N as-exchanged common partnership units in Charter Holdings. On June 18, 2021, A/N’s 25M preferred partnership units in Charter Holdings were converted into 9.3M common partnership units of Charter Holdings.4) Includes 952,056 restricted stock units based on the treasury stock method, and which vest over various periods of time depending upon the terms of each award agreement. 5) Includes 4,103,959 outstanding options based on the treasury stock method, with various time vesting requirements.