Second Quarter 2004 Results En
15
Slide 1 2Q04 Results 2Q04 Results July 22, 2004
description
Transcript of Second Quarter 2004 Results En
Slide 1
2Q04 Results2Q04 Results
July 22, 2004
Slide 2
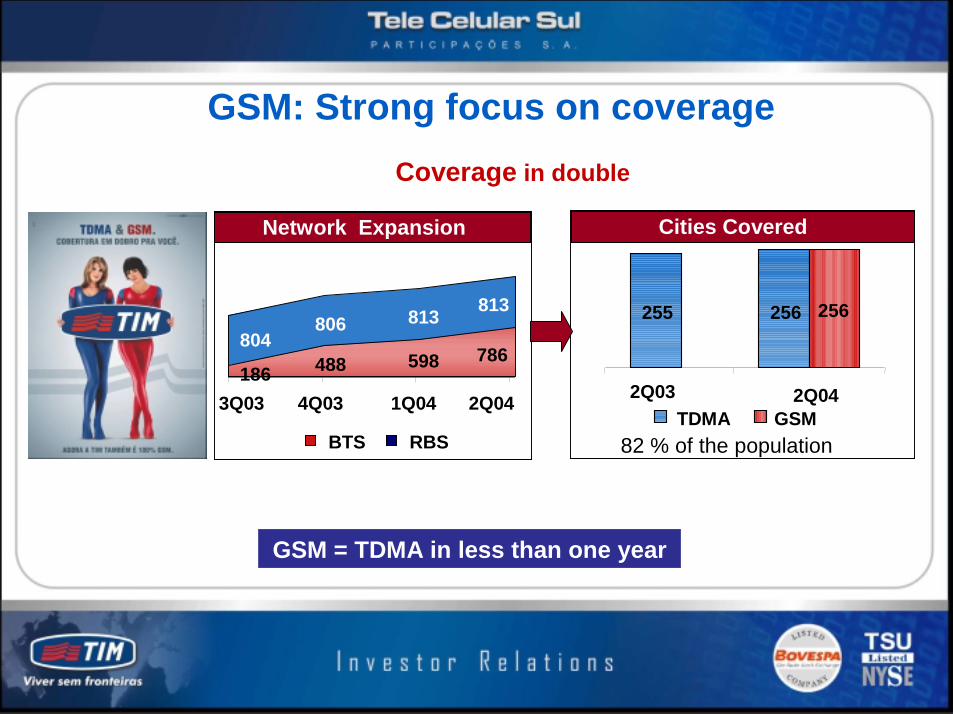
GSM: Strong focus on coverage
488 598
806 813
786186
813
804
3Q03 4Q03 1Q04 2Q04
BTS RBS
255 256 256
2Q03TDMA
2Q04GSM
Cities CoveredNetwork Expansion
82 % of the population
GSM = TDMA in less than one year
Coverage in double
Slide 3
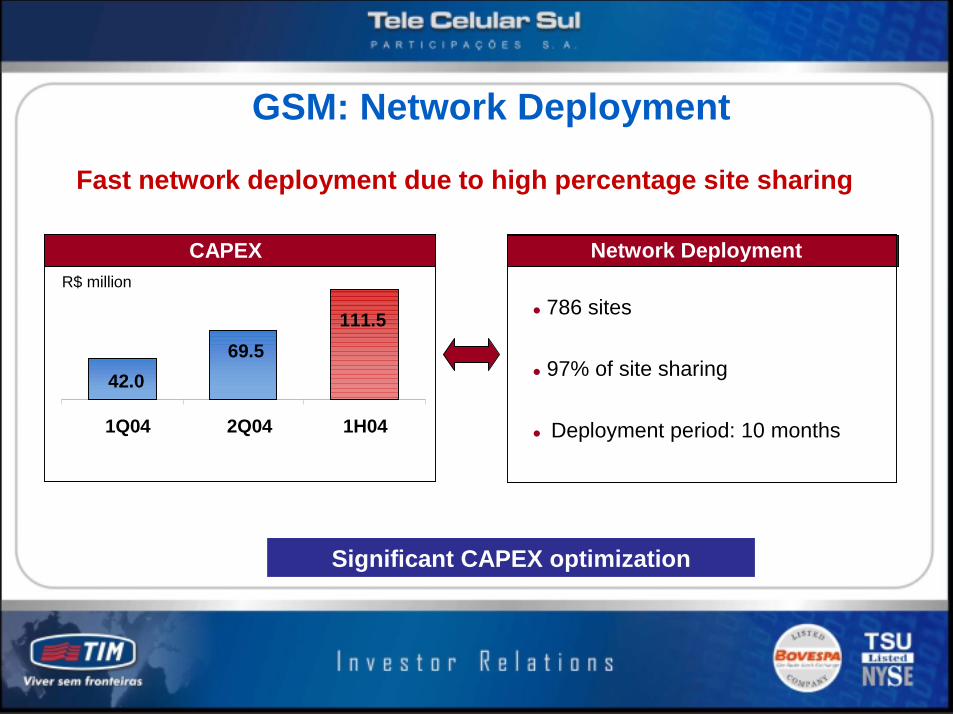
GSM: Network Deployment
CAPEX
Significant CAPEX optimization
42.0
111.569.5
1Q04 2Q04 1H04
Network Deployment
Fast network deployment due to high percentage site sharing
R$ million
� 786 sites
� 97% of site sharing
� Deployment period: 10 months
Slide 4
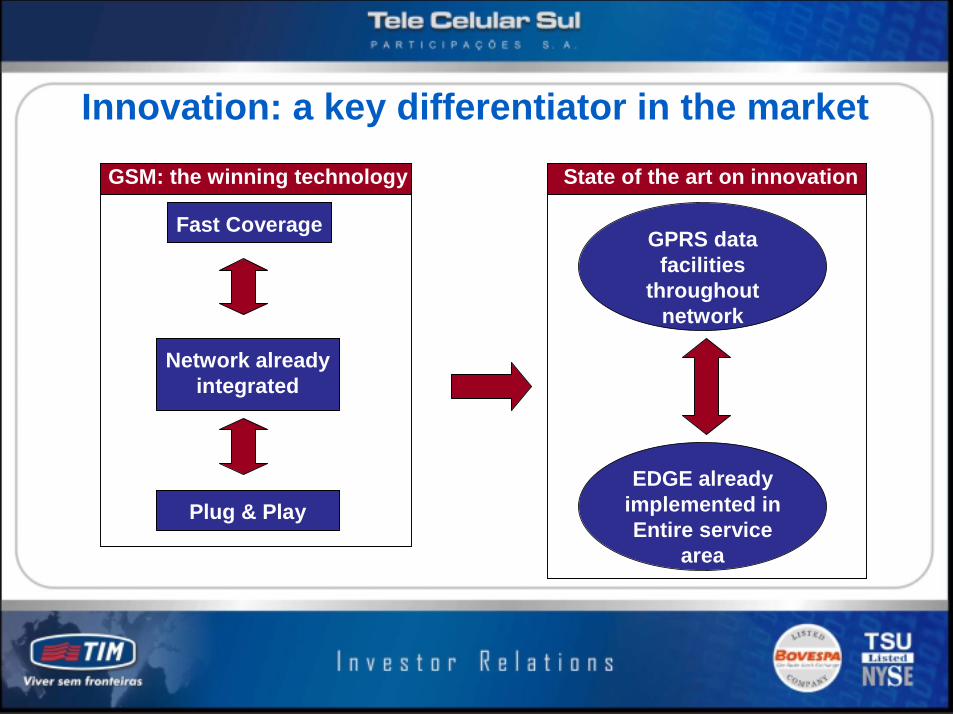
Innovation: a key differentiator in the market
GPRS data facilities
throughout network
EDGE already implemented inEntire service
area
Fast Coverage
Network alreadyintegrated
State of the art on innovationGSM: the winning technology
Fast Coverage
Plug & Play
Slide 5
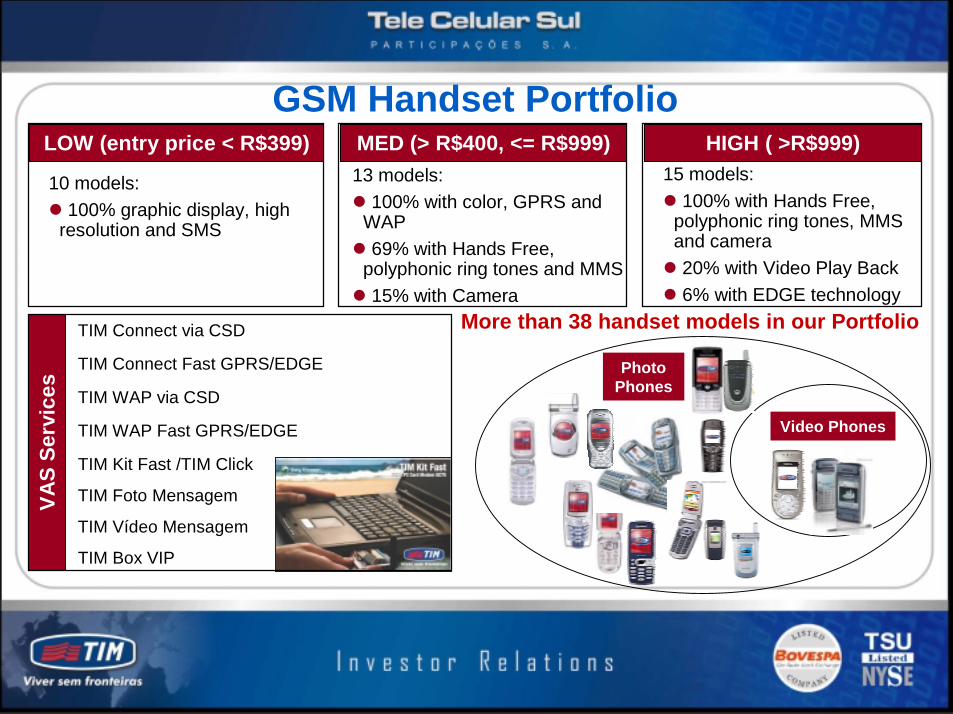
13 models: � 100% with color, GPRS and
WAP� 69% with Hands Free,
polyphonic ring tones and MMS� 15% with Camera
15 models: � 100% with Hands Free,
polyphonic ring tones, MMS and camera
� 20% with Video Play Back� 6% with EDGE technology
GSM Handset Portfolio
More than 38 handset models in our Portfolio
Photo Phones
LOW (entry price < R$399)
10 models: � 100% graphic display, high
resolution and SMS
MED (> R$400, <= R$999) HIGH ( >R$999)
Video Phones
TIM Connect via CSD
TIM Connect Fast GPRS/EDGE
TIM WAP via CSD
TIM WAP Fast GPRS/EDGE
TIM Kit Fast /TIM Click
TIM Foto Mensagem
TIM Vídeo Mensagem
TIM Box VIP
VAS
Serv
ices
Slide 6
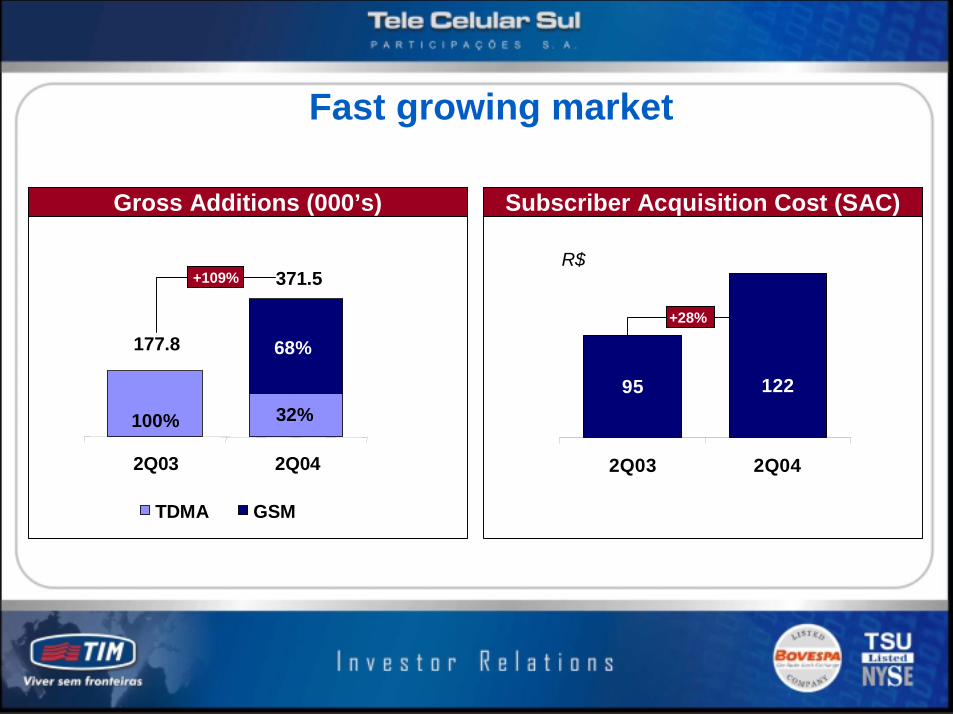
+28%
95 122
2Q03 2Q04
Fast growing market
R$
68%
100% 32%
2Q03 2Q04
TDMA GSM
Gross Additions (000’s) Subscriber Acquisition Cost (SAC)
177.8
371.5+109%
Slide 7
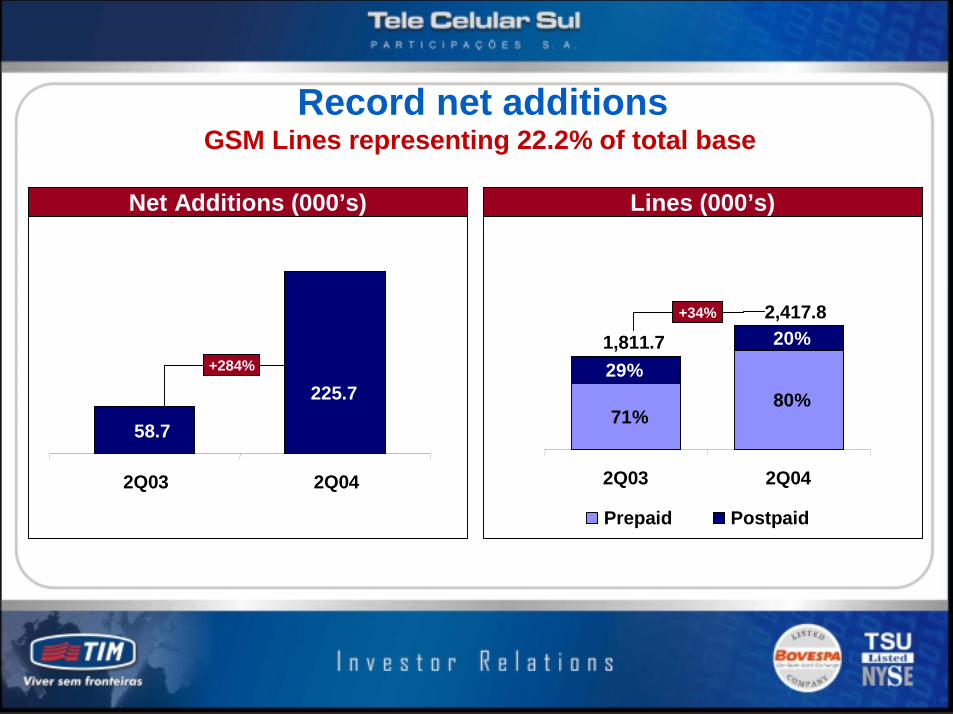
+284%
225.7
58.7
2Q03 2Q04
Record net additions
Net Additions (000’s) Lines (000’s)
71%80%
29%20%
2Q03 2Q04
Prepaid Postpaid
1,811.72,417.8+34%
GSM Lines representing 22.2% of total base
Slide 8
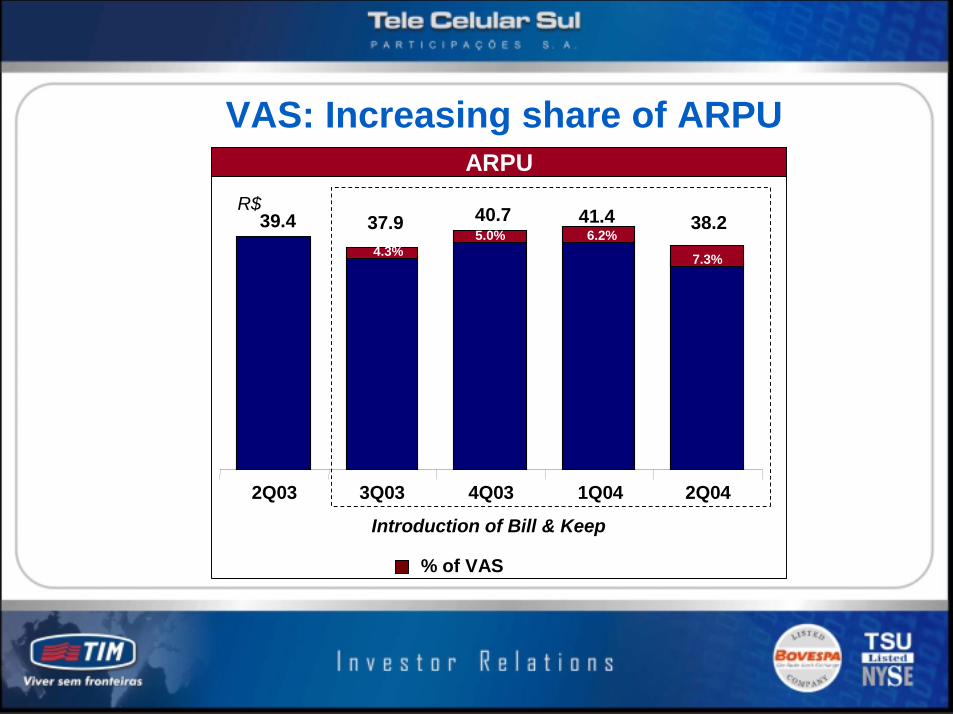
2Q03 3Q03 4Q03 1Q04 2Q04
VAS: Increasing share of ARPU
R$ 40.7 41.4 38.239.4 37.9
ARPU
% of VAS
Introduction of Bill & Keep
7.3%
6.2%5.0%4.3%
Slide 9
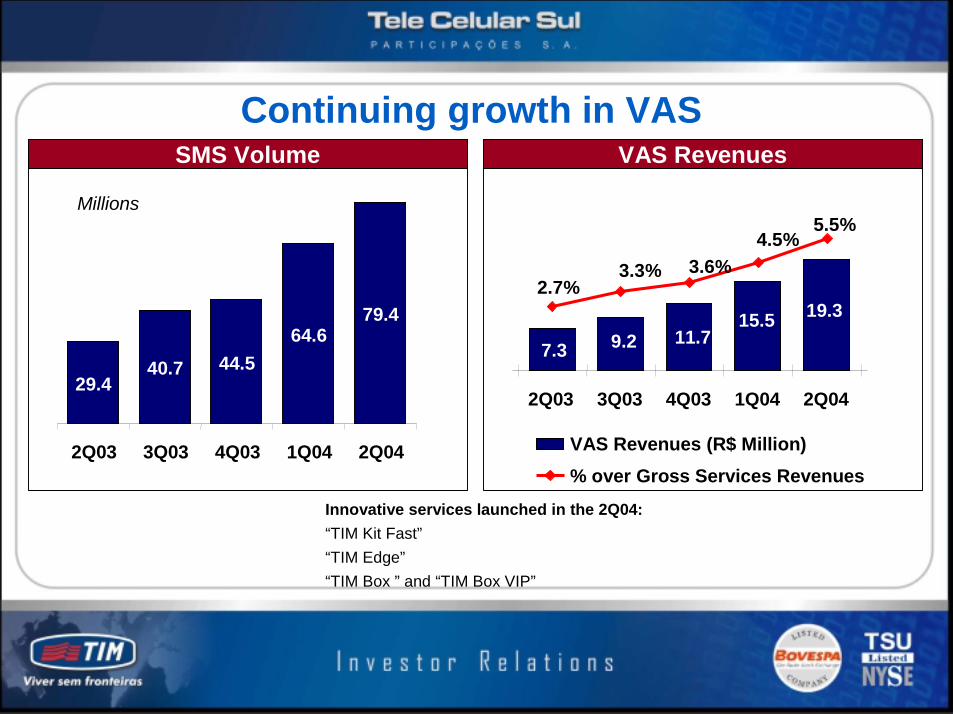
Continuing growth in VASSMS Volume VAS Revenues
29.440.7 44.5
64.679.4
2Q03 3Q03 4Q03 1Q04 2Q04
19.315.511.79.27.3
5.5%4.5%
3.6%3.3%2.7%
2Q03 3Q03 4Q03 1Q04 2Q04
VAS Revenues (R$ Million)% over Gross Services Revenues
Innovative services launched in the 2Q04:“TIM Kit Fast”“TIM Edge”“TIM Box ” and “TIM Box VIP”
Millions
Slide 10
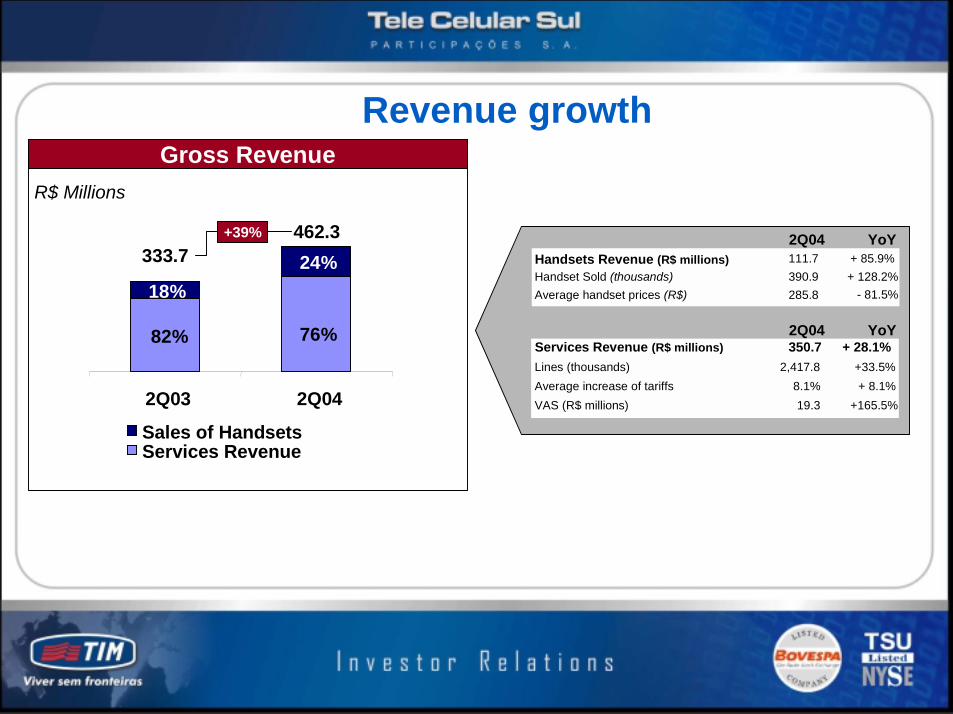
Revenue growth
R$ Millions
2Q04 YoY
Handset Sold (thousands) 390.9 + 128.2%Average handset prices (R$) 285.8
2Q04 YoY
Lines (thousands) 2,417.8 +33.5%Average increase of tariffs 8.1% + 8.1%VAS (R$ millions) 19.3 +165.5%
- 81.5%
Handsets Revenue (R$ millions) 111.7 + 85.9%
Services Revenue (R$ millions) 350.7 + 28.1%
Gross Revenue
82%
24%18%
76%
2Q03 2Q04
Sales of HandsetsServices Revenue
462.3333.7
+39%
Slide 11
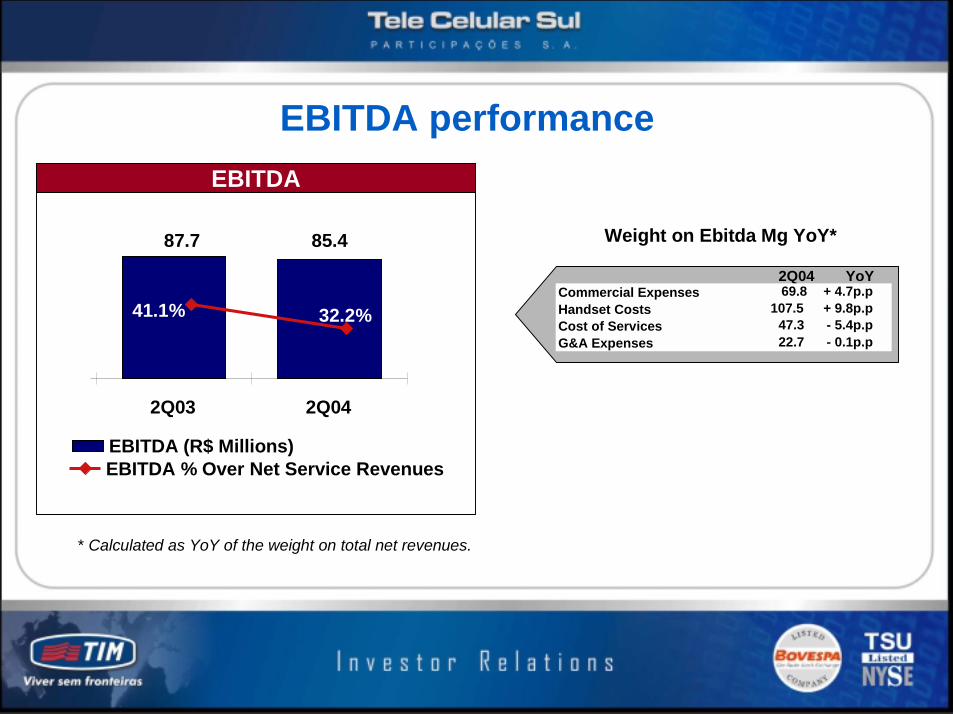
EBITDA performance
Weight on Ebitda Mg YoY*
* Calculated as YoY of the weight on total net revenues.
2Q04 YoYCommercial ExpensesHandset CostsCost of ServicesG&A Expenses
69.8 + 4.7p.p107.5 + 9.8p.p
47.3 - 5.4p.p22.7 - 0.1p.p
EBITDA
87.7 85.4
41.1% 32.2%
2Q03 2Q04
EBITDA (R$ Millions)EBITDA % Over Net Service Revenues
Slide 12
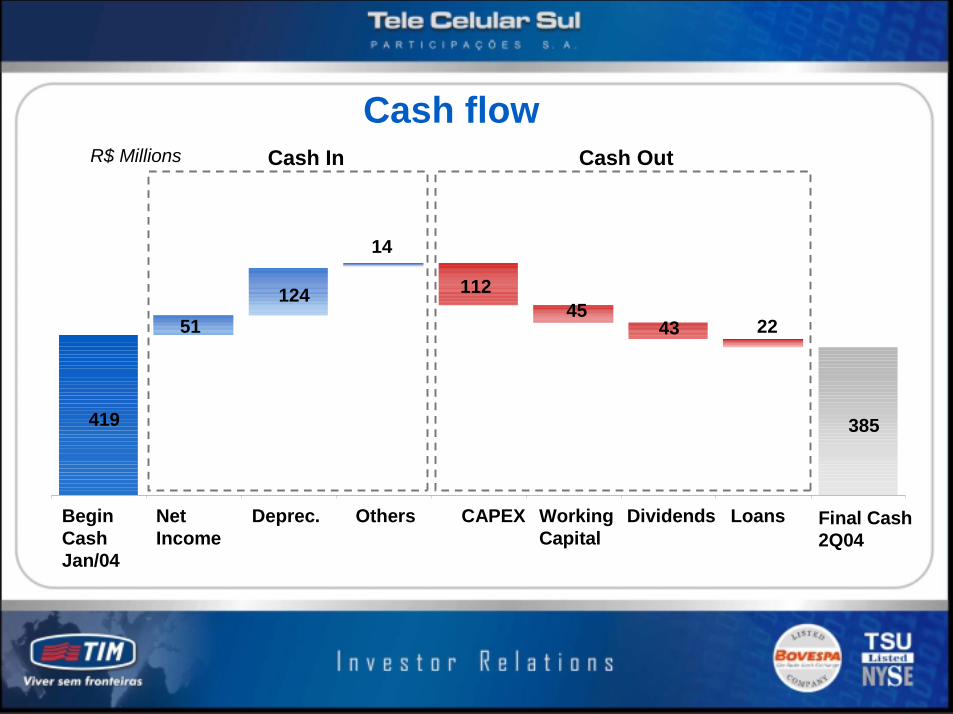
Cash flowR$ Millions Cash In Cash Out
385
112
419
51124
14
224345
Begin CashJan/04
Net Income
Deprec. Others CAPEX WorkingCapital
Dividends Loans Final Cash2Q04
Slide 13
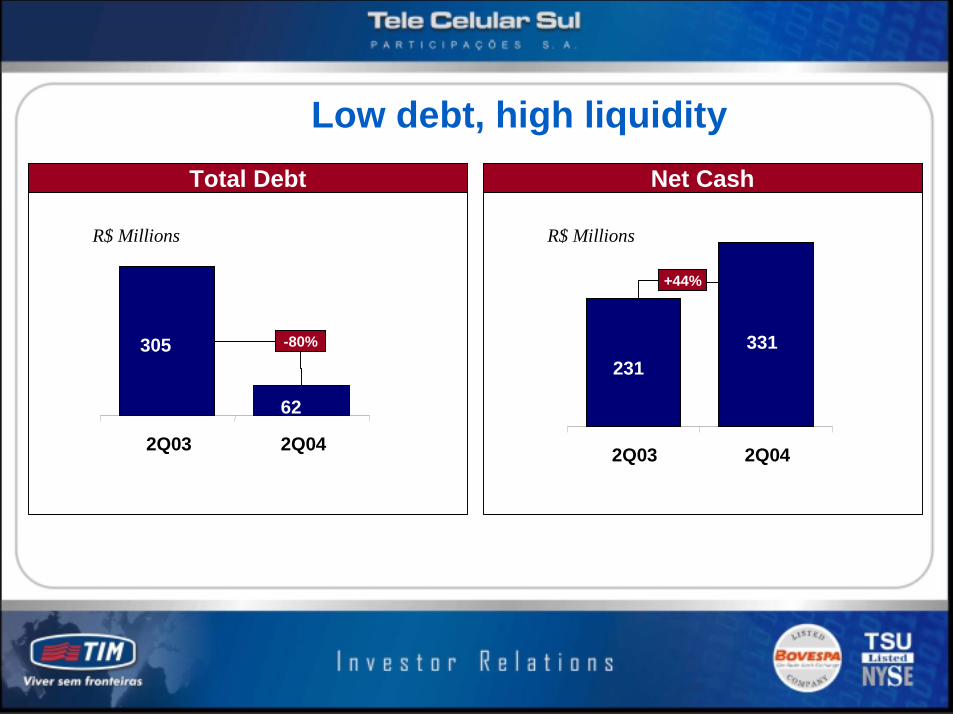
Low debt, high liquidity
R$ Millions R$ Millions
62
305
2Q03 2Q04
Total Debt
-80%
Net Cash
+44%
231331
2Q03 2Q04
Slide 14
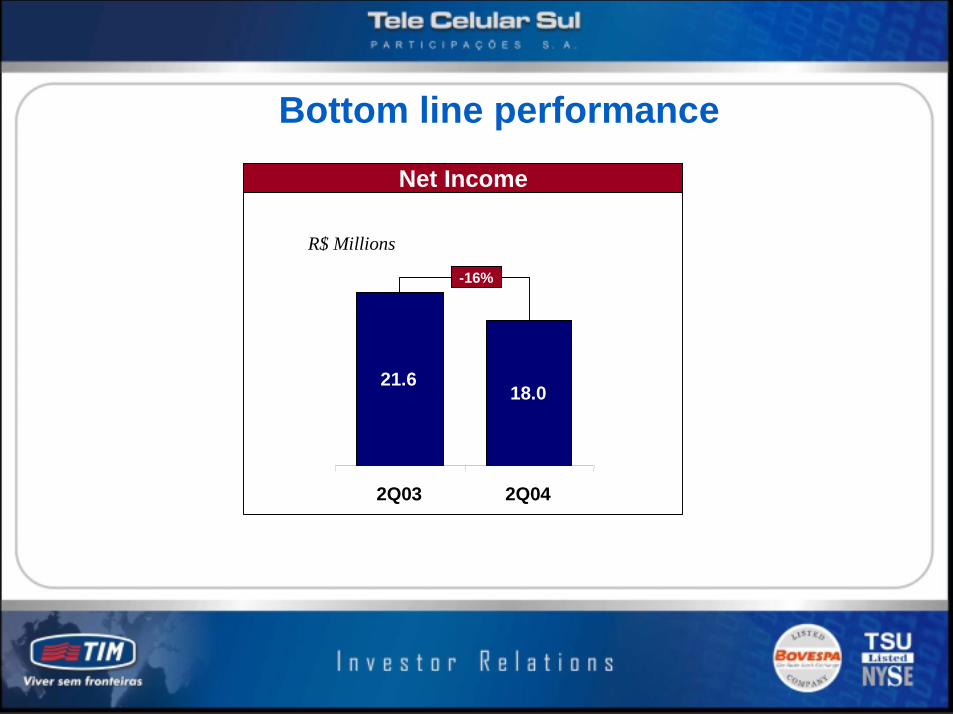
Bottom line performance
R$ Millions
Net Income
21.618.0
2Q03 2Q04
-16%
Slide 15
For further information, please contact:
Tele Celular Sul Participações S.A.R. Comendador Araújo. 299 – Cep 80.420-000Curitiba – PR – Brasil�: (+ 55) 41 312-6862http://timsulri.com.br/
Investor Relations Department:Joana SerafimCell: (+ 55) 41 [email protected]
Rafael BósioCell: (+ 55) 41 [email protected]