Financial Results Second Quarter 2021
32
Financial Results Second Quarter 2021
Transcript of Financial Results Second Quarter 2021

Financial ResultsSecond Quarter2021

"We have continued to make good progress building our physical-digital ecosystem. During the second
quarter, our omnichannel platform reported total sales growth of 79% in the region (e-commerce
and physical stores). Our e-commerce platform achieved an online sales record, with GMV of US$ 1.2
billion, representing growth of 38% YoY. This brings GMV to US$ 4.1 billion for the last 12 months.
Our Marketplace business continues to expand and reached GMV of US$ 877 million over the 12
months ended June 2021.
Although we continue to navigate a challenging environment, as mobility restrictions become more
relaxed, our customers are returning to our stores and appreciate the value of our omnichannel
proposal. We continue to capture strong growth in both physical and e-commerce channels, which
drives our overall growth. The performance of retailers in Chile is exceptional, as their revenue grew
80% YoY. GMV in Chile grew by 72% YoY, while Marketplace sales grew by 65% YoY, and retail sales
grew by 74% YoY. Online penetration by Department Stores in Chile reached 64%.
We shipped almost 10 million home delivery orders within the region during the second quarter, up
12% YoY. Our mobile channels continue to strengthen. The Falabella.com App represents 40% of
GMV in Chile, while the Home Improvement App represents 23% in 2Q21.
We continue to capitalize on strong positive momentum for Home Improvement products. Regional
revenue for the format grew 110% and its online business continues to expand, recording sales of US$
812 million over the last 12 months.
Banco Falabella in Chile already provides fully digital credit cards, checking accounts and consumer
loans. We continue to accelerate the pace of issuance of fully digital cards during the second quarter
of 2021, which now total more than 195,000 cards in Chile, Peru and Colombia. The digital cards
issued in Chile during the second quarter were more than double the total physical and digital cards
issued last year. Also 54% of financial product origination during the last 12 months was captured
through digital channels. Our proprietary payment processing platform, Fpay, achieved a TPV of US$
2,922 million over the last 12 months.
Our customers are increasingly interacting with our loyalty program throughout the region and
reached 12.6 million participants (+68% YoY).
We have taken an important step in executing our strategy, as the new Falabella.com web site was
launched in Chile at the end of August. This new integrated platform concentrates products by our
retailers and thousands of entrepreneurs in our Marketplace. This web site has created the largest e-
commerce portal in Chile, with a base of more than 100 million monthly visits on average and a
tremendous potential to drive sales for both our retailers and Sellers.
We are beginning a new journey that has begun in Chile, but soon will reach Peru and Colombia.
Falabella.com is a turning point in implementing our physical-digital ecosystem, which aims to make life
simpler for our customers and improve people’s enjoyment of life”.
Financial Results Second Quarter 2021
Highlights 2Q-2021
Management’sComments
investors.falabella.com
Gaston Bottazzini,
Falabella’s CEO, on the
performance of business
US$ 1.212Million
Online GMV
+38% YoY
US$ 3.127Million
Store Sales
+101% YoY
US$ 801Million
TPV
US$ 185Million
Net Income

2Q20 2Q21 Var (%)
Total sales
GMV Online 876 1.212 38%
GMV retail (1P) 669 974 46%
GMV marketplace (3P) 207 238 15%
Total sales of physical stores 1.555 3.127 101%
Total sales 2 .431 4.339 79%
TPV 666 801 20%
Financ ial Results
Non-Banking Revenue 2.004 3.285 64%
Financial Services Revenue 411 354 -14%
Total Revenue 2.415 3.639 51%
EBITDA (35) 493 -
Net (Loss) Income (177) 185 -
Balance Sheet
Cash (non-banking) 1.966 1.120 -43%
Gross Loan Book 6.950 6.354 -9%
Total Net Debt (Exc. Banking) 4.349 3.543 -19%
US$ 4.063 millionGMV
2Q-2021 LTM
+8 millionSKU’s
14.000SELLERS
+180 millionVISITS PER MONTH
45 DISTRIBUTION CENTERS
29 TRANSFER CENTERS
1.443.956 SQM of
LOGISTICS CENTERS
+35 millionORDERS DELIVERED
2Q-2021 LTM
Key Indicators 01 US$ million
Falabella.com launched in Chile
02 Falabella.com's new platform was launched in Chile on August 24, 2021
0 2
• We have continued to simplify the shopping experience of our customers in Chile by launching Falabella.com. It provides the
entire range of products at our Department Stores (Falabella Retail), Home Improvement (Sodimac) and Supermarkets
(Tottus) all in one place, together with our Marketplace, which provides a catalog of thousands of small and medium-sized
local and international companies. This development will leverage the Falabella.com brand to drive growth in our physical-
digital ecosystem, by providing customers with a unique experience.
• This launch has built the largest Marketplace in Chile, which presents more than 180 million monthly visitors with all the
brands and products of the entrepreneurs who sell on our site and App, which will accelerate the growth of their businesses.
• Integrating platforms into a single web site will better meet our customer’s requirements and increase their shopping
frequency with us.
• Unifying platforms will enable us to create more personalized and attractive offers for our customers, and to develop new
product categories.
• This new platform consolidates a technical process that we started years ago, by migrating our developments to proprietary
architecture. We have created our own development centers during this process, which currently concentrate the work of
more than 1,200 in-house developers.
• The new platform is fully integrated with our Fpay payment processing platform, which enables us to offer a unified,
personalized and seamless payment experience, together with a platform that provides financing solutions for consumers and
Marketplace Sellers.
HIGHLIGHTS OF THE PERIOD
Regional Platform

+99% Revenue
2021/2020
DEPARTMENT STORES HOME IMPROVEMENT SUPERMARKETS
+32% Revenue
2021/2019
+96% Revenue
2021/2020
+55% Revenue
2021/2019
+25% Revenue
2021/2020
+30% Revenue
2021/2019
Chile's retail businesses continue to grow rapidly with
double-digit growth even compared to 2019, despite
restrictions
03
Our online business continued to grow during the
second quarter04
0 3
• GMV reached US$ 1,212 million in 2Q21, an increase of US$ 336 million over the same period last year, driven by higher
growth in sales of proprietary products (+46%) and Marketplace products (+15%).
• Regional online penetration reached 28%.
• GMV reached US$ 4.1 billion over the last twelve months, 2.0x our GMV for the comparable period.
• Marketplace GMV reached US$ 238 million in 2Q21, which represents a 20% share of total online sales. Marketplace's GMV
reached US$ 877 million over the last twelve months.
• Almost 10 million orders were shipped across the region during the quarter, up 12% compared to 2Q20.
E-commerce in Chile
• GMV grew by 72% YoY during the quarter, driven by continued consumer dynamism, improved economic expectations due to
progress with the vaccination campaign, a successful Cyber event and liquidity resulting from withdrawals from individual
pension funds.
• Online channel penetration in Chile reached 31% during 2Q21.
• Marketplace sales grew by 65% in the second quarter and 167% over the last twelve months.
• Home Improvement continue to expand, achieving 138% growth compared to 2Q20. This is equivalent to sales of US$ 235
million in the quarter.
• GMV for Department Stores reached US$ 527 million during 2Q21, a 55% increase YoY. Home deliveries increased by 45%
compared to the previous year. Click & Collect represented 15% of total units sold through online channels in 2Q21.
• The falabella.com App captured 40% of the format's total online sales for the quarter.
• Fazil, the group's on-demand-delivery App, continues to grow and expand its coverage. One year after its launch, it had
reached almost 2 million visits during the second quarter, and total orders grew by 8.5x compared to the same period last
year. GMV continues to grow in triple digits (QoQ) and the sale of Falabella and Sodimac products through the App has
achieved strong growth.
Strong sales growth continued in every retail format in Chile during the second quarter, accompanied by sales at physical stores
recovering, together with sustained performance from e-commerce.
HIGHLIGHTS OF THE PERIOD

GMV 2Q20 % Total 2Q21 % Total Var % LTM
Retai l (1P) 669 76% 974 80% 46% 3.186
Deparment stores 509 58% 619 51% 22% 2.292
Home improvement 126 14% 305 25% 143% 750
Supermarkets 33 4% 49 4% 47% 144
Marketplace (3P) 207 24% 238 20% 15% 877
Total GMV 876 100% 1.212 100% 38% 4.063
GMV by country 2Q20 % Total 2Q21 % Total Var % LTM
Chile 485 55% 836 69% 72% 2.586
Perú 153 17% 214 18% 40% 774
Colombia 138 16% 70 6% -49% 375
Others 100 11% 92 8% -8% 329
Total GMV by country 876 100% 1.212 100% 38% 4.063
APPS PENETRATION OVER ONLINE SALES IN CHILE
40%Department Stores
23%Home Improvement
34%Supermarkets
0 4
E-commerce in Peru
• The penetration of online channels in Peru’s formats rose 18% during 2Q21, to reach US$ 214 million.
• Total Marketplace GMV in Peru grew by 39% in the quarter.
• Home Improvement GMV grew by 63% YoY, while Department Stores GMV grew by 47% YoY.
• The penetration of online channels for Supermarkets was 6%. The Fazil App continues to expand its coverage and order
processing capacity, which is supported by a dark store. Order volume reported a 6x increase over the same period last year.
E-commerce in Colombia
• The sustained participation of mobile channels in online sales was exceptional, with the Falabella App achieving a 26% share
of the format's total online sales compared to 22% in 2Q20.
• GMV decreased by 49% due to lower consumer dynamism after the social protests in Peru, and reached US$ 70 million.
Our mobile channels continue to gain traction
05• Apps for our retail formats continue to drive our customers, and strengthen their share of online sales.
• Apps are a fundamental component of our ecosystem, as they help us to improve our value proposal, increase our customer
contact and combine our physical and online shopping experience.
GROSS MERCHANDISE VOLUME (GMV) SUMMARY1 (US$ million)
1 GMV figures are rounded. GMV is calculated as gross online sales (including VAT) and calculated on a neutral FX basis, for the businesses Department Stores in Chile, Peru, Colombia and
Argentina; Home Improvement in Chile, Peru, Argentina, Brazil and Uruguay; Supermarkets in Chile and Peru; and the Linio businesses.
HIGHLIGHTS OF THE PERIOD

We continue to digitize our financial business06
0 5
We have accelerated our transformation into a digital bank
• We grew our customer base using Apps by 28% over the last 3 months to 3.9 million driven by issuing more credit and
debit cards through our channels.
• Issuing digital products continues to be a strong driver. During 2Q-2021 we issued:
o More than 195,000 digital cards, which represents 5.5x YoY growth.
o More than 50,000 passive digital accounts, which represents 38x YoY growth. We expect to continue opening digital
accounts, as a new journey comes into operation that opens accounts for customers in our loyalty program who are
not yet bank customers.
• Our customers are increasingly using our products
o CMR and debit purchases achieved 78% YoY growth, driven by issuing more cards, greater liquidity in Chile and
Peru, and increased customer preference for our payment methods.
• We continue to strengthen our digital capabilities and focus on our core markets
o We implemented new Artificial Intelligence (AI)-based risk models for credit card customer assessment in Peru and
Mexico, and also began building behavioral models using AI for cross-selling loans in Colombia and Peru.
o We expect to incorporate AI into all the region's capture and behavioral models during 2021, which will leverage
information from our customers’ relationships with the group and thereby substantially improve the predictability
of their credit risk.
Both our payment processing platform and our Fpay digital wallet experienced solid growth
• The group’s TPV (Fpay) reached US$ 801 million during 2Q21. TPV reached US$ 2,922 million over the last twelve months.
This quarter's growth is mainly due to the solid performance of our retailers' online channels and the cyber event in Chile with
record sales.
• Our wallet continues to attract customers and usage is growing. We reached more than 1.75 million Fpay downloads across
the region, and we achieved more than 330,000 Fpay downloads during 2Q-2021, which represents 8.1x YoY growth.
• We activated the Fpay QR payment button for the Banco Falabella App in Chile in April 2021, so that all banking App users
could contactlessly pay using a QR code on FPay in the On-Us and On-Them environments.
We continue to provide our customers across the region with the best digital experience when buying and using our products.
Financial product sales through digital channels represented 54% of total financial product sales over the last twelve months.
Our customers are increasingly interacting with our CMR points loyalty program throughout the region
• The total number of participants in the region has now risen to 12.6 million, an increase of 68% YoY.
• Customer interaction with the program has increased, reflected in 123% YoY growth in redemptions as of June 2021. This
growth has been driven by digital redemptions on the Banco Falabella Apps in Chile, Peru and the new functionality launched
in Colombia, which reached 33% of total redemptions. The new CMR points digital module for the retail sector was launched.
2 The total volume of sales using our proprietary payment processing platforms at our retailers and associated businesses.
HIGHLIGHTS OF THE PERIOD

Chile Peru Mexico Uruguay Format Supermarkets Supermarkets Home Improvement Home Improvement City Antofagasta Lima Leon Montevideo Surface area (m2) 2,755 1,400 10,800 8,770 Opened 1 2 1 1 Country Total 68 83 7 4
The Home Improvement business has continued to
perform well across the region07
0 6
• Home Improvement businesses continue to capitalize on consumer momentum in all markets.
• The segment's regional revenue grew by 109.6%. The online business for this format continues to expand and achieved sales
of US$ 328 million in the second quarter (+147% YoY) and US$ 812 million over the last twelve months (+179% YoY).
We continue to implement our selective physical
expansion plan08• During 2Q21, we opened one Tottus Supermarket in Chile and two in Peru, one Home Improvement store in Mexico and one
in Uruguay:
• During the third quarter, a new Home Improvement store was opened in Monterrey, Mexico on August 31, with 11,274 m2 of
floor area.
• Four Home Improvement stores were remodeled in Brazil from the Dicico to the Sodimac-Dicico format, so there are now 34
stores using this format:
⚬ The following remodeled stores were launched on May 12:
■ Limeira with 1,652 m2 of floor area.
■ Guarapinga with 2,071 m2 of floor area.
■ Santa Barbara D'Oeste with 1,982 m2 of floor area.
⚬ The 3,152 m2 Campinas store was launched on July 12.
⚬ The 2,353 m2 Sorocaba store was launched on August 12.
HIGHLIGHTS OF THE PERIOD
Chile
139%
BrazilPeru Colombia
23%
Argentina
96%
686%
73%
39%159%63%138%GMV Growth2Q21 YoY (%)
Revenues Growth2Q21 Local Currency
YoY (%)
1.469%

Sustainability Milestones09
0 7
• Falabella signed a fully renewable energy supply agreement for more than 240 stores, shopping centers and distribution
centers in Chile and Peru, which will result in estimated annual CO2 reductions of 261,000 tons. It also signed an electro-
mobility agreement in Chile, which involves setting up and operating charging centers for electric vehicles at stores, malls and
distribution centers throughout the country. Customers and logistics operators will then be able to charge their vehicles at
Falabella’s premises.
• Gender equity: Great Place to Work Chile published its ranking of the Best Places for Women to Work in Chile 2021, with the
aim of closing gender gaps in organizations. Falabella Retail achieved second place in the over 1,000 employees category.
Events during the period
10Risk rating
S&P reaffirmed Falabella's "BBB" rating and upgraded its outlook to stable
• S&P Global reaffirmed its "BBB" rating on August 3, 2021 and upgraded its outlook from negative to stable.
• This rating reflects the expectation that Falabella's businesses will continue their recovery during 2021, along with gradual
revenue and EBITDA growth during 2022. Its profitability will remain consistent with its peer group and its e-commerce
businesses are expected to gradually expand.
• The rating agency expects EBITDA to recover rapidly in 2021 and the debt ratio to remain between 3.0x and 3.5x over the
next two years, which is consistent with its risk rating.
Feller-Rate reaffirmed Falabella's "AA" local rating with a stable outlook
• Feller-Rate reaffirmed its "AA" rating on August 2, 2021, and upgraded its outlook from negative to stable.
• This rating is based on Falabella’s successful recovery since the second half of 2020. It is also based on the policies
implemented by management to mitigate the effects of the pandemic, which are reflected in reduced indebtedness and cost
efficiencies.
Business in Argentina
• The company announced the closure of the remaining three stores in Argentina on April 6, 2021, which completes closing
down the entire Department Store business in Argentina.
• It announced the transfer of its active credit card portfolio to Banco Columbia de Argentina on June 9, 2021, and informed its
customers that they can continue to use their cards as customers of Banco Columbia.
• The Home Improvement business continues to operate 7 stores in Argentina.
Final dividend
• A final dividend was paid on May 13, 2021 of CLP 5 per share (US$ 17 million in total) from 2020 earnings.
HIGHLIGHTS OF THE PERIOD

2Q20 % Rev. 2Q21 % Rev. Var %0 0 0 0 0
Revenues of Non-Banking Operations 2.004 3.285 63,9%
Revenues of Banking Operations 411 354 -13,9%
Total Revenues 2.415 100,0% 3.639 100,0% 50,7%
COGS of Non-Banking Operations (1.462) -60,5% (2.272) -62,4% 55,4%
COGS of Banking Operations (281) -11,7% (93) -2,6% -66,9%
Gross Profit 672 27,8% 1.274 35,0% 89,6%
SG&A Expenses (867) -35,9% (936) -25,7% 8,0%
Operational Income (195) -8 ,1% 338 9,3% -273,5%
Depreciation + Amortization 160 6,6% 155 4,3% -3,1%
EBITDA (35) -1 ,5% 493 13,6% -1502,6%
Other Income / (Expenses) 2 (2) -201,3%
Net Financial Income / (Cost) (57) (60) 6,0%
Profit / (Loss) in Associates (3) 4 -220,0%
Exchange Rate Differences (11) (17) 45,6%
Non-Operating Profit (70) -2 ,9% (75) -2 ,0% 7,1%
Profit Before Tax Expenses (265) -11,0% 264 7,2% -199,7%
Income Tax 72 (73) -201,6%
Minority Interest 16 (6) -136,1%
Net Profit / (Loss) (177) -7 ,3% 185 5,1% -204,7%
During the second quarter of 2021, the company's consolidated revenue was US$ 3,639 million, an increase of 50.7% YoY. This
increase is mainly due to the increase in revenue from retail businesses across the region, partially offset by lower revenue from
banking businesses.
• Retail formats in Chile performed well, with Department Store revenue growing by 98.5%, Home Improvement by
96% and Supermarket by 25%.
• Banking revenue fell by 13.9% mainly due to an 8.6% contraction in the loan portfolio YoY, which generated lower
interest and indexation income.
• Shopping centers reported growth of 110.5% YoY, associated with increased lease income due to an increase in leased
operating areas compared to 2Q20.
Gross profit reached US$ 1,274 million in 2Q21, an increase of 89.6% YoY, mainly due to:
• Higher contributions from Home Improvement in Chile, which increased its margin by 317 basis points, and
Department Stores in Chile, which increased it by 433 basis points, due to reductions in promotional activities by both
retailers.
• The Chilean banking business also produced a higher margin, explained by lower risk costs.
Consolidated EBITDA was US$ 493 million for the quarter, up from -US$ 35 million in the same period last year. This increase was
reflected in a 13.6% margin, mainly due to a higher contributions from retail businesses in Chile and banking businesses in Chile.
Net income was US$ 185 million for the second quarter of 2021, mainly due to higher contributions from Home Improvement in
Chile, Department Stores in Chile, Banco Falabella Chile, and to a lesser extent from Home Improvement in Peru and the real
estate business.
Consolidated Statements of Net Income 2Q21 (US$ million)
0 8
SUMMARIZED CONSOLIDATED RESULTS

Debt• Total debt for the non-bank businesses was US$ 4,663 million as of June 2021, a decrease of 26.2% YoY.
• Net debt reached US$ 3,543 million as of June 2021.
Cash and liquidityThe company's consolidated cash and cash equivalents totaled US$ 3,394 million as of June 30, 2021.
• Non-Banking Businesses: US$ 1,120 million.
• Banking Businesses: US$ 2,274 million.
0 9
3 EBITDA = Gross profit - distribution costs - administrative expenses - expenses by function + depreciation, Net financial debt = current financial liabilities + non-current financial
liabilities - hedging assets - cash and cash equivalents.4 Balances in US$ converted at the closing exchange rate for each country.5 Total consolidated financial debt includes CMR Argentina, but does not include Falabella's banking businesses, which are Banco Falabella Chile, Banco Falabella Peru and Banco
Falabella Colombia, or accrued interest. The repayment profile is based on the sum of principal repayments for each period.
Net Leverage
Non-Banking Businesses
Net Financial Debt / EBITDA
Non-Banking Businesses3
Debt Maturity Profile (MMUS$)
(Non-Banking Businesses) 4,5
Total Consolidated Financial Debt (excluding banking businesses): US$ 4,709 million
SUMMARIZED CONSOLIDATED RESULTS
1.030.92
Jun-20 Jun-21
5.86
2.58
Jun-21Jun-20
$232
$447
$1,103
$98
$474
$2,356
202420222021 2026+20252023

Financial results second quarter 2021
10
Index - Annexes
I. Retail revenue ..................................................................................................................................................................... 11
II. Results by business unit ...................................................................................................................................................... 12
III. Financial businesses ............................................................................................................................................................ 14
IV. Consolidated financial statements ...................................................................................................................................... 16
V. Gross merchandise volume (GMV) (CLP million) ................................................................................................................. 21
VI. Online Penetration .............................................................................................................................................................. 21
VII. Nominal Sales Growth per Equivalent Store - Same Store Sales (SSS) ................................................................................ 22
VIII. Number of Stores and Sales Areas for Retail Formats, ...................................................................................................... 23
IX. Number of Shopping Centers and Leasable Area of Real Estate Operators........................................................................ 23
X. Debt maturity Profile (CLP million) ...................................................................................................................................... 24
XI. Average Collection period, average Payment period and days of Inventory ...................................................................... 24
XII. Consolidated results as of June 2021 .................................................................................................................................. 25
Notes:
All figures in US dollars are calculated at the official exchange rate on July 1, 2021: CLP/US$ 727.76
Symbols for quarters: 1Q, 2Q, 3Q & 4Q.
Symbols for cumulative periods: 6M, 9M, 12M
Symbols for currencies: $: Chilean pesos; US$: US dollars; PEN: Peruvian nuevos soles; COP: Colombian pesos; ARS: Argentine pesos; BRL:
Brazilian reals.
Th: thousands; M: millions; B: billions.
YoY: compared to the same period for the previous year.
QoQ: compared to the immediately preceding quarter.

Financial results second quarter 2021
11
I . R E T A I L R E V E N U E
Retail revenue for 2Q21 (CLP million)1,2
Retail revenue for 6M21 (CLP million)
1 All variations are in nominal terms and have been calculated both in Chilean pesos and the local currency for each country. 2 Argentina's revenue is affected by IAS 29.
2Q20 2Q21 Var %Var Local
Currency %
Chile
Department Stores 241.080 478.632 98,5% 98,5%
Home Improvement 418.101 819.373 96,0% 96,0%
Supermarkets 196.993 246.257 25,0% 25,0%
Peru
Department Stores 46.894 155.853 232,4% 307,6%
Home Improvement 25.480 164.435 545,3% 685,9%
Supermarkets 282.018 243.608 -13,6% 9,1%
Colombia
Department Stores 71.738 80.103 11,7% 22,4%
Home Improvement 133.809 211.693 58,2% 73,4%
Argentina
Department Stores 22.929 18.941 -17,4% 9,8%
Home Improvement 11.746 21.901 86,5% 139,0%
Brazi l
Home Improvement 50.905 55.606 9,2% 23,0%
6M20 6M21 Var %Var Local
Currency %
Chile
Department Stores 541.061 904.101 67,1% 67,1%
Home Improvement 946.422 1.547.723 63,5% 63,5%
Supermarkets 382.409 468.455 22,5% 22,5%
Peru
Department Stores 168.687 277.135 64,3% 99,6%
Home Improvement 189.018 344.608 82,3% 120,8%
Supermarkets 535.835 495.801 -7,5% 13,6%
Colombia
Department Stores 150.109 158.818 5,8% 17,7%
Home Improvement 343.480 463.367 34,9% 50,6%
Argentina
Department Stores 65.076 52.016 -20,1% 22,6%
Home Improvement 34.687 41.962 21,0% 85,6%
Brazi l
Home Improvement 100.095 104.236 4,1% 28,4%

Financial results second quarter 2021
12
I I . R E S U L T S B Y B U S I N E S S U N I T
Results by segment 2Q21 (CLP million)
Chile
International businesses
Others
Department Stores Home Improvement Supermarkets
2Q20 2Q21 (%, bps) 2Q20 2Q21 (%, bps) 2Q20 2Q21 (%, bps)
Revenues 241.080 478.632 98,5% 418.101 819.373 96,0% 196.993 246.257 25,0%
Gross Profit 70.044 159.797 128,1% 119.084 259.331 117,8% 49.912 67.694 35,6%
Gross Margin 29,1% 33,4% 433 28,5% 31,6% 317 25,3% 27,5% 215
SG&A (117.545) (132.541) 12,8% (150.585) (166.228) 10,4% (55.986) (59.748) 6,7%
SG&A / Revenues -48,8% -27,7% 2107 -36,0% -20,3% 1573 -28,4% -24,3% 416
Operating Profit (47.501) 27.256 -157,4% (31.501) 93.103 -395,6% (6.074) 7.946 -230,8%
Operating Margin -19,7% 5,7% 2540 -7,5% 11,4% 1890 -3,1% 3,2% 631
EBITDA (27.988) 46.506 -266,2% (7.612) 119.243 -1666,6% 4.942 19.698 298,6%
EBITDA Margin -11,6% 9,7% 2133 -1,8% 14,6% 1637 2,5% 8,0% 549
Banco Falabella Chile
2Q20 2Q21 (%, bps)
Revenues 197.364 171.922 -12,9%
Gross Profit 68.855 143.853 108,9%
Gross Margin 34,9% 83,7% 4879
SG&A (50.166) (65.681) 30,9%
SG&A / Revenues -25,4% -38,2% -1279
Operating Profit 18.689 78.172 318,3%
Operating Margin 9,5% 45,5% 3600
EBITDA 23.655 83.204 251,7%
EBITDA Margin 12,0% 48,4% 3641
Peru Colombia Argentina Brazi l
2Q20 2Q21 (%, bps) 2Q20 2Q21 (%, bps) 2Q20 2Q21 (%, bps) 2Q20 2Q21 (%, bps)
Revenues 410.481 612.283 49,2% 126.050 134.100 6,4% 43.287 45.522 5,2% 50.905 55.606 9,2%
Gross Profit 97.361 185.530 90,6% 36.191 54.067 49,4% 20.951 19.845 -5,3% 17.064 20.149 18,1%
Gross Margin 23,7% 30,3% 658 28,7% 40,3% 1161 48,4% 43,6% -481 33,5% 36,2% 271
SG&A (148.479) (162.202) 9,2% (41.035) (57.869) 41,0% (27.522) (24.516) -10,9% (15.894) (17.355) 9,2%
SG&A / Revenues -36,2% -26,5% 968 -32,6% -43,2% -1060 -63,6% -53,9% 973 -31,2% -31,2% 1
Operating Profit (51.118) 23.328 -145,6% (4.844) (3.802) -21,5% (6.571) (4.671) -28,9% 1.170 2.794 138,8%
Operating Margin -12,5% 3,8% 1626 -3,8% -2,8% 101 -15,2% -10,3% 492 2,3% 5,0% 273
EBITDA (20.271) 48.408 -338,8% 2.784 3.638 30,6% (3.627) (4.082) 12,5% 3.831 5.317 38,8%
EBITDA Margin -4,9% 7,9% 1284 2,2% 2,7% 50 -8,4% -9,0% -59 7,5% 9,6% 204
P laza S.A. Other, el imnation & anulment Falabella
2Q20 2Q21 (%, bps) 2Q20 2Q21 (%, bps) 2Q20 2Q21 (%, bps)
Revenues 22.556 47.479 110,5% 50.970 37.346 -26,7% 1.757.788 2.648.519 50,7%
Gross Profit 4.190 26.132 523,7% 5.434 (8.980) -265,3% 489.086 927.418 89,6%
Gross Margin 18,6% 55,0% 3646 10,7% -24,0% -3471 27,8% 35,0% 719
SG&A (15.769) (8.665) -45,1% (8.013) 13.627 -270,1% (630.995) (681.178) 8,0%
SG&A / Revenues -69,9% -18,3% 5166 -15,7% 36,5% 5221 -35,9% -25,7% 1018
Operating Profit (11.579) 17.467 -250,9% (2.580) 4.648 -280,2% (141.909) 246.240 -273,5%
Operating Margin -51,3% 36,8% 8812 -5,1% 12,4% 1751 -8,1% 9,3% 1737
EBITDA 1.689 31.424 1760,5% (2.997) 5.637 -288,1% (25.594) 358.993 -1502,7%
EBITDA Margin 7,5% 66,2% 5870 -5,9% 15,1% 2098 -1,5% 13,6% 1501

Financial results second quarter 2021
13
Results by segment 6M21 (CLP million)
Chile
International businesses
Others
Department Stores Home Improvement Supermarkets
6M20 6M21 (%, bps) 6M20 6M21 (%, bps) 6M20 6M21 (%, bps)
Revenues 541.061 904.101 67,1% 946.422 1.547.723 63,5% 382.409 468.455 22,5%
Gross Profit 158.113 284.932 80,2% 275.713 493.367 78,9% 95.637 127.400 33,2%
Gross Margin 29,2% 31,5% 229 29,1% 31,9% 274 25,0% 27,2% 219
SG&A (235.647) (265.899) 12,8% (290.994) (315.135) 8,3% (108.176) (114.228) 5,6%
SG&A / Revenues -43,6% -29,4% 1.414 -30,7% -20,4% 1.039 -28,3% -24,4% 390
Operating Profit (77.534) 19.033 -124,5% (15.281) 178.232 -1266,4% (12.539) 13.172 -205,0%
Operating Margin -14,3% 2,1% 1.644 -1,6% 11,5% 1.313 -3,3% 2,8% 609
EBITDA (38.405) 57.674 -250,2% 32.418 228.741 605,6% 9.181 36.215 294,5%
EBITDA Margin -7,1% 6,4% 1.348 3,4% 14,8% 1.135 2,4% 7,7% 533
Banco Falabella Chile
6M20 6M21 (%, bps)
Revenues 417.488 343.055 -17,8%
Gross Profit 174.448 308.413 76,8%
Gross Margin 41,8% 89,9% 4.812
SG&A (109.812) (130.734) 19,1%
SG&A / Revenues -26,3% -38,1% -1.181
Operating Profit 64.636 177.679 174,9%
Operating Margin 15,5% 51,8% 3.631
EBITDA 74.079 187.481 153,1%
EBITDA Margin 17,7% 54,7% 3.691
Peru Colombia Argentina Brazi l
6M20 6M21 (%, bps) 6M20 6M21 (%, bps) 6M20 6M21 (%, bps) 6M20 6M21 (%, bps)
Revenues 1.034.965 1.215.157 17,4% 270.073 267.630 -0,9% 122.977 104.898 -14,7% 100.095 104.236 4,1%
Gross Profit 286.913 360.694 25,7% 96.437 103.309 7,1% 60.691 50.151 -17,4% 34.740 38.306 10,3%
Gross Margin 27,7% 29,7% 196 35,7% 38,6% 289 49,4% 47,8% -154 34,7% 36,7% 204
SG&A (317.417) (320.288) 0,9% (97.664) (115.792) 18,6% (66.613) (50.936) -23,5% (34.593) (33.347) -3,6%
SG&A / Revenues -30,7% -26,4% 431 -36,2% -43,3% -710 -54,2% -48,6% 561 -34,6% -32,0% 257
Operating Profit (30.504) 40.406 -232,5% (1.228) (12.483) 916,8% (5.922) (785) -86,7% 147 4.959 3273,5%
Operating Margin -2,9% 3,3% 627 -0,5% -4,7% -421 -4,8% -0,7% 407 0,1% 4,8% 461
EBITDA 30.712 91.548 198,1% 14.659 2.342 -84,0% 466 497 6,7% 6.010 9.938 65,4%
EBITDA Margin 3,0% 7,5% 457 5,4% 0,9% -455 0,4% 0,5% 9 6,0% 9,5% 353
P laza S.A. Other, el imnation & anulment
6M20 6M21 (%, bps) 6M20 6M21 (%, bps) 6M20 6M21 (%, bps)
Revenues 96.971 107.100 10,4% 84.035 65.373 -22,2% 3.996.497 5.127.728 28,3%
Gross Profit 57.823 64.132 10,9% 10.237 (8.647) -184,5% 1.250.751 1.822.057 45,7%
Gross Margin 59,6% 59,9% 25 12,2% -13,2% -2.541 31,3% 35,5% 424
SG&A (23.668) (13.519) -42,9% (12.714) 26.187 -306,0% (1.297.298) (1.333.691) 2,8%
SG&A / Revenues -24,4% -12,6% 1.178 -15,1% 40,1% 5.519 -32,5% -26,0% 645
Operating Profit 34.155 50.613 48,2% (2.477) 17.540 -808,1% (46.547) 488.366 -1149,2%
Operating Margin 35,2% 47,3% 1.204 -2,9% 26,8% 2.978 -1,2% 9,5% 1.069
EBITDA 60.088 78.062 29,9% (3.303) 18.738 -667,3% 185.904 711.236 282,6%
EBITDA Margin 62,0% 72,9% 1.092 -3,9% 28,7% 3.259 4,7% 13,9% 922
Falabella

Financial results second quarter 2021
14
I I I . F I N A N C I A L B U S I N E S S E S
Banco Falabella: Statement of Net Income
Banco Falabella Chile Banco Falabella Perú Banco Falabella Colombia
2Q20 2Q21 Var. % 2Q20 2Q21 Var. % 2Q20 2Q21 Var. %
(Mn CLP) (Th SOL) (Mn COP)
Interest income and adjustements 173.690 142.807 -17,8% 185.710 154.066 -17,0% 182.370 177.338 -2,8%
Interest expense and adjustements (21.441) (12.942) -39,6% (31.542) (14.311) -54,6% (40.836) (28.764) -29,6%
Net interest income and adjustments 152.249 129.865 -14,7% 154.168 139.754 -9,3% 141.534 148.574 5,0%
Fee and commission income 23.031 27.706 20,3% 41.194 41.863 1,6% 51.711 66.778 29,1%
Fee and commission expense (12.434) (12.972) 4,3% (9.067) (5.519) -39,1% (14.341) (15.594) 8,7%
Net fee and commission income 10.597 14.733 39,0% 32.127 36.344 13,1% 37.370 51.184 37,0%
Net income from financial operations 8.093 1.685 -79,2% 853 4.280 401,6% 6.621 7.397 11,7%
Other operating net income 642 1.410 119,4% 77 (763) -1093,8% 642 479 -25,4%
Operational Income 171.581 147.693 -13,9% 187.225 179.615 -4,1% 186.166 207.634 11,5%
Provision for loan losses (102.727) (3.840) -96,3% (151.187) (63.853) -57,8% (103.090) (74.984) -27,3%
Operating expenses (50.166) (65.681) 30,9% (111.840) (147.601) 32,0% (86.224) (127.107) 47,4%
Operating Income 18.689 78.172 318,3% (75.802) (31.839) -58,0% (3.147) 5.543 -276,1%
Net Income 16.160 58.743 263,5% (54.710) (24.350) -55,5% (2.287) 1.365 -159,7%
Efficiency ratio 29,2% 44,5% 59,7% 82,2% 46,3% 61,2%
6M20 6M21 Var. % 6M20 6M21 Var. % 6M20 6M21 Var. %
(Mn CLP) (Th SOL) (Mn COP)
Interest income and adjustements 362.324 285.246 -21,3% 397.863 300.980 -24,4% 376.892 349.138 -7,4%
Interest expense and adjustements (47.980) (27.308) -43,1% (65.252) (34.338) -47,4% (82.787) (56.997) -31,2%
Net interest income and adjustments 314.344 257.938 -17,9% 332.611 266.642 -19,8% 294.104 292.142 -0,7%
Fee and commission income 54.227 55.559 2,5% 107.490 92.471 -14,0% 119.234 131.932 10,6%
Fee and commission expense (32.339) (26.078) -19,4% (21.937) (15.852) -27,7% (30.768) (28.414) -7,7%
Net fee and commission income 21.888 29.481 34,7% 85.553 76.619 -10,4% 88.466 103.518 17,0%
Net income from financial operations 10.291 5.967 -42,0% 2.408 6.847 184,3% 6.971 18.095 159,6%
Other operating net income 936 2.250 140,2% 5.750 356 -93,8% 870 811 -6,7%
Operational Income 347.459 295.636 -14,9% 426.323 350.465 -17,8% 390.411 414.566 6,2%
Provision for loan losses (173.012) 12.777 -107,4% (237.268) (121.312) -48,9% (156.711) (160.344) 2,3%
Operating expenses (109.812) (130.734) 19,1% (245.552) (272.606) 11,0% (191.283) (243.203) 27,1%
Operating Income 64.636 177.678 174,9% (56.497) (43.453) -23,1% 42.417 11.018 -74,0%
Net Income 52.258 135.021 158,4% (41.814) (33.314) -20,3% 26.150 4.555 -82,6%
Efficiency ratio 31,6% 44,2% 57,6% 77,8% 49,0% 58,7%

Financial results second quarter 2021
15
Banco Falabella: Statement of Financial Position and Operating Data3
Sales percentage using CMR cards 4 (LTM)
3 ROA and ROE at Banco Falabella Chile is based on LTM net income after integrating the Bank with CMR. 4 Sales percentage using CMR cards is sales using this card compared to total sales for each business.
Banco Falabella Chile Banco Falabella Perú Banco Falabella Colombia
jun-20 jun-21 Var. % jun-20 jun-21 Var. % jun-20 jun-21 Var. %
Selected Balance Sheet Accounts (Mn CLP) (Th SOL) (Mn COP)
Cash and deposits in banks 276.590 844.122 205,2% 510.018 471.490 -7,6% 143.539 141.460 -1,4%
Trading investments 1.056.828 1.014.773 -4,0% 764.290 392.839 -48,6% 561.196 674.289 20,2%
Loans from customers, gross 3.543.519 3.372.851 -4,8% 2.784.881 2.513.764 -9,7% 3.634.309 4.001.488 10,1%
Allowance for loan losses (285.913) (184.791) -35,4% (326.041) (248.176) -23,9% (274.922) (306.604) 11,5%
Loans from customers, net 3.257.606 3.188.061 -2,1% 2.458.839 2.265.588 -7,9% 3.359.388 3.694.884 10,0%
Total Assets 5.746.938 5.774.058 0,5% 4.232.131 3.701.363 -12,5% 4.410.994 4.892.657 10,9%
Deposits 727.653 1.782.898 145,0% 551.980 549.043 -0,5% 778.967 1.031.267 32,4%
Time deposits 1.945.409 1.143.270 -41,2% 2.332.591 2.043.841 -12,4% 2.570.369 2.644.887 2,9%
Total deposits 2.673.061 2.926.167 9,5% 2.884.572 2.592.884 -10,1% 3.349.337 3.676.155 9,8%
Other financial liabilities 288.191 369.373 28,2% 258.424 22.192 -91,4% 34.260 216.859 533,0%
Total Liabilities 4.979.091 4.848.905 -2,6% 3.500.786 2.985.402 -14,7% 3.796.137 4.291.547 13,1%
Total Equity 767.847 925.153 20,5% 731.346 715.961 -2,1% 614.857 601.110 -2,2%
Total Liabilities + Total Equity 5.746.938 5.774.058 0,5% 4.232.131 3.701.363 -12,5% 4.410.994 4.892.657 10,9%
Operational information
NPL (+90 days) 161.457 49.146 -69,6% 128.068 99.190 -22,5% 92.736 117.242 26,4%
Current, Saving and checking Accounts 960.562 1.156.183 20,4% 1.014.168 1.053.238 3,9% 1.618.551 1.735.567 7,2%
Open Accounts (with balance) 2.692.063 2.643.140 -1,8% 939.562 971.421 3,4% 983.365 1.074.606 9,3%
Average Loan (local currency) 1.316.284 1.276.077 -3,1% 2.964 2.588 -12,7% 3.695.789 3.723.679 0,8%
Duration (months) 5,7 5,5 -2,7% 9,1 9,0 -1,8% 16,5 16,2 -1,8%
ATMs 371 387 4,3% 170 153 -10,0% 66 66 0,0%
Branches 187 145 -22,5% 68 58 -14,7% 93 93 0,0%
Ratios
NPL / Loans from customers, gross 4,6% 1,5% 4,6% 3,9% 2,6% 2,9%
Allowance for loan losses/NPL 1,8 3,8 2,5 2,5 3,0 2,6
Basilea 15,7% 22,0% 16,2% 13,3% 11,7% 11,6%
ROAE 18,1% 33,1% -0,8% -15,2% 15,4% 1,5%
ROAA 2,5% 4,3% -0,1% -2,5% 2,2% 0,2%
1Q19 2Q19 3Q19 4Q19 1Q20 2Q20 3Q20 4Q20 1Q21 2Q21
Chile - Falabella 47,4% 47,5% 47,7% 47,2% 47,7% 49,1% 49,0% 45,5% 44,9% 43,4%
Chile - Sodimac 26,9% 26,7% 26,4% 26,3% 25,8% 25,6% 23,2% 20,8% 18,9% 17,3%
Chile - Tottus 20,3% 20,4% 20,5% 18,7% 18,8% 17,9% 16,2% 15,2% 14,9% 14,8%
Perú - Falabella, Sodimac, Tottus 36,5% 36,7% 37,1% 37,4% 36,9% 35,7% 34,2% 33,1% 32,9% 33,9%
Colombia - Falabella y Sodimac 23,4% 23,4% 23,3% 25,7% 23,5% 23,1% 23,0% 22,0% 21,8% 22,1%
Argentina - Falabella y Sodimac 21,2% 19,8% 17,6% 14,8% 15,1% 15,2% 16,2% 15,4% 12,7% 10,4%

Financial results second quarter 2021
16
I V . C O N S O L I D A T E D F I N A N C I A L S T A T E M E N T S
For the period
ended as of
For the period
ended as of
30-jun-21 30-jun-20
TH CLP TH CLP
Statement of Income
Non-banking Business
Revenue from continuing operations 4.608.667.199 3.346.062.707
Cost of sales (3.187.574.085) (2.364.939.732)
Gross Profit 1 .421.093.114 981.122.975
Distribution costs (100.548.409) (71.717.121)
Administrative expenses (939.987.010) (967.938.397)
Other expenses, by function (63.449.581) (48.668.056)
Other gains (losses) (5.761.763) 1.761.793
Financial income 43.552.868 53.396.879
Financial expenses (100.942.076) (114.882.092)
Equity interest in profits (losses) of associates accounted for using the equity method 8.117.858 (5.074.500)
Foreign currency translation (27.257.443) (21.441.132)
Income from indexation units (25.082.049) (15.020.236)
Profit (Loss), before Taxes 209.735.509 (208.459.887)
Income tax expense (56.456.626) 47.288.857
Profit (Loss) from Non-banking Business 153.278.883 (161.171.030)
Banking Serv ices (Presentation)
Interest and indexation revenue 416.064.698 541.218.546
Interest and indexation expenses (48.108.631) (82.728.754)
Net Income from Interest and Indexation 367.956.067 458.489.792
Fee revenue 100.682.272 108.249.749
Fee expenses (37.285.648) (47.377.854)
Net Fee Income 63.396.624 60 .871.895
Net income from financial operations 14.019.430 20.000.310
Net exchange gains (losses) (4.044.827) (7.682.178)
Other operating income 2.314.078 965.939
Provision for loan losses (42.677.485) (263.017.600)
Total O perating Income, net 400.963.887 269.628.158
Employee remunerations and expenses (63.722.189) (73.333.702)
Administrative expenses (121.607.133) (96.035.062)
Depreciation and amortization (18.796.965) (19.882.195)
Other operating expenses (25.579.662) (19.723.228)
Total O perating Expenses (229.705.949) (208.974.187)
O perating Income 171.257.938 60 .653.971
Income from equity method investments in companies 216.415 232.562
Income before Income Taxes 171.474.353 60 .886.533
Income tax expense (42.001.885) (12.656.227)
Profit ( loss) from Banking Business 129.472.468 48 .230.306
Profit (Loss) 282.751.351 (112.940.724)
Profit ( loss), Attributable to:
Owners of the parent 272.174.706 (111.932.483)
Non-controlling interests 10.576.645 (1.008.241)
Profit (Loss) 282.751.351 (112.940.724)
Earnings ( loss) per share
Basic earnings ( loss) per share
Basic earnings (loss) per share from continuing operations 0,110 (0,040)
Basic Earnings (Loss) per Share 0,110 (0 ,040)
Di luted Earnings (Loss) per Share
Diluted earnings (loss) per share from continuing operations 0,110 (0,040)
Di luted Earnings (Loss) per Share 0,110 (0 ,040)

Financial results second quarter 2021
17
Balance Sheet 30-jun-21 31-dic -20
TH CLP TH CLP
Assets
Non-banking Businesses
Current assets
Cash and cash equivalents 814.874.990 1.216.193.920
Other financial assets 40.912.734 41.163.435
Other non-financial assets 107.414.202 103.954.106
Trade and other accounts receivable 337.908.778 416.572.521
Accounts receivable from related parties 31.307.796 33.374.856
Inventory 1.318.900.345 1.161.244.547
Tax assets 59.626.187 59.292.980
Total of current assets different from those assets or disposal groups c lassif ied as
held for sale or as held for distribution to owners 2 .710.945.032 3 .031.796.365
Non-current assets or disposal groups classified as held for sale or as held for distribution to owners 29.052.360 29.095.216
Non-current assets or disposal groups c lassif ied as held for sale or as held for
distribution to owners 29 .052.360 29 .095.216
Total Current Assets 2 .739.997.392 3 .060.891.581
Non-current Assets
Other financial assets 270.482.866 195.004.590
Other non-financial assets 85.751.783 91.649.259
Accounts receivable from clients 10.331.683 5.594.155
Accounts receivable to related parties 27.394.720 13.841.640
Investments accounted for using the equity method 190.473.348 194.146.313
Intangible assets other than goodwill 338.482.566 340.551.306
Goodwill 599.753.837 607.108.378
Property, plant and equipment 3.312.870.600 3.388.090.202
Investment properties 3.295.573.181 3.315.319.472
Non-current tax assets 13.196.797 16.538.022
Deferred tax assets 254.325.504 233.685.099
Total Non-current Assets 8 .398.636.885 8 .401.528.436
Total Assets – Non-banking Business 11 .138.634.277 11 .462.420.017
Banking Serv ices Assets (Presentation)
Cash and bank deposits 959.617.879 336.805.631
Transactions with settlement in progress 73.679.701 273.561.309
Financial assets held for trading 50.623.192 450.773.778
Retro-purchase agreements and securities loans 25.159.333 15.016.800
Financial derivative contracts 351.482.634 640.330.966
Loans and accounts receivable from clients 4.365.910.139 4.304.988.052
Available for sale instruments 1.157.930.990 1.071.527.684
Investments in companies 3.212.257 3.134.482
Intangibles 74.068.570 76.525.371
Property, plant and equipment 57.030.120 58.890.879
Current taxes 19.471.336 13.217.364
Deferred taxes 63.860.538 66.492.338
Other assets 156.704.498 144.844.995
Total Bank Serv ices Assets 7 .358.751.187 7 .456.109.649
Total Assets 18 .497.385.464 18 .918.529.666

Financial results second quarter 2021
18
30-jun-21 31-dic -20
TH CLP TH CLP
Net Equity and Liabi l ities
Non-banking Business
Other financial liabilities 444.441.833 530.542.382
Leasing liabilities, current 80.001.498 79.955.074
Trade and other accounts payable 1.047.038.783 1.145.100.927
Accounts payable to related parties 21.350.134 18.084.369
Other current provisions 25.713.309 26.052.956
Current tax liabilities 67.704.653 22.623.827
Employee benefits provisions 152.914.196 145.574.678
Other non-financial liabilities 174.822.569 194.908.389
Total Current Liabi l ities 2 .013.986.975 2 .162.842.602
Non-current Liabi l ities
Other financial liabilities 2.970.045.348 3.229.990.163
Leasing liabilities, non-current 857.019.228 853.592.987
Trade and other accounts payable, non-current 1.090.793 1.074.634
Other long-term provisions 8.412.178 8.425.778
Deferred tax liabilities 588.842.538 591.807.294
Employee benefits provision 42.674.355 43.599.751
Other non-financial liabilities 48.231.632 50.636.869
Total Non-current Liabi l ities 4 .516.316.072 4 .779.127.476
Total Non-banking Business Liabi l ities 6 .530.303.047 6 .941.970.078
Banking Serv ices Liabi l ities (Presentation)
Deposits and other demand liabilities 2.003.099.155 1.549.896.493
Transactions with settlement in progress 70.023.002 265.976.430
Time deposits and other term deposits 2.100.566.310 2.421.271.205
Financial derivative contracts 317.407.364 587.247.845
Due to banks 602.010.922 341.118.713
Debt instruments issued 206.606.472 205.447.491
Other financial obligations 68.856.905 74.735.593
Leasing liabilities 25.772.532 27.237.056
Deferred taxes 12.634.701 13.390.117
Provisions 37.567.068 31.025.702
Other liabilities 328.396.798 473.957.252
Total Banking Serv ices Liabi l ities 5 .772.941.229 5 .991.303.897
Total Liabi l ities 12 .303.244.276 12 .933.273.975
Net Equity - -
Issued capital 919.419.389 919.419.389
Retained earnings 4.728.423.625 4.459.532.797
Share premium 93.482.329 93.482.329
Own shares in portfolio (27.738.111) (43.405.118)
Other reserves (475.110.591) (407.289.735)
Equity attributable to owners of the parent 5 .238.476.641 5 .021.739.662
Non-controlling interests 955.664.547 963.516.029
Total Equity 6 .194.141.188 5 .985.255.691
Total Equity and Liabi l ities 18 .497.385.464 18 .918.529.666
Financial results second quarter 2021
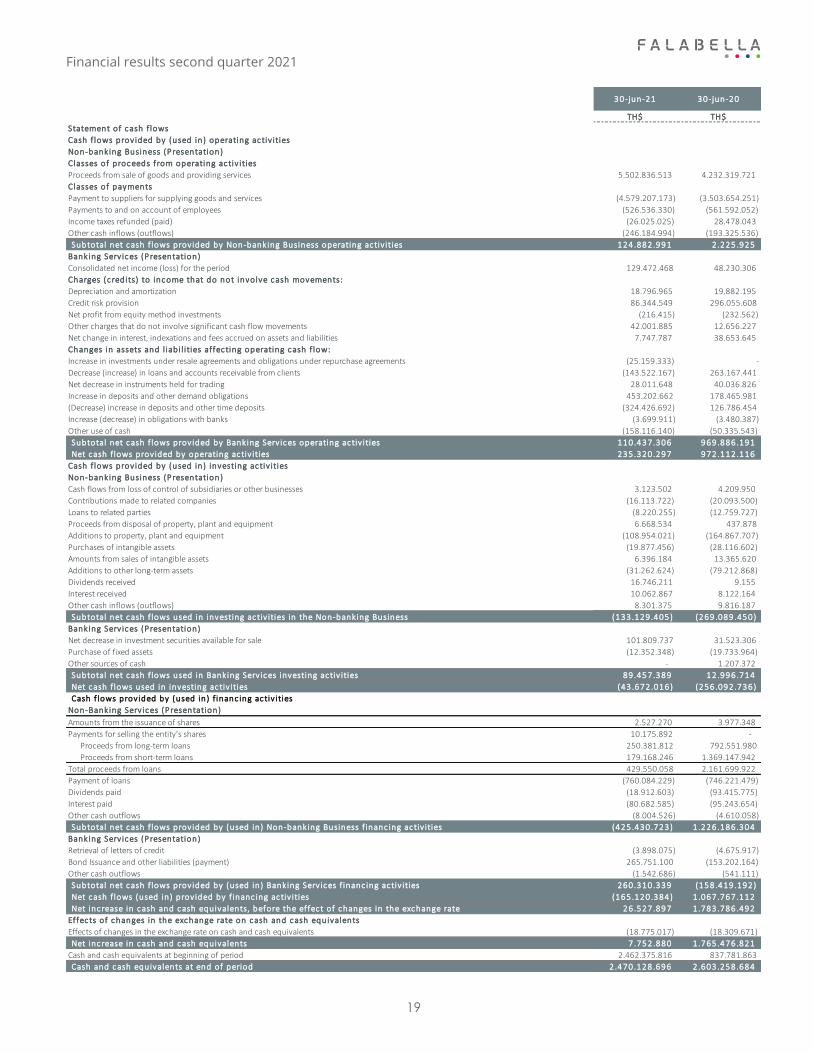
19
30-jun-21 30-jun-20
TH$ TH$
Statement of cash f lows
Cash f lows provided by (used in) operating ac tiv ities
Non-banking Business (Presentation)
Classes of proceeds from operating ac tiv ities
Proceeds from sale of goods and providing services 5.502.836.513 4.232.319.721
Classes of payments
Payment to suppliers for supplying goods and services (4.579.207.173) (3.503.654.251)
Payments to and on account of employees (526.536.330) (561.592.052)
Income taxes refunded (paid) (26.025.025) 28.478.043
Other cash inflows (outflows) (246.184.994) (193.325.536)
Subtotal net cash f lows provided by Non-banking Business operating ac tiv ities 124 .882.991 2 .225.925
Banking Serv ices (Presentation)
Consolidated net income (loss) for the period 129.472.468 48.230.306
Charges (c redits) to income that do not involve cash movements:
Depreciation and amortization 18.796.965 19.882.195
Credit risk provision 86.344.549 296.055.608
Net profit from equity method investments (216.415) (232.562)
Other charges that do not involve significant cash flow movements 42.001.885 12.656.227
Net change in interest, indexations and fees accrued on assets and liabilities 7.747.787 38.653.645
Changes in assets and l iabi l ities affec ting operating cash f low:
Increase in investments under resale agreements and obligations under repurchase agreements (25.159.333) -
Decrease (increase) in loans and accounts receivable from clients (143.522.167) 263.167.441
Net decrease in instruments held for trading 28.011.648 40.036.826
Increase in deposits and other demand obligations 453.202.662 178.465.981
(Decrease) increase in deposits and other time deposits (324.426.692) 126.786.454
Increase (decrease) in obligations with banks (3.699.911) (3.480.387)
Other use of cash (158.116.140) (50.335.543)
Subtotal net cash f lows provided by Banking Serv ices operating ac tiv ities 110 .437.306 969 .886.191
Net cash f lows provided by operating ac tiv ities 235 .320.297 972 .112.116
Cash f lows provided by (used in) investing ac tiv ities
Non-banking Business (Presentation)
Cash flows from loss of control of subsidiaries or other businesses 3.123.502 4.209.950
Contributions made to related companies (16.113.722) (20.093.500)
Loans to related parties (8.220.255) (12.759.727)
Proceeds from disposal of property, plant and equipment 6.668.534 437.878
Additions to property, plant and equipment (108.954.021) (164.867.707)
Purchases of intangible assets (19.877.456) (28.116.602)
Amounts from sales of intangible assets 6.396.184 13.365.620
Additions to other long-term assets (31.262.624) (79.212.868)
Dividends received 16.746.211 9.155
Interest received 10.062.867 8.122.164
Other cash inflows (outflows) 8.301.375 9.816.187
Subtotal net cash f lows used in investing ac tiv ities in the Non-banking Business (133.129.405) (269.089.450)
Banking Serv ices (Presentation)
Net decrease in investment securities available for sale 101.809.737 31.523.306
Purchase of fixed assets (12.352.348) (19.733.964)
Other sources of cash - 1.207.372
Subtotal net cash f lows used in Banking Serv ices investing ac tiv ities 89 .457.389 12 .996.714
Net cash f lows used in investing ac tiv ities (43 .672.016) (256.092.736)
Cash f lows provided by (used in) f inanc ing ac tiv ities
Non-Banking Serv ices (Presentation)
Amounts from the issuance of shares 2.527.270 3.977.348
Payments for selling the entity's shares 10.175.892 -
Proceeds from long-term loans 250.381.812 792.551.980
Proceeds from short-term loans 179.168.246 1.369.147.942
Total proceeds from loans 429.550.058 2.161.699.922
Payment of loans (760.084.229) (746.221.479)
Dividends paid (18.912.603) (93.415.775)
Interest paid (80.682.585) (95.243.654)
Other cash outflows (8.004.526) (4.610.058)
Subtotal net cash f lows provided by (used in) Non-banking Business f inanc ing ac tiv ities (425.430.723) 1 .226.186.304
Banking Serv ices (Presentation)
Retrieval of letters of credit (3.898.075) (4.675.917)
Bond Issuance and other liabilities (payment) 265.751.100 (153.202.164)
Other cash outflows (1.542.686) (541.111)
Subtotal net cash f lows provided by (used in) Banking Serv ices f inanc ing ac tiv ities 260 .310.339 (158.419.192)
Net cash f lows (used in) provided by f inanc ing ac tiv ities (165.120.384) 1 .067.767.112
Net increase in cash and cash equivalents, before the effect of changes in the exchange rate 26 .527.897 1 .783.786.492
Effects of changes in the exchange rate on cash and cash equivalents
Effects of changes in the exchange rate on cash and cash equivalents (18.775.017) (18.309.671)
Net increase in cash and cash equivalents 7 .752.880 1 .765.476.821
Cash and cash equivalents at beginning of period 2.462.375.816 837.781.863
Cash and cash equivalents at end of period 2 .470.128.696 2 .603.258.684

Financial results second quarter 2021
20
Cash Flow - Chilean Businesses (CLP million)
Cash Flow - International Businesses (CLP million)
June 2021 Department
Stores
Home
Improvement Supermarkets Banco Falabella P laza S.A.
Cash flow from operating activities (30.264.019) 222.975.880 3.621.839 137.443.642 78.686.038
Cash flow from investing activities (19.986.429) (20.121.564) (12.936.116) 91.494.544 (24.959.156)
Cash flow from financing activities 26.658.197 (209.566.288) 3.718.381 217.504.723 (174.344.480)
Increase (decrease) in cash and cash equivalents (23.592.251) (6 .711.972) (5 .595.896) 446.442.909 (120.617.598)
Impact of exchange rate differences on cash and cash equivalents 209.470 (82.474) (14.606) 0 (597.601)
Cash and cash equivalents at the beginning of the period 45.439.783 48.881.590 11.250.913 1.093.163.695 202.514.434
Cash and cash equivalents at the end of the period 22.057.002 42.087.144 5.640.411 1.539.606.604 81.299.235
June 2020 Department
Stores
Home
Improvement Supermarkets Banco Falabella P laza S.A.
Cash flow from operating activities (17.917.317) 132.750.028 11.868.051 705.385.658 48.033.208
Cash flow from investing activities (199.094.080) (36.901.923) (23.335.346) 165.921.897 (59.745.915)
Cash flow from financing activities 173.999.078 (78.707.803) 7.439.292 (262.995.911) 258.229.048
Increase (decrease) in cash and cash equivalents (43.012.319) 17.140.302 (4 .028.003) 608.311.644 246.516.341
Impact of exchange rate differences on cash and cash equivalents (101.670) (1.479.375) (14.337) 0 (1.250.160)
Cash and cash equivalents at the beginning of the period 55.899.858 22.797.653 13.473.556 414.080.602 35.722.612
Cash and cash equivalents at the end of the period 12.808.567 38.458.580 9.430.290 1.022.392.246 280.988.793
June 2021 Peru Colombia Argentina Brazi l
Cash flow from operating activities (77.730.881) (13.070.567) 8.276.539 2.543.909
Cash flow from investing activities (18.538.716) (24.766.487) 3.726.886 (5.165.193)
Cash flow from financing activities (12.140.333) 20.736.515 (2.142.572) (2.296.743)
Increase (decrease) in cash and cash equivalents (108.409.930) (17.100.539) 9 .860.853 (4 .918.027)
Impact of exchange rate differences on cash and cash equivalents (10.143.842) (8.119.186) (1.767.842) 1.142.856
Cash and cash equivalents at the beginning of the period 330.754.756 96.231.130 15.339.825 26.213.109
Cash and cash equivalents at the end of the period 212.200.984 71.011.405 23.432.836 22.437.938
June 2020 Peru Colombia Argentina Brazi l
Cash flow from operating activities 158.423.568 10.555.658 5.711.823 10.873.090
Cash flow from investing activities (124.976.197) (51.968.061) (7.008.993) (1.230.669)
Cash flow from financing activities 214.466.153 65.332.953 39.286.708 22.874.582
Increase (decrease) in cash and cash equivalents 247.913.524 23.920.550 37.989.538 32.517.003
Impact of exchange rate differences on cash and cash equivalents (5.452.891) (1.619.088) (3.892.603) (4.964.356)
Cash and cash equivalents at the beginning of the period 166.983.567 85.173.726 8.127.249 3.881.290
Cash and cash equivalents at the end of the period 409.444.200 107.475.188 42.224.184 31.433.937

Financial results second quarter 2021
21
V . G R O S S M E R C H A N D I S E V O L U M E ( G M V ) ( C L P M I L L I O N ) 5
V I . O N L I N E P E N E T R A T I O N 6
5 GMV is based on the gross online sales of the Department Stores businesses in Chile, Peru, Colombia and Argentina; Home Improvement businesses in Chile, Peru, Argentina, Brazil and Uruguay; Supermarket businesses in Chile and Peru; and Linio. 6 Online penetration percentage is calculated as the ratio of total gross sales from online channels over total gross sales from both online and physical channels.
GMV 2Q20 % Total 2Q21 % Total Var % LTM
Retai l (1P) 486.516 76% 708.695 80% 46% 2.318.377
Deparment stores 370.778 58% 450.577 51% 22% 1.668.086
Home improvement 91.425 14% 222.312 25% 143% 545.742
Supermarkets 24.313 4% 35.806 4% 47% 104.550
Marketplace (3P) 150.646 24% 173.086 20% 15% 638.601
Total GMV 637.162 100% 881.781 100% 38% 2.956.978
GMV by country 2Q20 % Total 2Q21 % Total Var % LTM
Chile 352.869 55% 608.117 69% 72% 1.881.861
Perú 111.214 17% 155.950 18% 40% 563.136
Colombia 100.621 16% 51.050 6% -49% 272.707
Others 72.458 11% 66.665 8% -8% 239.275
Total GMV by country 637.162 100% 881.781 100% 38% 2.956.978
Online Penetration 2Q20 2Q21 LTM 2Q20 LTM 2Q21
Department Stores 85% 53% 33% 49%
Home Improvement 16% 17% 6% 12%
Supermarkets 4% 5% 2% 4%
Total 36% 28% 17% 25%

Financial results second quarter 2021
22
V I I . N O M I N A L S A L E S G R O W T H P E R E Q U I V A L E N T S T O R E - S A M E
S T O R E S A L E S ( S S S ) 7, 8, 9, 10
Regarding SSS calculation
Department Stores format in Chile was affected by its normal operation in both periods (2Q20 and 2Q21), resulting in closings of
stores to a greater extent during the months of April and partial restrictions in the remaining months of the quarter. When
considering the sales of all physical stores, YoY revenue growth was 312% in the period.
Department Stores and Home Improvement businesses in Peru faced operating restrictions in both periods, with greater force in
May and the first half of June 2020. During 2021, the restrictions decreased. When considering the revenues from all the physical
stores, the YoY growth in revenues was 1,315% and 1,088% in the period, for Department Stores and Home Improvement
respectively.
In Colombia, total revenue from Department Stores grew 574% YoY, while Home Improvement grew 96.2%
In Argentina, due to the total closure of the Department Store business, the calculation of the metric is invalidated.
In Brazil, total Home Improvement revenues grew 21.3%.
7 All growth rates are in nominal terms and have been calculated using the local currency for each country. In Argentina they are net of gross income tax (IIBB). 8 Nominal sales growth by store includes sales from online channels until 2019 (if any). Subsequently, online sales have been excluded from this analysis, as a result of the COVID-19 pandemic. 9 The SSS calculation does not include stores that have had significant changes to their sales area since the comparable period, due to remodeling, expansions, reductions or closures. 10 The term "N/A" means this metric is not applicable due to the closure of physical stores.
1Q18 2Q18 3Q18 4Q18 2018 1Q19 2Q19 3Q19 4Q19 2019 1Q20 2Q20 3Q20 4Q20 2020 1Q21 2Q21
Chile
Department Stores -4,9% 0,2% -7,2% -3,3% -3,6% -3,0% -1,2% -3,5% -3,6% -2,8% N/A N/A -5,0% 22,7% N/A 30,1% N/A
Home Improvement 4,6% 5,8% 1,9% -2,0% 2,4% -1,7% -4,2% -0,7% -6,1% -3,1% -5,1% -9,7% 22,6% 33,7% 6,5% 31,9% 85,2%
Supermarkets 1,7% 1,9% 2,6% -1,2% 1,1% 1,5% -2,4% -1,2% -0,9% -0,8% 5,3% 7,1% 13,3% 25,9% 12,1% 10,0% 19,3%
Peru
Department Stores 12,1% 8,4% 3,8% 0,3% 5,4% 0,3% -4,4% 4,6% -2,8% -0,9% N/A N/A -26,2% -1,2% N/A N/A N/A
Home Improvement 6,0% 1,0% 2,9% 3,7% 2,6% 1,7% 3,4% 2,1% -0,7% 1,5% N/A N/A 15,3% 11,8% N/A N/A N/A
Supermarkets 4,8% 10,3% 6,1% 3,5% 6,0% 3,9% -0,5% 2,7% 2,5% 2,2% 4,9% N/A 19,7% 17,7% N/A 10,2% 3,2%
Colombia
Department Stores 0,6% 11,9% 15,0% 9,9% 10,5% 9,8% 9,0% 9,5% 8,6% 9,1% N/A N/A -31,4% -21,5% N/A N/A N/A
Home Improvement -0,9% 4,6% 3,8% 7,7% 3,9% 7,8% 8,1% 8,1% 8,2% 8,1% N/A N/A 1,2% 15,9% N/A N/A N/A
Argentina
Department Stores 38,3% 36,7% 30,7% 27,2% 32,4% 20,2% 23,4% 36,1% 56,2% 35,8% N/A N/A 35,7% 22,4% N/A N/A -
Home Improvement 25,6% 23,4% 26,4% 18,5% 23,2% 18,1% 13,5% 16,6% 36,8% 22,2% N/A N/A -8,9% 30,0% N/A N/A 191,4%
Brazi l
Home Improvement 7,9% -1,3% -2,0% 8,8% 3,1% 8,1% 18,2% 11,8% 6,6% 10,8% -3,6% 19,5% 36,9% 30,5% 21,4% 35,3% N/A
Financial results second quarter 2021
23
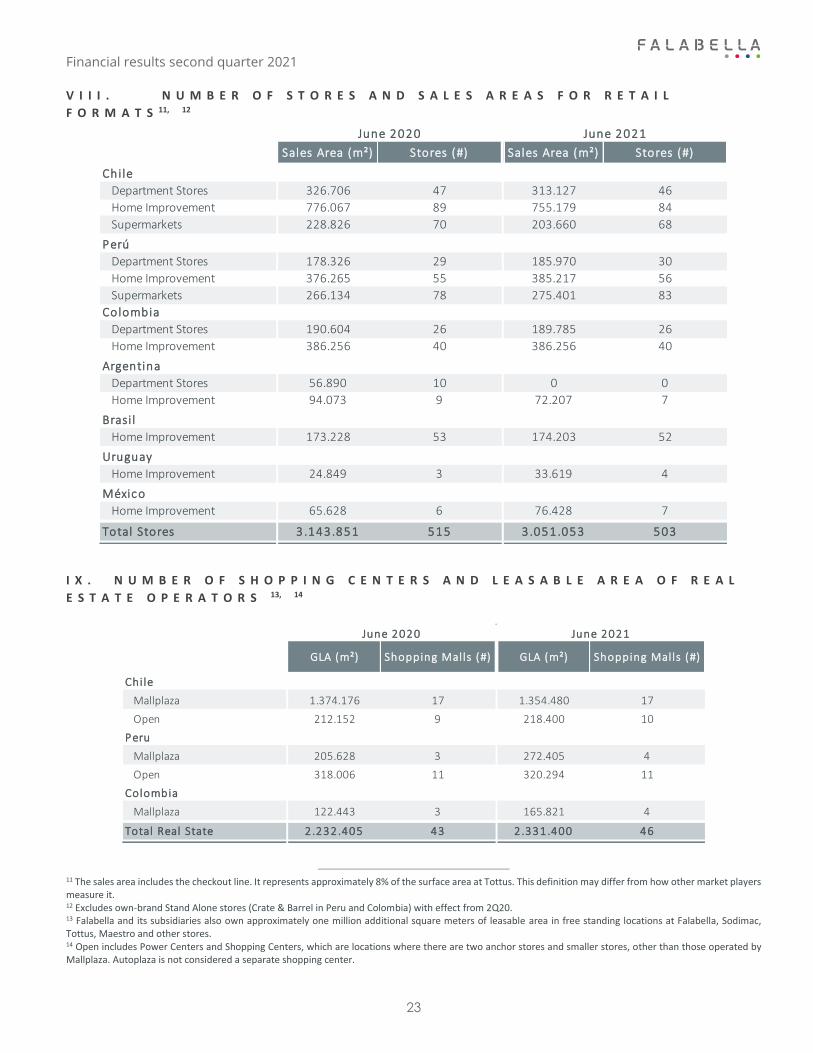
V I I I . N U M B E R O F S T O R E S A N D S A L E S A R E A S F O R R E T A I L
F O R M A T S 11, 12
I X . N U M B E R O F S H O P P I N G C E N T E R S A N D L E A S A B L E A R E A O F R E A L
E S T A T E O P E R A T O R S 13, 14
11 The sales area includes the checkout line. It represents approximately 8% of the surface area at Tottus. This definition may differ from how other market players measure it. 12 Excludes own-brand Stand Alone stores (Crate & Barrel in Peru and Colombia) with effect from 2Q20. 13 Falabella and its subsidiaries also own approximately one million additional square meters of leasable area in free standing locations at Falabella, Sodimac, Tottus, Maestro and other stores. 14 Open includes Power Centers and Shopping Centers, which are locations where there are two anchor stores and smaller stores, other than those operated by Mallplaza. Autoplaza is not considered a separate shopping center.
June 2020 June 2021
Sales Area (m²) Stores (#) Sales Area (m²) Stores (#)
Chile
Department Stores 326.706 47 313.127 46
Home Improvement 776.067 89 755.179 84
Supermarkets 228.826 70 203.660 68
Perú
Department Stores 178.326 29 185.970 30
Home Improvement 376.265 55 385.217 56
Supermarkets 266.134 78 275.401 83
Colombia
Department Stores 190.604 26 189.785 26
Home Improvement 386.256 40 386.256 40
Argentina
Department Stores 56.890 10 0 0
Home Improvement 94.073 9 72.207 7
Brasi l
Home Improvement 173.228 53 174.203 52
Uruguay
Home Improvement 24.849 3 33.619 4
México
Home Improvement 65.628 6 76.428 70
Total Stores 3 .143.851 515 3.051.053 5030 0 0 0 0
June 2020 June 2021
GLA (m²) Shopping Malls (#) GLA (m²) Shopping Malls (#)
Chile
Mallplaza 1.374.176 17 1.354.480 17
Open 212.152 9 218.400 10
Peru
Mallplaza 205.628 3 272.405 4
Open 318.006 11 320.294 11
Colombia
Mallplaza 122.443 3 165.821 40
Total Real State 2.232.405 43 2.331.400 460 0 0 0 0

Financial results second quarter 2021
24
X . D E B T M A T U R I T Y P R O F I L E ( C L P M I L L I O N )
Total Consolidated Financial Debt (excluding banking businesses): CLP 3,426,955 million
X I . A V E R A G E C O L L E C T I O N P E R I O D 15, A V E R A G E P A Y M E N T P E R I O D
A N D D A Y S O F I N V E N T O R Y 16
Chile
International Businesses17
15 Collection days do not include receivables from retail formats (Department Stores, Home Improvement and Supermarkets) with Promotora CMR. 16 Average collection (excluding Plaza S.A.): Trade and other receivables, current (net) * 90 / Quarterly operating revenue Average collection for Plaza S.A. is collection days. Average payment days: Trade and other payables, current * 90 / Quarterly cost of sales Inventory rotation: Inventories (net) * 90 / Quarterly cost of sales. 17 These indicators include retail businesses only, except for Peru, which includes Maestro's two real estate companies.
$168.986
$325.022
$802.530
$71.263
$344.597
$1.714.557
20252021 2022 2026+2023 2024
Dep. Stores Home Improv. Supermarkets Plaza S.A.
2Q20 2Q21 2Q20 2Q21 2Q20 2Q21 2Q20 2Q21
Average Collection Period 15,7 10,1 20,8 10,6 8,9 5,9 33,0 110,0
Average Payment Period 89,7 63,7 61,3 42,7 42,4 39,6 NM NM
Days of inventory 170,0 95,2 91,3 47,1 46,9 50,5 NM NM
Peru Argentina Colombia Brazi l
2Q20 2Q21 2Q20 2Q21 2Q20 2Q21 2Q20 2Q21
Average Collection Period 4,5 2,3 16,9 17,9 4,8 6,4 53,2 65,6
Average Payment Period 80,3 53,5 132,9 47,1 91,1 63,1 104,6 116,7
Days of inventory 166,9 93,5 212,8 67,1 161,0 129,8 105,2 122,7

Financial results second quarter 2021
25
X I I . C O N S O L I D A T E D R E S U L T S A S O F J U N E 2 0 2 1
Consolidated Statement of Net Income 2Q21 (CLP million)
Consolidated Statement of Net Income 6M21 (CLP million)
2Q20 % Rev. 2Q21 % Rev. Var %
Revenues of Non-Banking Operations 1.458.364 2.390.589 63,9%
Revenues of Banking Operations 299.424 257.930 -13,9%
Total Revenues 1.757.788 100,0% 2.648.519 100,0% 50,7%
COGS of Non-Banking Operations (1.063.909) -60,5% (1.653.373) -62,4% 55,4%
COGS of Banking Operations (204.793) -11,7% (67.728) -2,6% -66,9%
Gross Profit 489.086 27,8% 927.418 35,0% 89,6%
SG&A Expenses (630.995) -35,9% (681.178) -25,7% 8,0%
Operational Income (141.909) -8 ,1% 246.240 9,3% -273,5%
Depreciation + Amortization 116.315 6,6% 112.753 4,3% -3,1%
EBITDA (25.594) -1 ,5% 358.993 13,6% -1502,6%
Other Income / (Expenses) 1.452 (1.471) -201,3%
Net Financial Income / (Cost) (41.299) (43.786) 6,0%
Profit / (Loss) in Associates (2.526) 3.031 -220,0%
Exchange Rate Differences (8.252) (12.016) 45,6%
Non-Operating Profit (50 .625) -2 ,9% (54.242) -2 ,0% 7,1%
Profit Before Tax Expenses (192.534) -11,0% 191.998 7,2% -199,7%
Income Tax 52.103 (52.956) -201,6%
Minority Interest 11.624 (4.193) -136,1%
Net Profit / (Loss) (128.807) -7 ,3% 134.849 5,1% -204,7%
6M20 % Rev. 6M21 % Rev. Var %
Revenues of Non-Banking Operations 3.346.063 4.608.667 37,7%
Revenues of Banking Operations 650.434 519.061 -20,2%
Total Revenues 3.996.497 100,0% 5.127.728 100,0% 28,3%
COGS of Non-Banking Operations (2.364.940) -59,2% (3.187.574) -62,2% 34,8%
COGS of Banking Operations (380.806) -9,5% (118.097) -2,3% -69,0%
Gross Profit 1 .250.751 31,3% 1.822.057 35,5% 45,7%
SG&A Expenses (1.297.298) -32,5% (1.333.691) -26,0% 2,8%
Operational Income (46.547) -1 ,2% 488.366 9,5% -1149,2%
Depreciation + Amortization 232.451 5,8% 222.870 4,3% -4,1%
EBITDA 185.904 4,7% 711.236 13,9% 282,6%
Other Income / (Expenses) 1.762 (5.762) -427,0%
Net Financial Income / (Cost) (76.505) (82.471) 7,8%
Profit / (Loss) in Associates (4.842) 8.334 -272,1%
Exchange Rate Differences (21.441) (27.257) 27,1%
Non-Operating Profit (101.026) -2 ,5% (107.156) -2 ,1% 6,1%
Profit Before Tax Expenses (147.573) -3 ,7% 381.210 7,4% -358,3%
Income Tax 34.633 (98.458) -384,3%
Minority Interest 1.008 (10.577) -1149,3%
Net Profit / (Loss) (111.932) -2 ,8% 272.175 5,3% -343,2%

Financial results second quarter 2021
26
1. Revenues
Falabella's consolidated revenue for the second quarter totaled CLP 2,648,519 million, an increase of 50.7% compared to 2Q20.
This increase is due to higher revenue contribution from the Retail formats, in particular Home Improvement and Department
Stores in Chile and Home Improvement in Peru.
Banking segment revenue decreased by 13.9% compared to the same quarter last year, mainly due to lower interest and
indexation income, related to contraction within the loan portfolio in Chile and Peru.
Sales at retail formats in Chile grew by 80.4% in the quarter, as a result of the continued consumer dynamism, driven by
withdrawals from individual pension funds during the year, together with good sales performance from the Cyberday event, which
surpassed historical levels. Accordingly, retail formats reported strong growth in online sales, which reached CLP 608,117 million
(up 72% YoY), and represent 31% of total sales. Sales at Department Stores grew by 98.5%, accompanied by online sales growth
of 55% YoY. Sales at Home Improvement grew by 96.0% compared to 2Q20 and online sales increased by 138% YoY. Supermarkets
reported growth of 25.0% YoY. However, operating revenue at Banco Falabella decreased by 12.9% during the quarter, mainly
due to a 4.8% annual decrease in the loan portfolio.
Consolidated revenue in Peru grew by 49.2% in 2Q21, driven by a recovery in the performance of physical stores. This was mainly
explained by Home Improvement, which reported growth of 545.3% YoY (up 685.9% in local currency) and Department Stores
with growth of 232.4% YoY (up 307.6% in local currency). Supermarkets reported a decrease of 13.6% YoY (up 9.1% in local
currency), while the Banking business recorded a contraction in the bank's loan portfolio of 9.7% YoY in local currency.
Operating revenue in Colombia grew by 6.4% compared to the second quarter last year. This was associated with an improvement
in revenue from the Banking business, which increased by 4.2% (in local currency). This was supported by the Department Stores
format, which grew by 11.7% YoY (up 22.4% in local currency).
Operating revenue in Brazil grew by 9.2% in the quarter compared to the same period last year. The format reported growth of
up 23.0% in local currency, supported by good performance from physical stores and growth of 1,469% YoY in online channel
sales.
Operating revenue in Argentina grew by 5.2% during 2Q21, compared to the same period last year. This is due to better
performance from the Home Improvement format with growth of 86.5% YoY (up 139.0% in local currency). Department Stores
format reported a -17.4% drop, mainly explained by the definitive closure of its operations in the country.
Analysis of the first half of 2021
Operating revenue for the first half of 2021 grew by 28.3% compared to last year, to reach CLP 5,127,728 million. This increase is
due to improved performance from the retail and real estate formats, partially offset by a decrease in revenue from the banking
business associated with a contraction in the loan portfolio.
Retail format revenue in Chile for the first half of 2021 grew by 56.2%, driven mainly by revenue from Department Stores with
growth of 67.1% YoY, followed by Home Improvement with 63.5% YoY and finally Supermarkets with 22.5% YoY. Banking business
revenue decreased by 17.8% YoY due to the contraction in loans.
Operating revenue for the first half of 2021 in Peru increased by 17.4%, mainly due to the performance of Department Stores with
growth of 64.3% YoY (up 99.6% in local currency) and Home Improvement with growth of 82.3% YoY (up 120.8% in local currency),
partially offset by Supermarkets with a decrease of 7.5% YoY (up 13.6% in local currency) and the banking business with a decrease
of 22.9% in local currency.
Operating revenue for the first half of 2021 in Colombia decreased by 0.9% YoY, mainly due to a 3.0% YoY decrease in the banking
business in local currency, partially offset by growth of 5.8% YoY from Department Stores (up 17.7% in local currency).
Brazil reported 4.1% YoY sales growth (up 28.4% in local currency).
Operating revenue for the first half of 2021 in Argentina decreased by 14.7%, mainly due to the currency devaluation. The
Department Store format faced a 20.1% YoY decrease (up 22.6% in local currency) due to the closure of all its stores in Argentina,
while Home Improvement reported growth of 21% YoY (up 85.6% in local currency). CMR's operating revenue decreased by 39.9%
in local currency, due to fewer loans.

Financial results second quarter 2021
27
2. Operational Results
The company's net operating income for the second quarter was CLP 246,240 million, which represents an increase over the negative figure for 2Q20. This was mainly due to higher contributions from Home Improvement and Department Store formats throughout the region, in addition to a higher operating contribution from Banco Falabella Chile.
The retail formats in Chile reported net operating income of CLP 128,305 million, an improvement over the net operating loss of -CLP 84,631 million for the same quarter last year. This is associated with improved performance from each of the three retail formats.
Banco Falabella Chile achieved net operating income of CLP 78,172 million during the quarter, an increase of 318.3% compared to 2Q20. Mainly due to margin improvements associated with a reduction in portfolio risk costs.
Mallplaza achieved net operating income of CLP 17,467 million during the quarter, an increase over the negative figure for the same quarter last year. This is due to higher gross margins associated with the recovery of its lease income from business partners who are operating with a greater degree of normality after the pandemic along with lower SG&A.
The Peruvian businesses earned net operating income of CLP 23,328 million during the quarter, an increase over the negative figure for 2Q20, mainly due to higher gross margins across the country and higher dilution of selling, general and administrative expenses. This was driven by higher contributions from Home Improvement and Department Stores, partially offset by Supermarkets.
Colombia reported a net operating loss for the quarter of -CLP 3,802 million. However, it represented an improvement over the same quarter last year. This is due to higher contributions to gross margins.
Brazil reported net operating income of CLP 2,794 million, an increase of 138.8% YoY. This was driven by higher gross margins.
Analysis of the first half of 2021
Net operating income was CLP 488,366 million, an increase over the negative figure for the same half of last year. This was due to
an improvement in contributions from the three formats of Retail, Shopping Centers and Financial Services.
The banking business in Chile achieved net operating income of CLP 177,679 million, an increase of 174.9% YoY, due to a decrease
in portfolio risk costs compared to last year. The retail businesses reported net operating income of CLP 210,437 million, due to
increased contributions from the three retail formats, which reversed the negative figures for the same period last year.
Mallplaza reported net operating income of CLP 50,613 million, an increase of 48.2% YoY, mainly explained by higher income
associated with the recovery in collections from commercial partners that return to operate with greater normality and lower
SG&A associated with the context of the pandemic.
Peru earned net operating income of CLP 40,406 million, which represents growth over the negative figure in 2020. This is due to
greater contributions from the Department Store and Home Improvement formats and to a lesser extent Shopping Centers, and
an improvement at Banco Falabella compared to the first half of last year.
Colombia had net operating loss of -CLP 12,483 million, a decrease of 916.8% YoY, due to lower growth in revenues and higher
SG&A.
Finally, Brazil achieved net operating income of CLP 4,959 million, an increase of 3,273.5% YoY. This was due to an expansion in
gross margin and greater dilution of selling, general and administrative expenses.
3. Non-Operating Result and Net Profit
The company incurred a non-operating loss of -CLP 54,242 million for the quarter, 7.1% higher than in the same period for 2020.
Net income reached CLP 134,849 million for the second quarter 2021, reversing the net loss of -CLP 128,807 million for the
previous year's quarter. This was mainly due to higher net income from the retail businesses in Chile and Banco Falabella.

Financial results second quarter 2021
28
During the six months to June 2021, the company incurred a non-operating loss of -CLP 107,156 million, 6.1% higher than the
previous year. Consolidated net income was CLP 272,175 million, an increase over the net loss for the first half of 2020. This is
mainly due to higher net income from the Chilean formats and Peruvian Home Improvement.
4. Balance Sheet As of June 30, 2021 (CLP million)
Non-banking current assets decreased by CLP 320,895 million compared to December 2020, mainly driven by a decrease in cash
and cash equivalents due to the payment of liabilities, and a decrease in trade and other receivables, partially offset by an increase
of inventories. Non-banking non-current assets decreased by CLP 2,891 million, mainly due to a decrease in property, plant and
equipment and investment properties, mainly as a consequence of the currency devaluation of international operations. This was
partially offset by an increase in other non-current financial assets, generated mainly by the increase in the valuation of hedging
assets. Banking business total assets decreased by CLP 97,359 million compared to December 2020, mainly due to decreases in
trading instruments and financial derivative contracts, which were partially offset by an increase in cash and deposits with banks.
Consequently, total consolidated assets decreased by CLP 421,145 million.
Non-banking current liabilities decreased by CLP 148,856 million compared to December 2020, mainly due to decreases in trade
and other payables and other non-financial current liabilities. Non-banking non-current liabilities decreased by CLP 262,811
million, mainly due to a decrease in other financial non-current liabilities. Banking business total liabilities decreased by CLP
218,363 million, due to lower financial derivative contracts, lower deposits and other time deposits and lower transactions
pending settlement. This was partially offset by higher savings accounts and other demand obligations. Consequently, total
liabilities decreased by CLP 630,030 million.
31-dec-20 30-jun-21 Var %
Current Assets - Non Banking Business 3.060.892 2.739.997 -10,5%
Non Current Assets - Non Banking Business 8.401.528 8.398.637 0,0%
Total Assets - Non Banking Business 11.462.420 11.138.634 -2,8%
Total Assets - Banking Business 7.456.110 7.358.751 -1,3%
Total Assets 18.918.530 18.497.385 -2,2%
Current Liabialities - Non Banking Business 2.162.843 2.013.987 -6,9%
Non Current Liabialities - Non Banking Business 4.779.127 4.516.316 -5,5%
Total Liabial ities - Non Banking Business 6.941.970 6.530.303 -5,9%
Total Liabial ities - Banking Business 5.991.304 5.772.941 -3,6%
Total Liabial ities 12.933.274 12.303.244 -4,9%
Total Equity 5.985.256 6.194.141 3,5%
Total Liabi l ities + Equity 18.918.530 18.497.385 -2,2%

Financial results second quarter 2021
29
5. Cash Flow Statement For the period ended June 30, 2021 (CLP million)
Cash flow from operating activities at non-banking businesses increased by CLP 122,657 million for the period ended June 2021
compared to the same period last year, mainly due to higher collections from the sale of goods and services, partially offset by
higher payments to suppliers for the purchase of goods and services. Cash flow from operating activities at banking businesses
decreased by CLP 859,449 million, mainly due to a decrease in deposits and other time deposits, together with an increase in
customer loans and receivables and an increase in deposits and other demand obligations. Consequently, consolidated cash flow
from operating activities for the period ended June 2021 was CLP 736,792 million lower than the same period last year.
Cash flow from investing activities at the non-banking business was CLP 135,960 million higher than in 2020, mainly due to lower
purchases of property, plant and equipment, and lower purchases of other long-term assets. Cash flow from investing activities
at banking businesses increased by CLP 76,460 million compared to last year, due to a net increase in investment instruments held
for sale. Consequently, consolidated cash flow used in investing activities for the period ended June 2021 was CLP 212,420 million
lower than the same period in 2020.
Cash flow from financing activities at the non-banking business for the period ended June 2021 was CLP 1,651,617 million lower
than the comparable period, due to a decrease in short and long-term loans. Cash flow from financing activities at the banking
business increased by CLP 418,729 million compared to the same period last year, due to higher loans and other liabilities.
Consequently, consolidated cash flow from financing activities decreased by CLP 1,232,888 million compared to the same period
last year.
30-jun-20 30-jun-21 Var %
Cash flow from operating activities - Non Banking Business 2.226 124.883 5510,2%
Cash flow from operating activities - Banking Business 969.886 110.437 -88,6%
Cash f low from operating activ ities 972.112 235.320 -75,8%
Cash flow from investment activities - Non Banking Business (269.089) (133.129) -50,5%
Cash flow from investment activities - Banking Business 12.997 89.457 588,3%
Cash f low from investment activ ities (256.092) (43.672) -82,9%
Cash flow from financing activities - Non Banking Business 1.226.186 (425.431) -134,7%
Cash flow from financing activities - Banking Business (158.419) 260.310 -264,3%
Cash f low from financ ing activ ities 1 .067.767 (165.121) -115,5%
Increase (decrease) in cash and cash equivalents 1 .783.787 26.527 -98,5%
Impact of exchange rate differences on cash and cash equivalents (18.310) (18.775) 2,5%
Cash and cash equivalents at the beginning of the period 837.782 2.462.376 193,9%
Cash and cash equivalents at the end of the period 2.603.259 2.470.129 -5 ,1%

Financial results second quarter 2021
30
Definitions for Financial Business Units

Address:
Manuel Rodríguez Norte 730
Santiago, Chile
Contacts:
Juan-Luis Carrasco
Valentina Klein
Bruno Valenzuela
Investors Relations
E-mail: [email protected]
Website:
investors.falabella.com