Second Quarter 2017 Earnings Presentation€¦ · Second Quarter 2017 Earnings Presentation. 1...
13
Investor Presentation November 2016 – August 9, 2017 – Nasdaq Ticker: PVAC Second Quarter 2017 Earnings Presentation
Transcript of Second Quarter 2017 Earnings Presentation€¦ · Second Quarter 2017 Earnings Presentation. 1...

Investor PresentationNovember 2016– August 9, 2017 –
Nasdaq Ticker: PVAC
Second Quarter 2017 Earnings Presentation
1
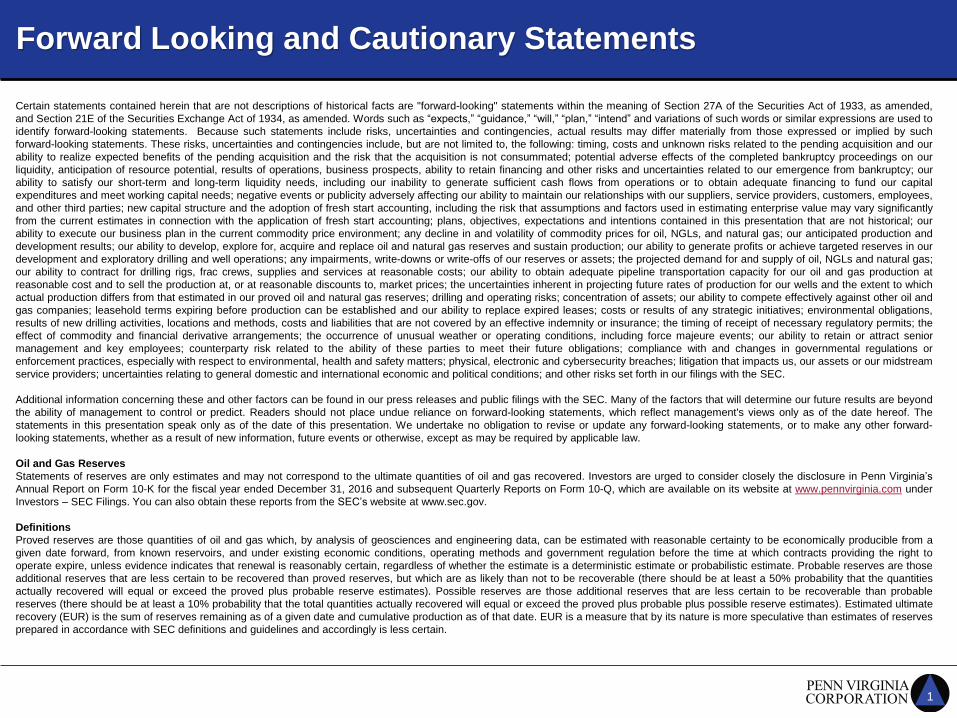
Certain statements contained herein that are not descriptions of historical facts are "forward-looking" statements within the meaning of Section 27A of the Securities Act of 1933, as amended,
and Section 21E of the Securities Exchange Act of 1934, as amended. Words such as “expects,” “guidance,” “will,” “plan,” “intend” and variations of such words or similar expressions are used to
identify forward-looking statements. Because such statements include risks, uncertainties and contingencies, actual results may differ materially from those expressed or implied by such
forward-looking statements. These risks, uncertainties and contingencies include, but are not limited to, the following: timing, costs and unknown risks related to the pending acquisition and our
ability to realize expected benefits of the pending acquisition and the risk that the acquisition is not consummated; potential adverse effects of the completed bankruptcy proceedings on our
liquidity, anticipation of resource potential, results of operations, business prospects, ability to retain financing and other risks and uncertainties related to our emergence from bankruptcy; our
ability to satisfy our short-term and long-term liquidity needs, including our inability to generate sufficient cash flows from operations or to obtain adequate financing to fund our capital
expenditures and meet working capital needs; negative events or publicity adversely affecting our ability to maintain our relationships with our suppliers, service providers, customers, employees,
and other third parties; new capital structure and the adoption of fresh start accounting, including the risk that assumptions and factors used in estimating enterprise value may vary significantly
from the current estimates in connection with the application of fresh start accounting; plans, objectives, expectations and intentions contained in this presentation that are not historical; our
ability to execute our business plan in the current commodity price environment; any decline in and volatility of commodity prices for oil, NGLs, and natural gas; our anticipated production and
development results; our ability to develop, explore for, acquire and replace oil and natural gas reserves and sustain production; our ability to generate profits or achieve targeted reserves in our
development and exploratory drilling and well operations; any impairments, write-downs or write-offs of our reserves or assets; the projected demand for and supply of oil, NGLs and natural gas;
our ability to contract for drilling rigs, frac crews, supplies and services at reasonable costs; our ability to obtain adequate pipeline transportation capacity for our oil and gas production at
reasonable cost and to sell the production at, or at reasonable discounts to, market prices; the uncertainties inherent in projecting future rates of production for our wells and the extent to which
actual production differs from that estimated in our proved oil and natural gas reserves; drilling and operating risks; concentration of assets; our ability to compete effectively against other oil and
gas companies; leasehold terms expiring before production can be established and our ability to replace expired leases; costs or results of any strategic initiatives; environmental obligations,
results of new drilling activities, locations and methods, costs and liabilities that are not covered by an effective indemnity or insurance; the timing of receipt of necessary regulatory permits; the
effect of commodity and financial derivative arrangements; the occurrence of unusual weather or operating conditions, including force majeure events; our ability to retain or attract senior
management and key employees; counterparty risk related to the ability of these parties to meet their future obligations; compliance with and changes in governmental regulations or
enforcement practices, especially with respect to environmental, health and safety matters; physical, electronic and cybersecurity breaches; litigation that impacts us, our assets or our midstream
service providers; uncertainties relating to general domestic and international economic and political conditions; and other risks set forth in our filings with the SEC.
Additional information concerning these and other factors can be found in our press releases and public filings with the SEC. Many of the factors that will determine our future results are beyond
the ability of management to control or predict. Readers should not place undue reliance on forward-looking statements, which reflect management's views only as of the date hereof. The
statements in this presentation speak only as of the date of this presentation. We undertake no obligation to revise or update any forward-looking statements, or to make any other forward-
looking statements, whether as a result of new information, future events or otherwise, except as may be required by applicable law.
Oil and Gas Reserves
Statements of reserves are only estimates and may not correspond to the ultimate quantities of oil and gas recovered. Investors are urged to consider closely the disclosure in Penn Virginia’s
Annual Report on Form 10‐K for the fiscal year ended December 31, 2016 and subsequent Quarterly Reports on Form 10-Q, which are available on its website at www.pennvirginia.com under
Investors – SEC Filings. You can also obtain these reports from the SEC’s website at www.sec.gov.
Definitions
Proved reserves are those quantities of oil and gas which, by analysis of geosciences and engineering data, can be estimated with reasonable certainty to be economically producible from a
given date forward, from known reservoirs, and under existing economic conditions, operating methods and government regulation before the time at which contracts providing the right to
operate expire, unless evidence indicates that renewal is reasonably certain, regardless of whether the estimate is a deterministic estimate or probabilistic estimate. Probable reserves are those
additional reserves that are less certain to be recovered than proved reserves, but which are as likely than not to be recoverable (there should be at least a 50% probability that the quantities
actually recovered will equal or exceed the proved plus probable reserve estimates). Possible reserves are those additional reserves that are less certain to be recoverable than probable
reserves (there should be at least a 10% probability that the total quantities actually recovered will equal or exceed the proved plus probable plus possible reserve estimates). Estimated ultimate
recovery (EUR) is the sum of reserves remaining as of a given date and cumulative production as of that date. EUR is a measure that by its nature is more speculative than estimates of reserves
prepared in accordance with SEC definitions and guidelines and accordingly is less certain.
Forward Looking and Cautionary Statements
2
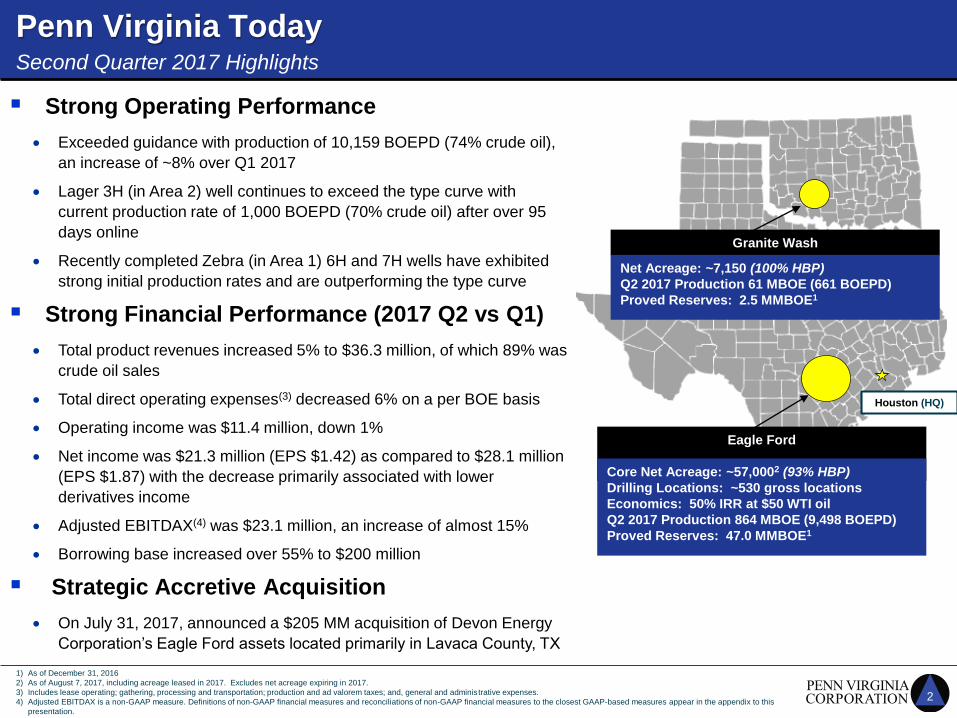
Penn Virginia Today
Granite Wash
Net Acreage: ~7,150 (100% HBP)
Q2 2017 Production 61 MBOE (661 BOEPD)
Proved Reserves: 2.5 MMBOE1
Eagle Ford
Core Net Acreage: ~57,0002 (93% HBP)
Drilling Locations: ~530 gross locations
Economics: 50% IRR at $50 WTI oil
Q2 2017 Production 864 MBOE (9,498 BOEPD)
Proved Reserves: 47.0 MMBOE1
Houston (HQ)
▪ Strong Operating Performance
• Exceeded guidance with production of 10,159 BOEPD (74% crude oil),
an increase of ~8% over Q1 2017
• Lager 3H (in Area 2) well continues to exceed the type curve with
current production rate of 1,000 BOEPD (70% crude oil) after over 95
days online
• Recently completed Zebra (in Area 1) 6H and 7H wells have exhibited
strong initial production rates and are outperforming the type curve
▪ Strong Financial Performance (2017 Q2 vs Q1)
• Total product revenues increased 5% to $36.3 million, of which 89% was
crude oil sales
• Total direct operating expenses(3) decreased 6% on a per BOE basis
• Operating income was $11.4 million, down 1%
• Net income was $21.3 million (EPS $1.42) as compared to $28.1 million
(EPS $1.87) with the decrease primarily associated with lower
derivatives income
• Adjusted EBITDAX(4) was $23.1 million, an increase of almost 15%
• Borrowing base increased over 55% to $200 million
▪ Strategic Accretive Acquisition
• On July 31, 2017, announced a $205 MM acquisition of Devon Energy
Corporation’s Eagle Ford assets located primarily in Lavaca County, TX
Second Quarter 2017 Highlights
1) As of December 31, 2016
2) As of August 7, 2017, including acreage leased in 2017. Excludes net acreage expiring in 2017.
3) Includes lease operating; gathering, processing and transportation; production and ad valorem taxes; and, general and administrative expenses.
4) Adjusted EBITDAX is a non-GAAP measure. Definitions of non-GAAP financial measures and reconciliations of non-GAAP financial measures to the closest GAAP-based measures appear in the appendix to this
presentation.

3
Devon Eagle Ford Acquisition
Pro Forma Asset Map
Transaction Summary
• $205 MM acquisition of Devon Energy Corporation’s Eagle Ford assets located primarily in Lavaca County, TX
• Target closing: September 30, 2017; effective date: March 1, 2017
• Purchase price expected to be adjusted downwards by ~$15 MM to reflect net cash flows from effective date to closing, resulting in ~$190
MM net purchase price
• Intend to fund with $150 MM of new committed debt financing and borrowings under credit facility
• Transaction subject to customary purchase price and closing adjustments
Significant Benefits of Acquisition
Increases Core Leasehold Position and Production By Approximately 30%
• Acquiring ~19,600 net acres contiguous to core operations
• Offers expanded extended reach lateral (“XRL”) well inventory with PV10
breakeven pricing of less than $30/Bbl
• Increases net production by ~30%, or ~3,000 BOEPD (~64% oil)
• Accretive under all measures, including earnings, cash flow and net asset value
per share
• Acquiring at attractive price of ~$2,900/net acre after reducing for:
- Net production value of ~$105 MM ($35,000 per flowing BOEPD)
- ~$15 MM to reflect net cash flows from effective date to closing
- ORRI in non-acquired acreage of ~$8 MM
- Midstream assets valued at ~$20 MM
• Modifying development program by shifting one of PVAC’s drilling rigs to Area 2
predominantly in the acquired acreage, which is expected to have higher returns
and where PVAC will have increased working interest and drive 2018
production higher
• Significant upside potential in the upper Eagle Ford and Austin Chalk formations
• ~$40 MM of identified operational synergies

4
Fayette County
Gonzales County
Lavaca County
Dewitt County
(1) Results are based on 24-hour IPs of the listed wells. EOG results are as reported to the Texas Railroad Commission.
(2) IP measured with only 9 stages flowing. The remaining 14 stages were drilled out after the recording of the metric.
Strong well results – especially Lager 3H and Zebra pad
Acreage Map & Recent Well Results(1)
Kudu Unit
9H: IP 2,005 BOE/D
8H: IP 1,188 BOE/D
7H: IP 1,284 BOE/D
6H: IP 1,411 BOE/D
Sable Unit
6H: IP 1,045 BOE/D(2)
5H: IP 3,418 BOE/D
4H: IP 2,077 BOE/D
Zebra Unit
6H: IP 1,269 BOEPD
7H: IP 1,785 BOEPD
Schacherl-Effenberger
Area 2 Test
Spud 2 Wells 4Q17
Lager Unit
Area 2 Test
3H: IP 2,511 BOEPD
TX
Axis Unit
1H: IP 1,740 BOE/D
2H: IP 1,795 BOE/D
3H: IP 2,806 BOE/D
EOG Boedecker Unit
18H: IP 3,923 BOE/D
19H: IP 3,185 BOE/D
EOG Novosad Unit
10H: IP 969 BOE/D (Chalk)
EOG Kasper Unit
1H: IP 3,586 BOE/D
2H: IP 1,473 BOE/D
3H: IP 2,464 BOE/D
4H: IP 2,727 BOE/D
EOG Guadalupe Unit
14H: IP 3,678 BOE/D
“Super Pad”
Jake Berger Unit
2H, 3H, 4H & 5H:
Completing
Chicken Hawk Unit
2H, 3H, 4H & 5H:
Completing
Legend
Penn Virginia Corporation
Devon
Devon / PVAC Operated

5
Fayette County
Gonzales County
Lavaca County
Dewitt County
TXLegend
Penn Virginia Corporation
Devon
Devon / PVAC Operated
Preliminary 2018 Plan of Development
One rig in Area 2
Start in North and PVAC
legacy acreage
Expand into South acreage
Drill: ~15 gross wells
Working interest: 60-98%
One rig in Area 1
Drill: ~22-25 gross wells
Working interest: ~45-55%

6
Highlights (compared to Q1 2017)
▪ Total product revenues increased 5% to $36.3 million, of which 89% was crude oil sales
▪ Total direct operating expenses decreased 6% on a per BOE basis
▪ Operating income was $11.4 million, down ~1%
▪ Net income was $21.3 million (EPS $1.42) as compared to $28.1 million (EPS $1.87) with the decrease primarily associated with lower derivatives income
▪ Adjusted EBITDAX(1) was $23.1 million, an increase of almost 15%
Q2 2017 Financial Overview
1 Adjusted EBITDAX is a non-GAAP measure, reconciled to net income in the Appendix of this presentation.
(in thousands) Three Months Three Months
Ended Ended
June 30, March 31,
2017 2017
Revenues
Crude oil 32,351$ 30,073$
Natural gas liquids (NGLs) 2,043 2,302
Natural gas 1,880 2,343
Total product revenues 36,274 34,718
Gain (loss) on sales of assets, net (134) 65
Other, net 142 203
Total revenues 36,282 34,986
Operating expenses
Lease operating 5,370 4,916
Gathering, processing and transportation 2,555 2,551
Production and ad valorem taxes 2,119 1,979
General and administrative 2,873 3,281
Total direct operating expenses 12,917 12,727
Share-based compensation - equity classified awards 848 846
Depreciation, depletion and amortization 11,076 9,810
Total operating expenses 24,841 23,383
Operating income 11,441 11,603
Other income (expense)
Interest expense (1,274) (538)
Derivatives 11,061 17,016
Other 101 - Reorganization items, net - -
Income (loss) before income taxes 21,329 28,081
Income tax benefit (expense) - -
Net income 21,329$ 28,081$

7
Transaction Financing and Pro Forma Liquidity
▪ Quarter-end liquidity of $172 MM
- Current liquidity of $158MM
- $47 MM drawn on credit facility,
$6 MM in cash
▪ Expected transaction financing(1)
- $150 MM of new committed debt
- ~$40 MM from credit facility
▪ In discussions to further amend
and increase borrowing base
- Expect meaningful increase in
borrowing base
▪ Focused on maintaining a healthy
balance sheet
Pro Forma Liquidity of ~$132 MM
Mill
ion
CurrentBorrowing
Base
Current Drawn Letters ofCredit
Cash AcquisitionFinancing
Pro FormaLiquidity
(1) Assumes net purchase price of ~$190 MM including ~$15 MM adjustment to reflect net cash flows from effective date to closing.
Excludes transaction financing costs.
(2) As of June 30, 2017.
$200.0 $132.3$10.1(2)($37.0)(2) ($0.8)(2) ($40.0)(1)
8
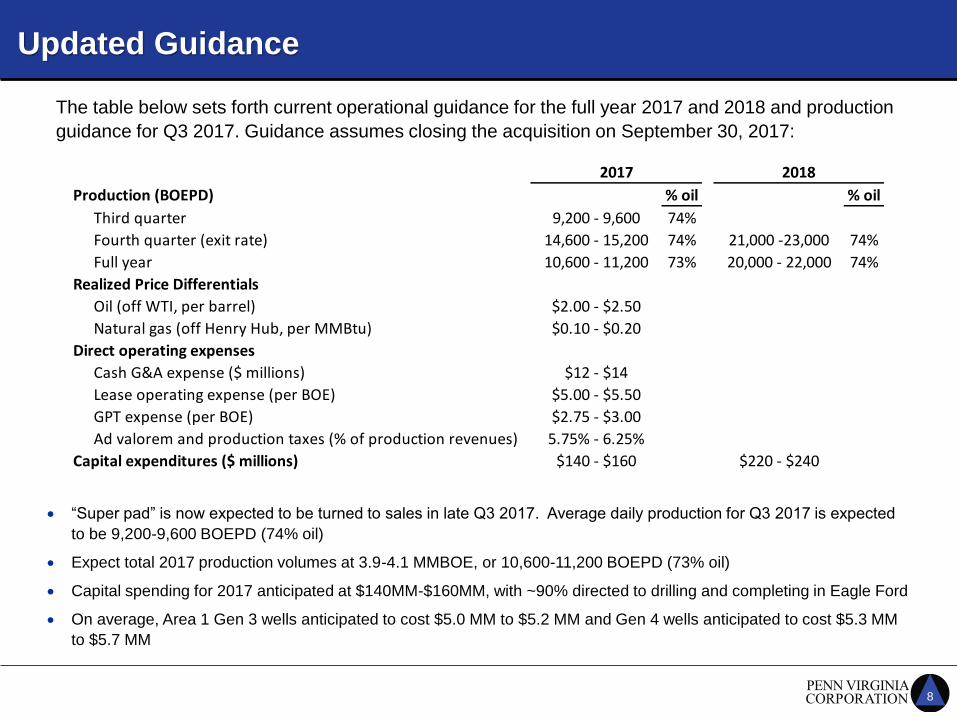
Updated Guidance
The table below sets forth current operational guidance for the full year 2017 and 2018 and production
guidance for Q3 2017. Guidance assumes closing the acquisition on September 30, 2017:
• “Super pad” is now expected to be turned to sales in late Q3 2017. Average daily production for Q3 2017 is expected
to be 9,200-9,600 BOEPD (74% oil)
• Expect total 2017 production volumes at 3.9-4.1 MMBOE, or 10,600-11,200 BOEPD (73% oil)
• Capital spending for 2017 anticipated at $140MM-$160MM, with ~90% directed to drilling and completing in Eagle Ford
• On average, Area 1 Gen 3 wells anticipated to cost $5.0 MM to $5.2 MM and Gen 4 wells anticipated to cost $5.3 MM
to $5.7 MM
2017 2018
Production (BOEPD) % oil % oil
Third quarter 9,200 - 9,600 74%
Fourth quarter (exit rate) 14,600 - 15,200 74% 21,000 -23,000 74%
Full year 10,600 - 11,200 73% 20,000 - 22,000 74%
Realized Price Differentials
Oil (off WTI, per barrel) $2.00 - $2.50
Natural gas (off Henry Hub, per MMBtu) $0.10 - $0.20
Direct operating expenses
Cash G&A expense ($ millions) $12 - $14
Lease operating expense (per BOE) $5.00 - $5.50
GPT expense (per BOE) $2.75 - $3.00
Ad valorem and production taxes (% of production revenues) 5.75% - 6.25%
Capital expenditures ($ millions) $140 - $160 $220 - $240

9
0
500
1,000
1,500
2,000
2,500
3,000
3,500
4,000
4,500
5,000
2017 2018 2019
Oil Hedge PositionsB
arre
ls P
er
Day
$48.59 $49.37
$49.75
Oil Volumes
(Barrels Per Day)
Average Swap Price
($ Per Barrel)
2017 (remaining) 4,408 $48.59
2018 4,476 $49.37
2019 2,916 $49.75
As of July, 31 2017

Questions & Answers

Appendix
12
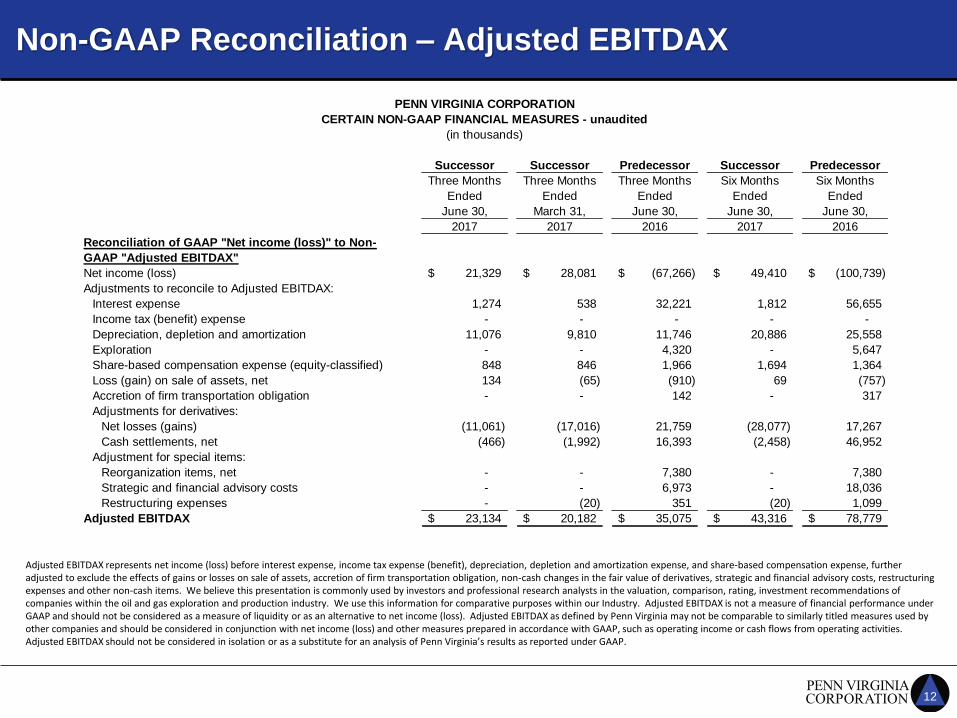
Non-GAAP Reconciliation – Adjusted EBITDAX
Adjusted EBITDAX represents net income (loss) before interest expense, income tax expense (benefit), depreciation, depletion and amortization expense, and share-based compensation expense, further adjusted to exclude the effects of gains or losses on sale of assets, accretion of firm transportation obligation, non-cash changes in the fair value of derivatives, strategic and financial advisory costs, restructuring expenses and other non-cash items. We believe this presentation is commonly used by investors and professional research analysts in the valuation, comparison, rating, investment recommendations of companies within the oil and gas exploration and production industry. We use this information for comparative purposes within our Industry. Adjusted EBITDAX is not a measure of financial performance under GAAP and should not be considered as a measure of liquidity or as an alternative to net income (loss). Adjusted EBITDAX as defined by Penn Virginia may not be comparable to similarly titled measures used by other companies and should be considered in conjunction with net income (loss) and other measures prepared in accordance with GAAP, such as operating income or cash flows from operating activities. Adjusted EBITDAX should not be considered in isolation or as a substitute for an analysis of Penn Virginia’s results as reported under GAAP.
PENN VIRGINIA CORPORATION
CERTAIN NON-GAAP FINANCIAL MEASURES - unaudited
(in thousands)
Successor Successor Predecessor Successor Predecessor
Three Months Three Months Three Months Six Months Six Months
Ended Ended Ended Ended Ended
June 30, March 31, June 30, June 30, June 30,
2017 2017 2016 2017 2016
Reconciliation of GAAP "Net income (loss)" to Non-
GAAP "Adjusted EBITDAX"
Net income (loss) 21,329$ 28,081$ (67,266)$ 49,410$ (100,739)$
Adjustments to reconcile to Adjusted EBITDAX:
Interest expense 1,274 538 32,221 1,812 56,655
Income tax (benefit) expense - - - - -
Depreciation, depletion and amortization 11,076 9,810 11,746 20,886 25,558
Exploration - - 4,320 - 5,647
Share-based compensation expense (equity-classified) 848 846 1,966 1,694 1,364
Loss (gain) on sale of assets, net 134 (65) (910) 69 (757)
Accretion of firm transportation obligation - - 142 - 317
Adjustments for derivatives:
Net losses (gains) (11,061) (17,016) 21,759 (28,077) 17,267
Cash settlements, net (466) (1,992) 16,393 (2,458) 46,952
Adjustment for special items:
Reorganization items, net - - 7,380 - 7,380
Strategic and financial advisory costs - - 6,973 - 18,036
Restructuring expenses - (20) 351 (20) 1,099
Adjusted EBITDAX 23,134$ 20,182$ 35,075$ 43,316$ 78,779$