Second Quarter 2016 Update - sap.com
23
Second Quarter 2016 Update Tuesday, July 26, 2016
Transcript of Second Quarter 2016 Update - sap.com

Second Quarter 2016 Update
Tuesday, July 26, 2016

© 2016 SAP SE. All rights reserved. 22
Safe Harbor Statement
Any statements contained in this document that are not historical facts are forward-lookingstatements as defined in the U.S. Private Securities Litigation Reform Act of 1995. Words such as“anticipate,” “believe,” “estimate,” “expect,” “forecast,” “intend,” “may,” “plan,” “project,”“predict,” “should” and “will” and similar expressions as they relate to SAP are intended to identifysuch forward-looking statements. SAP undertakes no obligation to publicly update or revise anyforward-looking statements. All forward-looking statements are subject to various risks anduncertainties that could cause actual results to differ materially from expectations. The factors thatcould affect SAP’s future financial results are discussed more fully in SAP’s filings with the U.S.Securities and Exchange Commission (“SEC”), including SAP’s most recent Annual Report on Form20-F filed with the Securities and Exchange Commission. Readers are cautioned not to place unduereliance on these forward-looking statements, which speak only as of their dates.

© 2016 SAP SE. All rights reserved. 33
Agenda
Income Statement
Outlook and Additional Information
Balance Sheet and Cash Flow Analysis
Brexit and Other Topics

© 2016 SAP SE. All rights reserved. 44
Cloud Subscriptions &
Support Revenuein € millions
IFRS Non-IFRS
720 721+30% +30% (+33% cc)
Cloud & Software Revenuein € millions
Key performance metrics Q2 2016
Operating Profitin € millions
IFRS
+7%
Non-IFRS
+7% (+11%cc)
4,062 4,0654,359 4,361
Q2/15 Q2/16
IFRS
+81%
Non-IFRS
+9% (+11%cc)
7011,3941,269 1,516
Q2/15 Q2/16
Software License Revenuein € millions
IFRS Non-IFRS
1,040 1,042+6% +6% (+10% cc)
Software Support Revenuein € millions
IFRS Non-IFRS
2,598 2,598+3% +3% (+6% cc)

© 2016 SAP SE. All rights reserved. 55
Q2/16 results were not impacted by the UK referendum
Strong double-digit software licenses revenue growth in France, the Netherlands, Switzerland, across Southern Europe; again solid performance in Germany
Russia and Germany: very strong double-digit growth in cloud
Strong double-digit software licenses revenue growth in China and India, whereas Japan had almost triple-digit growth.
All three countries also had double-digit growth in cloud subscriptions and support revenue
North America delivered a solid Q2/16; back on track with its half year performance
In Latin America, the political and macroeconomic instability continued. However, SAP had strong double-digit growth in software license revenue in Brazil and Mexico.
Regional performance1) Q2 2016
1) Revenues calculated based on customer location; All numbers are non-IFRS.
EMEA
7% (+11% cc)cloud and software revenue
38% (+41% cc)cloud subscriptions
and support revenue
Americas
8% (+11% cc)cloud and software revenue
26% (+29% cc)cloud subscriptions
and support revenue
APJ
7% (+9% cc)cloud and software revenue
44% (+47% cc)cloud subscriptions
and support revenue

© 2016 SAP SE. All rights reserved. 66
Services
Cloud & Software
Software & Support
Cloud*
Business Network*
Total gross margin
Gross margin developmentQ2 2016
* subscriptions and support
Non-IFRS Q1/15
83.3 84.184.8 82.4
Q2/15 Q3/15
19.6 23.4
75.1 74.877.3
23.429.0
75.2
FY/14 Q4/15
24.3
72.3
85.1 86.1 86.786.3 87.7
65.1 65.768.864.3
63.066.3
13.9
75.3
85.9
Q1/16 Q2/16
83.7
65.2
17.9
76.3
87.4
83.8
22.7
74.9
FY/15
86.6
65.6
82.3
84.6
70.6 72.4 73.6 75.669.7
72.774.3 73.3

© 2016 SAP SE. All rights reserved. 77
Non-IFRS operating profit increased by 11% at cc in Q2 2016
Non-IFRS, Q2 2016
IFRS, Q2 2016
Non-IFRS operating profit+9% to €1.5bn (Q2/15: €1.4bn)+11% to €1.5bn at cc
Non-IFRS operating margin+0.9pp to 28.9% (Q2/15: 28.0%)+0.5pp to 28.6% at cc
Total operating expenses | Operating profit
€5.0bn
€5.2bn
€3.6bn
€3.7bn
Q2/15
Q2/16
€1.4bn
Total revenue
€1.5bn
IFRS operating profit+81% to €1.3bn (Q2/15: €0.7bn)
IFRS operating margin+10.1pp to 24.2% (Q2/15: 14.1%)
Total operating expenses | Operating profit
€5.0bn
€5.2bn
€4.3bn
€4.0bn
Q2/15
Q2/16
€0.7bn
Total revenue
€1.3bn

© 2016 SAP SE. All rights reserved. 88
Q2 2016 – Accelerated growth in operating profit while investingin fast growth areas
€ millions, unless otherwise stated
Rev enue Numbers Q2/16 Q2/15 ∆% Q2/16 Q2/15 ∆% ∆% at cc
Cloud subscriptions and support 720 552 30 721 555 30 33
Software licenses 1,040 979 6 1,042 979 6 10
Software support 2,598 2,531 3 2,598 2,531 3 6
Software licenses and support 3,639 3,510 4 3,640 3,510 4 7
Cloud and s oft ware 4,359 4,062 7 4,361 4,065 7 1 1
Serv ices rev enue 878 908 -3 878 908 -3 0
Tot al rev enue 5,2 37 4,970 5 5,2 39 4,972 5 9
O perat ing Ex pens e N umbers
Tot al operat ing ex pens es -3,968 -4,2 69 -7 -3,72 4 -3,578 4 8
Profit Numbers
O perat ing profit 1 ,2 69 701 81 1 ,51 6 1 ,394 9 1 1
Finance income, net -23 -11 >100 -23 -11 >100
Profit before t ax 1 ,1 44 637 80 1 ,391 1 ,330 5
Income tax expense -331 -168 97 -412 -369 11
Profit aft er t ax 81 3 469 73 979 960 2
O perat ing margin in % 2 4.2 1 4.1 +1 0.1 pp 2 8.9 2 8.0 +0.9pp +0.5pp
Bas ic earnings per s hare, in € 0.68 0.39 73 0.82 0.80 2
IFRS Non-IFRS

© 2016 SAP SE. All rights reserved. 99
Agenda
Income Statement
Outlook and Additional Information
Balance Sheet and Cash Flow Analysis
Brexit and Other Topics

© 2016 SAP SE. All rights reserved. 1010
Cloud subscriptions
and support revenue (Non-IFRS at cc)
Operating
profit (Non-IFRS at cc)
Cloud and
software revenue (Non-IFRS at cc)
Outlook for FY 2016
While the Company's full-year 2016 business outlook is at constant currencies, actual currency reported figures are expected to continue to be impacted by exchange rate fluctuations. If exchange rates remain at the end of June 2016 levels for the rest of the year, the Company expects its non-IFRS cloud and software revenue growth rate as well as its non-IFRS operating profit growth rate to experience a currency impact in a range of -1 to +1 percentage points for the third quarter 2016 (-2 to 0 percentage points for the full year 2016).
[ 2015: €6.35bn][ 2015: €17.23bn][2015: €2.30bn]
+8% €2.6bn |+8%€1.4bn |+33%Actual performance H1/16
+6% to 8% €6.4bn to €6.7bnSAP’s outlook FY 2016
€2.95bn to €3.05bnupper end +33%

© 2016 SAP SE. All rights reserved. 1111
Additional outlook information and non-IFRS adjustments
Non-IFRS adjustments
Revenue adjustments
Share-based payment expenses
Acquisition-related charges
Restructuring charges
Sum of all adjustments
Est. Amounts for FY 2016
<€20m
€560m to €610m
€680m to €730m
€30m to €50m
€1,290m to €1,410m
€4m
€177m
€336m
€22m
€538m
Actual AmountsH1/16
€8m
€314m
€371m
€418m
€1,112m
Actual AmountsH1/15
The company now expects a full-year 2016 effective tax rate (IFRS) between 27.0% to 28.0% (2015: 23.4%) and an effective tax rate (non-IFRS) between 28.0% to 29.0% (2015: 26.1%).

© 2016 SAP SE. All rights reserved. 1212
Agenda
Income Statement
Outlook and Additional Information
Balance Sheet and Cash Flow Analysis
Brexit and Other Topics

© 2016 SAP SE. All rights reserved. 1313
Balance sheet, condensedJune 30, 2016, IFRS
Assets€ millions
06/30/16 12/31/15
Cash, cash equivalents and other financial assets
4,591 3,762
Trade and other receivables 5,025 5,275
Other non-financial assets and tax assets
932 703
Total current assets 10,549 9,739
Goodwill 22,354 22,689
Intangible assets 3,884 4,280
Property, plant, and equipment 2,284 2,192
Other non-current assets 2,718 2,490
Total non-current assets 31,239 31,651
Total assets 41,788 41,390
Equity and liabilities€ millions
06/30/16 12/31/15
Trade and other payables 1,047 1,088
Provisions 191 299
Other liabilities 2,865 4,478
Deferred income, current 4,470 2,001
Total current liabilities 8,574 7,867
Financial liabilities 8,705 8,681
Provisions 201 180
Deferred income, non-current 106 106
Other non-current liabilities 1,238 1,262
Total non-current liabilities 10,250 10,228
Total liabilities 18,824 18,095
Total equity 22,963 23,295
Total equity and liabilities 41,788 41,390

© 2016 SAP SE. All rights reserved. 1414
Operating cash flow increased by 5% to €2.9 billion in H1 2016 and by 7% to €0.4 billion in Q2 2016
€ millions, unless otherwise stated01/01/16
- 06/30/1601/01/15
- 06/30/15 ∆
Operating cash flow 2,921 2,775 +5%
- Capital expenditure -406 -276 +47%
Free cash flow 2,516 2,500 +1%
Free cash flow as a percentage of total revenue 25% 26% -1pp
Cash conversion rate 2.11 3.15 -33%
Days sales outstanding (DSO in days) 73 68 +5
© 2016 SAP SE. All rights reserved. 1515
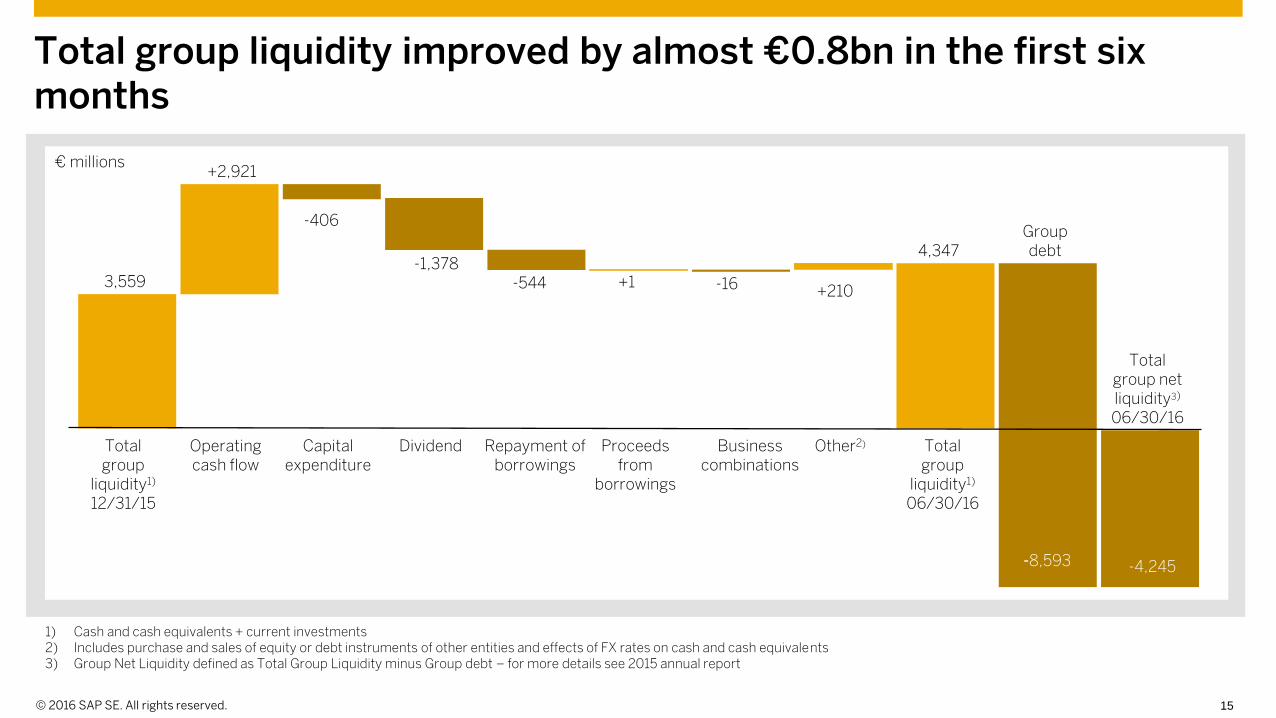
Total group liquidity improved by almost €0.8bn in the first six months
1) Cash and cash equivalents + current investments2) Includes purchase and sales of equity or debt instruments of other entities and effects of FX rates on cash and cash equivalents3) Group Net Liquidity defined as Total Group Liquidity minus Group debt – for more details see 2015 annual report
Total group netliquidity3)
06/30/16
Other2)Operating cash flow
Repayment of borrowings
Total group
liquidity1)
12/31/15
3,559
Total group
liquidity1)
06/30/16
Proceeds from
borrowings
+2,921
Group debt
Capitalexpenditure
4,347
Businesscombinations
-544 +1
-406
-16 +210
-1,378
Dividend
€ millions
-8,593 -4,245

© 2016 SAP SE. All rights reserved. 16
389
132 88
527
750
750
650
625*
625*
1.000
255
390
1.000
284
600
1.000
0
250
500
750
1,000
1,250
1,500
1,750
2,000
2,250
2016 2017 2018 2019 2020 2021 2022 2023 2024 2025 2026 2027
mE
UR Eurobonds: EUR 5.75bn
US PPs: USD 1.75bn (~ EUR 1.54bn)
3yrs Term Loan: EUR 1.25bn
* Potential maturity profile as term loan will be repaid flexibly depending on cash flow
Maturity Profile - June 30th 2016
• Fixed/Floating mix
o Fixed 36%
o Floating 64%
• USD/EUR mix
o USD 18%
o EUR 82%

© 2016 SAP SE. All rights reserved. 1717
Agenda
Income Statement
Outlook and Additional Information
Balance Sheet and Cash Flow Analysis
Brexit and Other Topics

© 2016 SAP SE. All rights reserved. 18
Brexit I.
GBP Revenue < 5% of total revenue
3 pronged approach to prepare for potential Brexit + aftermath of vote
– Existing liquidity in UK
– Hedging strategy
– UK Bank risk

© 2016 SAP SE. All rights reserved. 19
Brexit II.
Existing liquidity
– 86% of UK liquidity invested with SAP SE and has been hedged.
Hedging Strategy:
GBP balance sheet exposures at SE level to 23 June fully hedged
GBP cash flows hedged in accordance with our layered hedging approach for next 12 months
All EUR+USD balance sheet exposures in SAP UK hedged, even though they fell outside the guidelines where hedging would under normal circumstances not have been required, in order to further reduce exposure
Overall regular hedging program brought forward before the vote to avoid having to hedge in a potentially volatile market
Will continue to follow our foreign exchange management concept of hedging balance sheet and forecasted cash exposures

© 2016 SAP SE. All rights reserved. 20
Brexit III.
UK Bank Risk and Counterparty Risk Management
Brexit is expected to lead to downgrade in rating of UK Banks
Four UK based Banks part of RCF – out of a total of 27 banks
Withdrawal of RBS from overseas services ongoing
Reduction in exposure to RBS will continue as the cash management business is transferred
Monitor potential impact of rating on counterparties
Monitor potential spill over effect on other European banks

© 2016 SAP SE. All rights reserved. 21
Conversion of SAP Ireland U.S. Financial Services to a Designated Activity Company (DAC)
New name SAP Ireland US-Financial Services DAC
Not a transfer, existing legal entity remains
Simply a “Re-registration”
To comply with changes in Irish Company Law

© 2016 SAP SE. All rights reserved. 22
Support/Information for Debt Investors
Two calls per annum
– July and Jan/Feb
Other calls as needed
– for example acquisitions
Contact any of the Investor Relations/Treasury Team as per
next slide

© 2016 SAP SE. All rights reserved. 23
Contact Details for Investor Questions
Steffen Diel – Head of Global Treasury SAP SE • +49 6227 7-48208
Klaus Heizmann • +49 6227 7-44289• Responsibilities include bond investors
Dympna Donnelly• +353 (1) 471-7307• Responsibilities include USPP investors
Global Treasury
Stefan Gruber – Head of Investor Relations SAP SE • +49 6227 7-52727
Astrid Stroemer• +49 6227 7-52167• Responsibilities for Institutional Investors and Analysts, Europe
John Duncan • +1 (212) 653-1413• Responsibilities for Institutional Investors and Analysts, US
Scott Smith• +1 (650) 461-2905• Responsibilities for Institutional Investors and Analysts, US
For all email enquiries contact [email protected]
Investor Relations