Seattle Public Utilities 2019-2021 Drainage and Wastewater ...
52
Vas Duggirala SPU Wastewater Rates FISC EXH A August 14, 2018 Version #2 EXH A to SPU Wastewater Rates SUM Seattle Public Utilities 2019-2021 Drainage and Wastewater Rate Study
Transcript of Seattle Public Utilities 2019-2021 Drainage and Wastewater ...

Vas Duggirala
SPU Wastewater Rates FISC EXH A
August 14, 2018
Version #2
EXH A to SPU Wastewater Rates SUM
Seattle Public Utilities
2019-2021
Drainage and Wastewater
Rate Study
Vas Duggirala
SPU Wastewater Rates FISC EXH A
August 14, 2018
Version #2
EXH A to SPU Wastewater Rates SUM
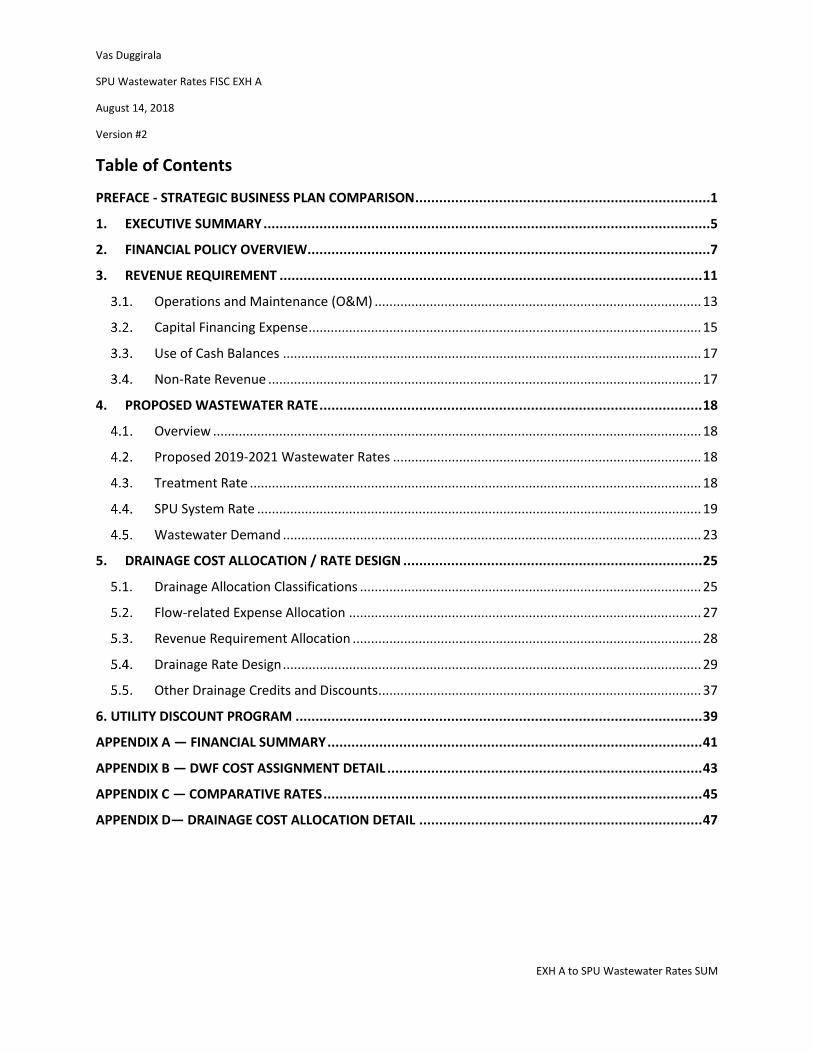
Table of Contents
PREFACE - STRATEGIC BUSINESS PLAN COMPARISON ..........................................................................1
1. EXECUTIVE SUMMARY ................................................................................................................5
2. FINANCIAL POLICY OVERVIEW .....................................................................................................7
3. REVENUE REQUIREMENT .......................................................................................................... 11
Operations and Maintenance (O&M) ......................................................................................... 13
Capital Financing Expense ........................................................................................................... 15
Use of Cash Balances .................................................................................................................. 17
Non-Rate Revenue ...................................................................................................................... 17
4. PROPOSED WASTEWATER RATE ................................................................................................ 18
Overview ..................................................................................................................................... 18
Proposed 2019-2021 Wastewater Rates .................................................................................... 18
Treatment Rate ........................................................................................................................... 18
SPU System Rate ......................................................................................................................... 19
Wastewater Demand .................................................................................................................. 23
5. DRAINAGE COST ALLOCATION / RATE DESIGN ........................................................................... 25
5.1. Drainage Allocation Classifications ............................................................................................. 25
Flow-related Expense Allocation ................................................................................................ 27
Revenue Requirement Allocation ............................................................................................... 28
Drainage Rate Design .................................................................................................................. 29
Other Drainage Credits and Discounts ........................................................................................ 37
6. UTILITY DISCOUNT PROGRAM ...................................................................................................... 39
APPENDIX A — FINANCIAL SUMMARY .............................................................................................. 41
APPENDIX B — DWF COST ASSIGNMENT DETAIL ............................................................................... 43
APPENDIX C — COMPARATIVE RATES ............................................................................................... 45
APPENDIX D— DRAINAGE COST ALLOCATION DETAIL ....................................................................... 47
Vas Duggirala
SPU Wastewater Rates FISC EXH A
August 14, 2018
Version #2
1 EXH A to SPU Wastewater Rates SUM
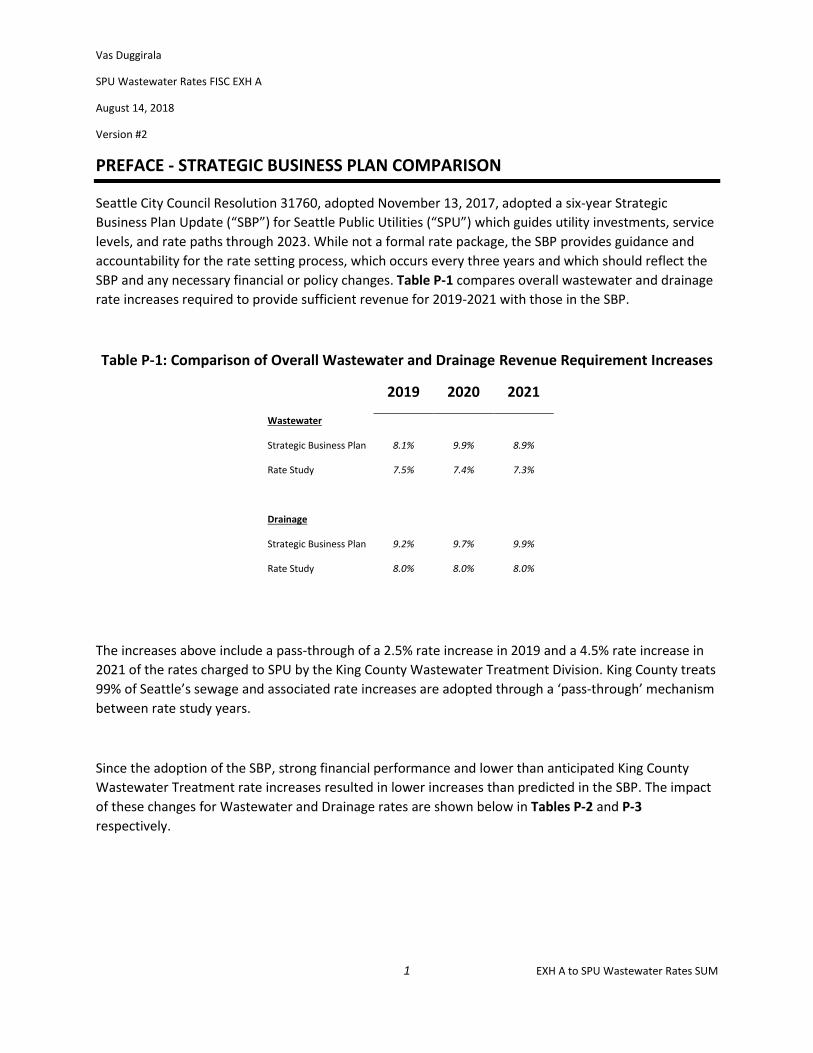
PREFACE - STRATEGIC BUSINESS PLAN COMPARISON
Seattle City Council Resolution 31760, adopted November 13, 2017, adopted a six-year Strategic
Business Plan Update (“SBP”) for Seattle Public Utilities (“SPU”) which guides utility investments, service
levels, and rate paths through 2023. While not a formal rate package, the SBP provides guidance and
accountability for the rate setting process, which occurs every three years and which should reflect the
SBP and any necessary financial or policy changes. Table P-1 compares overall wastewater and drainage
rate increases required to provide sufficient revenue for 2019-2021 with those in the SBP.
Table P-1: Comparison of Overall Wastewater and Drainage Revenue Requirement Increases
2019 2020 2021
Wastewater
Strategic Business Plan 8.1% 9.9% 8.9%
Rate Study 7.5% 7.4% 7.3%
Drainage
Strategic Business Plan 9.2% 9.7% 9.9%
Rate Study 8.0% 8.0% 8.0%
The increases above include a pass-through of a 2.5% rate increase in 2019 and a 4.5% rate increase in
2021 of the rates charged to SPU by the King County Wastewater Treatment Division. King County treats
99% of Seattle’s sewage and associated rate increases are adopted through a ‘pass-through’ mechanism
between rate study years.
Since the adoption of the SBP, strong financial performance and lower than anticipated King County
Wastewater Treatment rate increases resulted in lower increases than predicted in the SBP. The impact
of these changes for Wastewater and Drainage rates are shown below in Tables P-2 and P-3
respectively.

Vas Duggirala
SPU Wastewater Rates FISC EXH A
August 14, 2018
Version #2
2 EXH A to SPU Wastewater Rates SUM
Table P-2: Rate Impacts of Changes Since SBP on Proposed Rate Increases - Wastewater
2019 $ Change
from SBP
% Change in
Revenue
Requirement
2020 $ Change
from SBP
% Change in
Revenue
Requirement
2021 $ Change
from SBP*
% Change in
Revenue
Requirement
Expenditure
O&M & Taxes (3.1) -1.0% (1.7) -0.5% (0.7) -0.2%
Capital Financing (25.9) -8.6% 38.6 11.7% 2.9 0.8%
Treatment Costs (11.5) -3.8% (11.6) -3.5% (10.0) -2.8%
Total Expenditure Requirement (40.5) -13.5% 25.3 7.7% (7.8) -2.2%
Other Funding Sources 39.4 13.1% (32.0) -9.7% (0.7) -0.2%
Change in Revenue Requirement (1.1) -0.4% (6.6) -2.0% (8.5) -2.4%
Strategic Business Plan Rate Increases 8.1% 9.9% 8.9%
Change in Revenue Requirement -0.4% -2.0% -2.4%
Consumption, UDP, Financial Policies -0.2% -0.5% 0.8%
Proposed Increases 7.5% 7.4% 7.3%
($ in millions)
*Includes estimated passthrough for projected 2021 King County WTD rate increases.
Table P-3: Rate Impacts of Changes Since SBP on Proposed Rate Increases - Drainage
2019 $ Change from
SBP
% Change in
Revenue
Requirement
2020 $
Change from
SBP
% Change in
Revenue
Requirement
2021 $ Change
from SBP*
% Change in
Revenue
Requirement
Expenditure
O&M and Taxes 1.9 1.3% (0.5) -0.3% (3.5) -2.0%
Capital Financing 13.8 9.5% 4.0 2.5% 0.6 0.3%
Treatment Cost (0.8) -0.5% (0.7) -0.4% (0.7) -0.4%
Total Expenditure Requirement 14.9 10.2% 2.8 1.7% (3.6) -2.0%
Other Funding Sources (15.2) -10.4% (5.8) -3.6% (3.1) -1.8%
Change in Revenue Requirement (0.3) -0.2% (3.0) -1.9% (6.7) -3.8%
Strategic Business Plan Rate Increases 9.2% 9.7% 9.9%
Change in Revenue Requirement -0.2% -1.9% -3.8%
Consumption, UDP, Financial Policies -1.0% 0.2% 1.9%

Vas Duggirala
SPU Wastewater Rates FISC EXH A
August 14, 2018
Version #2
3 EXH A to SPU Wastewater Rates SUM
Proposed Increases 8.0% 8.0% 8.0%
($ in millions)
*Includes estimated passthrough for projected 2021 King County WTD rate increases.
Projected O&M expenses are lower than projected in the SBP by $3.1 million in 2019, $1.7 million in
2020, and $0.7 million in 2021 for wastewater, and higher in 2019 by $1.9 million for drainage, but lower
by $0.5 million in 2020 and $3.5 million in 2021. Overall, this is a $7.6 million savings over the rate
period.
Capital financing needs have risen by $34.0 million over the rate period. Compared with the SBP,
wastewater capital financing needs are projected to be $25.9 million lower in 2019 but $38.6 million
higher in 2020, while drainage is $13.8 million higher in 2019 and $4.0 million higher in 2020. Capital
financing is paid through a combination of bonds and operating cash.
These capital financing requirements are balanced by increases in Other Funding Sources, which
includes drawdowns of the DWF’s cash balances. These drawdowns are patterned to provide rate
stability, resulting in consistent rate increases. Overall, Other Funding Sources reduce the revenue
necessary to be collected through rates by $17.3 million compared to the SBP.
While generally not revenue requirement drivers, Utility Discount Program (UDP) participation and
changing consumption patterns are significant rate drivers. UDP discounts are a reduction in rates to
certain customers. As a result, increased revenue requirement results in higher overall rates to make up
the UDP-related revenue reduction. Proposed rates include an expansion in the UDP program to meet
the City and SPU’s affordability goals. Increased sewer consumption can allow the revenue requirement
to be spread over more units, which lowers rates. But while the City’s population has significantly
increased over the past decade, conservation efforts have offset commensurate increases in
consumption. In keeping, SPU anticipates relatively flat growth in consumption, with small increases as
construction on new housing and commercial space is completed and filled with consumers. Table P-4
compares the sewer consumption forecast used in the SBP and the current projection.
Table P-4: Sewer Consumption Forecast (CCF)
2018 2019 2020 2021
Strategic Business Plan Consumption 21.6 21.6 21.6 21.6
Proposed Consumption 20.3 20.5 20.8 21.0
(CCF in millions)

Vas Duggirala
SPU Wastewater Rates FISC EXH A
August 14, 2018
Version #2
4 EXH A to SPU Wastewater Rates SUM
Vas Duggirala
SPU Wastewater Rates FISC EXH A
August 14, 2018
Version #2
5 EXH A to SPU Wastewater Rates SUM
1. EXECUTIVE SUMMARY
The Drainage and Wastewater Utility provides wastewater and stormwater management services to
Seattle residences and businesses, and to a small number of wastewater customers outside city limits. It
is supported almost entirely by utility fee revenue. For wastewater, SPU collects fees from based on
metered water usage via the SPU combined utility bill. For drainage, SPU charges Seattle property
owners based on property characteristics contributing to stormwater run-off. The drainage fee appears
as a line item on King County property tax bills. Wastewater and drainage rates consist of a system
component, set to recover SPU expenses, and a treatment component, set to recover payments to King
County and Southwest Suburban Sewer District, whose facilities treat the wastewater conveyed by
SPU’s system.
Drainage and wastewater rates were last increased on January 1, 2018, when wastewater rates were
increased by 4.1 percent and drainage rates were increased by 10.7 percent. These rates were higher
than the 2016-2018 Rate Study due to Council Action in Fall 2017 to smooth rates between 2017-2019.
Rate increases for both drainage and wastewater will be necessary in all three years of the rate study
period for the DWF to cover increasing operating and capital expenses, which are required to address
significant needs for both systems. Cash and debt financing of new capital projects is a major driver of
rates for both drainage and wastewater. Some of the major capital programs proposed for 2019-2021
are:
• Consent Decree projects including:
o Lake Washington Ship Canal Water Quality Project
o Green Stormwater Infrastructure
• Accelerated infrastructure replacement in conjunction with Move Seattle
• Pipe renewal and rehabilitation
• South Park Pump Station
Per Seattle Municipal Code 21.28.040, the King County treatment rate is adopted via a pass-through
mechanism. A 2019 treatment rate increase of 2.5% was adopted by County Council in June 2018 and is
incorporated into this rate study; a future increase in 2021, currently projected at 4.5%, will not be
adopted until 2020. As a result, legislation adjusting SPU rates for the 2021 treatment rate change will
be submitted separately in 2020.
The total projected DWF direct service rate revenue requirement is $429.5 million in 2019, $465.8
million in 2020, and $504.9 million in 2021. Table 1-1 presents the annual revenue requirements and the
monthly impact of the proposed fees for different drainage customers and the typical residential
wastewater customer. Table 1-1 includes adopted and projected King County treatment rate increases
where noted. The 2021 increase has not been adopted by County Council and is subject to change.

Vas Duggirala
SPU Wastewater Rates FISC EXH A
August 14, 2018
Version #2
6 EXH A to SPU Wastewater Rates SUM
Table 1-1: Proposed DWF Revenue Requirement and Bill Impacts with Projected 2021 King
County Rate Increase
2018 2019 Proposed 2020 Proposed 2021 Proposed
Existing
Rates
Change from
2018
from
2019
from
2020
Net Revenue Requirement ($M)1
Wastewater2 $274.7 $288.1 $13.4 $313.2 $25.1 $340.0 $26.8
Drainage $130.1 $141.4 $11.3 $152.7 $11.3 $164.9 $12.2
Total DWF $404.8 $429.5 $24.7 $465.9 $36.4 $504.9 $39.0
Wastewater
Rate per CCF
Treatment $8.34 $8.84 $0.50 $8.84 $0.00 $9.26 $0.92
System $5.12 $5.64 $0.51 $6.71 $1.07 $7.42 $0.72
Wastewater Rate1,3 $13.46 $14.48 $1.01 $15.55 $1.07 $16.68 $1.14
Typical Monthly Residential Bill1,4 $57.88 $62.26 $4.38 $66.87 $4.61 $71.72 $4.85
Typical Monthly Drainage Bills with
Passthrough1
Typical Residential (5,000-6,999 sq. ft.) $40.07 $43.06 $2.99 $46.52 $3.46 $50.27 $3.75
Convenience Store (8,700 sq. ft.) $97.77 $103.75 $5.98 $112.09 $8.34 $121.12 $9.03
Supermarket (125,000 sq. ft.) $1,404.69 $1,490.63 $85.94 $1,610.42 $119.79 $1,740.21 $129.79
Table I-1 Notes:
1. Bill impacts include an adopted 2.5% increase in the King County treatment rate in 2019 and a projected 4.5% increase in 2021.
2. Wastewater revenue excludes industrial surcharge.
3. “CCF” is an acronym for ‘one hundred cubic feet’ and is equivalent to 748 gallons.
4. The typical monthly residential wastewater bill is based on 4.3 CCF per month.

Vas Duggirala
SPU Wastewater Rates FISC EXH A
August 14, 2018
Version #2
7 EXH A to SPU Wastewater Rates SUM
2. FINANCIAL POLICY OVERVIEW
The City of Seattle operates an integrated storm and sanitary sewerage system. Although funded
through separate rate structures, the City’s stormwater (“drainage”) and sanitary sewer (“wastewater”)
systems share common infrastructure, administrative and maintenance services, debt financing, and
financial budgeting and reporting systems.
SPU finances the acquisition, operation, and maintenance of Seattle’s drainage and wastewater system
through the Drainage & Wastewater Fund. An enterprise fund functions like a self-supporting business
that must generate operating revenues, predominantly through user charges (or “rates”), which are
sufficient to cover all operating costs and meet financial policy targets. Separate drainage and
wastewater service charges, or rates, are the source of most revenues. Non-rate revenues include
permit fee revenue, operating grants, capital grants, and contributions in aid of construction (“CIAC”).
These non-rate revenues reduce the amount of revenue that must be recovered through rates.
Financial policies provide a guiding framework for DWF finances. The policies help determines how
much DWF revenue SPU must collect from its customers each year to remain financially healthy while
meeting its financial obligations. These policies provide a comprehensive, inter-connected framework
wherein each policy reinforces the others. For example, debt service coverage is maintained by raising
enough excess operating revenue over the minimum cash obligations to meet ongoing operations and
debt service payments. This in turn leads to higher levels of operating cash and a lower debt-to-asset
ratio. Build ups in operating cash can be contributed to CIP, lessening the need for future debt
issuances, lowering the revenue required to meet debt service coverage.
The financial policy that requires the highest level of revenue to be satisfied is the “binding constraint.”
If revenue were to be lowered beyond that level, the binding constraint financial policy would not be
met. Currently, the DWF is very close to bumping up against three binding constraints. The first is debt
service coverage with taxes, followed by cash contributions to CIP, and finally year-end operating cash
balance. Reducing rate increases below the proposal would hamper SPU’s ability to meet the necessary
year-end debt service coverage target and put at risk the Fund’s bond rating.
In addition, financial policies:
• Shape the financial profile that SPU presents to lenders and other members of the financial
community
• Establish DWF’s exposure to financial risk
• Allocate DWF’s costs between current and future ratepayers
DWF financial policies were adopted by City Council in 2003 by Resolution 30612 and reviewed in 2012
under Statement of Legislative Intent No. 13-1-A-1. The policies and associated targets, as well as their
importance are as follows:
Vas Duggirala
SPU Wastewater Rates FISC EXH A
August 14, 2018
Version #2
8 EXH A to SPU Wastewater Rates SUM
Operating Cash Balance
The year-end operating cash balance should be at least equal to one month’s contract expenses.
The purpose of the cash balance target is to have sufficient cash on hand to pay operating expenses,
taking into account the lag between cash disbursements and cash receipts, and to provide a reserve
against projection variances. Contract costs for treatment of sewage and stormwater by King County is
the DWF’s largest expense, thus it is used as a proxy for the DWF cash balance target. In 2017, one
month of treatment expenses was $13.6 million. SPU uses an internal planning target of 45-days
operating expenses. In 2017 this target was $42.5 million. SPU’s rate proposal maintains a higher year-
end cash balance of $77 million in 2021. This higher cash balance, in addition to maintaining a high debt
service coverage ratio as described above, will enable the DWF to better manage its bond rating as it
places SPU closer to peer utilities to which rating agencies compare when determining the DWF’s rating
before a bond issuance. Part of the evaluation criteria rating agencies utilize is to benchmark various
financial metrics of the DWF to utilities of similar size and services. Reducing proposed rates would
reduce DWF revenue below the level required to achieve the target of $77 million, making this level of
operating cash a binding constraint. Operating cash is a binding constraint in addition to cash
contribution to the capital improvement program below.
Cash Contribution to the Capital Improvement Program
The cash contribution to the CIP should be at least 25% of total CIP expenses based on a four-year
average.
This policy helps to prevent a rapid increase in debt levels and limits the escalation in the debt-to-asset
ratio. The four-year rolling average of cash contribution to the CIP is expected to be 25% for the rate
study period. SPU has proposed rates that enable the DWF to collect enough revenue which along with
balanced operating cash drawdowns will allow a contribution of $215 million to a projected $845 million
in investment (25.4%). Reducing proposed rates would not produce enough revenue to meet the 25%
cash contribution target without lowering operating cash revenues below $77 million. These two
policies are the joint binding constraints in the rate period.
Debt Service Coverage Ratio
Debt Service Coverage should be at least 1.8 times debt service cost in each year on a planning basis.
A higher debt service coverage ratio means that more revenue is available after debt payments are
made. This reduces financial risk and provides more flexibility to respond to revenue shortfalls.
SPU rates assume maintaining a higher debt service coverage ratio of at least 2.0 without taxes and 1.5
with taxes based on feedback from the City’s financial advisors and rating agencies (Standard and Poors’
and Moody’s). This level of debt service will defend the DWF’s bond rating during a time of increased
capital investment. SPU plans to issue, on average, over $200 million of debt each year of the rate
period resulting in an additional $56 million of debt service. A potential downgrade would lead to higher
Vas Duggirala
SPU Wastewater Rates FISC EXH A
August 14, 2018
Version #2
9 EXH A to SPU Wastewater Rates SUM
interest rates, raising the annual debt service obligation by at least $1.0 million per year. In addition to
increased monetary obligations to be incurred in the coming years, the downgrade is long-term damage
to SPU’s credit worthiness, which is not easily reversible, and would limit SPU’s financial flexibility in
meeting future capital investment or resiliency needs for the coming decades.
A growing Capital Improvement Program (CIP) necessitates the issuance of debt and maintaining a
strong bond rating will enable debt financing at continued favorable interest rates, ensure future
financial flexibility, and ultimately lower long-term rates for customers.
Projected coverage, including coverage for a new bond issue in each year of the rate period, is above
both the legal bond covenant requirement (1.25) and the policy target (1.80).
Net Income
Net income should be generally positive.
Positive net income is a contingency against projection variances and uncertainties regarding revenues.
It is also a signal to bond rating agencies that the City is committed to establishing fees that cover costs.
Net income is projected to be positive for 2019, 2020, and 2021.
Debt to Asset Ratio
The ratio of debt to assets should not exceed 70%.
This ratio is an indicator of reliance on debt for infrastructure financing. A high ratio suggests less
flexibility, as a greater portion of each year’s revenues is used to repay debt. Over the rate period, the
debt-to-asset ratio is expected to remain below the 70% threshold.
Variable Rate Debt
No more than 15% of total debt should be variable rate debt.
A cap on variable rate debt balances the advantages of lower interest costs with the risk of unexpected
increases in interest rates. The DWF currently does not have any variable rate debt and does not plan to
issue any variable rate debt.
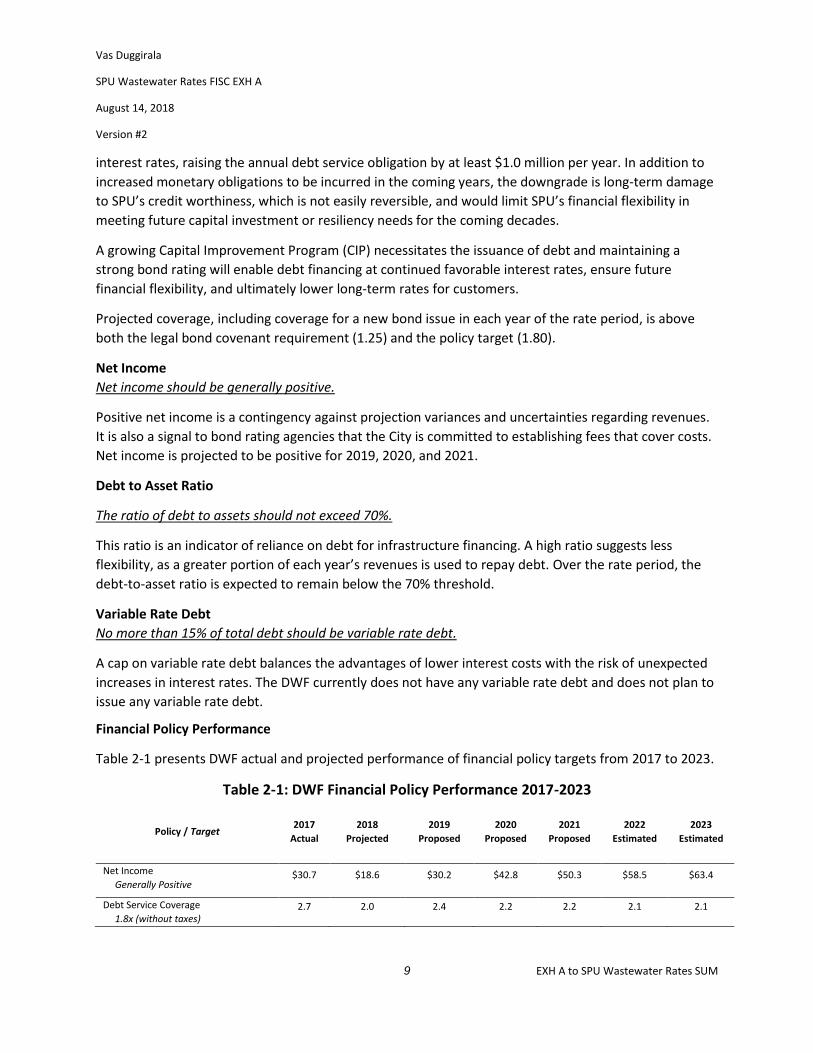
Financial Policy Performance
Table 2-1 presents DWF actual and projected performance of financial policy targets from 2017 to 2023.
Table 2-1: DWF Financial Policy Performance 2017-2023
Policy / Target 2017
Actual
2018
Projected
2019
Proposed
2020
Proposed
2021
Proposed
2022
Estimated
2023
Estimated
Net Income
Generally Positive $30.7 $18.6 $30.2 $42.8 $50.3 $58.5 $63.4
Debt Service Coverage
1.8x (without taxes) 2.7 2.0 2.4 2.2 2.2 2.1 2.1
Vas Duggirala
SPU Wastewater Rates FISC EXH A
August 14, 2018
Version #2
10 EXH A to SPU Wastewater Rates SUM
Debt Service Coverage1
1.5x (with taxes)
1.8 1.3 1.6 1.5 1.5 1.5 1.5
Cash Balance Year End1
45 Days of Operating Expense2 $164.5 $168.0 $138.7 $92.2 $77.2 $72.2 $72.2
Cash Financing of CIP1
25% (4-year average)
30% 14% 30% 33% 21% 27% 35%
Debt-to-Asset Ratio
Less than or equal to 70% 65% 57% 62% 64% 65% 64% 62%
Variable Rate Debt
Less than or equal to 15% 0% 0% 0% 0% 0% 0% 0%
1Debt service coverage with Taxes, cash balance at year end, and cash financing of the CIP are the binding constraints
2Internal planning target. Official target is 1-month treatment contract expense

Vas Duggirala
SPU Wastewater Rates FISC EXH A
August 14, 2018
Version #2
11 EXH A to SPU Wastewater Rates SUM
3. REVENUE REQUIREMENT
Financial policies provide a guiding framework for drainage and wastewater finances. The policies help
determine how much DWF revenue SPU must collect from its customers each year to remain financially
healthy. In any year (on a planning basis), the desired revenue requirement is the lowest amount of
money necessary to simultaneously satisfy all financial policies in that year. At this desired revenue,
some financial policies may be exceeded, but none will be missed – the financial target that is met last is
known as the “binding constraint.” For this rate proposal, the binding constraints are debt service
coverage with taxes, the sum of cash required to meet year-end cash balance, and CIP cash financing
targets. The rates revenue requirement is equal to the total revenue requirement necessary to meet the
binding constraint, less any non-rates revenues. Drainage and wastewater service fees (or “rates
revenues”) typically account for over 95 percent of drainage and wastewater revenues. Non-rate
revenues include permit fees, miscellaneous operating revenues, interest income, operating grants,
capital grants, and contributions in aid of construction.
Tables 3-1 and 3-2 summarize the components of change in the drainage and wastewater revenue
requirement for 2019, 2020, and 2021. These tables include the impact of the King County treatment
increase in 2019 and a projected increase in 2021. No increase is expected in 2020. The top sections of
these tables present the components of expense which make up the total revenue requirement. The
bottom section of these tables presents other sources of funding which reduce the amount of expense
which must be recovered through direct service rates. Following the tables below is a more detailed
description of the components of change in the revenue requirement.
Vas Duggirala
SPU Wastewater Rates FISC EXH A
August 14, 2018
Version #2
12 EXH A to SPU Wastewater Rates SUM
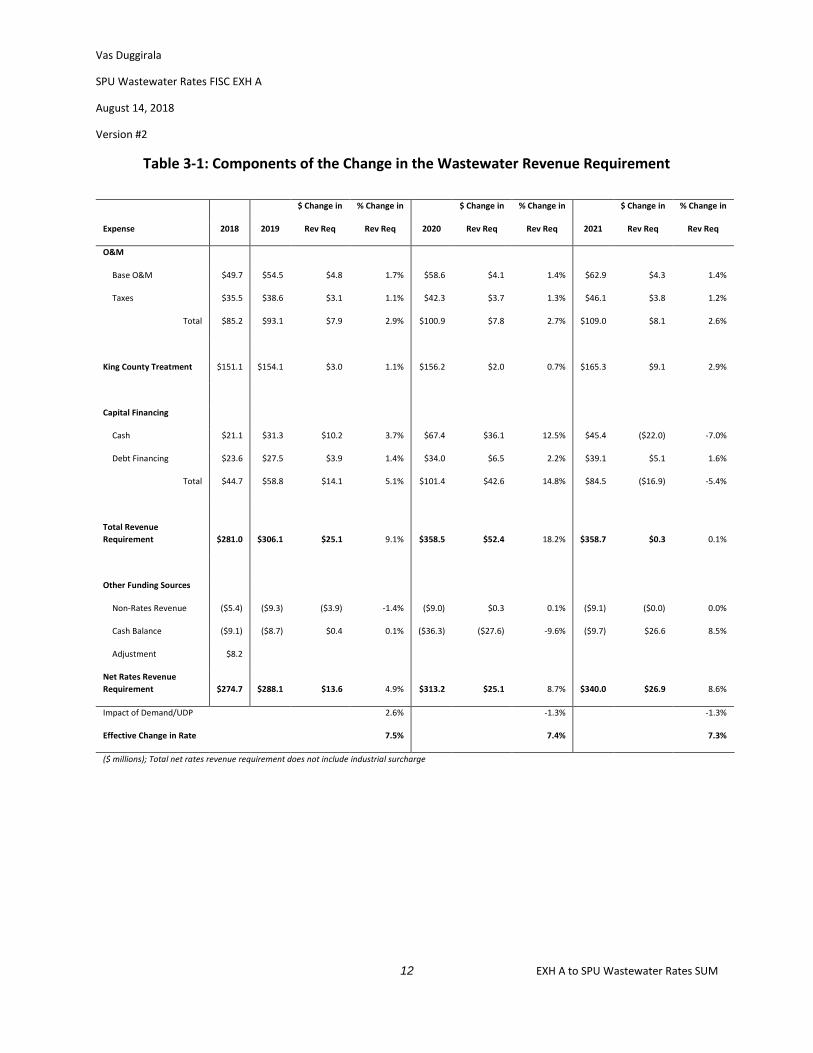
Table 3-1: Components of the Change in the Wastewater Revenue Requirement
$ Change in % Change in $ Change in % Change in $ Change in % Change in
Expense 2018 2019 Rev Req Rev Req 2020 Rev Req Rev Req 2021 Rev Req Rev Req
O&M
Base O&M $49.7 $54.5 $4.8 1.7% $58.6 $4.1 1.4% $62.9 $4.3 1.4%
Taxes $35.5 $38.6 $3.1 1.1% $42.3 $3.7 1.3% $46.1 $3.8 1.2%
Total $85.2 $93.1 $7.9 2.9% $100.9 $7.8 2.7% $109.0 $8.1 2.6%
King County Treatment $151.1 $154.1 $3.0 1.1% $156.2 $2.0 0.7% $165.3 $9.1 2.9%
Capital Financing
Cash $21.1 $31.3 $10.2 3.7% $67.4 $36.1 12.5% $45.4 ($22.0) -7.0%
Debt Financing $23.6 $27.5 $3.9 1.4% $34.0 $6.5 2.2% $39.1 $5.1 1.6%
Total $44.7 $58.8 $14.1 5.1% $101.4 $42.6 14.8% $84.5 ($16.9) -5.4%
Total Revenue
Requirement $281.0 $306.1 $25.1 9.1% $358.5 $52.4 18.2% $358.7 $0.3 0.1%
Other Funding Sources
Non-Rates Revenue ($5.4) ($9.3) ($3.9) -1.4% ($9.0) $0.3 0.1% ($9.1) ($0.0) 0.0%
Cash Balance ($9.1) ($8.7) $0.4 0.1% ($36.3) ($27.6) -9.6% ($9.7) $26.6 8.5%
Adjustment $8.2
Net Rates Revenue
Requirement $274.7 $288.1 $13.6 4.9% $313.2 $25.1 8.7% $340.0 $26.9 8.6%
Impact of Demand/UDP 2.6% -1.3% -1.3%
Effective Change in Rate 7.5% 7.4% 7.3%
($ millions); Total net rates revenue requirement does not include industrial surcharge

Vas Duggirala
SPU Wastewater Rates FISC EXH A
August 14, 2018
Version #2
13 EXH A to SPU Wastewater Rates SUM
Table 3-2: Components of the Change in the Drainage Revenue Requirement
$ Change in % Change in $ Change in % Change in $ Change in % Change in
Expense 2018 2019 Rev Req Rev Req 2020 Rev Req Rev Req 2021 Rev Req Rev Req
O&M
Base O&M $59.6 $68.9 $9.3 7.2% $70.7 $1.8 1.3% $72.2 $1.5 1.0%
Taxes $16.4 $18.4 $2.0 1.5% $19.9 $1.5 1.0% $21.5 $1.6 1.0%
Total $76.0 $87.3 $11.3 8.7% $90.6 $3.2 2.3% $93.6 $3.1 2.0%
King County Treatment $9.5 $9.9 $0.4 0.3% $10.1 $0.1 0.1% $10.6 $0.6 0.4%
Capital Financing
Cash $5.2 $25.7 $20.5 15.8% $11.9 ($13.9) -9.8% $7.4 ($4.5) -2.9%
Debt Financing $40.9 $43.4 $2.5 1.9% $53.6 $10.2 7.2% $61.7 $8.1 5.3%
Total $46.1 $69.1 $23.0 17.7% $65.5 ($3.7) -2.6% $69.1 $3.6 2.4%
Total Revenue
Requirement $131.6 $166.4 $34.8 26.8% $166.1 ($0.3) -0.2% $173.4 $7.3 4.7%
Other Funding Sources
Non-Rates Revenue ($3.3) ($4.5) ($1.2) -0.9% ($3.5) $1.0 0.7% ($3.5) ($0.1) 0.0%
Cash Balance ($2.0) ($20.4) ($18.4) -14.2% ($9.9) $10.5 7.4% ($4.9) $5.0 3.3%
Adjustment $3.8
Net Rates Revenue
Requirement $130.1 $141.4 $11.3 8.8% $152.7 $11.3 8.0% $164.9 $12.2 8.0%
Impact of Demand/UDP -0.8% 0.0% 0.0%
Effective Change in Rate 8.0% 8.0% 8.0%
($ millions)
Operations and Maintenance (O&M)
The drainage and wastewater O&M revenue requirement includes direct operating expense associated
with managing sanitary sewer and stormwater programs (i.e., regulatory oversight, community outreach
and education) and aggressively maintaining the system infrastructure, as well as a portion of DWF
shared administrative expense. As operating expenses are budgeted for the DWF as a whole and not by
line of business (wastewater or drainage), operating expenses must be assigned to each line of business
in order to establish separate revenue requirements for rate-setting purposes. The factors used to

Vas Duggirala
SPU Wastewater Rates FISC EXH A
August 14, 2018
Version #2
14 EXH A to SPU Wastewater Rates SUM
assign expense between the two lines of business are periodically updated, which can result in changes
in the share of expense paid by either wastewater or drainage.
The O&M enables SPU to continue to provide core services to customers, invest in critical capital assets,
and meet federal mandates. The majority of SPU’s increases since the 2016-2018 rate study are related
to updated inflation assumptions and new expenses identified in the SBP. These include increased
regulatory requirements, transportation-related projects, and various projects further discussed in the
following sections.
Allocation Revision in Detail
Operating expenses are budgeted for the DWF as a whole and individually between wastewater or
drainage. Consequently, operating expenses must be assigned to each line of business to establish
separate revenue requirements for rate-setting purposes. SPU has developed a series of factors to
assign cost, by budget activity, to wastewater and to drainage.
The DWF budgeted O&M expenses include both line-of-business-specific expenses (e.g., water quality
monitoring or wastewater treatment), as well as shared administrative and business support expense.
Shared expenses are assigned to each line of business based on prior period actual direct labor expense
or on management estimates (where labor expense is not appropriate).
As part of the current rate study, SPU reviewed the existing labor-based cost assignment factors and
adjusted the allocation based on 2017 actual spending. While some areas saw increases in the
wastewater share, the net cost shift because of this update was a shift from wastewater to drainage.
Table 3-3 presents a summary of 2017 cost assignment changes by program. The change in allocation
based on 2017 actual data shifts the allocation of O&M to drainage from 52.4% of total pre-adjusted
base O&M to 53.6%. Appendix D provides more detailed information on the cost assignment process.
Table 3-3: Change in Drainage Share of DWF O&M Spending
Program 2016-2018
Allocation
Updated
Allocation
Customer Service 31.9% 34.3%
Director’s Office 59.6% 55.7%
Project Delivery 58.8% 57.1%
Pre-Capital Planning & Development 50.4% 53.4%
Field Operations 47.2% 55.3%
Finance & Administration 52.5% 50.8%
Utility Systems Management 69.3% 55.0%
SPU General Expenses 55.1% 57.8%

Vas Duggirala
SPU Wastewater Rates FISC EXH A
August 14, 2018
Version #2
15 EXH A to SPU Wastewater Rates SUM
Drainage Weighted Average 52.4% 53.6%
Total DWF O&M $123.4 $123.4
Drainage Share of Total O&M $64.7 $66.2
Wastewater Share $58.7 $57.2
($ in millions)
Capital Financing Expense
The DWF funds capital projects through a combination of cash (from direct service and non-rates
revenue) and debt financing (revenue bonds).
Capital Improvement Program
The 2019-2021 rate proposal includes an average of $245 million of capital investment annually, up from
an average of $80 million per year over the past decade. The increase is driven primarily by the Ship
Canal Water Quality Project and other activities intended to bring SPU into compliance with Federal
water quality regulations. The remainder of planned investment consists of rehabilitation and upgrade
of pipes and pump stations, flood control, and dispersed green stormwater infrastructure projects, with
smaller amounts for operations facilities and decant and dewatering facilities. SPU has also identified
opportunities to reduce long term capital investment program expenses by moving up planned
replacement and upgrade of pipes to coincide with Seattle Department of Transportation levy-related
transportation work. The CIP plan includes $78 million for transportation-related utilities work.
Figure 3-1: Annual Historic and 2018-2023 Planned Capital Investments
Financial policies require the DWF to fund a minimum of 25% of CIP through operating cash over a 4-
year average. For the proposed 3-year rate period, the 4-year average is calculated using the years 2018-
0
50
100
150
200
250
300
2008 2009 2010 2011 2012 2013 2014 2015 2016 2017 2018 2019 2020 2021 2022 2023
An
nu
al C
apit
al I
nve
stm
en
ts ($
in m
illio
ns)
2018-2023 Projected
Vas Duggirala
SPU Wastewater Rates FISC EXH A
August 14, 2018
Version #2
16 EXH A to SPU Wastewater Rates SUM
2021. The target minimum requirement for these 4-years is $211 million out of a total CIP of $845
million ($861 million planned less an accomplishment rate of 97.5% except for 100% on combined sewer
overflow (CSO) projects including the Ship Canal WQ project). However, SPU plans to fund an additional
$3.5 million of CIP through operating cash as part of its cash management policies.
Debt Service
SPU has typically issued $60 to $100 million in new DWF revenue bonds every other year. Increased
investment in the current SBP period (2018-2023) will require larger, more frequent issues including
$240 million in 2019, $210 million in 2020, and $169 million in 2021. These issues will add, respectively,
$22 million, $19 million, and $15.4 million to debt service in the year following each issue. SPU will
continue to pursue alternative forms of financing including grants and Washington State Department of
Ecology State Revolving Fund (SRF) and US Environmental Protection Agency Water Infrastructure and
Finance Innovation Act (WIFIA) loans when these alternative financing options provide long-term rate
relief.
Annual debt service is proportioned between drainage and wastewater based on the net book value of
current fixed assets (“asset basis”). This methodology, which is similar to that used by SPU’s Water and
Solid Waste funds, correlates financing expense with the assets actually financed.
Cash Financing
Financial policy targets are directed toward the financial performance of the total DWF. No formal,
separate policy targets have been adopted for the drainage and wastewater program. SPU meets
financial targets by balancing revenue requirements and rate changes between wastewater and
drainage.
The cash-financing target of 25% is determined using an average over a 4-year period, which includes
the year before the rate study period. For 2029-2021 rates, the target of 25% must be met over the 4-
year period of 2018 through 2021. Due to lower than anticipated CIP in 2017, bond funds were not
drawn down as quickly as projected at the time of issue. In order to draw down bond funds, 2018 cash-
to-CIP will be lowered from the standard 25% to 14%. At this level of 2018 funding, the 2015-2018
average will be 25%. Cash contributions to CIP will be increased in the years 2019-2021 to achieve a 25%
average as displayed in Table 3-4.
Table 3-4: Projected Cash Financing of CIP
2018 2019 2020 2021 Total /
Average
Cash and Grant Funded $17.2 $59.8 $82.1 $55.5 $214.6*
Bond-Funded $109.7 $142.5 $169.5 $208.7 $630.4
Total CIP $126.9 $202.3 $251.5 $264.2 $844.9
Cash-Funded % 14% 30% 33% 21% 25%

Vas Duggirala
SPU Wastewater Rates FISC EXH A
August 14, 2018
Version #2
17 EXH A to SPU Wastewater Rates SUM
($ in millions)
* The minimum cash contribution is $211 million
Use of Cash Balances
Revenue generated by rates is used to fund current operating expenses, maintain a cash balance as a
safeguard against unexpected expense, and fund a portion of the current CIP. Net cash revenue is equal
to total cash revenue less total cash expense, and for a given year net cash revenue may be positive or
negative. This differs from net income which includes non-cash items such as depreciation,
amortization, and environmental liabilities, and excludes cash expenses such as debt service principal
payments. A change in net cash revenue from one rate period to the next will impact the revenue
requirement. An increase in total net cash revenue will drive a revenue requirement increase while a
decrease will reduce the revenue requirement.
DWF cash balances will be reduced from $166 million at the beginning of 2018 to $77 million by the end
of 2021. The reduction in cash balances is intended to provide rate smoothing against increased
investment needs and debt service obligations. Cash balance reductions will reduce the wastewater
revenue requirement by $8.7M in 2019, and $36.3 million in 2020, and $9.7 million in 2021. The
drainage revenue requirement is lowered by $20.4 million in 2019, $9.9 million in 2020, and $4.9 million
in 2021.
Non-Rate Revenue
Non-rate revenue includes permit fees, operating and capital grants, contributions in aid of
construction, interest income, other miscellaneous revenues, and capital contributions. An increase in
non-rate revenues has the effect of reducing the revenue requirement that must be recovered through
rates. Grants, contributions, miscellaneous revenues, and permit fees are conservatively held flat in this
proposal as it is not fiscally prudent to pattern rates on unsecured revenue, however SPU expects to
increase outside sources of funding wherever opportunities can be identified.

Vas Duggirala
SPU Wastewater Rates FISC EXH A
August 14, 2018
Version #2
18 EXH A to SPU Wastewater Rates SUM
4. PROPOSED WASTEWATER RATE
Overview
City of Seattle residents pay a single fee per CCF of wastewater based on water consumption. This single
fee is composed of two components, a system rate and a treatment rate, which are adopted through
two discrete processes. The system rate is proposed by the Executive and formally adopted by Council.
The treatment rate, which is adopted by King County, is presented to Council in the form of a
memorandum and adopted outside of the formal rate study process as a pass-through.
Proposed 2019-2021 Wastewater Rates
Table 4-1 presents the proposed 2019 through 2021 wastewater rates, and the impact of the adopted
2019 and proposed 2021 King County treatment rate increases.
Table 4-1: Proposed 2019-2021 Wastewater Rate (per CCF)
2018 2019 2020 2021
Adopted Proposed Proposed Proposed
System Rate (SPU) $5.12 $5.64 $6.71 $7.42
Treatment Rate (KC) $8.34 $8.84 $8.84 $8.84
Future Estimated Pass Through (KC)* $0.42
Total Wastewater Rate $13.46 $14.48 $15.55 $16.68
*The passthrough assumes a 4.5% increase in the King County treatment rate in 2021
Treatment Rate
Payments to King County1 for wastewater treatment are the single largest component of both
wastewater and total DWF operating expense. The inability to fully recover this expense through rates
could seriously impact DWF financial performance. To mitigate this risk the Council adopted Ordinance
122292, providing for an annual adjustment to the treatment rate when there is a change in the
underlying cost drivers. The formula for this adjustment is defined in the ordinance, allowing for the
treatment rate to be adopted outside of a normal rates process. The formula is as follows:
1 King County treats over 99 percent of the City’s sewage. The Southwest Suburban Sewer District treats the remainder.

Vas Duggirala
SPU Wastewater Rates FISC EXH A
August 14, 2018
Version #2
19 EXH A to SPU Wastewater Rates SUM
Projected wastewater treatment expense / Projected annual wastewater volumes
X
A 18.7 percent multiplier (to recover revenue reductions and revenue taxes)
Projected treatment expense includes an adjustment for cash lags in the full recovery of treatment
expense in years in which there is a rate increase. For the purposes of this calculation, treatment
expense excludes the portion of budgeted treatment expense associated with King County’s High
Strength Industrial and Contaminated Stormwater Surcharges. These expenses are recovered directly
from applicable customers and not through the wastewater direct service rate.
The City recovers wastewater expense exclusively through a volume-based fee. However, the County
charges a fixed rate per residential premise, while commercial water volumes are converted to a
“Residential Equivalent Unit” (REU) and charged accordingly based on flow treated. Residential flows
account for about 36 percent of total sewer volumes (and therefore total City revenues). Charges for
residential premises account for about 40 percent of total treatment expense paid to the County.
Consequently, if the County treatment rate is held constant but Seattle billed wastewater volumes
decline, the resulting decrease in the City’s wastewater revenues will be greater than the associated
decline in treatment expense paid to King County.
SPU System Rate
The system component of the SPU wastewater rate is proposed by the Executive via ordinance, with this
rate study document as an exhibit, and adopted through City Council’s normal legislative process. The
system rate recovers all other operating expense, including operations and maintenance expense,
capital financing expense (debt service and cash), and related revenue taxes. This component of the rate
is also set to ensure that financial policy targets are met in the case that the revenue required to meet
the targets exceeds the revenue required to recover operating expense (see Section II of this proposal
for more detail).
The current proposed wastewater system rates are presented in Table 4-2.
Table 4-2: 2019-2021 Wastewater System Expense
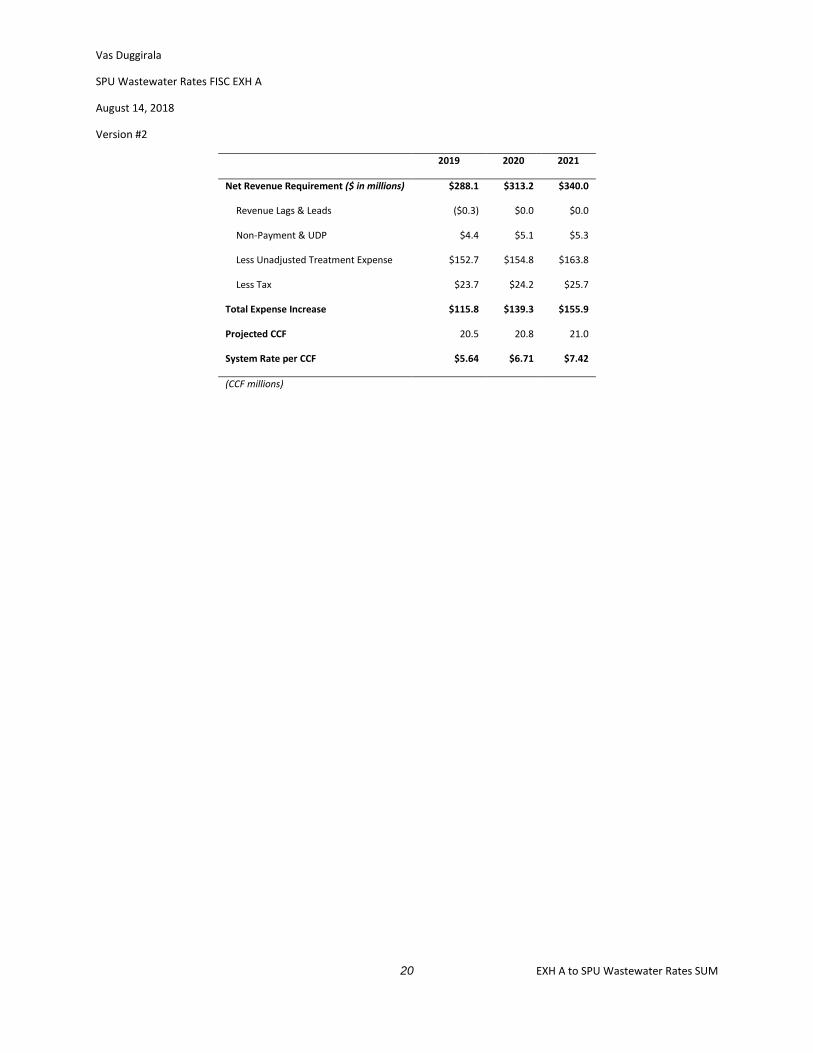
Vas Duggirala
SPU Wastewater Rates FISC EXH A
August 14, 2018
Version #2
20 EXH A to SPU Wastewater Rates SUM
2019 2020 2021
Net Revenue Requirement ($ in millions) $288.1 $313.2 $340.0
Revenue Lags & Leads ($0.3) $0.0 $0.0
Non-Payment & UDP $4.4 $5.1 $5.3
Less Unadjusted Treatment Expense $152.7 $154.8 $163.8
Less Tax $23.7 $24.2 $25.7
Total Expense Increase $115.8 $139.3 $155.9
Projected CCF 20.5 20.8 21.0
System Rate per CCF $5.64 $6.71 $7.42
(CCF millions)

Vas Duggirala
SPU Wastewater Rates FISC EXH A
August 14, 2018
Version #2
21 EXH A to SPU Wastewater Rates SUM
Tables 4-3, 4-4 and 4-5 present the 2019 through 2021 Sources and Uses of system and treatment
revenue/expense, assuming proposed rates and spending.
Table 4-3: 2019 Change in Wastewater System & Treatment Expense
System Treatment Total Wastewater
Wastewater Rates $112.2 $175.9 $288.1
Other Operating Revenue $6.4
$6.4
Non-Operating Revenue $2.9
$2.9
Total Sources $121.5 $175.9 $297.4
O&M $54.5 $154.1 $208.6
Taxes $15.8 $22.9 $38.6
Debt Service $27.5
$27.5
Cash Financing of CIP $31.3
$31.3
Total Uses $129.1 $177.0 $306.1
Sources net of Uses $(7.6) $(1.1) $(8.7)
Table 4-4: 2020 Change in Wastewater System & Treatment Expense
System Treatment Total Wastewater
Wastewater Rates $135.1 $178.1 $313.2
Other Operating Revenue $6.4
$6.4
Non-Operating Revenue $2.6
$2.6
Total Sources $144.1 $178.1 $322.2
O&M $58.6 $156.2 $214.7
Taxes $18.9 $23.4 $42.3
Debt Service $34.0
$34.0
Cash Financing of CIP $67.4
$67.4
Total Uses $178.9 $179.6 $358.5
Sources net of Uses $(34.8) $(1.5) $(36.3)
Vas Duggirala
SPU Wastewater Rates FISC EXH A
August 14, 2018
Version #2
22 EXH A to SPU Wastewater Rates SUM

Vas Duggirala
SPU Wastewater Rates FISC EXH A
August 14, 2018
Version #2
23 EXH A to SPU Wastewater Rates SUM
Table 4-5: 2021 Change in Wastewater System & Treatment Expense
System Treatment Total Wastewater
Wastewater Rates $151.3 $188.7 $340.0
Other Operating Revenue $6.6
$6.6
Non-Operating Revenue $2.5
$2.5
Total Sources $160.3 $188.7 $349.1
O&M $62.9 $165.3 $228.2
Taxes $21.2 $24.9 $46.1
Debt Service $39.1
$39.1
Cash Financing of CIP $45.4
$45.4
Total Uses $168.5 $190.2 $358.7
Sources net of Uses $(8.2) $(1.5) $(9.7)
Includes a projected 4.5% increase in the King County treatment rate
Wastewater Demand
Since the 2008 Financial Crisis, the City has increased in population by 21% and increased the number of
housing units by 18%. The increase in population was accommodated through infill development
primarily replacing older, less-efficient single-family houses with modern townhomes and multi-family
buildings built to stricter resource efficiency standards. Due to these standards, conservation work on
existing buildings, and more resource-conscience customer behavior, total wastewater volumes
remained unchanged at 21 million CCF between 2008 and 2017. Volumes from the commercial and
multi-family sector have been increasing 0.2% per year, balanced by a 0.3% average annual decrease in
single-family and townhome volumes. This proposal starts from an expected down year of 20.5 million
CCF in 2018 based on YTD results as of June 2018 and historical patterns and increases volumes to
return to 21 million CCF by 2021.
Overall consumption is expected to remain at close to 21 million CCF per year, with a slight increase in
commercial consumption balancing out a slight decline in single-family consumption. Consumption
through the end of the SBP period in 2023 is expected to remain at 21 million CCF.
Vas Duggirala
SPU Wastewater Rates FISC EXH A
August 14, 2018
Version #2
24 EXH A to SPU Wastewater Rates SUM
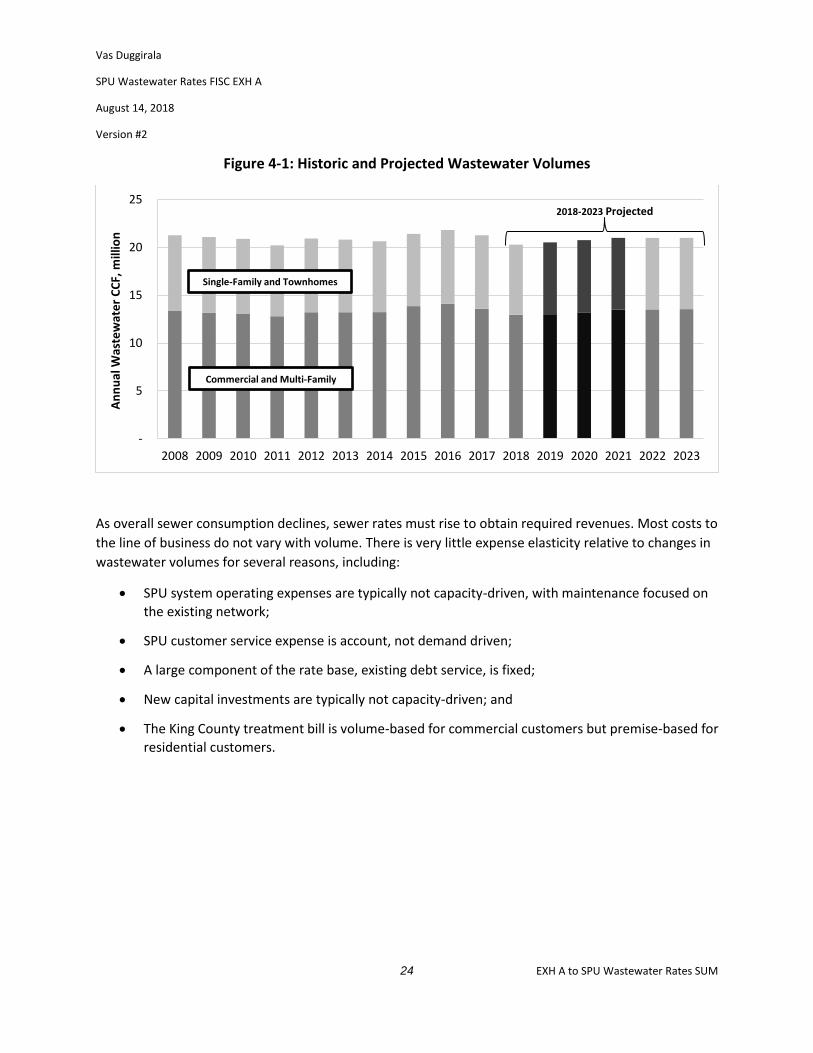
Figure 4-1: Historic and Projected Wastewater Volumes
As overall sewer consumption declines, sewer rates must rise to obtain required revenues. Most costs to
the line of business do not vary with volume. There is very little expense elasticity relative to changes in
wastewater volumes for several reasons, including:
• SPU system operating expenses are typically not capacity-driven, with maintenance focused on
the existing network;
• SPU customer service expense is account, not demand driven;
• A large component of the rate base, existing debt service, is fixed;
• New capital investments are typically not capacity-driven; and
• The King County treatment bill is volume-based for commercial customers but premise-based for
residential customers.
-
5
10
15
20
25
2008 2009 2010 2011 2012 2013 2014 2015 2016 2017 2018 2019 2020 2021 2022 2023
An
nu
al W
aste
wat
er
CC
F, m
illio
n
2018-2023 Projected
Single-Family and Townhomes
Commercial and Multi-Family

Vas Duggirala
SPU Wastewater Rates FISC EXH A
August 14, 2018
Version #2
25 EXH A to SPU Wastewater Rates SUM
5. DRAINAGE COST ALLOCATION / RATE DESIGN
Once the rates revenue requirement is set, it is assigned to different customer classes. A customer class
is a group of customers that places a unique cost on the utility or is administratively easier to serve as a
group. In the case of drainage, there is a unique cost of service associated with the management of
stormwater run-off from different types of land cover found on customer properties. These land cover
types essentially act as customer classes for drainage cost allocation purposes.
The steps required to allocate drainage system costs to land surface types and then to drainage
customer rates can be summarized as follows:
• Drainage costs are grouped into two broad classifications: account-allocated expense and flow-
allocated expense
• Flow-related costs are further allocated between four surface type categories based on cost
weighted average run-off
• A unit rate for account costs and for each surface type is developed based on the total number
of accounts and square footage of land surface by type city-wide
• Rates are developed for each customer class by applying the surface type unit rates to the
typical surface type composition for each tier
5.1. Drainage Allocation Classifications
Drainage rates are composed of four distinct components, in addition to the account rate: impervious
surface rate, managed grass rate, unmanaged grass rate, and good forest rate.
The account rate recovers costs related to customer billing and customer service, including King County
charges for Drainage Billing System administration, SPU customer property data management expense
and SPU customer service support. These expenses are driven by the number of customers served
rather than by property characteristics.
The four surface type rates recover all other drainage system expense contained in the drainage rate
revenue requirement, as further described in Chapter 3 of this rate study. Total flow-related expense is
allocated based on the cost of managing the run-off from any given surface type, as further described in
Section 5.2.
Vas Duggirala
SPU Wastewater Rates FISC EXH A
August 14, 2018
Version #2
26 EXH A to SPU Wastewater Rates SUM
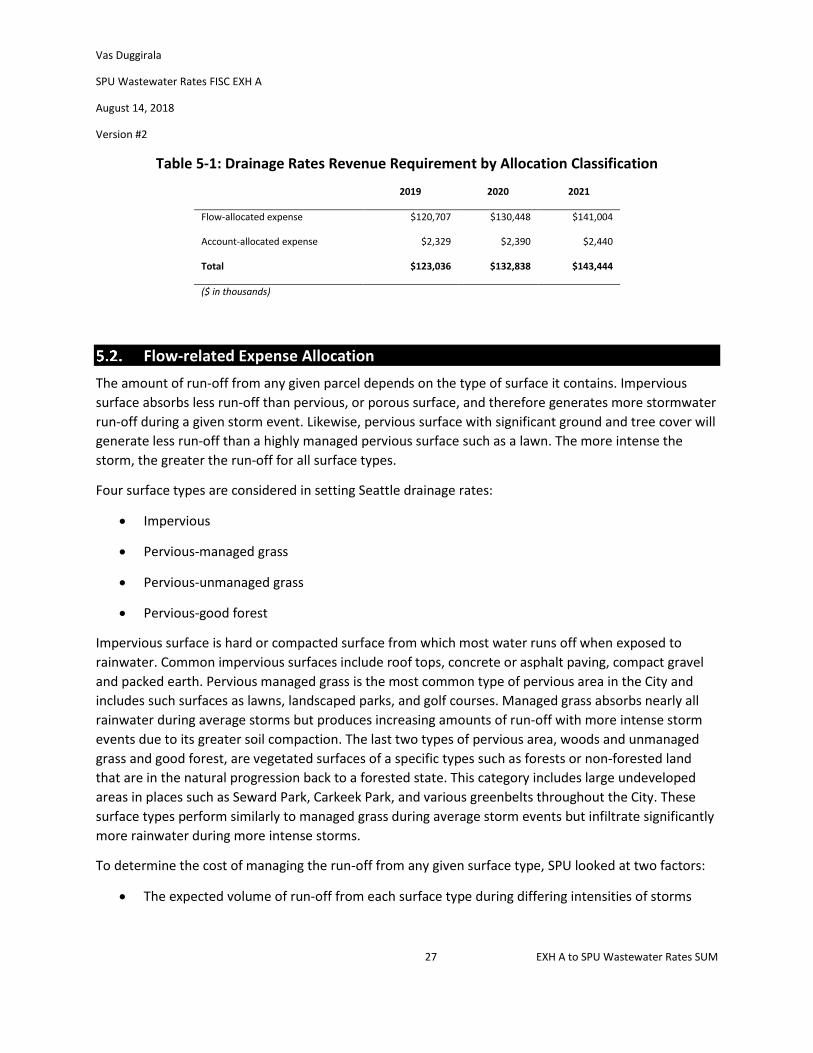
Below, Table 5-1 breaks out the flow-allocated expense and the account-allocated expense components
of the rates revenue requirement by year.
Vas Duggirala
SPU Wastewater Rates FISC EXH A
August 14, 2018
Version #2
27 EXH A to SPU Wastewater Rates SUM
Table 5-1: Drainage Rates Revenue Requirement by Allocation Classification
2019 2020 2021
Flow-allocated expense $120,707 $130,448 $141,004
Account-allocated expense $2,329 $2,390 $2,440
Total $123,036 $132,838 $143,444
($ in thousands)
Flow-related Expense Allocation
The amount of run-off from any given parcel depends on the type of surface it contains. Impervious
surface absorbs less run-off than pervious, or porous surface, and therefore generates more stormwater
run-off during a given storm event. Likewise, pervious surface with significant ground and tree cover will
generate less run-off than a highly managed pervious surface such as a lawn. The more intense the
storm, the greater the run-off for all surface types.
Four surface types are considered in setting Seattle drainage rates:
• Impervious
• Pervious-managed grass
• Pervious-unmanaged grass
• Pervious-good forest
Impervious surface is hard or compacted surface from which most water runs off when exposed to
rainwater. Common impervious surfaces include roof tops, concrete or asphalt paving, compact gravel
and packed earth. Pervious managed grass is the most common type of pervious area in the City and
includes such surfaces as lawns, landscaped parks, and golf courses. Managed grass absorbs nearly all
rainwater during average storms but produces increasing amounts of run-off with more intense storm
events due to its greater soil compaction. The last two types of pervious area, woods and unmanaged
grass and good forest, are vegetated surfaces of a specific types such as forests or non-forested land
that are in the natural progression back to a forested state. This category includes large undeveloped
areas in places such as Seward Park, Carkeek Park, and various greenbelts throughout the City. These
surface types perform similarly to managed grass during average storm events but infiltrate significantly
more rainwater during more intense storms.
To determine the cost of managing the run-off from any given surface type, SPU looked at two factors:
• The expected volume of run-off from each surface type during differing intensities of storms

Vas Duggirala
SPU Wastewater Rates FISC EXH A
August 14, 2018
Version #2
28 EXH A to SPU Wastewater Rates SUM
• The cost of O&M and infrastructure oriented towards the management of the run-off during
each of these storm event
The resultant cost weighted run-off percentages, as presented in Table 5-2 below, represent the
percentage of the flow-allocated revenue requirement assigned to each surface type. See Appendix E for
the step by step calculation underlying these cost shares.
Table 5-2: Revenue Requirement Cost Shares by Surface Type
% of Drainage
Revenue Requirement
Account* 1.8%
Impervious 81.1%
Pervious – Managed Grass 15.2%
Pervious – Woods and Unmanaged Grass 1.4%
Pervious – Good Forest 0.5%
*Account costs are the per-account costs of drainage billing
Revenue Requirement Allocation
Table 5-3 presents the revenue requirement allocation for account and surface type rates. The surface
type rate allocations are calculated by applying the flow-based cost share percentages found in Table 5-
2 to total flow-allocated expense. These cost class allocations are then used in the development of
drainage rates for each customer tier, as further described in Section 5.4.
Table 5-3: Revenue Requirement Allocation by Type
2019 2020 2021
Account $2.6 $2.8 $3.0
Impervious $114.7 $123.9 $133.7
Pervious – Managed Grass $21.5 $23.2 $25.1
Pervious – Woods and Unmanaged Grass $2.0 $2.1 $2.3
Pervious – Good Forest $0.7 $0.8 $0.8
Total Revenue Requirement $141.5 $152.7 $164.9
($ in millions)

Vas Duggirala
SPU Wastewater Rates FISC EXH A
August 14, 2018
Version #2
29 EXH A to SPU Wastewater Rates SUM
Drainage Rate Design
Drainage customer bills are intended to recover the cost of service associated with managing the
stormwater run-off from individual parcels. In the first part of this chapter, SPU defines the cost of
service associated with managing the run-off from different land surface types and with account-related
services. The following steps are required to develop drainage rates which assign these costs to
individual customer parcels:
• Define customer classes and rate tiers for parcels with similar surface type characteristics (and
therefore similar costs of service)
• Develop unit rates for each surface type and account classification
• Determine an average customer land composition profile for each rate tier
• Apply the surface type and account unit rates to applicable profile factors for each tier
Customer Classes and Tiers
Small Residential
Small residential customers with billable areas less than 10,000 square feet are homogeneous in terms
of surface cover, which makes property size the key determinant of parcel stormwater flow
contribution. Small residential customers are assigned to one of five size-based categories, each
representing a range of total area (e.g., 3,000 to 4,999 square feet).
Large Residential and General Service
Large single family and duplex parcels 10,000 square feet or greater (“large residential”) and general
service parcels (all sizes), pay a unit rate (per 1,000 square feet of billable area) based on their actual
property characteristics (percent impervious and parcel size) rather than category averages. There is too
much variation between these properties in terms of parcel size and surface characteristics to be fairly
captured by a flat rate structure like that applied to small residential customers. SPU has five impervious
surface-based rate categories. Each category represents a range of impervious surface (e.g., 66-85%
impervious).
General service and large residential parcels which contain significant amounts of highly pervious
(absorbent) area, such as forested land or other unmanaged vegetated areas such as pasturelands and
meadows, and which are composed of no more than 65% impervious area, may also qualify for
discounted low impact rates. Parcels with these surface types generate significantly less stormwater
run-off than parcels with similar amounts of impervious surface but whose pervious area is less
absorbent (e.g., a highly managed lawn).
Account and Surface Type Unit Rates
Unit rates for each surface type and for account-allocated expense are calculated as described below.
Vas Duggirala
SPU Wastewater Rates FISC EXH A
August 14, 2018
Version #2
30 EXH A to SPU Wastewater Rates SUM
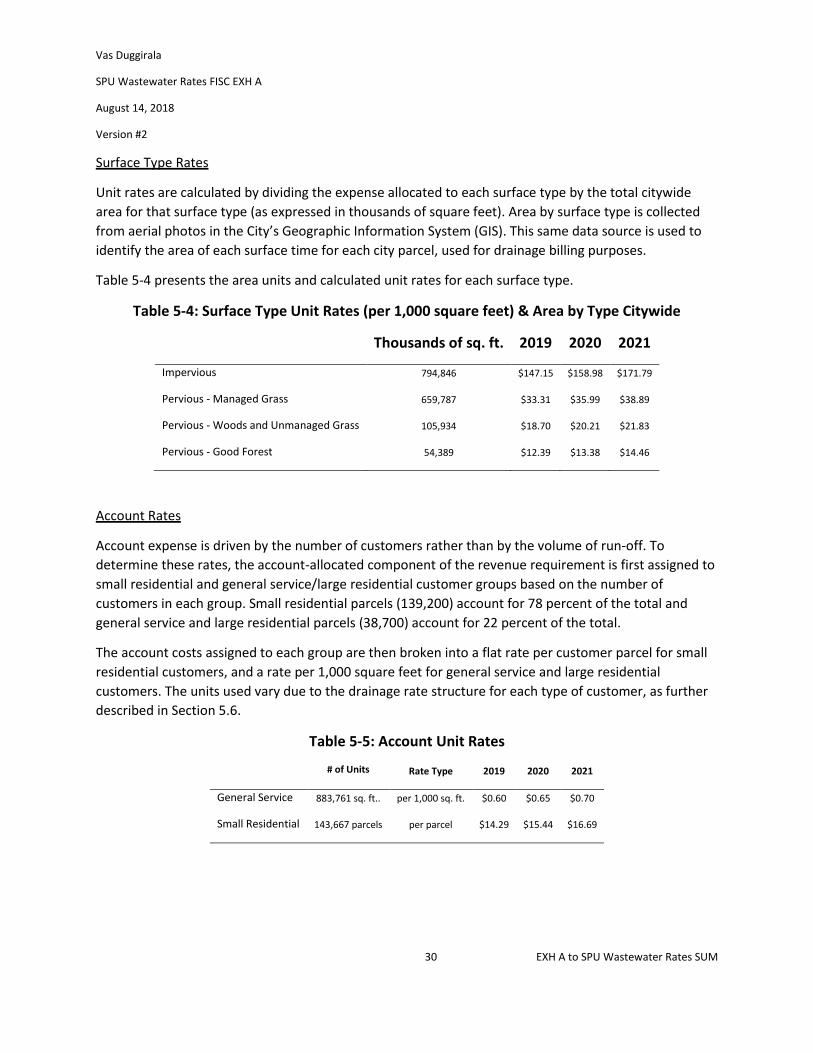
Surface Type Rates
Unit rates are calculated by dividing the expense allocated to each surface type by the total citywide
area for that surface type (as expressed in thousands of square feet). Area by surface type is collected
from aerial photos in the City’s Geographic Information System (GIS). This same data source is used to
identify the area of each surface time for each city parcel, used for drainage billing purposes.
Table 5-4 presents the area units and calculated unit rates for each surface type.
Table 5-4: Surface Type Unit Rates (per 1,000 square feet) & Area by Type Citywide
Thousands of sq. ft. 2019 2020 2021
Impervious 794,846 $147.15 $158.98 $171.79
Pervious - Managed Grass 659,787 $33.31 $35.99 $38.89
Pervious - Woods and Unmanaged Grass 105,934 $18.70 $20.21 $21.83
Pervious - Good Forest 54,389 $12.39 $13.38 $14.46
Account Rates
Account expense is driven by the number of customers rather than by the volume of run-off. To
determine these rates, the account-allocated component of the revenue requirement is first assigned to
small residential and general service/large residential customer groups based on the number of
customers in each group. Small residential parcels (139,200) account for 78 percent of the total and
general service and large residential parcels (38,700) account for 22 percent of the total.
The account costs assigned to each group are then broken into a flat rate per customer parcel for small
residential customers, and a rate per 1,000 square feet for general service and large residential
customers. The units used vary due to the drainage rate structure for each type of customer, as further
described in Section 5.6.
Table 5-5: Account Unit Rates
# of Units Rate Type 2019 2020 2021
General Service 883,761 sq. ft.. per 1,000 sq. ft. $0.60 $0.65 $0.70
Small Residential 143,667 parcels per parcel $14.29 $15.44 $16.69
Vas Duggirala
SPU Wastewater Rates FISC EXH A
August 14, 2018
Version #2
31 EXH A to SPU Wastewater Rates SUM
Surface Type Profile by Tier
Drainage bills for each customer are intended to reflect the cost of managing the run-off from that
parcel. Each tier rate is composed of a flow and an account component. Both components reflect the
average cost for a tier composed of properties with similar characteristics.
The flow component of each tier rate is based on the average percentage of total area attributable to
each surface type, as calculated using GIS data for individual parcels assigned to a given tier. For small
residential customers, averages are based on a random sample of properties assigned to each flat rate
tier. For general service and large residential customers, the percentages are based on citywide GIS data
for all parcels assigned to a given tier.
Table 5-6 presents the average land cover profile by tier used to calculate the flow component of the
tier drainage rate.
Vas Duggirala
SPU Wastewater Rates FISC EXH A
August 14, 2018
Version #2
32 EXH A to SPU Wastewater Rates SUM
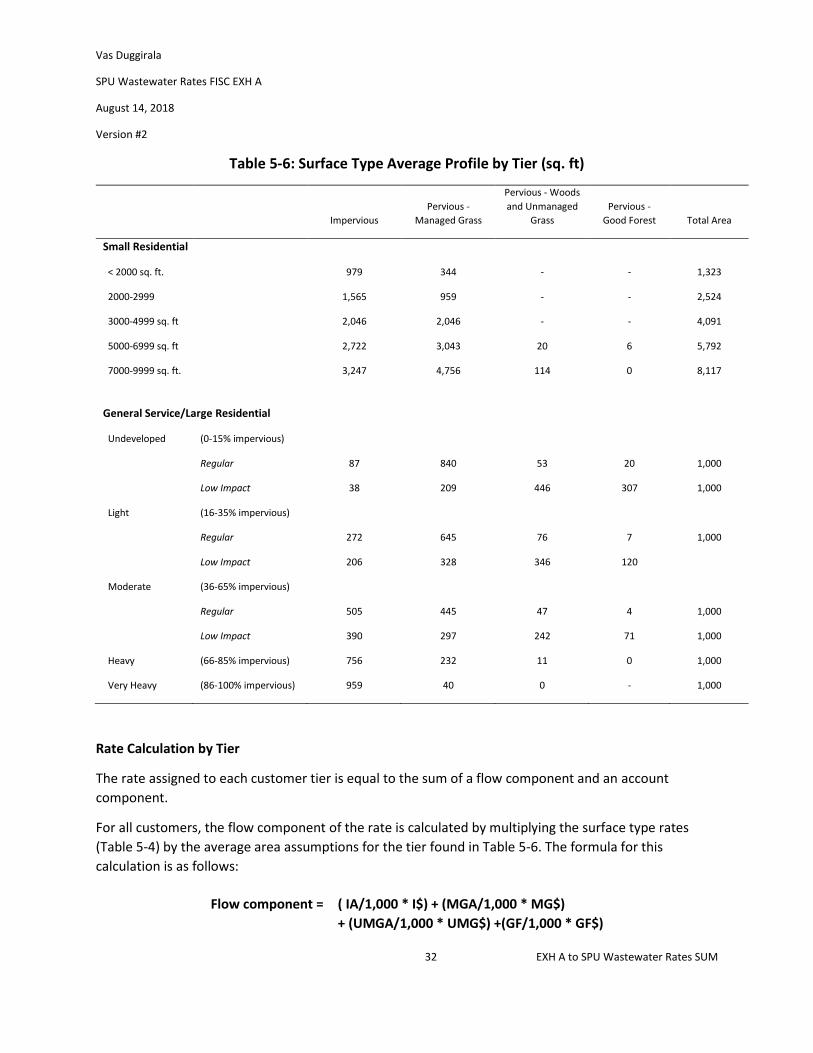
Table 5-6: Surface Type Average Profile by Tier (sq. ft)
Impervious
Pervious -
Managed Grass
Pervious - Woods
and Unmanaged
Grass
Pervious -
Good Forest Total Area
Small Residential
< 2000 sq. ft.
979 344 - - 1,323
2000-2999
1,565 959 - - 2,524
3000-4999 sq. ft
2,046 2,046 - - 4,091
5000-6999 sq. ft
2,722 3,043 20 6 5,792
7000-9999 sq. ft.
3,247 4,756 114 0 8,117
General Service/Large Residential
Undeveloped (0-15% impervious)
Regular 87 840 53 20 1,000
Low Impact 38 209 446 307 1,000
Light (16-35% impervious)
Regular 272 645 76 7 1,000
Low Impact 206 328 346 120
Moderate (36-65% impervious)
Regular 505 445 47 4 1,000
Low Impact 390 297 242 71 1,000
Heavy (66-85% impervious) 756 232 11 0 1,000
Very Heavy (86-100% impervious) 959 40 0 - 1,000
Rate Calculation by Tier
The rate assigned to each customer tier is equal to the sum of a flow component and an account
component.
For all customers, the flow component of the rate is calculated by multiplying the surface type rates
(Table 5-4) by the average area assumptions for the tier found in Table 5-6. The formula for this
calculation is as follows:
Flow component = ( IA/1,000 * I$) + (MGA/1,000 * MG$)
+ (UMGA/1,000 * UMG$) +(GF/1,000 * GF$)
Vas Duggirala
SPU Wastewater Rates FISC EXH A
August 14, 2018
Version #2
33 EXH A to SPU Wastewater Rates SUM
Where:
• IA=Tier average impervious area
• I$=Impervious surface rate per 1,000 sq. ft..
• MGA=Tier average managed grass area
• MG$=Managed grass surface rate per 1,000 sq. ft.
• UMGA=Tier average unmanaged grass area
• UMG$=Unmanaged grass surface rate per 1,000 sq. ft.
• GF=Tier average good forest area
• GF$=Good Forest surface rate per 1,000 sq. ft.
The account component for small residential customers is the same flat rate per customer. For general
service and large residential customers, the account rate is multiplied by parcel area.
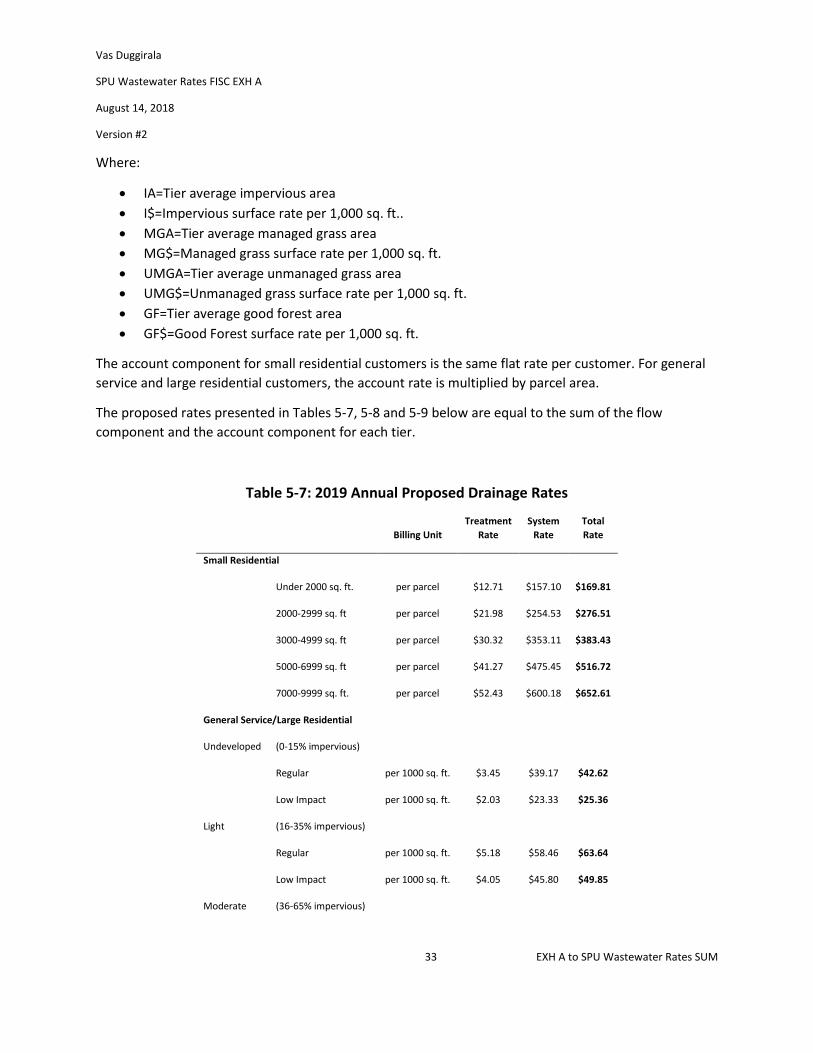
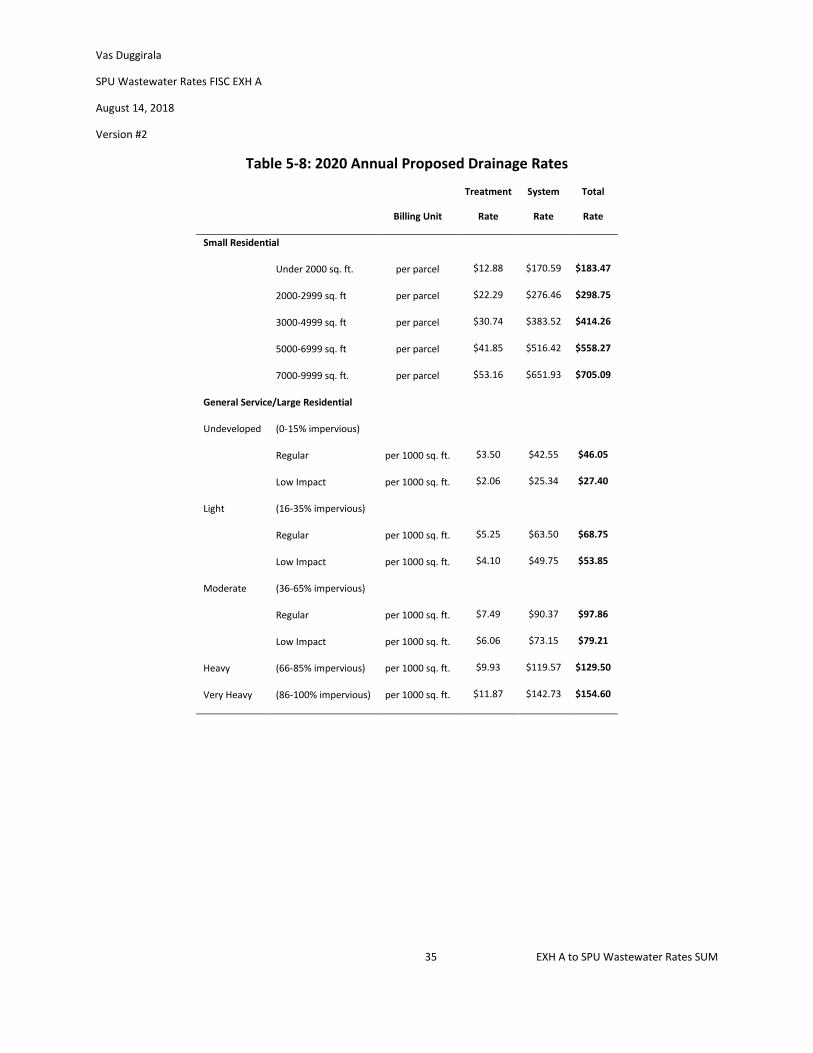
The proposed rates presented in Tables 5-7, 5-8 and 5-9 below are equal to the sum of the flow
component and the account component for each tier.
Table 5-7: 2019 Annual Proposed Drainage Rates
Billing Unit
Treatment
Rate
System
Rate
Total
Rate
Small Residential
Under 2000 sq. ft. per parcel $12.71 $157.10 $169.81
2000-2999 sq. ft per parcel $21.98 $254.53 $276.51
3000-4999 sq. ft per parcel $30.32 $353.11 $383.43
5000-6999 sq. ft per parcel $41.27 $475.45 $516.72
7000-9999 sq. ft. per parcel $52.43 $600.18 $652.61
General Service/Large Residential
Undeveloped (0-15% impervious)
Regular per 1000 sq. ft. $3.45 $39.17 $42.62
Low Impact per 1000 sq. ft. $2.03 $23.33 $25.36
Light (16-35% impervious)
Regular per 1000 sq. ft. $5.18 $58.46 $63.64
Low Impact per 1000 sq. ft. $4.05 $45.80 $49.85
Moderate (36-65% impervious)

Vas Duggirala
SPU Wastewater Rates FISC EXH A
August 14, 2018
Version #2
34 EXH A to SPU Wastewater Rates SUM
Regular per 1000 sq. ft. $7.39 $83.19 $90.58
Low Impact per 1000 sq. ft. $5.97 $67.34 $73.31
Heavy (66-85% impervious) per 1000 sq. ft. $9.80 $110.06 $119.86
Very Heavy (86-100% impervious) per 1000 sq. ft. $11.70 $131.40 $143.10
Vas Duggirala
SPU Wastewater Rates FISC EXH A
August 14, 2018
Version #2
35 EXH A to SPU Wastewater Rates SUM
Table 5-8: 2020 Annual Proposed Drainage Rates
Treatment System Total
Billing Unit Rate Rate Rate
Small Residential
Under 2000 sq. ft. per parcel $12.88 $170.59 $183.47
2000-2999 sq. ft per parcel $22.29 $276.46 $298.75
3000-4999 sq. ft per parcel $30.74 $383.52 $414.26
5000-6999 sq. ft per parcel $41.85 $516.42 $558.27
7000-9999 sq. ft. per parcel $53.16 $651.93 $705.09
General Service/Large Residential
Undeveloped (0-15% impervious)
Regular per 1000 sq. ft. $3.50 $42.55 $46.05
Low Impact per 1000 sq. ft. $2.06 $25.34 $27.40
Light (16-35% impervious)
Regular per 1000 sq. ft. $5.25 $63.50 $68.75
Low Impact per 1000 sq. ft. $4.10 $49.75 $53.85
Moderate (36-65% impervious)
Regular per 1000 sq. ft. $7.49 $90.37 $97.86
Low Impact per 1000 sq. ft. $6.06 $73.15 $79.21
Heavy (66-85% impervious) per 1000 sq. ft. $9.93 $119.57 $129.50
Very Heavy (86-100% impervious) per 1000 sq. ft. $11.87 $142.73 $154.60
Vas Duggirala
SPU Wastewater Rates FISC EXH A
August 14, 2018
Version #2
36 EXH A to SPU Wastewater Rates SUM
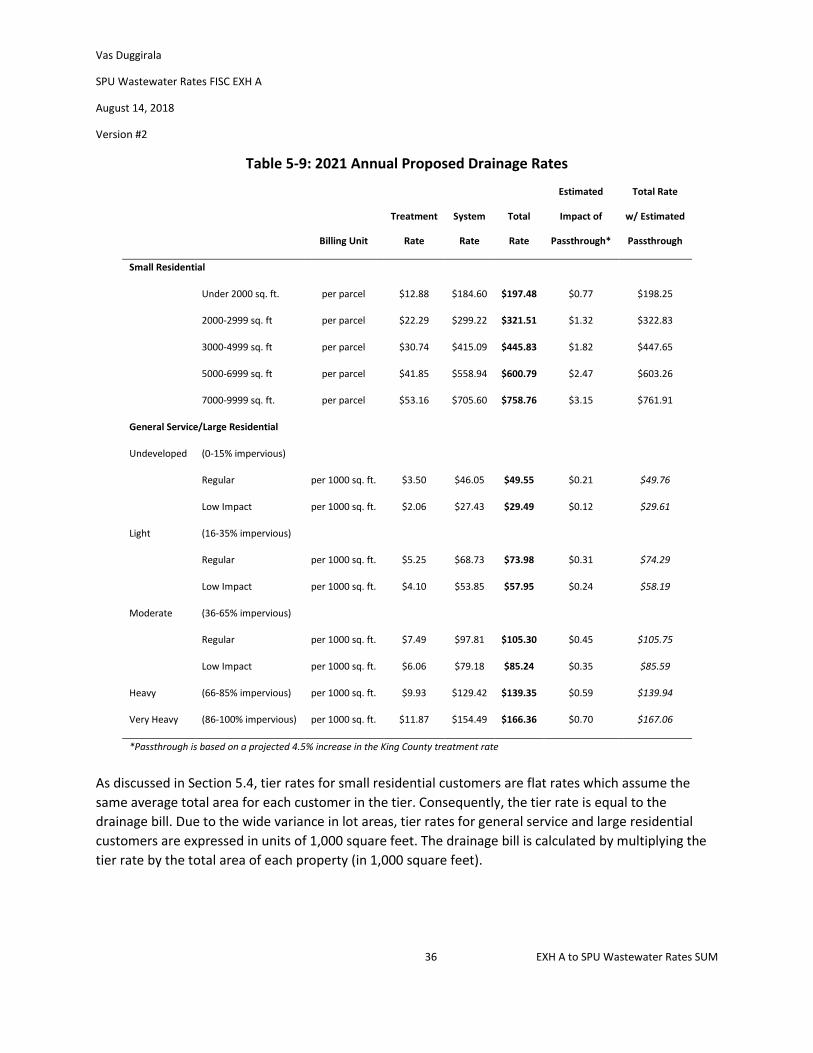
Table 5-9: 2021 Annual Proposed Drainage Rates
Estimated Total Rate
Treatment System Total Impact of w/ Estimated
Billing Unit Rate Rate Rate Passthrough* Passthrough
Small Residential
Under 2000 sq. ft. per parcel $12.88 $184.60 $197.48 $0.77 $198.25
2000-2999 sq. ft per parcel $22.29 $299.22 $321.51 $1.32 $322.83
3000-4999 sq. ft per parcel $30.74 $415.09 $445.83 $1.82 $447.65
5000-6999 sq. ft per parcel $41.85 $558.94 $600.79 $2.47 $603.26
7000-9999 sq. ft. per parcel $53.16 $705.60 $758.76 $3.15 $761.91
General Service/Large Residential
Undeveloped (0-15% impervious)
Regular per 1000 sq. ft. $3.50 $46.05 $49.55 $0.21 $49.76
Low Impact per 1000 sq. ft. $2.06 $27.43 $29.49 $0.12 $29.61
Light (16-35% impervious)
Regular per 1000 sq. ft. $5.25 $68.73 $73.98 $0.31 $74.29
Low Impact per 1000 sq. ft. $4.10 $53.85 $57.95 $0.24 $58.19
Moderate (36-65% impervious)
Regular per 1000 sq. ft. $7.49 $97.81 $105.30 $0.45 $105.75
Low Impact per 1000 sq. ft. $6.06 $79.18 $85.24 $0.35 $85.59
Heavy (66-85% impervious) per 1000 sq. ft. $9.93 $129.42 $139.35 $0.59 $139.94
Very Heavy (86-100% impervious) per 1000 sq. ft. $11.87 $154.49 $166.36 $0.70 $167.06
*Passthrough is based on a projected 4.5% increase in the King County treatment rate
As discussed in Section 5.4, tier rates for small residential customers are flat rates which assume the
same average total area for each customer in the tier. Consequently, the tier rate is equal to the
drainage bill. Due to the wide variance in lot areas, tier rates for general service and large residential
customers are expressed in units of 1,000 square feet. The drainage bill is calculated by multiplying the
tier rate by the total area of each property (in 1,000 square feet).
Vas Duggirala
SPU Wastewater Rates FISC EXH A
August 14, 2018
Version #2
37 EXH A to SPU Wastewater Rates SUM
Other Drainage Credits and Discounts
Drainage bill discounts are available for property owners that help reduce the impact of stormwater on
the City’s system. Billing exemptions (which reduce the overall drainage bill) are also available for large
natural areas that offer systemic benefits greater than those offered by other types of undeveloped
lands or which clearly do not benefit from or impact the stormwater system.
A. Low Impact Rates
Discounts2 of 19 to 41 percent are applied to the rate for undeveloped natural areas of 0.5 acres
or greater containing sufficient amounts of qualifying “highly infiltrative” surface (i.e. forested
areas, unmanaged grasslands, etc.). Certain athletic facilities with engineered designs that mimic
the stormwater retention benefits of these large natural areas are also eligible for low impact
rates.
B. Stormwater Facility Credit Program (SFCP)
This program offers credits of up to 50 percent for privately-owned systems that slow down
stormwater flow and/or provide water quality treatment for run-off from impervious area, thus
lessening the impact to the City’s stormwater system, creeks, lakes or Puget Sound. Stormwater
systems are structures such as vaults, rain gardens, permeable pavements and filtration
systems. SPU offers a 10 percent discount for any new or remodeled commercial building that
utilizes a rainwater harvesting system meeting credit requirements. Those systems that involve
indoor uses of rainwater must be permitted by Seattle-King County Department of Health to
qualify for the rate reduction. Systems must meet the applicable stormwater and drainage code
requirements for the building and site.
2 Relative to the rates for non-qualifying properties with like amounts of impervious surface.
Vas Duggirala
SPU Wastewater Rates FISC EXH A
August 14, 2018
Version #2
38 EXH A to SPU Wastewater Rates SUM
C. Rainwater Harvest Credit
SPU offers a 10 percent discount for any new or remodeled commercial building that utilizes a
rainwater harvesting system meeting credit requirements. Those systems that involve indoor
uses of rainwater must be permitted by Seattle-King County Department of Health to qualify for
the rate reduction. Systems must meet the applicable stormwater and drainage code
requirements for the building and site.
D. Undeveloped Riparian Corridor Exemption
Developed riparian corridors3 with small buffers and bank armoring increase the risk of flooding
and downstream property damage. In contrast, undeveloped riparian corridors with a sufficient
buffer act as floodplains which allow creeks to expand during peak period, mitigating
downstream flood damage.
The discount assumes exemption of the entire 100-foot qualifying creek buffer from the parcel’s
billable area. Qualifying criteria for this exemption is found in SPU Director’s Rule FIN-211.2.
E. Wetlands Exemption
Wetlands act like natural drainage systems, protecting and improving water quality and storing
floodwaters which are slowly released over time. Wetlands also serve as an important habitat
for fish and wildlife. Only wetlands of at least 1,000 square feet in area and with no
development within the wetland area will be considered for this exemption.
An application is required to qualify for this exemption, including the provision of supporting
documentation demonstrating that the wetland meets all required criteria, as defined in SPU
Director’s Rule FIN-211.3
F. Undeveloped Islands Exemption
This credit applies to undeveloped islands with less than ten percent impervious area. These
islands do not benefit from, nor do they impact, the drainage system or surrounding receiving
waters.
3 Riparian corridor is defined in SMC 25.09.020.B.5.A.

Vas Duggirala
SPU Wastewater Rates FISC EXH A
August 14, 2018
Version #2
39 EXH A to SPU Wastewater Rates SUM
6. UTILITY DISCOUNT PROGRAM
The City subsidizes qualified low-income customers by giving them discounts on their utility services.
Low income assistance customers may receive their discount in one of three ways: 1) as a credit to their
SPU wastewater bill; or 2) where no wastewater bill is received, as a credit to the customer’s City Light
Bill; or 3) in the form of a credit voucher. The latter two options are typically applicable to renters who
pay drainage, wastewater, and water utility fees indirectly as part of their rental payment.
For customers who do not receive a wastewater bill, a fixed credit is calculated which is equal to 50
percent of a typical residential bill for the class of customer receiving the credit4. Proposed discounts are
shown in Tables 6-1 and 6-2. Credits do not include projected changes in the King County treatment
rate. Increases in the treatment rate will result in increases to credits through the pass-through
mechanism established by SMC 21.28.040.
Table 6-1: Wastewater Utility Discount Program Credits
2019 2020 2021*
Receives SPU bill 50% discount
Receives SCL bill only
Single-Family $31.13 $33.43 $34.96
Multi-Family $21.72 $23.32 $24.39
*Does not include passthrough changes to the proposed 2021 King County treatment rate.
Table 6-2: Monthly Drainage Low Income Utility Credit
2019 2020 2021*
Single-Family $21.53 $23.24 $25.02
Duplex $10.77 $11.62 $12.51
Multi-Family $2.30 $2.49 $2.68
*Does not include passthrough changes to the proposed 2021 King County treatment rate.
4 The typical residential bill is calculated by multiplying the rate per CCF by average monthly consumption. The discounts
assume an average monthly usage of 4.3 CCF for a single family and 3.0 CCF for multi-family.


Vas Duggirala
SPU Wastewater Rates FISC EXH A
August 14, 2018
Version #2
41 EXH A to SPU Wastewater Rates SUM
APPENDIX A — FINANCIAL SUMMARY
Table A-1: Drainage and Wastewater Fund Financial Summary
2017 2018 2019 2020 2021 2022 2023 2024
Actuals Projected Proposed Proposed Proposed Projected Projected Projected
Operating Revenue
Wastewater1 $273.9 $266.5 $290.2 $315.3 $342.3 $357.4 $365.7 $404.1
Drainage $119.6 $131.0 $141.4 $152.7 $164.9 $178.0 $194.0 $202.1
Other $6.8 $6.0 $6.0 $6.0 $6.0 $6.0 $6.0 $6.0
Total Operating Revenue $400.3 $403.4 $437.7 $474.0 $513.2 $541.4 $565.7 $612.2
.
Operating Expenses
Treatment $162.8 $159.8 $164.1 $166.2 $175.9 $176.6 $181.4 $187.6
O&M $98.2 $116.6 $123.9 $129.7 $135.5 $141.7 $148.2 $169.3
City Taxes $46.7 $47.1 $51.1 $55.4 $60.1 $63.4 $66.2 $71.8
State Taxes $5.2 $5.2 $5.9 $6.8 $7.5 $8.1 $8.5 $9.6
Depreciation $31.7 $28.9 $29.4 $29.9 $30.4 $30.9 $31.4 $31.9
Total Operating Expenses $344.6 $357.5 $374.4 $388.1 $409.5 $420.8 $435.8 $470.2
Net Operating Income $55.6 $45.9 $63.2 $85.9 $103.7 $120.6 $129.9 $142.0
Other Income (Expenses)
Investment Income $5.0 $3.8 $3.6 $2.3 $2.3 $2.3 $2.2 $0.7
Net Interest Expense ($26.7) ($35.0) ($40.3) ($48.9) ($59.1) ($67.6) ($72.1) ($73.6)
Other Non-Operating ($5.9) $0.6 $0.3 $0.1 $0.0 $0.0 $0.0 $0.0
Total Other Income (Expenses) ($27.6) ($30.6) ($36.4) ($46.5) ($56.8) ($65.4) ($69.9) ($72.9)
Grants and Contributions $2.6 $3.3 $3.3 $3.3 $3.3 $3.3 $3.3 $3.3
Net Income (Loss) $30.7 $18.6 $30.2 $42.8 $50.3 $58.5 $63.4 $72.5
($ in millions)
1Includes industrial surcharge
Vas Duggirala
SPU Wastewater Rates FISC EXH A
August 14, 2018
Version #2
42 EXH A to SPU Wastewater Rates SUM

Vas Duggirala
SPU Wastewater Rates FISC EXH A
August 14, 2018
Version #2
43 EXH A to SPU Wastewater Rates SUM
APPENDIX B — DWF COST ASSIGNMENT DETAIL
Drainage and Wastewater Cost Assignment Methodology
SPU conducted its last review of DWF cost assignment factors in 2016, using 2015 actual data. Those
factors were used to determine the 2016-2018 drainage and wastewater system cost of service.
This rate study uses the methodology described below for assigning operating expenses between
drainage and wastewater lines of business. The cost assignment methodology is consistent with that of
the rate studies used to propose rates for 2004 through 2018. The current rate study uses 2014 actual
labor expense as the basis for labor related cost splits. Consistent use of actual expense over time helps
to minimize errors in cost assignment resulting from variations between actual and budgeted spending.
DWF Operating Expenses are grouped into three categories:
Direct Operating Expense
Some expenses are assigned 100 percent to the applicable line of business (e.g., drainage billing
administration). The majority of shared direct operating expenses are assigned based on actual direct
labor expenses of an identified proxy. For example, most regulatory direct operating expense is related
to water quality and combined sewer overflow (CSO) issues. Therefore, these activities are assigned
based on actual direct labor expense for a subset of water quality and CSO-related capital and operating
activities. The use of a programmatic proxy is useful in capturing any shifts in the focus of regulatory
support over time
Management estimates are used to identify the cost assignment factors for a limited number of
activities. The bulk of activities using management estimates are related to billing and customer service
activities. SPU is responsible for wastewater billing and for drainage and wastewater customer service.5
Management estimates are used to identify labor effort associated with the support of each line of
business for a targeted subset of customer service budgeted activities.
Administration
Except for Project Delivery and Engineering (PDE), the cost assignment of all general management
expense is based on the sum of actual direct labor expenses for direct operating activities.
Administrative expense for PDE is assigned based on actual direct labor expense charged to capital
projects by each division.
5 King County administers billing for drainage.

Vas Duggirala
SPU Wastewater Rates FISC EXH A
August 14, 2018
Version #2
44 EXH A to SPU Wastewater Rates SUM
This methodology creates a direct link between administrative functions and the activities they support.
In addition, this methodology provides a consistent mechanism for updating administration cost
assignment from year to year in the event that the programmatic focus changes.
General and Administrative Expense
Finance and Administration (F&A) expense is assigned based on the sum of actual direct labor expense
for all direct operating and administrative activities which charge to the DWF budget.
Cost Assignment Factor
The DWF total operating budget for each operating activity is divided between the wastewater and
drainage lines of business using cost assignment factors These factors represent the typical amount of
support provided to each line of business in carrying out a specific type of activity. Therefore, drainage
and wastewater each receive their proportional shares of activities.
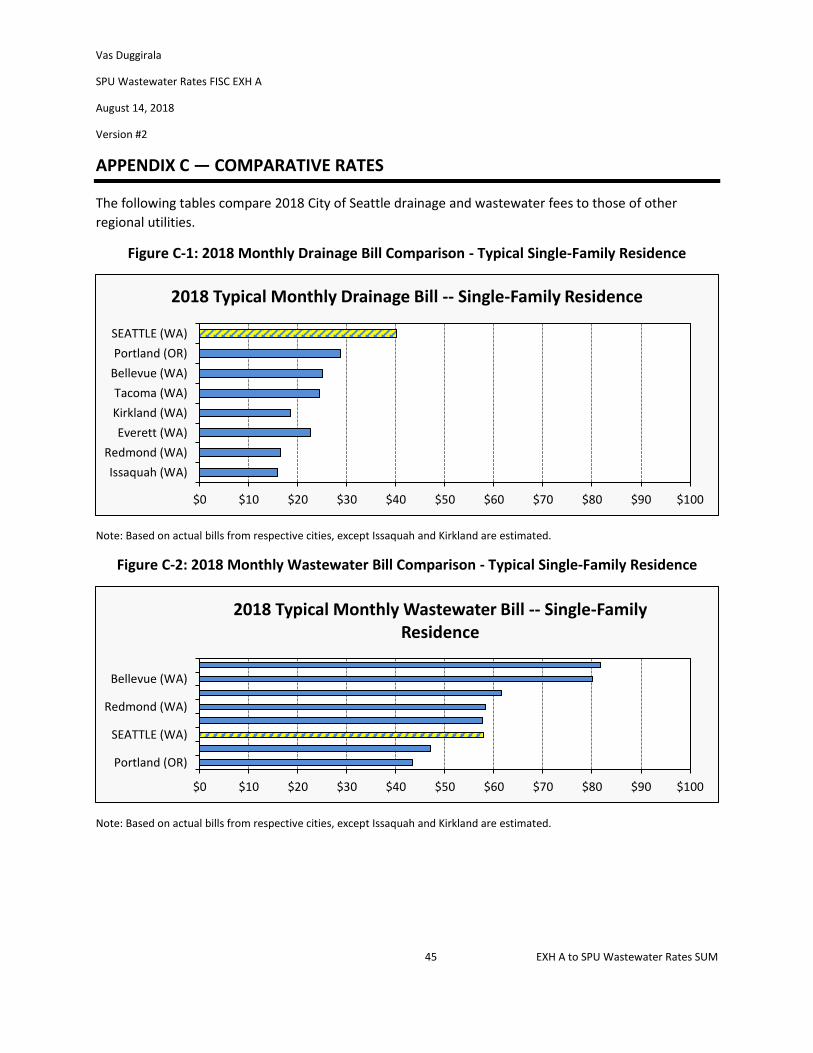
Vas Duggirala
SPU Wastewater Rates FISC EXH A
August 14, 2018
Version #2
45 EXH A to SPU Wastewater Rates SUM
APPENDIX C — COMPARATIVE RATES
The following tables compare 2018 City of Seattle drainage and wastewater fees to those of other
regional utilities.
Figure C-1: 2018 Monthly Drainage Bill Comparison - Typical Single-Family Residence
Note: Based on actual bills from respective cities, except Issaquah and Kirkland are estimated.
Figure C-2: 2018 Monthly Wastewater Bill Comparison - Typical Single-Family Residence
Note: Based on actual bills from respective cities, except Issaquah and Kirkland are estimated.
$0 $10 $20 $30 $40 $50 $60 $70 $80 $90 $100
Issaquah (WA)
Redmond (WA)
Everett (WA)
Kirkland (WA)
Tacoma (WA)
Bellevue (WA)
Portland (OR)
SEATTLE (WA)
2018 Typical Monthly Drainage Bill -- Single-Family Residence
$0 $10 $20 $30 $40 $50 $60 $70 $80 $90 $100
Portland (OR)
SEATTLE (WA)
Redmond (WA)
Bellevue (WA)
2018 Typical Monthly Wastewater Bill -- Single-Family Residence
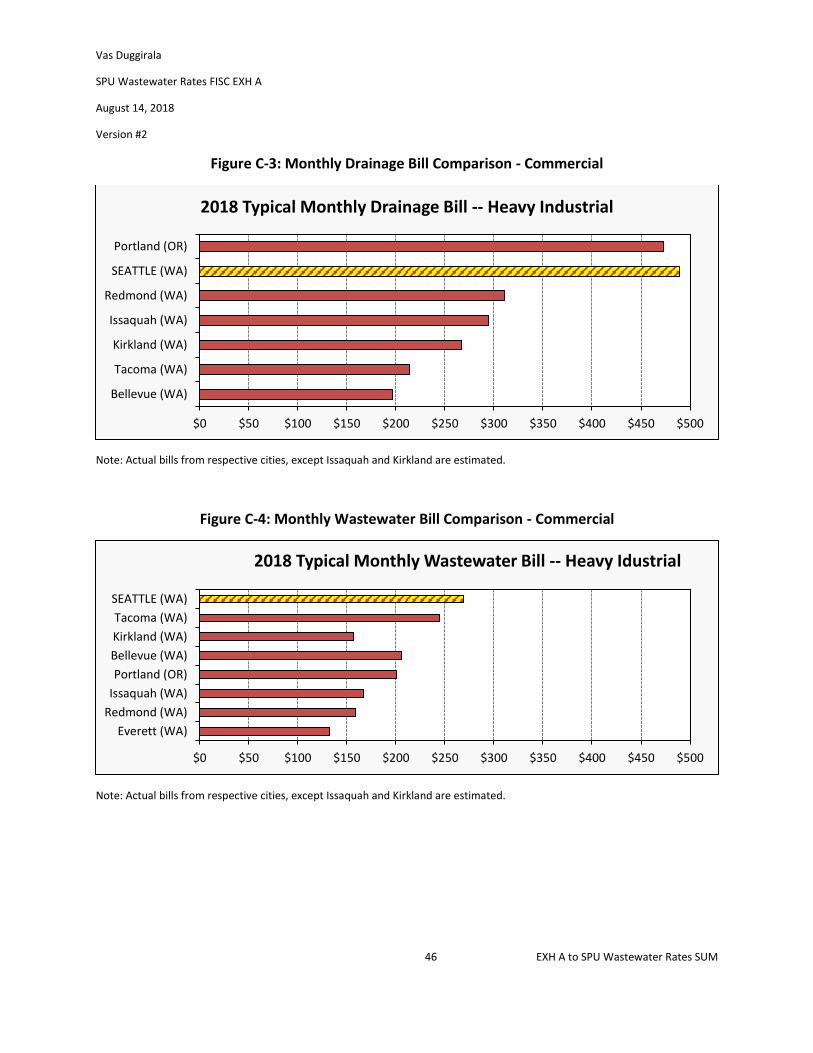
Vas Duggirala
SPU Wastewater Rates FISC EXH A
August 14, 2018
Version #2
46 EXH A to SPU Wastewater Rates SUM
Figure C-3: Monthly Drainage Bill Comparison - Commercial
Note: Actual bills from respective cities, except Issaquah and Kirkland are estimated.
Figure C-4: Monthly Wastewater Bill Comparison - Commercial
Note: Actual bills from respective cities, except Issaquah and Kirkland are estimated.
$0 $50 $100 $150 $200 $250 $300 $350 $400 $450 $500
Bellevue (WA)
Tacoma (WA)
Kirkland (WA)
Issaquah (WA)
Redmond (WA)
SEATTLE (WA)
Portland (OR)
2018 Typical Monthly Drainage Bill -- Heavy Industrial
$0 $50 $100 $150 $200 $250 $300 $350 $400 $450 $500
Everett (WA)
Redmond (WA)
Issaquah (WA)
Portland (OR)
Bellevue (WA)
Kirkland (WA)
Tacoma (WA)
SEATTLE (WA)
2018 Typical Monthly Wastewater Bill -- Heavy Idustrial

Vas Duggirala
SPU Wastewater Rates FISC EXH A
August 14, 2018
Version #2
47 EXH A to SPU Wastewater Rates SUM
APPENDIX D— DRAINAGE COST ALLOCATION DETAIL
Run-off is a factor of area and run-off coefficients. Run-off coefficients, or flow factors, represent a
mathematical calculation of the portion of rainfall that becomes direct run-off during a storm event. For
example, a 0.35 co-efficient means that 35 percent of the rain falling on a particular surface ends up as
run-off, while 65 percent is infiltrated.
Flow factors for a particular surface type will vary depending on the underlying storm assumptions.
Storms are classified by intensity (how many inches of rain fall in a given time), duration (how long the
storm lasts), and recurrence interval. Storms which occur more frequently (i.e. once 2 years) are
considered to be less severe than storms with higher recurrence intervals (i.e. a 25-year storm).
The infrastructure and operation and maintenance expenses of the drainage system are oriented to the
frequency of storm events, as noted below.
▪ 25-year events. The flood management service goal is to prevent flooding of private property in
25-year storm events, defined as the maximum rainfall received in 24 hours for the largest
storm expected over a 25-year period. This means that pipes and some other portions of the
drainage system designed for peak storm events must be sized to manage these 25-year
volumes.
▪ 2-year events. The regulatory goal for combined sewer overflows is an average of not more
than one overflow per site per year. In practice, this means controlling CSOs in a 2-year event,
defined as the rainfall that would be received in a recurrence of the second-largest storm in one
year during the period of record. Both the King County treatment system and Seattle’s Drainage
and Wastewater Utility have incurred substantial CSO control costs and expect to continue to
incur them in the future.
▪ 6-month events. Water quality infrastructure focuses on high-frequency events, defined as
storms that occur on average twice per year. These investments are an increasingly significant
portion of infrastructure costs as water quality regulations become more stringent and Seattle
moves to reduce impacts on creeks and other receiving waters.
▪ Average storm events. A variety of the remaining SPU drainage assets and activities, ranging
from Customer Service to general operations, are not associated with any of the preceding
significant storm events, but are designed to serve the overall needs of the drainage system and
its customers. These are assigned based on average storm events, defined as the average of all
storm events over the course of a year.
Surface Type Cost Share Definition Methodology
The following steps are used to determine the percentage of total flow related expense to be allocated
to each surface area type.
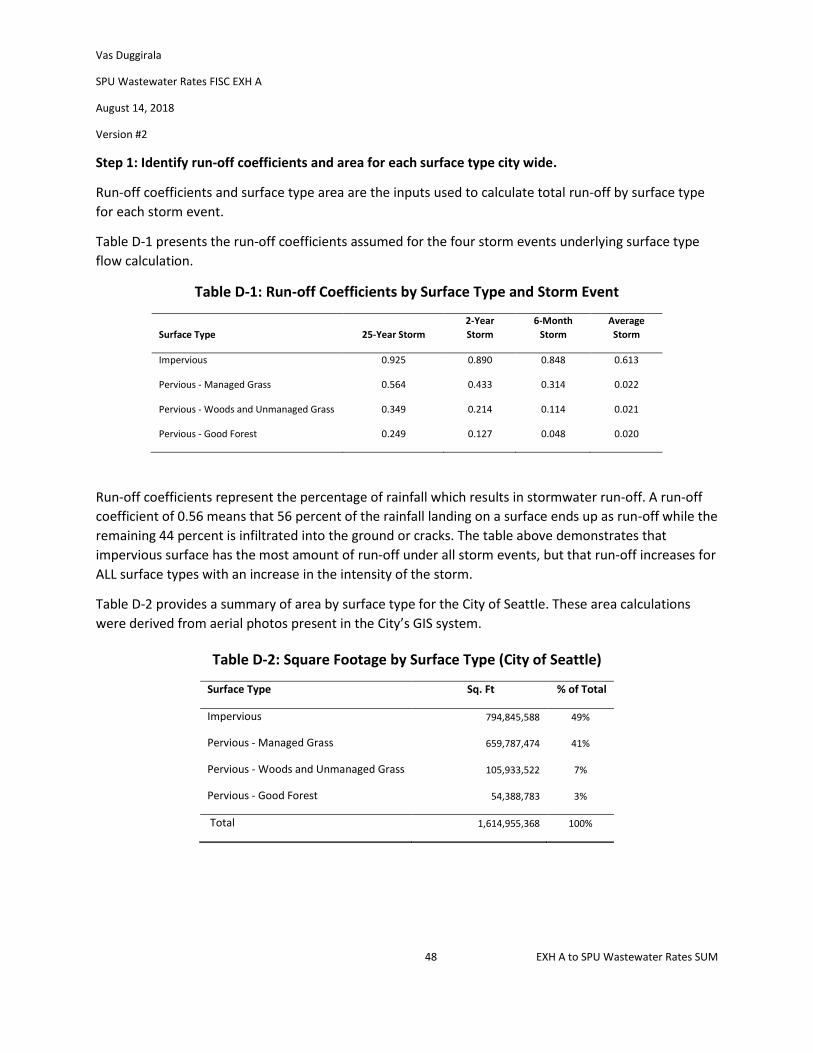
Vas Duggirala
SPU Wastewater Rates FISC EXH A
August 14, 2018
Version #2
48 EXH A to SPU Wastewater Rates SUM
Step 1: Identify run-off coefficients and area for each surface type city wide.
Run-off coefficients and surface type area are the inputs used to calculate total run-off by surface type
for each storm event.
Table D-1 presents the run-off coefficients assumed for the four storm events underlying surface type
flow calculation.
Table D-1: Run-off Coefficients by Surface Type and Storm Event
Surface Type 25-Year Storm
2-Year
Storm
6-Month
Storm
Average
Storm
Impervious 0.925 0.890 0.848 0.613
Pervious - Managed Grass 0.564 0.433 0.314 0.022
Pervious - Woods and Unmanaged Grass 0.349 0.214 0.114 0.021
Pervious - Good Forest 0.249 0.127 0.048 0.020
Run-off coefficients represent the percentage of rainfall which results in stormwater run-off. A run-off
coefficient of 0.56 means that 56 percent of the rainfall landing on a surface ends up as run-off while the
remaining 44 percent is infiltrated into the ground or cracks. The table above demonstrates that
impervious surface has the most amount of run-off under all storm events, but that run-off increases for
ALL surface types with an increase in the intensity of the storm.
Table D-2 provides a summary of area by surface type for the City of Seattle. These area calculations
were derived from aerial photos present in the City’s GIS system.
Table D-2: Square Footage by Surface Type (City of Seattle)
Surface Type Sq. Ft % of Total
Impervious 794,845,588 49%
Pervious - Managed Grass 659,787,474 41%
Pervious - Woods and Unmanaged Grass 105,933,522 7%
Pervious - Good Forest 54,388,783 3%
Total 1,614,955,368 100%
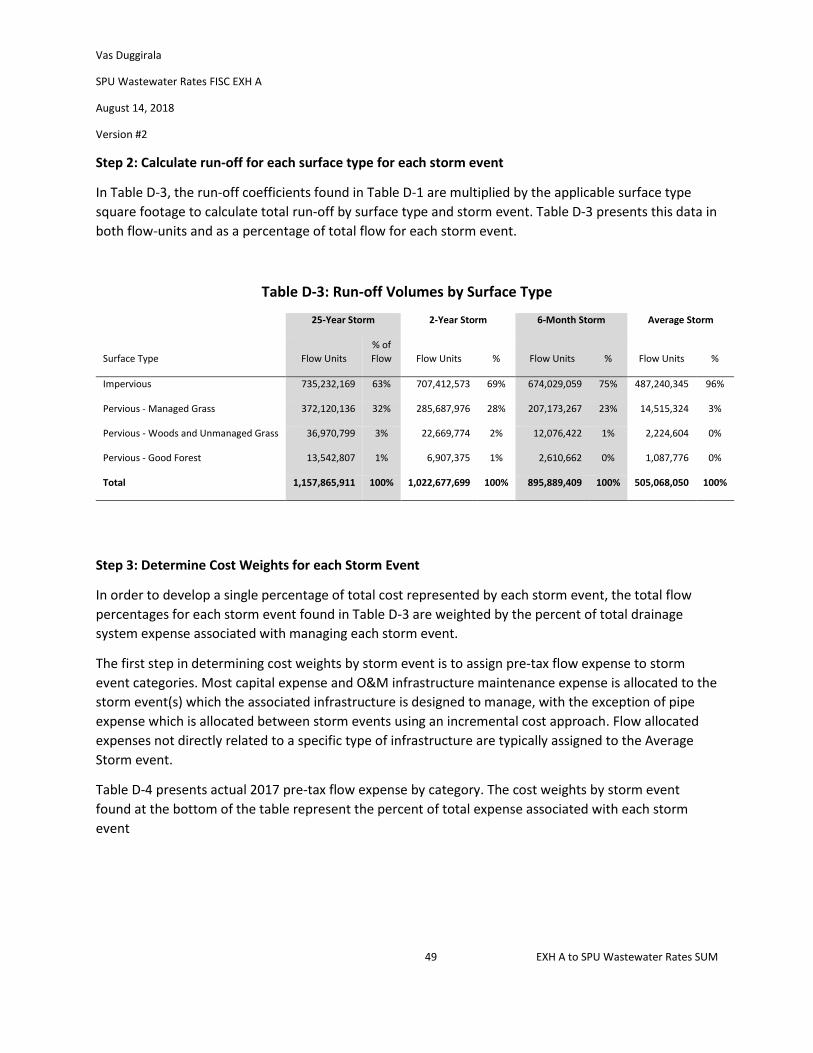
Vas Duggirala
SPU Wastewater Rates FISC EXH A
August 14, 2018
Version #2
49 EXH A to SPU Wastewater Rates SUM
Step 2: Calculate run-off for each surface type for each storm event
In Table D-3, the run-off coefficients found in Table D-1 are multiplied by the applicable surface type
square footage to calculate total run-off by surface type and storm event. Table D-3 presents this data in
both flow-units and as a percentage of total flow for each storm event.
Table D-3: Run-off Volumes by Surface Type
25-Year Storm 2-Year Storm 6-Month Storm Average Storm
Surface Type Flow Units
% of
Flow Flow Units % Flow Units % Flow Units %
Impervious 735,232,169 63% 707,412,573 69% 674,029,059 75% 487,240,345 96%
Pervious - Managed Grass 372,120,136 32% 285,687,976 28% 207,173,267 23% 14,515,324 3%
Pervious - Woods and Unmanaged Grass 36,970,799 3% 22,669,774 2% 12,076,422 1% 2,224,604 0%
Pervious - Good Forest 13,542,807 1% 6,907,375 1% 2,610,662 0% 1,087,776 0%
Total 1,157,865,911 100% 1,022,677,699 100% 895,889,409 100% 505,068,050 100%
Step 3: Determine Cost Weights for each Storm Event
In order to develop a single percentage of total cost represented by each storm event, the total flow
percentages for each storm event found in Table D-3 are weighted by the percent of total drainage
system expense associated with managing each storm event.
The first step in determining cost weights by storm event is to assign pre-tax flow expense to storm
event categories. Most capital expense and O&M infrastructure maintenance expense is allocated to the
storm event(s) which the associated infrastructure is designed to manage, with the exception of pipe
expense which is allocated between storm events using an incremental cost approach. Flow allocated
expenses not directly related to a specific type of infrastructure are typically assigned to the Average
Storm event.
Table D-4 presents actual 2017 pre-tax flow expense by category. The cost weights by storm event
found at the bottom of the table represent the percent of total expense associated with each storm
event

Vas Duggirala
SPU Wastewater Rates FISC EXH A
August 14, 2018
Version #2
50 EXH A to SPU Wastewater Rates SUM
Table D-4: Pre-Tax Flow Expense by Storm Event
Category 25 Year 2 Year 6 Month Avg Storm Total
SPU CSOs Assets - 37,504 - - 37,504
Pipe Assets 39,950 - 39,950 - 79,901
WQ Assets - - 1,013 - 1,013
Other Assets 10,680 6,919 4,565 10,961 33,125
O&M-Billing/Customer - - - - -
O&M-Treatment - 30,627 - - 30,627
O&M Other 16,918 12,249 15,915 164,903 209,985
Total Pre-Tax Expense 67,548 87,299 61,444 175,864 392,155
Cost Weight by Storm Event 17% 22% 16% 45% 100%
($ in thousands)
Step 4: Determine Flow-Based Cost Shares by Surface Type
By applying the applicable storm event cost weight from Table D-4 to the percentage of flow
represented by each surface type under each design storm scenario (found in Table D-3), SPU can
calculate a cost weighted run-off share for each surface type. These shares are used to allocate the flow-
based revenue requirement between different surface types in the development of surface type rates,
as further described in Section 5.
Table D-5: Flow-Based Cost Share by Surface Type
% of Drainage
Revenue Requirement
Account 1.8%
Impervious 81.1%
Pervious - Managed Grass 15.2%
Pervious - Woods and Unmanaged Grass 1.4%
Pervious - Good Forest 0.5%