![Jaf€¦ · o1.01 ofl 5.0-e 4.0-°3.0-cn 2.0-1.0 0 5.0-e4.0-°3.0-n9 2.0-co 5.01-24.0-°3.0-]. 2.01 o 5.0-e 4.0-°3.0-cy 2.0-a an as jaf 0.01m 002m 0.10 m a. an ago mm 0.01 m a. a.](https://static.fdocuments.in/doc/165x107/5f01b5697e708231d400a918/jaf-o101-ofl-50-e-40-30-cn-20-10-0-50-e40-30-n9-20-co-501-240-30-.jpg)
SCORE and HeartScore- an update...TOT1 TOT2 TOT3 TOT4 HDL4 HDL3 HDL2 HDL1 3.1 4.6 6.5 9.2 1.4 3.0...
52
Europrevent Stockholm- National Coordinators Meeting 7 May 2009 SCORE and HeartScore- an update With thanks to Marie-Therese Cooney, Alexandra Dudina and Sophie Squarta Ian Graham Trinity College and the Adelaide and Meath Hospital, Dublin
Transcript of SCORE and HeartScore- an update...TOT1 TOT2 TOT3 TOT4 HDL4 HDL3 HDL2 HDL1 3.1 4.6 6.5 9.2 1.4 3.0...

Europrevent Stockholm-National Coordinators Meeting
7 May 2009
SCORE and HeartScore-an update
With thanks to Marie-Therese Cooney, Alexandra Dudina and Sophie Squarta
Ian GrahamTrinity College and the Adelaide and
Meath Hospital, Dublin

Guidelines &Estimating vascular risk
Outline• The Fourth Joint Task Force on Prevention• The concept of total risk• SCORE and other risk estimation systems• New initiatives:-1. Risk in the young2. Total events3. BMI and HDL- important differences4. Simplifying risk estimation5. Heart rate6. Risk in the elderly7. Addition of newer risk factors8. HeartScore and the future
• Conclusions

European guidelines on cardiovascular disease prevention in clinical practice: full text
Fourth Joint Task Force of the European Society of Cardiology and other Societies on Cardiovascular Disease Prevention in Clinical
Practice
(Constituted by representatives of nine societies and by invited experts)
European Journal of Cardiovascular Prevention and Rehabilitation 2007, 14(suppl2):S1-S113

4th Joint task Force on the prevention of CVD in clinical practice
Why stress assessment of total CVD risk ?
• Multiple risk factors usually contribute to the atherosclerosis that causes CVD
• These risk factors interact, sometimes multiplicatively
• Thus the aim should be to reduce total risk; if a target cannot be reached with one risk factor, total risk can still be reduced by trying harder with others.

How do I assess CVD risk quickly and easily?
• Those with-~known CVD ~type 2 diabetes or type 1 diabetes with microalbuminuria,~ very high levels of individual risk factors
are already at INCREASED CVD RISK and need management of all risk factors
For all other people, the SCORE risk charts can be used to estimate total risk—this is critically important because many people have mildly raised levels of several risk factors that, in combination, can result in unexpectedly high levels of total CVD risk

Risk assessment- Options• Clinical judgement- very efficient, not always reliable• FRAMINGHAM (Previous European and current UK
guidelines)- small data set (c 5K, now 8K) from one US town, but meticulous long-term follow-up. THANK YOU!
• ASSIGN- Scottish data, good assessment of impact of social deprivation
• Q RISK- Large UK data set, not random sample with much missing data
• PROCAM- Moderate size, single city• SCORE (Systematic Coronary Risk Evaluation)-
Large (205K), representative (10 population samples) but rather few variables and uses total CVD mortality as the end point

The SCORE database
12 European cohort studies– Some with multiple component
cohorts– Mainly population studies
In round figures:• 205,000 persons• 3 million person-years of
observation• Over 7,000 fatal cardiovascular
events

10 year risk of fatal CVD in high risk regions

10 year risk of fatal CVD in low risk regions

SCORE summary: advantages• Very large data set- representative• Derived & tested on European data• Hard, reproducible end points• CHD & stroke risk can be derived
separately• High & low risk charts improve
applicability• Designed to evolve- new cohorts can be
accommodated• Underlying formulae can be adjusted with
local mortality data- re-calibration• Easy to develop electronic, interactive
version

SCORE summary: problems• Too simple- HDL is included as ratio,
but what about obesity, exercise, family history, insulin resistance, diabetes, multiple newer risk factors? How much does it matter?
• Old cohorts- secular changes in mortality, natural history, diagnostic tests, ascertainment rates, treatments. How much does it matter?
• What about morbidity/total events?

SCORE & HeartScore- update & new initiatives
1.Risk in the young-
The problem: A low absolute risk may conceal
a very high relative or lifetime risk
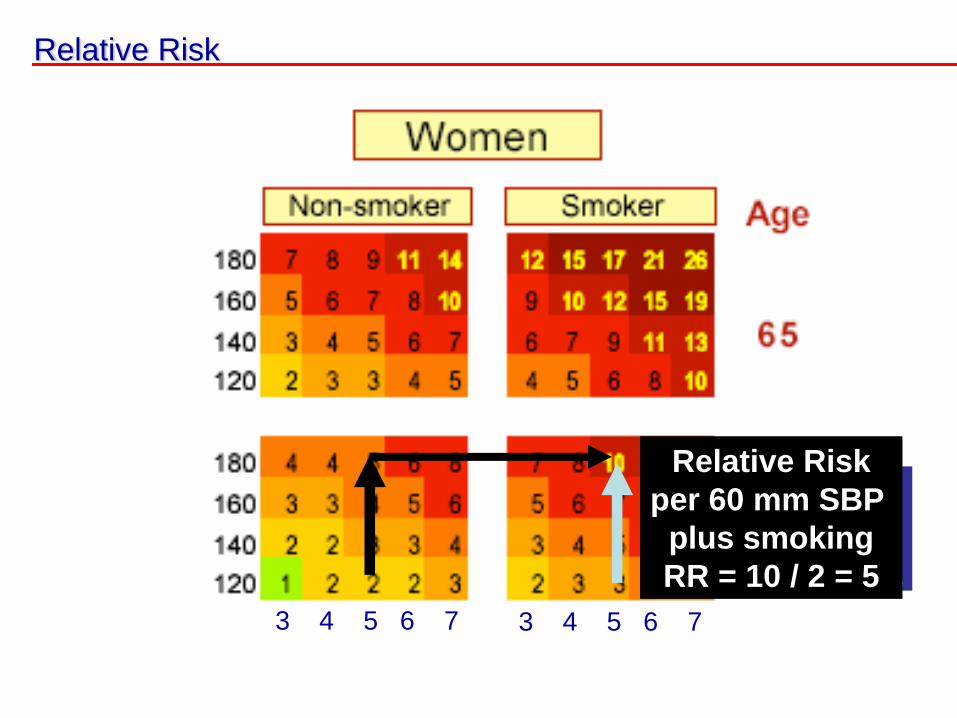
Relative Risk
Relative Riskper 60 mm SBPRR = 10 / 3 = 3.3
Relative Riskper 60 mm SBP
plus smokingRR = 10 / 2 = 5
3 4 5 6 7 3 4 5 6 7

Relative Risk ChartThis chart may used to show younger people at low absolute risk that, relative to others in their age group, their risk may
be many times higher than necessary. This may help to motivate decisions about avoidance of smoking, healthy nutrition and exercise, as well as flagging those who may
become candidates for medication

Risk in the young• Is the relative risk chart sufficient?
Consider-• Attributable risk• Years of life lost or gained• Risk age• Risk advancement periods• Of these, we suggest that risk age is the
easiest to understand

Risk Age
Definition:
„The age of a person with a given burden of risk factors compared with the age of a person with the same risk but who has fewer risk factors.“
Synonyms:Heart age, cardiovascular age

A 40 year old man man who smokes and has a high BP and cholesterol may have a “risk age” of 65 years

SCORE & HeartScore- update & new initiatives
2. Total events-The problems: Determined by multiple variables
that are not stable over time, and by duration of follow up

MORBIDITY AND TOTAL EVENTS Catherine McGorrian
[We are sorry that we have made such a meal out of this]

The prediction of total CVD events.What do you think would be the
multiplier to convert mortality to total events?
(A) 2x?(B) 4x?(C) 5x?(D) 10x?(E) 15x?(F) None of the above?

The prediction of CVD morbidity
• Everybody wants charts for morbidity/total events
• 20% risk of a CHD event (old Framingham chart) = 5% risk of CVD death (SCORE)
• A high risk of death indicates a high risk of a non-fatal event
• PROBLEMS: Changes in definitions of events & diagnostic criteria, therapy, risk factors, natural history, ascertainment of events. Hard to re-calibrate. ALSO-dependent on duration of FU
• SOLUTION?? Finnrisk-Monica collaboration to derive total-event chart- SCOREplus

Which lucky person gets into SCORE+ but not SCORE?
A----------------------------------------------------------FB-------NF----------------FC---NF----NF----NF---NF---NF---NF---NF-------F• All of these will be in SCORE and SCORE+
but ONCE onlyD-----NF-----(NFs)------------------------------------------• Only this person, who lives beyond 10 years,
will be in SCORE+ and not in SCORE… and only ONCE even if he he/she has multiple events but stays alive
• This means that the final multiplier will be small, probably about 1.3

The prediction of CVD morbidity and total events
• A fundamental problem is that, with present methods, the “multiplier” will be dependent on the duration of follow up
• Clinicians observe that they see many more non-fatal than fatal events.
• But risk charts consider only the FIRST event, whether fatal or non-fatal
• Therefore, with a very long follow up, when everyone is dead, the multiplier is 1!
• The shorter the follow up, the higher the proportion of non-fatal events and the bigger the multiplier.

SCORE & HeartScore- update & new initiatives
3. BMI and HDL cholesterol-
Important but different effects on both risk estimation and management
Alexandra Dudina and Marie-Therese Cooney

Summary – BMI and HDL effect on CV risk
• BMI predicts both total and CVD mortality, especially in younger persons
• The effect is not independent of other risk factors, probably because its effect is partially or completely mediated through effects on other CV risk factors
• This does not reduce, but rather increases, the impact of elevated BMI on public health
• HDL cholesterol is an independent risk factor for CVD mortality in both genders, all ages, and in all strata of total CVD risk, including older women

Summary – BMI and HDL in risk estimation
• HDL cholesterol can be incorporated as an additional variable in risk estimation. Easier using a electronic system- HeartSCORE
• Inclusion results in only minor changes in risk estimate for the entire population
• But important for the individual – especially those at intermediate risk levels and with unusually high or low HDL cholesterol levels
• Appropriate incorporation of BMI into risk estimation could be an a surrogate for other risk factors
• A simple system, using only easily measured variables, would make risk estimation more accessible and cost effective

0
5
10
15
20
25
18 23 28 33 38
Rat
e pe
r 100
0 pe
rseo
n ye
ars
BMI
Women - CVD + total mortality rates
0
5
10
15
20
25
18 23 28 33 38R
ate
per 1
000
pers
eon
year
s
BMI
Men - CVD + total mortality rates

SCORE BMI An increase in BMI from 20 to 30 is
associated with-
• 0.75 mmol/L increase in cholesterol• 0.2 mmol/L decrease in HDL chol• An increase in Chol:HDL chol ratio
from 4 to 5.5• 15 mmHg increase in blood pressure• A doubling of cardiovascular
mortality; more marked in the young and in women

TOT1TOT2
TOT3TOT4
HDL4
HDL3
HDL2
HDL1
3.1
4.6
6.5
9.2
1.4
3.0
4.0
6.7
1.32.2
3.2
4.7
1.0 1.52.1
3.5
0.0
1.0
2.0
3.0
4.0
5.0
6.0
7.0
8.0
9.0
10.0
Relative Risk
Total Cholesterol
HDL
CVD Mortality Rate Relative Risks Compared to the lowest total Chol Quartile and the highest HDL quartile

Age180 7 7 8 8 9 14 14 15 16 17160 5 5 6 6 7 65 10 11 12 12 13140 4 4 4 5 5 8 8 9 9 10120 3 3 3 4 4 6 6 7 7 8
180 3 3 4 4 4 6 7 7 8 8160 2 3 3 3 3 60 5 5 5 6 6140 2 2 2 2 2 4 4 4 4 5120 1 1 2 2 2 3 3 3 3 4
180 2 2 2 2 2 4 4 4 4 5160 1 1 2 2 2 55 3 3 3 3 4140 1 1 1 1 1 2 2 2 2 3120 1 1 1 1 1 2 2 2 2 2
180 1 1 1 1 1 1 2 2 2 2160 1 1 1 1 1 50 1 1 1 1 2140 0 0 1 1 1 1 1 1 1 1120 0 0 0 0 0 1 1 1 1 1
180 0 0 0 0 0 0 0 1 1 1160 0 0 0 0 0 40 0 0 0 0 0140 0 0 0 0 0 0 0 0 0 0120 0 0 0 0 0 0 0 0 0 0
4 5 6 7 8 4 5 6 7 8Total Cholesterol (mmol/l)
Non-Smoker Smoker
Systo
lic B
lood P
ressure
(m
mH
g)
Chart for Women from high risk countries
Without HDL: 5.7
HDL 0.8:10.2HDL 1.0:8.5HDL 1.4:5.9HDL 1.8: 4.0
Without HDL: 2.4
HDL 0.8:4.6HDL 1.0: 3.8HDL 1.4: 2.5HDL 1.8:1.7

HDL = 0.8mmol/l HDL = 1.0mmol/l
HDL = 1.4mmol/l HDL = 1.8mmol/l

SCORE & HeartScore- update & new initiatives
4.Simplifying Risk estimation-
What can you achieve with age, gender, smoking and BMI alone?

Simplifying Risk Estimation• Estimating risk without laboratory
measurements
• Or without blood pressure measurement
• Makes process more accessible and cost effective
• Particularly useful in regions where access to medical facilities is limited.

SCORE BMI
• Objective: To develop a simple risk estimation chart, based on the SCORE dataset, for the estimation of ten year risk of CVD mortality using only simple non laboratory, non clinic based measurements – age, gender, smoking status and BMI (in categories)

SCORE BMI Charts – Not finalisedfor use in high risk European Regions
NS SAge
11 6 6 7 10 9 65 20 11 11 13 19 176 3 3 4 6 5 60 11 6 6 7 10 92 1 1 2 3 7 55 4 2 3 4 5 131 1 1 1 1 4 50 2 1 1 2 3 70 0 0 0 0 1 40 1 0 0 1 1 2U N OV OBI OBII OBIII U N OV OBI OBII OBIII
12 11 14 18 19 19 65 21 21 26 34 34 347 7 8 11 11 11 60 13 13 16 21 21 215 4 5 8 11 11 55 11 8 11 15 21 213 2 3 5 6 6 50 6 5 6 9 12 121 1 1 2 2 2 40 2 2 2 3 4 4U N OV OBI OBII OBIII U N OV OBI OBII OBIII
BMI Category
Women
Men

SCORE & HeartScore- update & new initiatives
5. Heart Rate-
Will it add anything?

Heart rate Project
Objectives:1. To examine the risk associated with resting
heart rate in a general population 2. To derive a risk estimation function including
heart rate as an additional variable & test whether this results in improved risk estimation

Heart rate Project: Summary Results
Effects of heart rate on endpoints:• Independent risk factor – men and women• Remains after exclusion of events occurring in the
first 2 years of follow-up• Stronger effect on fatal than non-fatal endpoints• Effect is mainly on coronary mortality, with little
effect of cerebrovascular endpoints• The effect of heart rate weakens with increasing
follow-up time• The effect is independent of other co-morbidities
and physical activity level (self-reported)

Heart rate Project: Summary Results
Incorporation of heart rate in risk estimation systems
• No meaningful improvement in discrimination when heart rate is included in risk estimation systems including the current SCORE variables.– Assessed using both AUROC and net
reclassification indices• Useful improvement in discrimination when
heart rate is added to simple risk estimation system containing only age, gender, BMI and smoking status.

Discrimination of the simple function with and without heart rate included
Men Women
Simple Score with RHR
Simple Score without RHR
Simple Score with RHR
Simple Score without RHR
AUROC 0.8196 0.8121, p=0.036 0.8667 0.8547, p=0.018
Incorporation of heart rate in the simple function also resulted in an improvement in reclassification with a net reclassification index of 0.14, p<0.01

SCORE & HeartScore- update & new initiatives
6. Risk in the old-
Risk factors function differently in old people and we suspect that risk estimation can be improved

SCORE ELD
Objective:• To derive a risk estimation function
specifically from data from the older age group (> 65 years)
• We hypothesise that this will result in improved risk estimation in the elderly because in other systems use the same beta coefficients for the risk factors for all age groups – and it is known that risk factors function differently in the elderly

SCORE ELD - Progress
• Additional data has been received from Norwegian collaborators in order to increase the numbers in the older age group for the derivation dataset.
• The function has been derived.• Currently working on internal validation of
the function • External validation of this function will be
an important aspect

HeartSCORE• The electronic, interactive version of SCORE• Available on line, as a downloadable, stand-
alone version, and on CD• Can interact to adjust targets, calculate risk
at different levels of risk factors• Will include more variables such as HDL
cholesterol and BMI• Links into advice from the pocket guidelines• Simple graphic of risk and risk factor advice
can be printed out for the patient• www.HeartScore.org

The electronic, interactive tool for predicting & managing the risk of heart attack and stroke in Europe
Now stand-alone and web-based with country-specific versions

allows quick & easy risk estimation1graphical display of absolute CVD risk2
identifies relative impact of modifiable risk factors3
helps optimise potential benefits of intervention4leads physician to relevant information in electronic guidelines5
prints tailored health advice based on patient’s risk profile6
Benefits
encourages behavioural change and compliance to treatment

HeartScore Update• Adapted to 2007 European Guidelines on CVD Prevention
(incl. relative risk for younger patients)• 13 versions available in 15 languages
• 2 European (high & low)• 7 Country-specific (Cyprus, Germany, Greece, Poland, Spain,
Sweden, Slovakia, Czech Republic)• 3 Translated (Bosnia & Herzegovina, Russia, Romania)
• 12,668 unique users • 77,49% EU• 22,51 non-EU• Mostly cardiologists, trainee cardiologists, GPs and nurses
• Available formats: web-based, PC, online quick calculator• Downloadable PC versions: European, Sweden and Slovakia• Average number of new users per month: 270

Progression per version
0
1000
2000
3000
4000
5000
6000
Jan-08
Feb-08
Mar-08
Apr-08
May-08
Jun-08
Jul-08
Aug-08
Sep-08
Oct-08
Nov-08
Dec-08
Jan-09
Feb-09
Mar-09
Apr-09
EuropeHigh
EuropeLow
Sweden
Germany
Greece
Poland
BIH (total 4 languages)
Russia
Spain (total CT + ES)
Cyprus

Future national versions development in 2009
• Spain (calibrated PC) – ESC Congress Barcelona
• Slovenia• Turkey• Estonia

SCORE and HeartScoreAn updateSUMMARY
1. JTF4 continues to stress total risk estimation2. The SCORE risk estimation system is based on a large data set
that is representative of Europe and/but is very simple3. Relative risk charts aid in advising younger persons. Risk age
may be added4. Total event charts being tested; difficult and unstable and the
multiplier may be much less than expected5. BMI and HDL cholesterol contribute to risk evaluation, but in
different ways6. A simple chart based on age, gender, smoking and BMI only is
possible. Heart rate may contribute usefully7. It is likely that calculating risk separately for older persons will
improve risk estimation8. HeartScore has the flexibility to accommodate these advances

Thank you