School Comparison Report 2016 - Welcome to Murtoa …€¦ · School Comparison Report 2016 School...
77
School Comparison Report 2016 School: Murtoa College Network: West Grampians LGA: Yarriambiack (S) Region: South-Western Victoria Report prepared March 2016 1 Confidential - Not for distribution
-
Upload
vuongtuong -
Category
Documents
-
view
220 -
download
0
Transcript of School Comparison Report 2016 - Welcome to Murtoa …€¦ · School Comparison Report 2016 School...

School Comparison Report 2016
School: Murtoa College
Network: West Grampians
LGA: Yarriambiack (S)
Region: South-Western Victoria
Report prepared March 2016
1 Confidential - Not for distribution

Disclaimer
The information contained within this draft report is to be used for internal planning purposes only. This
draft document has been developed for initial consideration within the South-Eastern Victoria Region.
Continued use of this type of report will be subject to the development of data sharing protocols for the
Region.
Departmental staff (including school staff) in receipt of this document will treat as confidential all
information contained within this report. Furthermore the staff member will not:
Divulge or communicate either directly or indirectly any information to any person outside the
Department without the approval of the Department;
Copy or reproduce any information contained within the report without the approval of the
Regional Office and the associated Data Owner;
Allow any person outside the Department access to the information contained within this
report.
In addition, the Departmental staff member (including school staff) will take all necessary precautions to
prevent unauthorised access to or copying of the information in their control.
2 Confidential - Not for distribution

Table of ContentsPage
Disclaimer........................................................................................................................................................................ 2
Table of Contents............................................................................................................................................................. 3
Schools in West Grampians Network.............................................................................................................................. 4
Student Family Occupation (SFO) Trend......................................................................................................................... 5
Student Enrolment Trends............................................................................................................................................... 5
Student Enrolment Projections....................................................................................................................................... 5
Attendance...................................................................................................................................................................... 6
Retention Rates............................................................................................................................................................... 7
Australian Early Development Index (AEDI).................................................................................................................... 8
Kindergarten by LGA........................................................................................................................................................ 9
School Entrant Health Questionaire ............................................................................................................................... 10
English Online interview (EOI)......................................................................................................................................... 11
Naplan Top 3 Bottom 3 Bands......................................................................................................................................... 12
Naplan Bands................................................................................................................................................................... 24
Naplan Mean Score.......................................................................................................................................................... 36
Naplan Mean Score Comparison..................................................................................................................................... 37
Naplan Relative Growth................................................................................................................................................... 41
AUSVELS Teacher Judgements......................................................................................................................................... 50
Victorian Certificate of Education (VCE).......................................................................................................................... 61
VCE Mean Score - GAT Predicted Score vs Actual VCE Score.......................................................................................... 64
Victorian Certificate of Applied Learning (VCAL)............................................................................................................. 67
Vocational Education and Training (VET)........................................................................................................................ 67
VET Certificates offered by School.................................................................................................................................. 68
Expulsion Data................................................................................................................................................................. 69
Attitudes to School Survey.............................................................................................................................................. 70
School Staff Survey.......................................................................................................................................................... 72
Parent Opinion Survey..................................................................................................................................................... 73
Post-Secondary Pathways................................................................................................................................................ 74
Appendices....................................................................................................................................................................... 75
.........................................................................................................................................................................................
3 Confidential - Not for distribution

Schools in West Grampians NetworkSchool Name School Type LGA
Apsley Primary School Primary West Wimmera (S)
Balmoral K-12 Community College P-12 Southern Grampians (S)
Beulah Primary School Primary Yarriambiack (S)
Birchip P-12 School P-12 Buloke (S)
Concongella Primary School Primary Northern Grampians (S)
Dimboola Memorial Secondary College Secondary Hindmarsh (S)
Dimboola Primary School Primary Hindmarsh (S)
Donald High School Secondary Buloke (S)
Donald Primary School Primary Buloke (S)
Edenhope College P-12 West Wimmera (S)
Goroke P-12 College P-12 West Wimmera (S)
Great Western Primary School Primary Northern Grampians (S)
Halls Gap Primary School Primary Northern Grampians (S)
Hopetoun P-12 College P-12 Yarriambiack (S)
Horsham College Secondary Horsham (RC)
Horsham Primary School Primary Horsham (RC)
Horsham Special School Special Horsham (RC)
Horsham West and Haven Primary School Primary Horsham (RC)
Jeparit Primary School Primary Hindmarsh (S)
Kaniva College P-12 West Wimmera (S)
Laharum Primary School Primary Horsham (RC)
Marnoo Primary School Primary Northern Grampians (S)
Minyip Primary School Primary Yarriambiack (S)
Murtoa College P-12 Yarriambiack (S)
Natimuk Primary School Primary Horsham (RC)
Navarre Primary School Primary Northern Grampians (S)
Nhill College P-12 Hindmarsh (S)
Rainbow P-12 College (interim name) P-12 Hindmarsh (S)
Rupanyup Primary School Primary Yarriambiack (S)
Skene Street School Stawell Special Northern Grampians (S)
St Arnaud Primary School Primary Northern Grampians (S)
St Arnaud Secondary College Secondary Northern Grampians (S)
Stawell Primary School Primary Northern Grampians (S)
Stawell Secondary College Secondary Northern Grampians (S)
Stawell West Primary School Primary Northern Grampians (S)
Warracknabeal Primary School Primary Yarriambiack (S)
Warracknabeal Secondary College Secondary Yarriambiack (S)
Warracknabeal Special Developmental School Special Yarriambiack (S)
Yaapeet Primary School Primary Yarriambiack (S)
4 Confidential - Not for distribution

Student Family Occupation (SFO) Trend2013 2014 2015 2016 Trend
Murtoa College 0.5847 0.5901 0.5862 0.5328
West Grampians 0.5060 0.5215 0.5150 0.5328
Yarriambiack (S) 0.5256 0.5625 0.5850 0.5682
South-Western Victoria 0.5513 0.5476 0.5463 0.5540
State 0.5174 0.5186 0.5137 0.5154
Student Family Education (SFE) and Student Family Occupation Education (SOFE)2016 SFE SFOE
Murtoa College 0.4372 0.4850
West Grampians 0.4233 0.4852
Yarriambiack (S) 0.4389 0.5073
South-Western Victoria 0.4031 0.4736
State 0.3867 0.4530
Student Enrolment TrendsSchool Name Murtoa College
Sum of Enrolments
2010 2011 2012 2013 2014 2015 2016
Prep 8 15 9 19 7 11 11
Year 1 12 9 14 9 19 9 12
Year 2 11 11 10 16 9 17 9
Year 3 7 13 11 9 18 10 18
Year 4 10 7 13 10 11 15 10
Year 5 12 10 7 15 12 10 16
Year 6 12 12 12 10 17 13 12
Year 7 41 34 42 26 32 33 38
Year 8 36 41 36 38 30 32 32
Year 9 59 36 37 41 40 32 35
Year 10 43 50 30 36 36 40 31
Year 11 38 38 38 31 34 35 38
Year 12 24 21 27 30 17 26 23
Grand Total 313 297 285 290 282 282 285
Student Enrolment Projections2016 2021 Growth 2026 Growth 2031 Growth
Murtoa College 285 170 (40.4%) 157 (44.9%) 146 (48.8%)
West Grampians 6,084 5,244 (13.8%) 4,957 (18.5%) 4,765 (21.7%)
Yarriambiack (S) 931 651 (30.1%) 606 (34.9%) 565 (39.3%)
South-Western Victoria 146,093 154,441 5.7% 163,820 12.1% 165,821 13.5%
State 563,377 566,277 0.5% 580,561 3.1% 581,174 3.2%
5 Confidential - Not for distribution

Attendance School Murtoa College
Network West Grampians
LGA Yarriambiack (S)
Student Absence Region South-Western Victoria
State Victoria
Average Number of Absence Days per Student - 2015
Prep Year 1 Year 2 Year 3 Year 4 Year 5 Year 6 Year 7 Year 8 Year 9 Year 10 Year 11 Year 12
2015
Network 15.2 15.2 14.5 13.2 14.4 15.2 16.7 18.3 21.0 25.0 26.1 20.7 20.0
LGA 15.0 17.2 14.4 13.2 16.0 17.2 17.2 22.5 26.1 29.7 26.2 25.2 28.0
Region 15.7 15.4 15.1 14.5 14.8 14.8 15.6 16.2 19.6 21.2 19.5 17.3 15.0
State 15.1 14.9 14.4 14.1 14.4 14.4 15.1 15.9 19.8 20.8 19.1 17.2 15.3
School 23.1 24.1 17.8 14.4 18.7 10.6 16.6 26.3 36.9 37.7 33.7 28.0 38.0
0
5
10
15
20
25
30
35
40
6 Confidential - Not for distribution

Retention Rates School Murtoa College
Network West Grampians
LGA Yarriambiack (S)
Region South-Western Victoria
State Victoria
Real RetentionFour Year Trend - 2012 to 2015
2012 2013 2014 2015 Trend
Yr 7-10 School 61.5% 73.2% 71.4% 78.6%
Yr 7-10 Network 77.2% 79.3% 81.8% 79.0%
Yr 7-10 LGA 72.2% 81.3% 75.0% 77.1%
Yr 7-10 Region 75.5% 75.5% 76.2% 76.5%
Yr 7-10 State 69.7% 70.6% 72.0% 72.5%
Yr 10-11 School 80.4% 90.3% 91.9% 100.0%
Yr 10-11 Network 86.8% 89.5% 92.1% 90.7%
Yr 10-11 LGA 83.7% 91.9% 90.5% 96.3%
Yr 10-11 Region 83.4% 83.9% 85.7% 85.8%
Yr 10-11 State 79.1% 80.7% 81.5% 82.4%
Yr 11-12 School 71.1% 71.8% 48.4% 67.6%
Yr 11-12 Network 71.1% 74.1% 67.2% 72.3%
Yr 11-12 LGA 70.5% 74.3% 72.9% 69.2%
Yr 11-12 Region 73.5% 76.2% 77.2% 78.4%
Yr 11-12 State 78.3% 65.0% 82.1% 63.8%
Yr 7-12 School 63.4% 48.2% 30.8% 48.8%
Yr 7-12 Network 54.8% 57.7% 55.8% 60.4%
Yr 7-12 LGA 60.9% 56.1% 54.4% 55.0%
Yr 7-12 Region 53.0% 54.6% 55.1% 56.6%
Yr 7-12 State 48.0% 49.0% 49.6% 51.0%
Apparent RetentionFour Year Trend - 2012 to 2015
2012 2013 2014 2015 Trend
Year 10 - 12 School 62.1% 59.7% 56.7% 71.7%
Network 75.8% 79.2% 76.7% 87.7%
LGA 78.3% 82.5% 84.8% 76.1%
Region 78.1% 77.6% 81.5% 83.5%
State 80.9% 83.6% 85.0% 86.9%
Year 7 - 12 School 65.1% 53.2% 43.6% 62.9%
Network 69.2% 76.1% 76.0% 83.6%
LGA 71.1% 79.3% 102.9% 79.0%
Region 84.3% 85.7% 97.0% 97.7%
State 88.8% 92.4% 94.6% 95.8%
7 Confidential - Not for distribution
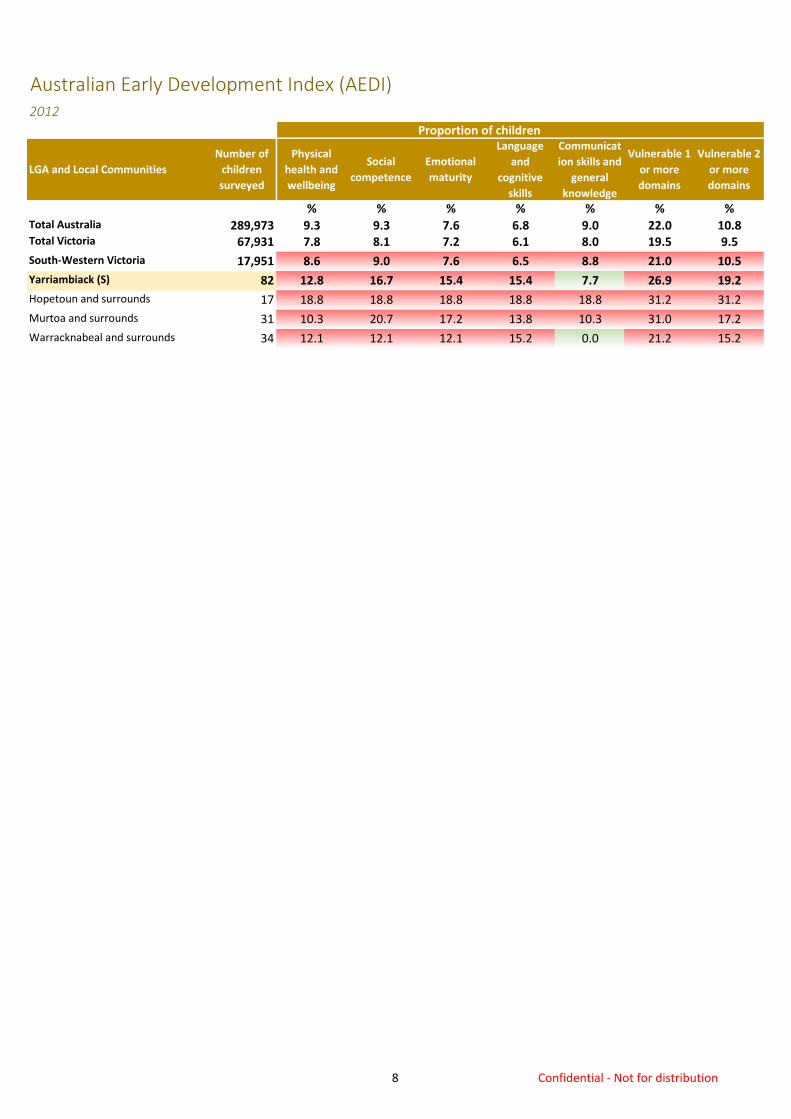
Australian Early Development Index (AEDI)2012
Proportion of children
LGA and Local Communities
Number of
children
surveyed
Physical
health and
wellbeing
Social
competence
Emotional
maturity
Language
and
cognitive
skills
Communicat
ion skills and
general
knowledge
Vulnerable 1
or more
domains
Vulnerable 2
or more
domains
% % % % % % %Total Australia 289,973 9.3 9.3 7.6 6.8 9.0 22.0 10.8Total Victoria 67,931 7.8 8.1 7.2 6.1 8.0 19.5 9.5
South-Western Victoria 17,951 8.6 9.0 7.6 6.5 8.8 21.0 10.5
Yarriambiack (S) 82 12.8 16.7 15.4 15.4 7.7 26.9 19.2
Hopetoun and surrounds 17 18.8 18.8 18.8 18.8 18.8 31.2 31.2
Murtoa and surrounds 31 10.3 20.7 17.2 13.8 10.3 31.0 17.2
Warracknabeal and surrounds 34 12.1 12.1 12.1 15.2 0.0 21.2 15.2
8 Confidential - Not for distribution

Kindergarten by LGA2014
Child Participation Rates and Enrolments
Participation
Rate %
4 year old
population
estimate¹
Total² 2nd Year³
Yarriambiack (S) 105.1% 78 89 7
South-Western Victoria 95.1% 20,255 20,158 896
Victoria 96.4% 73,246 73,776 3,168
Child Enrolments
Kindergarten Fee
SubsidyAboriginal⁴ NESB⁵
Children With A
Disability or
Developmental
Delay⁶
Yarriambiack (S) 38 0 0 1
South-Western Victoria 6,068 246 3,182 1,026
Victoria 19,567 1,053 9,904 2,891
Kindergarten Fee SubsidyKindergarten Fee
SubsidyATSI Fee Subsidy Health Care Card Concession
Yarriambiack (S) 38 0 37 1
South-Western Victoria 6,068 116 4,423 1,470
Victoria 19,567 641 14,874 3,995
Kindergarten Fee Subsidy Continued
Gold Card Refugee/ Asylum Multiple Births Special Subsidy
Yarriambiack (S) 0 0 0 0
South-Western Victoria 5 56 6 0
Victoria 20 134 58 0
Kindergarten Attendance Patterns
Number of
children attending
a service in LGA
Living in LGA And
Attend a service in
LGA
Living in LGA
Attend a service
outside LGA
Living outside LGA
Attend a service in
LGA
Yarriambiack (S) 0 0 0 0
Demographic Demand Forecastcast for KindergartensNo. of kindergarten age children expected to live in a kindergarten's DDF catchment area.
2014 2021 2026 2031
Yarriambiack (S) 89 70 67 65
South-Western Victoria 20,158 26,107 26,920 27,616
Victoria 73,776 77,999 79,969 81,497
1
2
3
4
5
6 Number of children attending a funded kindergarten program who have a continuing disability (including intellectual, sensory or physical
impairment) or developmental delay and may require assistance (compared to children of a similar age) in one or more of the following
areas: communication, mobility, self-care, cognitive, interpersonal interactions, everyday tasks and routines.
Estimate of the population of 4 yo in each LGA based upon the most recent (preliminary) 2013 ABS 3yo estimated resident population,
determined from the results of the 2011 Census of Population and Housing.
Number of children participating in a funded kindergarten program in the year before school as counted in the census week in August.
Number of children participating in a second year of funded kindergarten.
The number of enrolled children identified as being of Aboriginal and/or Torres Strait Islander origin.
The number of enrolled children identified as being from a non-English speaking background.
9 Confidential - Not for distribution

School Entrant Health Questionaire 2015 School Murtoa College
Network West Grampians
Children with emotional or behavioural difficulties LGA Yarriambiack (S)
Region South-Western Victoria
High Risk of significant clinical problems
(n) % (n) % (n) % (n) % (n) % (n) %
School 1 6.3 1 6.3 5 31.3 2 12.5 1 6.3 2 12.5
Network 32 7.7 26 6.2 45 10.8 34 8.1 9 2.2 26 6.2
LGA 7 5.2 9 6.7 11 8.2 17 12.7 3 2.2 8 6.0
Region 799 7.1 643 5.7 888 7.9 1,073 9.6 410 3.7 587 5.2
State 3,236 7.1 2,706 5.9 3,549 7.8 4,066 8.9 1,497 3.3 2,332 5.1
Moderate Risk of significant clinical problems
(n) % (n) % (n) % (n) % (n) % (n) %
School 0 0.0 0 0.0 0 0.0 0 0.0 0 0.0 0 0.0
Network 41 9.8 23 5.5 21 5.0 28 6.7 27 6.5 29 7.0
LGA 13 9.7 5 3.7 4 3.0 9 6.7 5 3.7 5 3.7
Region 960 8.6 608 5.4 532 4.7 976 8.7 657 5.8 584 5.2
State 3,753 8.2 2,345 5.1 2,168 4.7 3,700 8.1 2,514 5.5 2,156 4.7
Parent concerned about child's behaviour
(n) %
School 4 25.0
Network 55 13.2
LGA 14 10.4
Region 1,587 14.1
State 6,305 13.8
Children with a disability and children with developmental problemsParental report of children with a confirmed intellectual disability, developmental delay or learning disability
(n) % (n) %
School 2 12.5 5 31.3
Network 14 3.4 71 17.0
LGA 4 3.0 21 15.8
Region 466 4.1 1,771 15.8
State 1,703 3.7 6,785 14.8
ProsocialTotal
Difficulties
Conduct
Problems
Emotional
SymptomsHyperactivity Peer Problems Prosocial
Total
Difficulties
Concerns reported about
child’s behaviour
Child with disability or
developmental delay
Child with speech and
language difficulty
Conduct
Problems
Emotional
SymptomsHyperactivity Peer Problems
10 Confidential - Not for distribution

English Online interview (EOI)Students
Tested
School Murtoa College 11
Network West Grampians 378
Prep Reading LGA Yarriambiack (S) 64
Region South-Western Victoria 12,527
State Victoria 47,841
One Year Comparison - 2015
Three Year Trend - 2013 to 2015
91%79% 80% 76%
70%
9%21% 20% 22%
26%
1% 2% 3%
0%
20%
40%
60%
80%
100%
School Network LGA Region State
2015
Prep Reading
Above Level 4
Towards Level 4
Towards Level 3
Towards Level 2
Towards Level 1
Towards Foundation
68%
72%
78%
74%
79%
69%
74%
53%
75%
57%
70%
76%
80%
79%
91%
28%
24%
18%
22%
21%
28%
23%
39%
24%
43%
26%
22%
20%
21%
9%
3%
3%
3%
5%
3%
2%
8%
2%
3%
2%
1%
0% 20% 40% 60% 80% 100%
State
Region
LGA
Network
School
State
Region
LGA
Network
School
State
Region
LGA
Network
School
20
13
20
14
20
15
Prep Reading
11 Confidential - Not for distribution

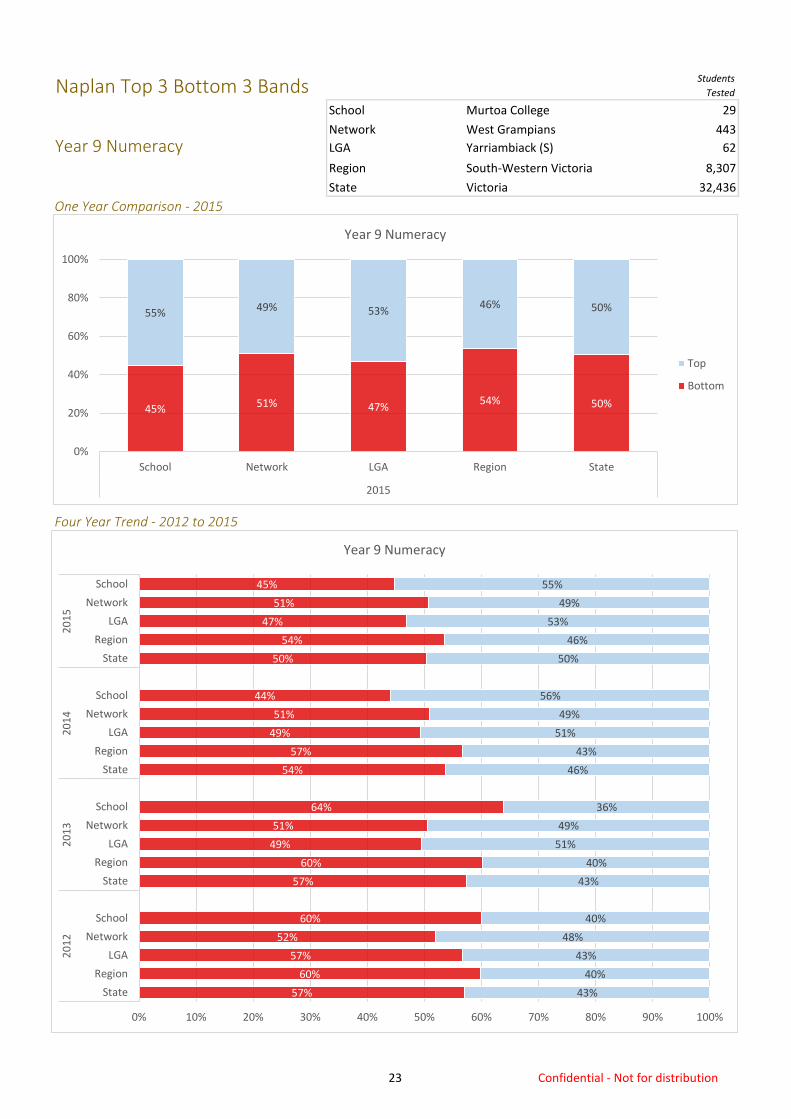
Naplan Top 3 Bottom 3 BandsStudents
Tested
School Murtoa College 9
Network West Grampians 396
Year 3 Reading LGA Yarriambiack (S) 48
Region South-Western Victoria 11,794
State Victoria 45,897
One Year Comparison - 2015
Four Year Trend - 2012 to 2015
44%
27%35% 30% 26%
56%
73%65% 70% 74%
0%
20%
40%
60%
80%
100%
School Network LGA Region State
2015
Year 3 Reading
Top 3
Bottom 3
28%
31%
45%
31%
33%
25%
30%
40%
32%
14%
25%
29%
23%
30%
40%
26%
30%
35%
27%
44%
72%
69%
55%
69%
67%
75%
70%
60%
68%
86%
75%
71%
77%
70%
60%
74%
70%
65%
73%
56%
0% 10% 20% 30% 40% 50% 60% 70% 80% 90% 100%
State
Region
LGA
Network
School
State
Region
LGA
Network
School
State
Region
LGA
Network
School
State
Region
LGA
Network
School
20
12
20
13
20
14
20
15
Year 3 Reading
12 Confidential - Not for distribution

Naplan Top 3 Bottom 3 BandsStudents
Tested
School Murtoa College 9
Network West Grampians 395
Year 3 Writing LGA Yarriambiack (S) 52
Region South-Western Victoria 11,762
State Victoria 45,743
One Year Comparison - 2015
Four Year Trend - 2012 to 2015
22% 24% 27% 25% 19%
78% 76% 73% 75% 81%
0%
20%
40%
60%
80%
100%
School Network LGA Region State
2015
Year 3 Writing
Top 3
Bottom 3
19%
22%
43%
24%
33%
19%
23%
29%
27%
50%
26%
30%
46%
35%
60%
19%
25%
27%
24%
22%
81%
78%
57%
76%
67%
81%
77%
71%
73%
50%
74%
70%
54%
65%
40%
81%
75%
73%
76%
78%
0% 10% 20% 30% 40% 50% 60% 70% 80% 90% 100%
State
Region
LGA
Network
School
State
Region
LGA
Network
School
State
Region
LGA
Network
School
State
Region
LGA
Network
School
20
12
20
13
20
14
20
15
Year 3 Writing
13 Confidential - Not for distribution

Naplan Top 3 Bottom 3 BandsStudents
Tested
School Murtoa College 9
Network West Grampians 399
Year 3 Numeracy LGA Yarriambiack (S) 51
Region South-Western Victoria 11,793
State Victoria 45,948
One Year Comparison - 2015
Four Year Trend - 2012 to 2015
44% 40% 41% 39% 34%
56% 60% 59% 61% 66%
0%
20%
40%
60%
80%
100%
School Network LGA Region State
2015
Year 3 Numeracy
Top
Bottom
32%
38%
45%
42%
33%
29%
33%
43%
34%
29%
31%
35%
45%
35%
60%
34%
39%
41%
40%
44%
68%
62%
55%
58%
67%
71%
67%
57%
66%
71%
69%
65%
55%
65%
40%
66%
61%
59%
60%
56%
0% 10% 20% 30% 40% 50% 60% 70% 80% 90% 100%
State
Region
LGA
Network
School
State
Region
LGA
Network
School
State
Region
LGA
Network
School
State
Region
LGA
Network
School
20
12
20
13
20
14
20
15
Year 3 Numeracy
14 Confidential - Not for distribution

Naplan Top 3 Bottom 3 BandsStudents
Tested
School Murtoa College 9
Network West Grampians 414
Year 5 Reading LGA Yarriambiack (S) 47
Region South-Western Victoria 10,668
State Victoria 41,557
One Year Comparison - 2015
Four Year Trend - 2012 to 2015
40%
45%
48%
49%
33%
33%
38%
36%
42%
19%
38%
42%
52%
38%
58%
39%
43%
51%
44%
33%
60%
55%
52%
51%
67%
67%
62%
64%
58%
81%
62%
58%
48%
62%
42%
61%
57%
49%
56%
67%
0% 10% 20% 30% 40% 50% 60% 70% 80% 90% 100%
State
Region
LGA
Network
School
State
Region
LGA
Network
School
State
Region
LGA
Network
School
State
Region
LGA
Network
School
20
12
20
13
20
14
20
15
Year 5 Reading
33%44%
51%43% 39%
67%56%
49%57% 61%
0%
20%
40%
60%
80%
100%
School Network LGA Region State
2015
Year 5 Reading
Top
Bottom
15 Confidential - Not for distribution

Naplan Top 3 Bottom 3 BandsStudents
Tested
School Murtoa College 9
Network West Grampians 411
Year 5 Writing LGA Yarriambiack (S) 46
Region South-Western Victoria 10,616
State Victoria 41,416
One Year Comparison - 2015
Four Year Trend - 2012 to 2015
49%
55%
76%
66%
83%
47%
52%
63%
60%
75%
54%
58%
74%
65%
92%
45%
51%
65%
62%
56%
51%
45%
24%
34%
17%
53%
48%
37%
40%
25%
46%
42%
26%
35%
8%
55%
49%
35%
38%
44%
0% 10% 20% 30% 40% 50% 60% 70% 80% 90% 100%
State
Region
LGA
Network
School
State
Region
LGA
Network
School
State
Region
LGA
Network
School
State
Region
LGA
Network
School
20
12
20
13
20
14
20
15
Year 5 Writing
56% 62% 65%51% 45%
44% 38% 35%49% 55%
0%
20%
40%
60%
80%
100%
School Network LGA Region State
2015
Year 5 Writing
Top
Bottom
16 Confidential - Not for distribution

Naplan Top 3 Bottom 3 BandsStudents
Tested
School Murtoa College 9
Network West Grampians 412
Year 5 Numeracy LGA Yarriambiack (S) 47
Region South-Western Victoria 10,656
State Victoria 41,534
One Year Comparison - 2015
Four Year Trend - 2012 to 2015
41%
47%
45%
49%
33%
46%
51%
52%
53%
47%
41%
46%
56%
45%
42%
41%
45%
40%
42%
33%
59%
53%
55%
51%
67%
54%
49%
48%
47%
53%
59%
54%
44%
55%
58%
59%
55%
60%
58%
67%
0% 10% 20% 30% 40% 50% 60% 70% 80% 90% 100%
State
Region
LGA
Network
School
State
Region
LGA
Network
School
State
Region
LGA
Network
School
State
Region
LGA
Network
School
20
12
20
13
20
14
20
15
Year 5 Numeracy
33%42% 40% 45% 41%
67%58% 60% 55% 59%
0%
20%
40%
60%
80%
100%
School Network LGA Region State
2015
Year 5 Numeracy
Top
Bottom
17 Confidential - Not for distribution

Naplan Top 3 Bottom 3 BandsStudents
Tested
School Murtoa College 30
Network West Grampians 427
Year 7 Reading LGA Yarriambiack (S) 65
Region South-Western Victoria 9,034
State Victoria 33,840
One Year Comparison - 2015
Four Year Trend - 2012 to 2015
53% 51% 52% 50% 48%
47% 49% 48% 50% 52%
0%
20%
40%
60%
80%
100%
School Network LGA Region State
2015
Year 7 Reading
Top
Bottom
45%
48%
45%
45%
38%
48%
50%
58%
53%
56%
47%
50%
42%
50%
52%
48%
50%
52%
51%
53%
55%
52%
55%
55%
62%
52%
50%
42%
47%
44%
53%
50%
58%
50%
48%
52%
50%
48%
49%
47%
0% 10% 20% 30% 40% 50% 60% 70% 80% 90% 100%
State
Region
LGA
Network
School
State
Region
LGA
Network
School
State
Region
LGA
Network
School
State
Region
LGA
Network
School
20
12
20
13
20
14
20
15
Year 7 Reading
18 Confidential - Not for distribution

Naplan Top 3 Bottom 3 BandsStudents
Tested
School Murtoa College 31
Network West Grampians 430
Year 7 Writing LGA Yarriambiack (S) 67
Region South-Western Victoria 9,037
State Victoria 33,822
One Year Comparison - 2015
Four Year Trend - 2012 to 2015
71% 72%64% 64% 62%
29% 28%36% 36% 38%
0%
20%
40%
60%
80%
100%
School Network LGA Region State
2015
Year 7 Writing
Top
Bottom
61%
64%
63%
63%
53%
61%
64%
65%
71%
52%
64%
68%
66%
72%
57%
62%
64%
64%
72%
71%
39%
36%
37%
37%
48%
39%
36%
35%
29%
48%
36%
32%
34%
28%
43%
38%
36%
36%
28%
29%
0% 10% 20% 30% 40% 50% 60% 70% 80% 90% 100%
State
Region
LGA
Network
School
State
Region
LGA
Network
School
State
Region
LGA
Network
School
State
Region
LGA
Network
School
20
12
20
13
20
14
20
15
Year 7 Writing
19 Confidential - Not for distribution

Naplan Top 3 Bottom 3 BandsStudents
Tested
School Murtoa College 31
Network West Grampians 425
Year 7 Numeracy LGA Yarriambiack (S) 67
Region South-Western Victoria 9,036
State Victoria 33,802
One Year Comparison - 2015
Four Year Trend - 2012 to 2015
52% 52% 49% 52% 49%
48% 48% 51% 48% 51%
0%
20%
40%
60%
80%
100%
School Network LGA Region State
2015
Year 7 Numeracy
Top
Bottom
52%
54%
58%
51%
50%
51%
53%
59%
52%
54%
50%
54%
46%
51%
48%
49%
52%
49%
52%
52%
48%
46%
42%
49%
50%
49%
47%
41%
48%
46%
50%
46%
54%
49%
52%
51%
48%
51%
48%
48%
0% 10% 20% 30% 40% 50% 60% 70% 80% 90% 100%
State
Region
LGA
Network
School
State
Region
LGA
Network
School
State
Region
LGA
Network
School
State
Region
LGA
Network
School
20
12
20
13
20
14
20
15
Year 7 Numeracy
20 Confidential - Not for distribution

Naplan Top 3 Bottom 3 BandsStudents
Tested
School Murtoa College 26
Network West Grampians 453
Year 9 Reading LGA Yarriambiack (S) 60
Region South-Western Victoria 8,342
State Victoria 32,447
One Year Comparison - 2015
Four Year Trend - 2012 to 2015
46%57% 53% 57% 54%
54%43% 47% 43% 46%
0%
20%
40%
60%
80%
100%
School Network LGA Region State
2015
Year 9 Reading
Top
Bottom
56%
60%
70%
58%
74%
56%
58%
59%
56%
67%
53%
55%
50%
56%
34%
54%
57%
53%
57%
46%
44%
40%
30%
42%
26%
44%
42%
41%
44%
33%
47%
45%
50%
44%
66%
46%
43%
47%
43%
54%
0% 10% 20% 30% 40% 50% 60% 70% 80% 90% 100%
State
Region
LGA
Network
School
State
Region
LGA
Network
School
State
Region
LGA
Network
School
State
Region
LGA
Network
School
20
12
20
13
20
14
20
15
Year 9 Reading
21 Confidential - Not for distribution

Naplan Top 3 Bottom 3 BandsStudents
Tested
School Murtoa College 29
Network West Grampians 454
Year 9 Writing LGA Yarriambiack (S) 67
Region South-Western Victoria 8,361
State Victoria 32,521
One Year Comparison - 2015
Four Year Trend - 2012 to 2015
55%66% 63% 66% 64%
45%34% 37% 34% 36%
0%
20%
40%
60%
80%
100%
School Network LGA Region State
2015
Year 9 Writing
Top
Bottom
62%
66%
73%
63%
65%
63%
66%
70%
69%
64%
64%
67%
57%
67%
50%
64%
66%
63%
66%
55%
38%
34%
27%
37%
35%
37%
34%
30%
31%
36%
36%
33%
43%
33%
50%
36%
34%
37%
34%
45%
0% 10% 20% 30% 40% 50% 60% 70% 80% 90% 100%
State
Region
LGA
Network
School
State
Region
LGA
Network
School
State
Region
LGA
Network
School
State
Region
LGA
Network
School
20
12
20
13
20
14
20
15
Year 9 Writing
22 Confidential - Not for distribution
Naplan Top 3 Bottom 3 BandsStudents
Tested
School Murtoa College 29
Network West Grampians 443
Year 9 Numeracy LGA Yarriambiack (S) 62
Region South-Western Victoria 8,307
State Victoria 32,436
One Year Comparison - 2015
Four Year Trend - 2012 to 2015
45% 51% 47%54% 50%
55% 49% 53%46% 50%
0%
20%
40%
60%
80%
100%
School Network LGA Region State
2015
Year 9 Numeracy
Top
Bottom
57%
60%
57%
52%
60%
57%
60%
49%
51%
64%
54%
57%
49%
51%
44%
50%
54%
47%
51%
45%
43%
40%
43%
48%
40%
43%
40%
51%
49%
36%
46%
43%
51%
49%
56%
50%
46%
53%
49%
55%
0% 10% 20% 30% 40% 50% 60% 70% 80% 90% 100%
State
Region
LGA
Network
School
State
Region
LGA
Network
School
State
Region
LGA
Network
School
State
Region
LGA
Network
School
20
12
20
13
20
14
20
15
Year 9 Numeracy
23 Confidential - Not for distribution

Naplan BandsStudents
Tested
School Murtoa College 9
Network West Grampians 396
Year 3 Reading LGA Yarriambiack (S) 48
Region South-Western Victoria 11,794
State Victoria 45,897
One Year Comparison - 2015
Four Year Trend - 2012 to 2015
4% 4% 3%
22%5% 10% 6% 5%
22%
19%25% 21%
18%
11%
28% 15% 22%21%
33%21%
15%20%
20%
11%25%
35%27% 33%
0%
20%
40%
60%
80%
100%
School Network LGA Region State
2015
Year 3 Reading
B6
B5
B4
B3
B2
B1
4%9%
3% 3% 3% 4% 3% 2% 4% 2% 5% 3% 4% 4% 3%
10%
14%
11% 9%12%
17%
10%8%
20%7% 13% 9%
8%
22%
5% 10%6% 5%
33%
17%
21%
17%16%
14%
18%
19%
17%
15%
20%
18%9%
16%14%
22%
19%
25%21%
18%
33%
23%
27%
22%
22%43%
26%
32%
26%
25%
20%
24%
23%
24%
23%
11%
28%15% 22%
21%
22%
27%
14%
24%
24%14%
18%
11%
19%
20%
27%
19%29%
19%
20%
33%
21%
15%
20%
20%
11%
19%14%
22%27% 29%
24%17%
26%30%
13%
28% 25%28%
32%
11%
25%
35%
27%33%
0%
20%
40%
60%
80%
100%
2012 2013 2014 2015
Year 3 Reading
24 Confidential - Not for distribution

Naplan BandsStudents
Tested
School Murtoa College 9
Network West Grampians 395
Year 3 Writing LGA Yarriambiack (S) 52
Region South-Western Victoria 11,762
State Victoria 45,743
One Year Comparison - 2015
Four Year Trend - 2012 to 2015
1% 2% 1% 1%2% 4% 4% 3%
22% 21% 21% 19%15%
56%
25%29%
23%22%
11%
41%37%
39%42%
11% 10% 8% 13% 17%
0%
20%
40%
60%
80%
100%
School Network LGA Region State
2015
Year 3 Writing
B6
B5
B4
B3
B2
B1
1% 2% 1% 1% 2% 2% 2% 1% 3% 3% 2% 1% 2% 1% 1%5%
13%
4% 3%
17%
5% 6% 5% 4% 7%7%
5%6% 5%
2%4% 4% 3%
33%18%
29%
17%14%
33%
20%21%
17%14%
53%
26%
41%
21%19%
22%21%
21% 19%15%
22%
27%
20%
26%
25%
17%
32%
48%
25%
24%
27%
31%
32%
25%
25%
56%
25%
29%
23%
22%
44%
44%
36%
41%43%
33%
35%
21%
39%
41%
13%
29%
21%
36%39%
11%
41%
37%
39%
42%
6%2%
11% 14%
6%2%
13%16%
4%9% 11% 11% 10% 8%
13%17%
0%
20%
40%
60%
80%
100%
2012 2013 2014 2015
Year 3 Writing
25 Confidential - Not for distribution

Naplan BandsStudents
Tested
School Murtoa College 9
Network West Grampians 399
Year 3 Numeracy LGA Yarriambiack (S) 51
Region South-Western Victoria 11,793
State Victoria 45,948
One Year Comparison - 2015
Four Year Trend - 2012 to 2015
4% 2% 4% 3%11% 16% 13% 11%
44%26% 24% 22%
21%
44%
29% 29%26%
25%
11%
18% 8% 19%21%
14%22% 16% 20%
0%
20%
40%
60%
80%
100%
School Network LGA Region State
2015
Year 3 Numeracy
B6
B5
B4
B3
B2
B1
4% 6% 3% 2%
14%
2%8%
2% 2% 1% 2% 2% 4% 2% 4% 3%
12%15%
10%8% 8%
9%
8% 7%
27%
10%9%
11%9%
11% 16% 13%11%
33%
26%
25%
24%
22% 14% 24%
26%
23%20%
33%
24%36%
21%20% 44%
26%24%
22%21%
33%
29%
30%
28%
29%
57%
38%
30%
32%
31%
20%
23%
18%
25%
24%
44%
29%29%
26%
25%
33%20%
19%
20%
21%
14%
20%23%
23%
26%
7%
25%20% 25%
26%
11%
18%8% 19%
21%
9%6%
14%17%
8%4%
11%15% 13%
17% 18% 16%19%
14%
22%16%
20%
0%
20%
40%
60%
80%
100%
2012 2013 2014 2015
Year 3 Numeracy
26 Confidential - Not for distribution

Naplan BandsStudents
Tested
School Murtoa College 9
Network West Grampians 414
Year 5 Reading LGA Yarriambiack (S) 47
Region South-Western Victoria 10,668
State Victoria 41,557
One Year Comparison - 2015
Four Year Trend - 2012 to 2015
4% 2% 4% 3%
16% 21% 16% 14%33%
24%28%
23%21%
33%23%
23%
23%23%
33%21%
17%19%
21%
12% 9% 15% 17%
0%
20%
40%
60%
80%
100%
School Network LGA Region State
2015
Year 5 Reading
B6
B5
B4
B3
B2
B1
9% 8% 6%3% 1% 1%
5%10%
5% 4% 4% 2% 4% 3%
12%
11%
11%10%
12%
9%10% 8% 8%
12%
11%
13%12%
16% 21% 16%14%
33%
28%
37%26%
24%
19%
27%
27%26%
24%
50%
20%
31%
24%22%
33%
24%
28%
23%
21%
67%
28% 28%
26%
26%
44%
30%
34% 30%
30%
25%
30%
28%
27%
27% 33%
23%
23%
23%
23%
16% 19%
20%
22%
19%
20%19% 20%
22%
17%
20%
11%
18%
19%
33%
21%
17%
19%
21%
7% 6%9% 12%
19%
8%11% 12% 14% 12%
8%14%
17%12%
9%15% 17%
0%
20%
40%
60%
80%
100%
2012 2013 2014 2015
Year 5 Reading
27 Confidential - Not for distribution

Naplan BandsStudents
Tested
School Murtoa College 9
Network West Grampians 411
Year 5 Writing LGA Yarriambiack (S) 46
Region South-Western Victoria 10,616
State Victoria 41,416
One Year Comparison - 2015
Four Year Trend - 2012 to 2015
11% 7% 9% 5% 4%
11%20%
8% 7%
44%44%
37%
37%34%
22%
27% 24%
31%33%
22%9% 11%
14% 16%
3% 4% 5%
0%
20%
40%
60%
80%
100%
School Network LGA Region State
2015
Year 5 Writing
B6
B5
B4
B3
B2
B1
17%
6% 4% 5% 4%
25%
6%11%
5% 4%
17%
8%11%
7% 5%11%
7% 9%5% 4%
17%
14%22%
10%8%
13%
13%8%
9%8%
33%
12%
19%
10%9%
11%
20%
8%7%
50%
46%
50%
40%
37%
38%
40%44%
37%35%
42%
45%
44%
41%39% 44%
44%
37%
37%
34%
17%
22%
11%
26%
28%
25%
27%25%
29%
31%
8%
25%
19%
28%29%
22%
27%24%
31%
33%
10% 9%
13%15%
11%10%
14%16%
8%5%
11%13% 22%
9%11%
14%16%
2% 4% 6% 7%2% 2%
5% 6%2% 2% 4% 4% 3% 4% 5%
0%
20%
40%
60%
80%
100%
2012 2013 2014 2015
Year 5 Writing
28 Confidential - Not for distribution

Naplan BandsStudents
Tested
School Murtoa College 9
Network West Grampians 412
Year 5 Numeracy LGA Yarriambiack (S) 47
Region South-Western Victoria 10,656
State Victoria 41,534
One Year Comparison - 2015
Four Year Trend - 2012 to 2015
1% 2% 2%11% 12% 21% 16% 13%
22%28% 19% 28%
26%
56% 35% 38% 27%28%
11%
14%19%
17%18%
8% 2%11% 13%
0%
20%
40%
60%
80%
100%
School Network LGA Region State
2015
Year 5 Numeracy
B6
B5
B4
B3
B2
B1
5%2%
5% 4%7% 5% 3% 4% 4% 5% 8%
5% 4% 1% 2% 2%
33%17%
20% 14%12%
14%15%
17%15%
17%13%
19%
15%13%
11%12%
21% 16%13%
27%24% 28%
26%40%
33% 34% 30%
28%25%
27%
30%
26%
24%
22%
28%19% 28%
26%
50%
33% 38%29%
30%
47%31%
36%
28%
28%
50%
35%
34%
30%
31%
56% 35% 38% 27%
28%
17%13% 11%
14%
16%
11%5%
12%
14%
8%
13%
3%
14%15%
11%
14%
19%
17%
18%
5% 5%10%
13%7% 5% 7%
9% 12%7% 6%
10% 13%8%
2%
11% 13%
0%
20%
40%
60%
80%
100%
2012 2013 2014 2015
Year 5 Numeracy
29 Confidential - Not for distribution

Naplan BandsStudents
Tested
School Murtoa College 30
Network West Grampians 427
Year 7 Reading LGA Yarriambiack (S) 65
Region South-Western Victoria 9,034
State Victoria 33,840
One Year Comparison - 2015
Four Year Trend - 2012 to 2015
3% 2% 3% 3%7%
17% 14% 16% 15%
47%31% 37% 31% 30%
30%28% 28%
26% 26%
3% 15% 12% 16% 18%
13%7% 8% 8% 9%
0%
20%
40%
60%
80%
100%
School Network LGA Region State
2015
Year 7 Reading
B6
B5
B4
B3
B2
B1
8% 6% 5% 5% 5%
12%6%
12%5% 4%
14%
5% 7% 4% 4% 3% 2% 3% 3%
5% 13%12%
16% 15%
16%
17%
16%
17% 16%
17%
14% 12% 16% 15%
7%
17%14%
16% 15%
24%
27% 28%
27%25%
28%
30%
31%
28%28%
21%
31%
24%
31%29%
47%
31%37% 31%
30%
27%
27% 28%28%
28%
20% 24%
29%
26%26%
31%28%
37%28%
28%
30%28% 28%
26%26%
27%
22%24% 18%
20%
24%16%
12%
16%18%
10%15% 14% 14%
16%3% 15% 12%
16%18%
8% 6% 4%6% 7% 6%
1%7% 8% 7% 7% 7% 8% 9%
13%7% 8% 8% 9%
0%
20%
40%
60%
80%
100%
2012 2013 2014 2015
Year 7 Reading
30 Confidential - Not for distribution
Naplan BandsStudents
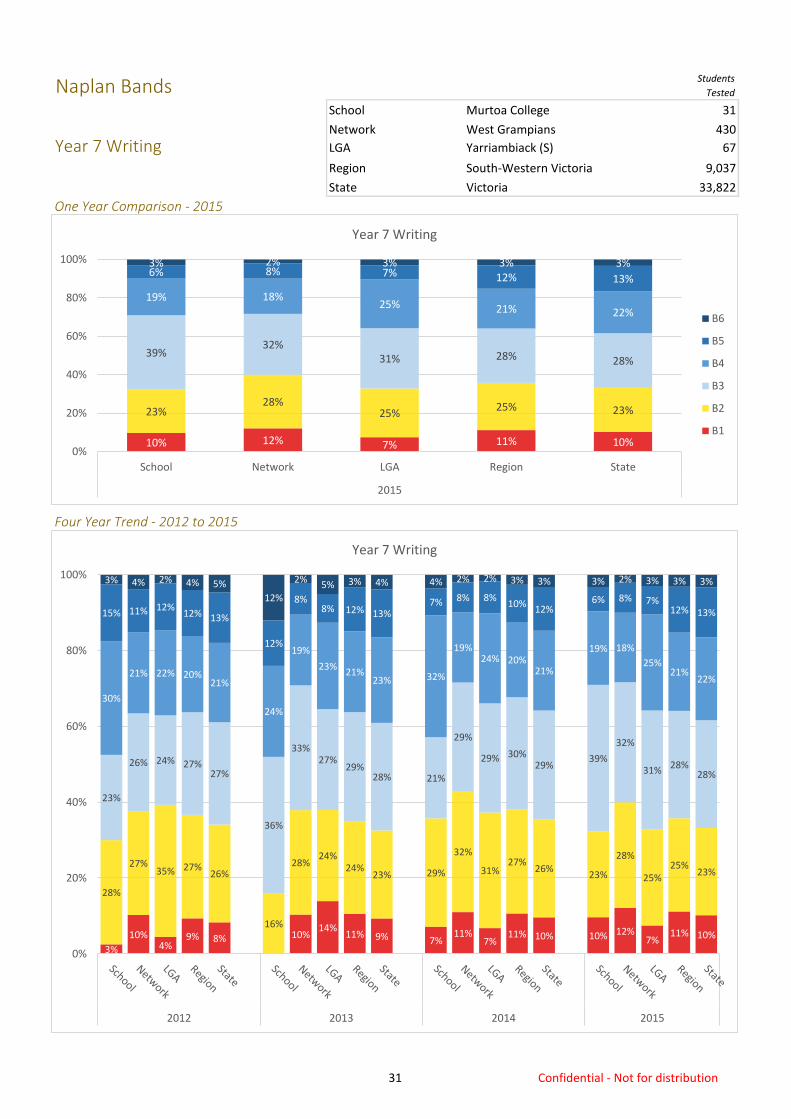
Tested
School Murtoa College 31
Network West Grampians 430
Year 7 Writing LGA Yarriambiack (S) 67
Region South-Western Victoria 9,037
State Victoria 33,822
One Year Comparison - 2015
Four Year Trend - 2012 to 2015
10% 12% 7% 11% 10%
23%28%
25%25% 23%
39%32%
31% 28% 28%
19% 18%25% 21% 22%
6% 8% 7% 12% 13%
3% 2% 3% 3% 3%
0%
20%
40%
60%
80%
100%
School Network LGA Region State
2015
Year 7 Writing
B6
B5
B4
B3
B2
B1
3%
10%4%
9% 8% 10%14%
11% 9% 7%11%
7%11% 10% 10% 12%
7%11% 10%
28%
27%35% 27%
26%
16%
28%24%
24%23% 29%
32%
31%27%
26%23%
28%
25%25%
23%
23%
26% 24% 27%27%
36%
33%27%
29%28% 21%
29%
29% 30%29%
39%
32%
31%28%
28%
30%
21% 22% 20%21%
24%
19%
23%21%
23% 32%
19%24% 20%
21%
19% 18%
25%21%
22%
15% 11% 12%12% 13%
12%
8%8% 12% 13%
7% 8% 8%10%
12%6% 8% 7%
12% 13%
3% 4% 2% 4% 5%
12%
2%5% 3% 4% 4% 2% 2% 3% 3% 3% 2% 3% 3% 3%
0%
20%
40%
60%
80%
100%
2012 2013 2014 2015
Year 7 Writing
31 Confidential - Not for distribution

Naplan BandsStudents
Tested
School Murtoa College 31
Network West Grampians 425
Year 7 Numeracy LGA Yarriambiack (S) 67
Region South-Western Victoria 9,036
State Victoria 33,802
One Year Comparison - 2015
Four Year Trend - 2012 to 2015
1% 2% 2%3%16%
9%18% 17%
48%35%
40%32% 31%
42%29% 39%
27% 27%
3%13%
9%14% 14%
3% 6% 3% 8% 9%
0%
20%
40%
60%
80%
100%
School Network LGA Region State
2015
Year 7 Numeracy
B6
B5
B4
B3
B2
B1
5% 4% 4% 4% 4% 4%1% 1% 3% 2% 2% 3% 3% 1% 2% 2%
29%
18%26%
20%19% 21%
16%22% 20% 18% 21% 17%
15%
18% 17%
3%
16%
9%
18% 17%
16%
28%
29%
29%29%
29%
34%
36%31%
30% 28% 32%
31%
32%30%
48%
35%
40%
32%31%
21%24%
23%24%
25%
29%29%
24%
25%26% 28%
30%34%
24%25%
42%
29%39%
27%27%
18%16%
12%13%
14%
13%14%
15%
14%14% 17%
15% 15%13%
15%
3%
13%
9%
14% 14%
11% 9% 7% 9% 10%4% 5%
1%
8% 9% 7%4% 5%
9% 10%3% 6%
3%8% 9%
0%
20%
40%
60%
80%
100%
2012 2013 2014 2015
Year 7 Numeracy
32 Confidential - Not for distribution

Naplan BandsStudents
Tested
School Murtoa College 26
Network West Grampians 453
Year 9 Reading LGA Yarriambiack (S) 60
Region South-Western Victoria 8,342
State Victoria 32,447
One Year Comparison - 2015
Four Year Trend - 2012 to 2015
7% 2% 7% 6%
35% 23%27% 23% 21%
12% 26% 25% 27% 26%
31%24% 32% 24% 24%
15%15% 12% 14% 15%
8% 4% 3% 5% 6%
0%
20%
40%
60%
80%
100%
School Network LGA Region State
2015
Year 9 Reading
B6
B5
B4
B3
B2
B1
3%6% 9% 9% 8%
11%5%
8% 5% 5% 6%1%
8% 8% 7%2%
7% 6%
29% 20%
28%
21%20%
25%
20%
22%21% 20%
13%
22%
19%
20% 19% 35% 23%
27%23% 21%
43%
33%
33%
30%29%
31%
32%
28%32%
30%
22%
28%
29%
27%26% 12%
26%25%
27%26%
17%
24%
21%
23%24%
28%
25%
28%25%
26%
38%
26%33% 25%
26%
31%
24% 32% 24%24%
6%
13%
7%
13%14%
3%
15%9%
14% 15%
16%
13% 12% 15%16%
15%15%
12%14%
15%
3% 4%1%
5% 6%3% 3% 4% 3% 3%
13%
5% 5% 5% 6% 8%4% 3% 5% 6%
0%
20%
40%
60%
80%
100%
2012 2013 2014 2015
Year 9 Reading
33 Confidential - Not for distribution

Naplan BandsStudents
Tested
School Murtoa College 29
Network West Grampians 454
Year 9 Writing LGA Yarriambiack (S) 67
Region South-Western Victoria 8,361
State Victoria 32,521
One Year Comparison - 2015
Four Year Trend - 2012 to 2015
14% 19% 21% 21% 20%
10%
24%13%
21% 21%
31%
24%28%
23% 23%
28%
25%21%
23% 23%
10%7%
13% 7% 8%7% 2% 3% 4% 5%
0%
20%
40%
60%
80%
100%
School Network LGA Region State
2015
Year 9 Writing
B6
B5
B4
B3
B2
B1
12%
20%
29%22% 20%
11%
21%15%
21% 19%
12%
20%
12%
21% 19%14%
19% 21% 21% 20%
21%
22%
22%
21%20%
19%
23%29%
22%21%
12%
21%
16%
22%21%
10%
24%13%
21%21%
32%
21%
23%
22%
22%
33%
25% 26%24%
24%
26%
26%
28%
24%23%
31%
24%
28%
23%23%
24% 26%
20%
20%22%
31% 21%23%
22%22%
38%
23%
30%
21%23%
28%
25%
21%
23%23%
9% 8%5%
9%10%
6%
7%7%
8%9%
9% 9%10% 8% 9%
10%
7%
13%7%
8%
3% 3% 1%5% 6%
3% 4% 5% 3% 2% 4% 4% 5% 7%2% 3% 4% 5%
0%
20%
40%
60%
80%
100%
2012 2013 2014 2015
Year 9 Writing
34 Confidential - Not for distribution

Naplan BandsStudents
Tested
School Murtoa College 29
Network West Grampians 443
Year 9 Numeracy LGA Yarriambiack (S) 62
Region South-Western Victoria 8,307
State Victoria 32,436
One Year Comparison - 2015
Four Year Trend - 2012 to 2015
2% 2% 3% 2%7%14% 13%
18% 17%
38%
34% 32%33% 31%
38%33%
34% 26% 26%
14% 12% 16% 13% 13%
3% 5% 3% 8% 10%
0%
20%
40%
60%
80%
100%
School Network LGA Region State
2015
Year 9 Numeracy
B6
B5
B4
B3
B2
B1
3% 2% 2% 4% 3%
11%6% 7% 8% 8%
2% 3% 3% 2% 2% 3% 2%
23%19%
24%26%
24%
25%
16%19%
22% 21%
15%
18%16%
21% 20%
7%
14%13%
18% 17%
34%
31%
30%30%
30%
28%
29% 24%
30%29%
29%
30%33%
32%31%
38%
34%32%
33%31%
26%
25%
28% 22%22%
28%
24% 27%
21%21%
15%
24%24%
23%24%
38%33%
34%26%
26%
9%
14%
7% 12%12%
6%
14% 11%
11%11%
21%
17%15%
12%13%
14% 12% 16%13%
13%
6%9% 8% 7% 9%
3%
12% 13%8% 11%
21%
8%11%
8% 10%3% 5% 3%
8% 10%
0%
20%
40%
60%
80%
100%
2012 2013 2014 2015
Year 9 Numeracy
35 Confidential - Not for distribution

Naplan Mean Score School Murtoa College
Network West Grampians
LGA Yarriambiack (S)
Two Year Trend - 2014 to 2015 Region South-Western Victoria
State Victoria
Reading
Year 3 Year 5 Year 7 Year 9 Year 3 Year 5 Year 7 Year 9
School 399.2 482.8 519.2 604.9 392.3 507.6 543.7 586.8
Network 418.3 500.0 531.5 571.6 424.8 492.1 532.9 573.1
LGA 422.1 478.0 533.4 582.9 434.1 478.3 539.0 578.0
Region 420.3 498.7 533.2 571.9 425.7 496.0 536.4 573.3
State 430.2 507.3 539.2 575.9 437.8 505.0 540.2 576.8
Writing
Year 3 Year 5 Year 7 Year 9 Year 3 Year 5 Year 7 Year 9
School 374.1 423.1 511.4 570.1 404.3 477.0 499.6 570.9
Network 395.4 461.2 492.3 542.2 419.3 467.2 493.1 536.7
LGA 385.2 445.0 505.5 561.4 412.8 458.8 506.3 536.1
Region 407.3 471.0 498.8 540.1 420.4 480.4 504.9 541.2
State 414.6 477.5 504.3 544.0 429.3 487.7 509.0 545.5
Numeracy
Year 3 Year 5 Year 7 Year 9 Year 3 Year 5 Year 7 Year 9
School 376.8 469.8 543.5 608.8 380.7 487.8 531.7 592.2
Network 407.5 482.4 532.5 585.4 395.5 493.2 533.7 581.7
LGA 402.0 462.0 540.7 592.1 397.6 487.9 534.5 587.2
Region 405.3 486.8 533.3 578.2 399.1 493.4 535.2 583.0
State 414.4 495.3 538.8 584.1 409.8 501.6 538.8 589.3
2014 2015
2014 2015
2014 2015
36 Confidential - Not for distribution

Naplan Mean Score Comparison School Murtoa College
Network West Grampians
LGA Yarriambiack (S)
Year 3 - 2015 Region South-Western Victoria
State Victoria
Reading
Writing
Numeracy
200
300
400
500
600
700
800
Year 3 Reading
Network LGA Region State
200
300
400
500
600
700
800
Year 3 Writing
Network LGA Region State
200
300
400
500
600
700
800
Year 3 Numeracy
Network LGA Region State
37 Confidential - Not for distribution

Naplan Mean Score Comparison School Murtoa College
Network West Grampians
LGA Yarriambiack (S)
Year 5 - 2015 Region South-Western Victoria
State Victoria
Reading
Writing
Numeracy
200
300
400
500
600
700
800
Year 5 Reading
Network LGA Region State
200
300
400
500
600
700
800
Year 5 Writing
Network LGA Region State
200
300
400
500
600
700
800
Year 5 Numeracy
Network LGA Region State
38 Confidential - Not for distribution

Naplan Mean Score Comparison School Murtoa College
Network West Grampians
LGA Yarriambiack (S)
Year 7 - 2015 Region South-Western Victoria
State Victoria
Reading
Writing
Numeracy
200
300
400
500
600
700
800
Year 7 Reading
Network LGA Region State
200
300
400
500
600
700
800
Year 7 Writing
Network LGA Region State
200
300
400
500
600
700
800
Year 7 Numeracy
Network LGA Region State
39 Confidential - Not for distribution

Naplan Mean Score Comparison School Murtoa College
Network West Grampians
LGA Yarriambiack (S)
Year 9 - 2015 Region South-Western Victoria
State Victoria
Reading
Writing
Numeracy
200
300
400
500
600
700
800
Year 9 Reading
Network LGA Region State
200
300
400
500
600
700
800
Year 9 Writing
Network LGA Region State
200
300
400
500
600
700
800
Year 9 Numeracy
Network LGA Region State
40 Confidential - Not for distribution

Naplan Relative GrowthStudents
Tested
School Murtoa College 9
Network West Grampians 386
Year 5 Reading LGA Yarriambiack (S) 44
Region South-Western Victoria 9,548
State Victoria 37,299
One Year Comparison - 2015
Four Year Trend - 2012 to 2015
11%
28% 25% 27% 26%
44% 48%57%
49% 49% 44%
24% 18%24% 24%
0%
25%
50%
Low Med High
Year 5 Reading
26%
27%
27%
33%
20%
25%
27%
33%
35%
31%
25%
26%
24%
23%
26%
27%
25%
28%
11%
50%
50%
53%
48%
40%
50%
50%
48%
46%
46%
50%
50%
53%
52%
67%
49%
49%
57%
48%
44%
24%
23%
20%
19%
40%
25%
23%
19%
20%
23%
25%
24%
24%
25%
33%
24%
24%
18%
24%
44%
0% 25% 50% 75% 100%
State
Region
LGA
Network
School
State
Region
LGA
Network
School
State
Region
LGA
Network
School
State
Region
LGA
Network
School
20
12
20
13
20
14
20
15
Year 5 Reading
Low Med High
25%
50%
25%
State Benchmarks
41 Confidential - Not for distribution

Naplan Relative GrowthStudents
Tested
School Murtoa College 8
Network West Grampians 383
Year 5 Writing LGA Yarriambiack (S) 43
Region South-Western Victoria 9,487
State Victoria 37,110
One Year Comparison - 2015
Four Year Trend - 2012 to 2015
37%30% 28% 26%
50% 47% 49% 50% 50% 50%
16% 21% 22% 24%
0%
25%
50%
Low Med High
Year 5 Writing
26%
28%
44%
37%
54%
26%
28%
38%
31%
67%
26%
28%
30%
37%
50%
50%
39%
46%
38%
50%
50%
39%
52%
33%
50%
50%
49%
47%
50%
24%
21%
18%
17%
8%
24%
23%
23%
17%
24%
22%
21%
16%
50%
0% 25% 50% 75% 100%
State
Region
LGA
Network
School
State
Region
LGA
Network
School
State
Region
LGA
Network
School
State
Region
LGA
Network
School
20
12
20
13
20
14
20
15
Year 5 Writing
Low Med High
25%
50%
25%
State Benchmarks
42 Confidential - Not for distribution

Naplan Relative GrowthStudents
Tested
School Murtoa College 8
Network West Grampians 384
Year 5 Numeracy LGA Yarriambiack (S) 43
Region South-Western Victoria 9,472
State Victoria 37,043
One Year Comparison - 2015
Four Year Trend - 2012 to 2015
13%23%
14%27% 26%
50% 53% 58%50% 49%
38%24% 28% 24% 24%
0%
25%
50%
Low Med High
Year 5 Numeracy
26%
28%
33%
34%
20%
25%
26%
38%
30%
31%
25%
26%
28%
25%
22%
26%
27%
14%
23%
13%
50%
50%
47%
49%
60%
50%
51%
35%
52%
46%
50%
50%
48%
49%
67%
49%
50%
58%
53%
50%
25%
22%
20%
18%
20%
25%
23%
27%
18%
23%
25%
24%
24%
26%
11%
24%
24%
28%
24%
38%
0% 25% 50% 75% 100%
State
Region
LGA
Network
School
State
Region
LGA
Network
School
State
Region
LGA
Network
School
State
Region
LGA
Network
School
20
12
20
13
20
14
20
15
Year 5 Numeracy
Low Med High
25%
50%
25%
State Benchmarks
43 Confidential - Not for distribution

Naplan Relative GrowthStudents
Tested
School Murtoa College 29
Network West Grampians 388
Year 7 Reading LGA Yarriambiack (S) 62
Region South-Western Victoria 8,043
State Victoria 30,078
One Year Comparison - 2015
Four Year Trend - 2012 to 2015
17%28% 27% 29% 28%
52% 49% 48% 48% 49%
31%23% 24% 23% 23%
0%
25%
50%
Low Med High
Year 7 Reading
28%
27%
22%
24%
19%
28%
27%
37%
31%
27%
28%
28%
25%
31%
36%
28%
29%
27%
28%
17%
50%
50%
51%
52%
47%
49%
50%
48%
50%
50%
49%
49%
55%
50%
43%
49%
48%
48%
49%
52%
23%
23%
26%
23%
33%
23%
23%
15%
20%
23%
23%
23%
20%
20%
21%
23%
23%
24%
23%
31%
0% 25% 50% 75% 100%
State
Region
LGA
Network
School
State
Region
LGA
Network
School
State
Region
LGA
Network
School
State
Region
LGA
Network
School
20
12
20
13
20
14
20
15
Year 7 Reading
Low Med High
25%
50%
25%
State Benchmarks
44 Confidential - Not for distribution

Naplan Relative GrowthStudents
Tested
School Murtoa College 30
Network West Grampians 398
Year 7 Writing LGA Yarriambiack (S) 65
Region South-Western Victoria 8,003
State Victoria 29,949
One Year Comparison - 2015
Four Year Trend - 2012 to 2015
17%
33%20%
30% 30%
57%50% 51% 49% 49%
27%17%
29%21% 21%
0%
25%
50%
Low Med High
Year 7 Writing
30%
31%
25%
28%
4%
29%
30%
16%
30%
7%
30%
30%
20%
33%
17%
49%
48%
44%
51%
35%
49%
50%
52%
51%
48%
49%
49%
51%
50%
57%
21%
21%
31%
21%
61%
21%
20%
32%
20%
44%
21%
21%
29%
17%
27%
0% 25% 50% 75% 100%
State
Region
LGA
Network
School
State
Region
LGA
Network
School
State
Region
LGA
Network
School
State
Region
LGA
Network
School
20
12
20
13
20
14
20
15
Year 7 Writing
Low Med High
25%
50%
25%
State Benchmarks
45 Confidential - Not for distribution

Naplan Relative GrowthStudents
Tested
School Murtoa College 29
Network West Grampians 385
Year 7 Numeracy LGA Yarriambiack (S) 63
Region South-Western Victoria 7,990
State Victoria 29,828
One Year Comparison - 2015
Four Year Trend - 2012 to 2015
14%26%
17%28% 29%
62%53%
59%49% 49%
24% 21% 24% 23% 22%
0%
25%
50%
Low Med High
Year 7 Numeracy
29%
27%
34%
29%
25%
28%
27%
26%
22%
18%
29%
28%
16%
25%
11%
29%
28%
17%
26%
14%
49%
49%
49%
47%
61%
49%
50%
59%
54%
50%
49%
49%
54%
49%
50%
49%
49%
59%
53%
62%
22%
24%
18%
24%
14%
23%
23%
16%
23%
32%
22%
24%
30%
26%
39%
22%
23%
24%
21%
24%
0% 25% 50% 75% 100%
State
Region
LGA
Network
School
State
Region
LGA
Network
School
State
Region
LGA
Network
School
State
Region
LGA
Network
School
20
12
20
13
20
14
20
15
Year 7 Numeracy
Low Med High
25%
50%
25%
State Benchmarks
46 Confidential - Not for distribution

Naplan Relative GrowthStudents
Tested
School Murtoa College 25
Network West Grampians 423
Year 9 Reading LGA Yarriambiack (S) 58
Region South-Western Victoria 7,469
State Victoria 29,264
One Year Comparison - 2015
Four Year Trend - 2012 to 2015
12%24%
10%27% 27%
48% 51% 52% 50% 49%40%
25%38%
23% 23%
0%
25%
50%
Low Med High
Year 9 Reading
27%
27%
41%
28%
26%
27%
26%
30%
29%
30%
27%
27%
20%
30%
21%
27%
27%
10%
24%
12%
49%
49%
42%
51%
47%
49%
50%
51%
51%
52%
50%
50%
53%
49%
41%
49%
50%
52%
51%
48%
24%
24%
17%
21%
26%
24%
24%
19%
20%
18%
24%
23%
27%
20%
38%
23%
23%
38%
25%
40%
0% 25% 50% 75% 100%
State
Region
LGA
Network
School
State
Region
LGA
Network
School
State
Region
LGA
Network
School
State
Region
LGA
Network
School
20
12
20
13
20
14
20
15
Year 9 Reading
Low Med High
25%
50%
25%
State Benchmarks
47 Confidential - Not for distribution

Naplan Relative GrowthStudents
Tested
School Murtoa College 28
Network West Grampians 418
Year 9 Writing LGA Yarriambiack (S) 63
Region South-Western Victoria 7,486
State Victoria 29,352
One Year Comparison - 2015
Four Year Trend - 2012 to 2015
21% 26% 25% 28% 28%
68%
50% 54% 51% 49%
11%24% 21% 22% 23%
0%
25%
50%
Low Med High
Year 9 Writing
29%
30%
33%
33%
39%
28%
30%
20%
32%
25%
28%
28%
25%
26%
21%
50%
51%
45%
51%
42%
49%
49%
50%
45%
47%
49%
51%
54%
50%
68%
21%
20%
22%
17%
18%
22%
22%
30%
22%
28%
23%
22%
21%
24%
11%
0% 25% 50% 75% 100%
State
Region
LGA
Network
School
State
Region
LGA
Network
School
State
Region
LGA
Network
School
State
Region
LGA
Network
School
20
12
20
13
20
14
20
15
Year 9 Writing
Low Med High
25%
50%
25%
State Benchmarks
48 Confidential - Not for distribution

Naplan Relative GrowthStudents
Tested
School Murtoa College 27
Network West Grampians 414
Year 9 Numeracy LGA Yarriambiack (S) 57
Region South-Western Victoria 7,411
State Victoria 29,143
One Year Comparison - 2015
Four Year Trend - 2012 to 2015
7%
28%
14%
29% 28%
67%
47% 53% 50% 49%
26% 24%33%
21% 23%
0%
25%
50%
Low Med High
Year 9 Numeracy
28%
27%
16%
20%
12%
25%
25%
16%
19%
24%
28%
28%
10%
24%
10%
28%
29%
14%
28%
7%
49%
49%
52%
53%
47%
51%
52%
62%
55%
59%
49%
50%
51%
51%
57%
49%
50%
53%
47%
67%
23%
23%
32%
27%
41%
24%
23%
22%
26%
18%
23%
22%
38%
25%
33%
23%
21%
33%
24%
26%
0% 25% 50% 75% 100%
State
Region
LGA
Network
School
State
Region
LGA
Network
School
State
Region
LGA
Network
School
State
Region
LGA
Network
School
20
12
20
13
20
14
20
15
Year 9 Numeracy
Low Med High
25%
50%
25%
State Benchmarks
49 Confidential - Not for distribution

AUSVELS Teacher JudgementsSchool Murtoa College
Network West Grampians
Prep LGA Yarriambiack (S)
Region South-Western Victoria
Semester 2 - 2015 State Victoria
A B C D E Students
Reading and viewing School 0% 0% 82% 18% 0% 11
Network 5% 24% 66% 5% 0% 404
LGA 5% 11% 69% 16% 0% 64
Region 11% 25% 61% 4% 0% 12,184
State 12% 25% 60% 3% 0% 46,258
Writing School 0% 0% 91% 9% 0% 11
Network 2% 21% 72% 5% 0% 404
LGA 2% 2% 89% 8% 0% 64
Region 4% 20% 72% 4% 0% 12,172
State 5% 21% 71% 3% 0% 46,248
Speaking and listening School 0% 0% 100% 0% 0% 11
Network 0% 9% 90% 1% 0% 405
LGA 0% 9% 91% 0% 0% 64
Region 2% 12% 85% 1% 0% 12,113
State 2% 14% 83% 1% 0% 46,231
Number and algebra School 0% 9% 91% 0% 0% 11
Network 3% 21% 75% 1% 0% 403
LGA 2% 20% 77% 2% 0% 64
Region 5% 22% 72% 1% 0% 13,237
State 6% 23% 69% 1% 0% 49,956
Measurement and geometry School 0% 0% 100% 0% 0% 11
Network 1% 4% 94% 0% 0% 405
LGA 0% 6% 92% 2% 0% 64
Region 2% 13% 84% 1% 0% 13,164
State 3% 16% 81% 1% 0% 49,712
Statistics and probability School 0% 0% 100% 0% 0% 11
Network 1% 3% 95% 1% 0% 405
LGA 0% 8% 91% 2% 0% 64
Region 2% 14% 83% 1% 0% 12,815
State 3% 15% 81% 1% 0% 48,855
50 Confidential - Not for distribution

AUSVELS Teacher JudgementsSchool Murtoa College
Network West Grampians
Year 1 LGA Yarriambiack (S)
Region South-Western Victoria
Semester 2 - 2015 State Victoria
A B C D E Students
Reading and viewing School 0% 33% 56% 0% 11% 9
Network 9% 26% 54% 10% 1% 406
LGA 7% 21% 59% 12% 2% 58
Region 17% 27% 51% 6% 0% 12,159
State 17% 28% 50% 5% 0% 45,816
Writing School 0% 11% 78% 11% 0% 9
Network 3% 19% 66% 10% 1% 406
LGA 5% 5% 78% 12% 0% 58
Region 6% 20% 67% 7% 0% 12,159
State 6% 21% 66% 6% 0% 45,818
Speaking and listening School 0% 0% 100% 0% 0% 9
Network 0% 11% 84% 5% 0% 406
LGA 0% 14% 83% 2% 2% 58
Region 2% 14% 81% 3% 0% 12,109
State 3% 16% 78% 3% 0% 45,779
Number and algebra School 0% 11% 78% 11% 0% 9
Network 4% 18% 69% 8% 0% 406
LGA 10% 14% 72% 3% 0% 58
Region 7% 24% 65% 4% 0% 12,947
State 8% 25% 63% 3% 0% 48,592
Measurement and geometry School 0% 11% 89% 0% 0% 9
Network 2% 7% 86% 5% 0% 383
LGA 7% 9% 84% 0% 0% 58
Region 3% 17% 77% 3% 0% 12,917
State 4% 19% 74% 2% 0% 48,387
Statistics and probability School 0% 11% 89% 0% 0% 9
Network 1% 6% 88% 5% 0% 405
LGA 5% 9% 86% 0% 0% 58
Region 3% 18% 76% 3% 0% 12,761
State 4% 19% 74% 2% 0% 48,039
51 Confidential - Not for distribution
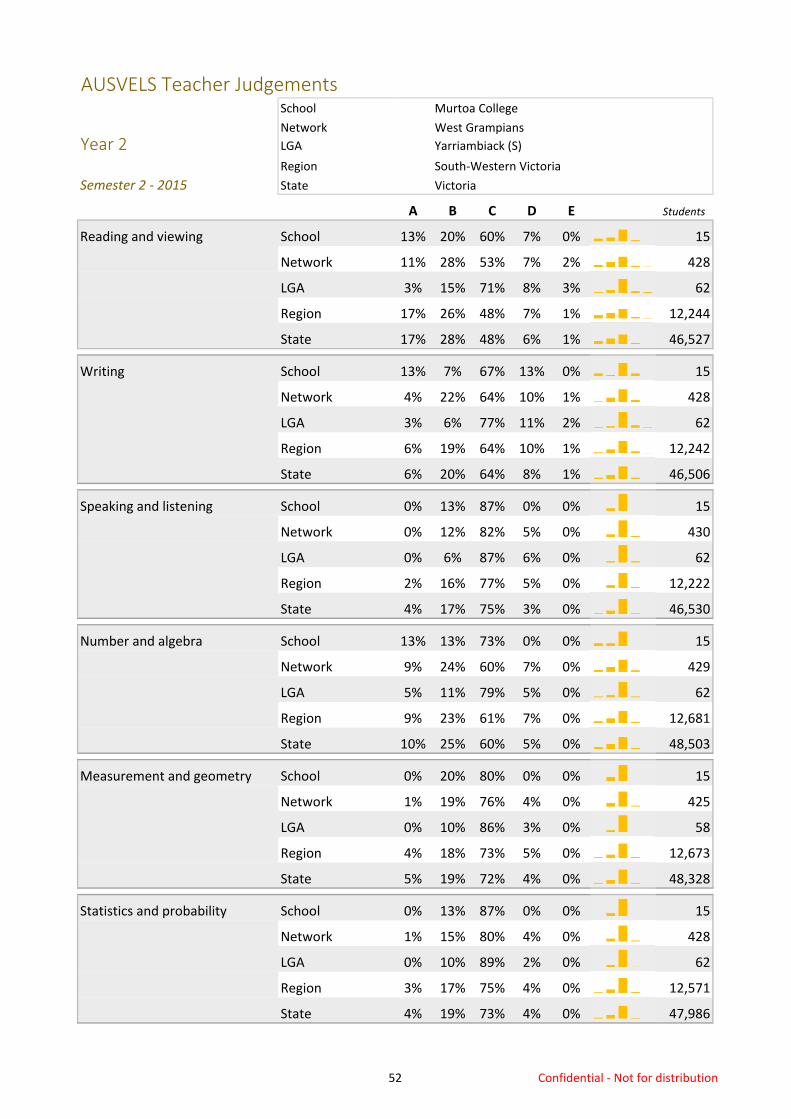
AUSVELS Teacher JudgementsSchool Murtoa College
Network West Grampians
Year 2 LGA Yarriambiack (S)
Region South-Western Victoria
Semester 2 - 2015 State Victoria
A B C D E Students
Reading and viewing School 13% 20% 60% 7% 0% 15
Network 11% 28% 53% 7% 2% 428
LGA 3% 15% 71% 8% 3% 62
Region 17% 26% 48% 7% 1% 12,244
State 17% 28% 48% 6% 1% 46,527
Writing School 13% 7% 67% 13% 0% 15
Network 4% 22% 64% 10% 1% 428
LGA 3% 6% 77% 11% 2% 62
Region 6% 19% 64% 10% 1% 12,242
State 6% 20% 64% 8% 1% 46,506
Speaking and listening School 0% 13% 87% 0% 0% 15
Network 0% 12% 82% 5% 0% 430
LGA 0% 6% 87% 6% 0% 62
Region 2% 16% 77% 5% 0% 12,222
State 4% 17% 75% 3% 0% 46,530
Number and algebra School 13% 13% 73% 0% 0% 15
Network 9% 24% 60% 7% 0% 429
LGA 5% 11% 79% 5% 0% 62
Region 9% 23% 61% 7% 0% 12,681
State 10% 25% 60% 5% 0% 48,503
Measurement and geometry School 0% 20% 80% 0% 0% 15
Network 1% 19% 76% 4% 0% 425
LGA 0% 10% 86% 3% 0% 58
Region 4% 18% 73% 5% 0% 12,673
State 5% 19% 72% 4% 0% 48,328
Statistics and probability School 0% 13% 87% 0% 0% 15
Network 1% 15% 80% 4% 0% 428
LGA 0% 10% 89% 2% 0% 62
Region 3% 17% 75% 4% 0% 12,571
State 4% 19% 73% 4% 0% 47,986
52 Confidential - Not for distribution

AUSVELS Teacher JudgementsSchool Murtoa College
Network West Grampians
Year 3 LGA Yarriambiack (S)
Region South-Western Victoria
Semester 2 - 2015 State Victoria
A B C D E Students
Reading and viewing School 27% 9% 55% 9% 0% 11
Network 8% 20% 59% 11% 2% 399
LGA 19% 11% 61% 7% 2% 57
Region 17% 24% 49% 8% 2% 11,963
State 18% 26% 48% 7% 1% 45,771
Writing School 9% 0% 82% 9% 0% 11
Network 6% 15% 63% 15% 2% 399
LGA 14% 9% 60% 14% 4% 57
Region 6% 17% 62% 13% 2% 11,964
State 7% 19% 61% 11% 2% 45,751
Speaking and listening School 0% 9% 91% 0% 0% 11
Network 2% 8% 84% 6% 0% 399
LGA 11% 12% 72% 5% 0% 57
Region 3% 15% 76% 5% 1% 11,933
State 4% 18% 73% 5% 1% 45,734
Number and algebra School 0% 0% 100% 0% 0% 11
Network 9% 19% 62% 9% 1% 400
LGA 16% 7% 60% 18% 0% 57
Region 9% 21% 60% 9% 1% 12,390
State 10% 23% 58% 8% 1% 47,417
Measurement and geometry School 0% 9% 91% 0% 0% 11
Network 3% 10% 81% 5% 1% 401
LGA 11% 14% 67% 9% 0% 57
Region 5% 17% 69% 8% 1% 12,365
State 7% 20% 66% 7% 1% 47,288
Statistics and probability School 0% 0% 100% 0% 0% 11
Network 2% 11% 80% 6% 1% 401
LGA 11% 12% 67% 11% 0% 57
Region 4% 16% 72% 7% 1% 12,166
State 6% 18% 69% 6% 1% 46,798
53 Confidential - Not for distribution

AUSVELS Teacher JudgementsSchool Murtoa College
Network West Grampians
Year 4 LGA Yarriambiack (S)
Region South-Western Victoria
Semester 2 - 2015 State Victoria
A B C D E Students
Reading and viewing School 43% 21% 14% 14% 7% 14
Network 11% 21% 50% 12% 5% 453
LGA 23% 23% 42% 9% 2% 64
Region 17% 24% 47% 10% 3% 11,571
State 18% 25% 47% 8% 2% 43,678
Writing School 21% 21% 36% 7% 14% 14
Network 4% 10% 63% 18% 5% 453
LGA 9% 20% 55% 13% 3% 64
Region 7% 16% 59% 14% 3% 11,575
State 8% 19% 58% 12% 3% 43,660
Speaking and listening School 0% 21% 71% 7% 0% 14
Network 0% 9% 81% 8% 1% 454
LGA 2% 13% 81% 5% 0% 64
Region 4% 14% 74% 7% 1% 11,541
State 5% 18% 70% 6% 1% 43,661
Number and algebra School 29% 7% 57% 7% 0% 14
Network 7% 19% 59% 13% 2% 448
LGA 13% 19% 56% 13% 0% 64
Region 9% 20% 57% 12% 2% 11,919
State 11% 21% 56% 10% 2% 45,075
Measurement and geometry School 0% 21% 64% 14% 0% 14
Network 5% 13% 69% 11% 2% 447
LGA 11% 17% 61% 11% 0% 64
Region 6% 18% 64% 10% 1% 11,805
State 8% 20% 62% 9% 1% 44,836
Statistics and probability School 0% 29% 64% 7% 0% 14
Network 4% 11% 73% 10% 2% 445
LGA 8% 13% 72% 8% 0% 64
Region 4% 16% 69% 9% 1% 11,699
State 6% 18% 66% 8% 1% 44,235
54 Confidential - Not for distribution

AUSVELS Teacher JudgementsSchool Murtoa College
Network West Grampians
Year 5 LGA Yarriambiack (S)
Region South-Western Victoria
Semester 2 - 2015 State Victoria
A B C D E Students
Reading and viewing School 10% 30% 60% 0% 0% 10
Network 5% 23% 53% 15% 4% 411
LGA 6% 19% 61% 15% 0% 54
Region 18% 21% 47% 11% 3% 10,838
State 19% 23% 46% 10% 3% 41,408
Writing School 0% 20% 70% 10% 0% 10
Network 3% 12% 62% 18% 5% 410
LGA 2% 11% 62% 19% 6% 53
Region 8% 16% 56% 16% 4% 10,805
State 9% 19% 56% 13% 4% 41,363
Speaking and listening School 0% 20% 80% 0% 0% 10
Network 1% 7% 81% 9% 2% 412
LGA 0% 9% 80% 9% 2% 54
Region 4% 16% 69% 9% 2% 10,785
State 6% 19% 67% 7% 1% 41,380
Number and algebra School 10% 30% 50% 10% 0% 10
Network 3% 20% 59% 16% 2% 411
LGA 4% 17% 57% 19% 4% 54
Region 11% 18% 53% 14% 3% 11,117
State 13% 20% 52% 12% 3% 42,532
Measurement and geometry School 0% 40% 60% 0% 0% 10
Network 2% 16% 65% 14% 3% 410
LGA 2% 15% 61% 20% 2% 54
Region 8% 17% 60% 12% 3% 11,038
State 10% 20% 58% 10% 2% 42,369
Statistics and probability School 0% 20% 80% 0% 0% 10
Network 1% 11% 72% 13% 2% 410
LGA 2% 7% 69% 19% 4% 54
Region 6% 15% 65% 12% 2% 10,947
State 8% 18% 62% 10% 2% 42,216
55 Confidential - Not for distribution

AUSVELS Teacher JudgementsSchool Murtoa College
Network West Grampians
Year 6 LGA Yarriambiack (S)
Region South-Western Victoria
Semester 2 - 2015 State Victoria
A B C D E Students
Reading and viewing School 0% 17% 67% 17% 0% 12
Network 8% 25% 49% 13% 4% 461
LGA 13% 15% 56% 15% 2% 62
Region 20% 21% 44% 11% 4% 10,762
State 21% 22% 44% 10% 3% 41,181
Writing School 0% 8% 83% 8% 0% 12
Network 4% 20% 53% 18% 6% 461
LGA 3% 16% 58% 16% 6% 62
Region 9% 18% 53% 15% 5% 10,769
State 11% 19% 53% 13% 4% 41,157
Speaking and listening School 0% 8% 92% 0% 0% 12
Network 2% 13% 75% 9% 2% 462
LGA 6% 6% 79% 6% 2% 63
Region 6% 18% 66% 8% 2% 10,743
State 8% 21% 62% 7% 2% 41,173
Number and algebra School 8% 8% 67% 17% 0% 12
Network 6% 18% 57% 14% 4% 467
LGA 3% 18% 57% 19% 3% 68
Region 12% 19% 50% 15% 4% 11,050
State 14% 20% 50% 13% 4% 42,174
Measurement and geometry School 0% 17% 67% 17% 0% 12
Network 5% 17% 61% 13% 4% 467
LGA 3% 16% 60% 18% 3% 68
Region 9% 18% 56% 13% 3% 10,986
State 11% 19% 55% 11% 3% 41,987
Statistics and probability School 0% 8% 75% 17% 0% 12
Network 3% 12% 67% 14% 3% 467
LGA 1% 12% 65% 19% 3% 68
Region 7% 17% 60% 13% 3% 10,882
State 9% 18% 59% 11% 3% 41,930
56 Confidential - Not for distribution

AUSVELS Teacher JudgementsSchool Murtoa College
Network West Grampians
Year 7 LGA Yarriambiack (S)
Region South-Western Victoria
Semester 2 - 2015 State Victoria
A B C D E Students
Reading and viewing School 3% 19% 61% 13% 3% 31
Network 9% 15% 62% 11% 2% 414
LGA 3% 10% 76% 10% 1% 72
Region 7% 14% 61% 13% 5% 8,709
State 8% 14% 63% 12% 4% 33,067
Writing School 6% 16% 61% 13% 3% 31
Network 7% 13% 63% 14% 3% 414
LGA 4% 11% 74% 10% 1% 72
Region 4% 13% 64% 15% 5% 8,714
State 5% 13% 65% 13% 4% 33,246
Speaking and listening School 6% 16% 61% 13% 3% 31
Network 7% 14% 69% 9% 2% 414
LGA 4% 10% 74% 11% 1% 72
Region 3% 12% 71% 11% 3% 8,707
State 5% 12% 71% 10% 3% 33,224
Number and algebra School 0% 13% 72% 13% 3% 32
Network 7% 16% 58% 15% 4% 417
LGA 1% 16% 68% 14% 1% 74
Region 5% 12% 60% 17% 6% 8,588
State 6% 12% 61% 15% 6% 33,750
Measurement and geometry School 0% 6% 81% 9% 3% 32
Network 9% 12% 59% 14% 5% 417
LGA 0% 15% 72% 12% 1% 74
Region 4% 10% 62% 17% 6% 8,834
State 6% 11% 63% 15% 5% 32,838
Statistics and probability School 0% 3% 91% 3% 3% 32
Network 5% 14% 63% 13% 5% 384
LGA 0% 5% 90% 2% 2% 42
Region 3% 11% 64% 15% 6% 8,006
State 5% 10% 66% 14% 5% 30,118
57 Confidential - Not for distribution

AUSVELS Teacher JudgementsSchool Murtoa College
Network West Grampians
Year 8 LGA Yarriambiack (S)
Region South-Western Victoria
Semester 2 - 2015 State Victoria
A B C D E Students
Reading and viewing School 11% 26% 52% 7% 4% 27
Network 6% 12% 59% 15% 8% 475
LGA 8% 14% 65% 11% 1% 71
Region 5% 13% 62% 15% 6% 8,475
State 7% 13% 61% 13% 5% 32,150
Writing School 7% 26% 52% 11% 4% 27
Network 3% 13% 56% 21% 7% 475
LGA 3% 14% 61% 21% 1% 71
Region 3% 11% 62% 17% 6% 8,476
State 5% 12% 62% 15% 5% 32,147
Speaking and listening School 7% 30% 52% 7% 4% 27
Network 3% 13% 63% 16% 5% 476
LGA 3% 13% 62% 21% 1% 71
Region 3% 9% 69% 15% 4% 8,462
State 4% 11% 69% 13% 3% 32,056
Number and algebra School 4% 11% 74% 11% 0% 27
Network 5% 11% 63% 16% 4% 473
LGA 3% 15% 76% 6% 0% 71
Region 5% 9% 59% 19% 7% 8,444
State 7% 11% 58% 18% 7% 32,816
Measurement and geometry School 4% 7% 78% 11% 0% 27
Network 5% 7% 70% 15% 3% 431
LGA 1% 4% 82% 13% 0% 71
Region 4% 8% 59% 21% 7% 7,915
State 7% 10% 59% 18% 7% 31,108
Statistics and probability School 4% 7% 78% 11% 0% 27
Network 6% 7% 66% 17% 4% 397
LGA 1% 10% 80% 8% 0% 71
Region 4% 8% 62% 18% 7% 8,446
State 6% 9% 62% 17% 6% 30,058
58 Confidential - Not for distribution

AUSVELS Teacher JudgementsSchool Murtoa College
Network West Grampians
Year 9 LGA Yarriambiack (S)
Region South-Western Victoria
Semester 2 - 2015 State Victoria
A B C D E Students
Reading and viewing School 7% 29% 32% 29% 4% 28
Network 2% 18% 57% 18% 5% 491
LGA 2% 16% 55% 23% 4% 83
Region 5% 13% 61% 15% 6% 8,396
State 7% 14% 60% 14% 5% 32,809
Writing School 7% 21% 36% 29% 7% 28
Network 3% 14% 59% 17% 8% 492
LGA 2% 13% 61% 17% 6% 83
Region 3% 11% 62% 17% 7% 8,393
State 6% 13% 61% 16% 5% 32,801
Speaking and listening School 18% 14% 29% 36% 4% 28
Network 3% 14% 61% 17% 5% 491
LGA 6% 12% 55% 25% 1% 83
Region 2% 11% 67% 15% 5% 8,191
State 5% 12% 66% 13% 4% 32,553
Number and algebra School 0% 10% 48% 31% 10% 29
Network 5% 12% 56% 21% 6% 487
LGA 0% 12% 60% 24% 5% 85
Region 4% 10% 56% 22% 9% 8,347
State 6% 11% 56% 20% 7% 33,288
Measurement and geometry School 0% 0% 62% 28% 10% 29
Network 3% 12% 61% 19% 6% 484
LGA 0% 12% 55% 26% 7% 85
Region 4% 9% 57% 21% 9% 8,250
State 6% 11% 57% 18% 7% 32,526
Statistics and probability School 0% 3% 62% 31% 3% 29
Network 2% 11% 66% 17% 4% 441
LGA 0% 4% 69% 23% 4% 81
Region 3% 8% 61% 20% 8% 7,902
State 5% 9% 60% 18% 7% 30,285
59 Confidential - Not for distribution

AUSVELS Teacher JudgementsSchool Murtoa College
Network West Grampians
Year 10 LGA Yarriambiack (S)
Region South-Western Victoria
Semester 2 - 2015 State Victoria
A B C D E Students
Reading and viewing School 3% 8% 68% 14% 8% 37
Network 2% 12% 64% 18% 4% 435
LGA 3% 9% 60% 20% 9% 80
Region 2% 11% 64% 18% 5% 8,157
State 4% 12% 64% 15% 4% 31,358
Writing School 5% 8% 59% 19% 8% 37
Network 2% 11% 64% 20% 4% 451
LGA 3% 6% 61% 21% 9% 80
Region 2% 9% 63% 20% 6% 8,159
State 3% 11% 63% 17% 5% 31,373
Speaking and listening School 3% 5% 68% 14% 11% 37
Network 2% 10% 69% 15% 4% 452
LGA 1% 4% 72% 12% 11% 81
Region 2% 9% 68% 17% 5% 8,101
State 4% 11% 66% 15% 4% 31,033
Number and algebra School 8% 17% 42% 31% 3% 36
Network 3% 6% 55% 30% 6% 417
LGA 8% 9% 63% 17% 4% 78
Region 3% 7% 54% 26% 10% 8,248
State 4% 10% 56% 22% 8% 31,591
Measurement and geometry School 8% 17% 50% 19% 6% 36
Network 2% 10% 57% 26% 5% 360
LGA 6% 10% 64% 14% 5% 77
Region 3% 7% 56% 24% 9% 7,904
State 4% 9% 57% 22% 8% 29,893
Statistics and probability School 8% 8% 53% 28% 3% 36
Network 1% 8% 65% 23% 3% 349
LGA 4% 8% 60% 26% 3% 77
Region 2% 6% 57% 24% 10% 7,816
State 3% 8% 60% 21% 8% 29,445
60 Confidential - Not for distribution

Victorian Certificate of Education (VCE)
School Murtoa College 16
Network West Grampians 280
LGA Yarriambiack (S) 35
Region South-Western Victoria 6,271
State Victoria 25,141
VCE Completion - 2012 to 2015
All Study - Mean VCE Study Score - 2012 to 2015
No of Students who
completed VCE in 2015
2012 2013 2014 2015
Network 97.7% 99.0% 96.3% 96.2%
LGA 100.0% 98.4% 96.6% 97.2%
Region 96.4% 96.9% 96.4% 96.4%
State 96.7% 96.9% 96.9% 96.8%
School 100.0% 100.0% 100.0% 100.0%
50%
60%
70%
80%
90%
100%
2012 2013 2014 2015
Network 29.2 28.7 28.4 28.7
LGA 28.3 29.7 28.5 30.9
Region 27.9 28.0 27.9 28.0
State 28.7 28.7 28.7 28.7
School 29.3 31.3 30.7 30.8
0
5
10
15
20
25
30
35
61 Confidential - Not for distribution

Victorian Certificate of Education (VCE) No of Students who completed Subject in 2015
English Further Maths
School Murtoa College 17 15
Network West Grampians 258 207
LGA Yarriambiack (S) 36 35
Region South-Western Victoria 4,938 3,525
State Victoria 19,588 14,164
English - Mean VCE Study Score - 2012 to 2015
Further Mathematics - Mean VCE Study Score - 2012 to 2015
2012 2013 2014 2015
Network 27.67 27.89 27.45 27.19
LGA 26.77 29.75 27.55 28.97
Region 27.29 27.51 27.31 27.31
State 28.11 28.15 28.22 28.19
School 30.26 33.28 29.75 29.65
0
5
10
15
20
25
30
35
2012 2013 2014 2015
Network 28.60 28.40 28.44 28.05
LGA 26.78 27.68 30.58 32.46
Region 27.87 27.81 27.97 28.09
State 28.58 28.63 28.66 28.57
School 27.38 27.54 32.08 30.40
0
5
10
15
20
25
30
35
62 Confidential - Not for distribution

No of Students who completed Subject in 2015 Victorian Certificate of Education (VCE) No of Students who completed Subject in 2015
Maths Methods (CAS) Specialist Maths
School Murtoa College 3 2
Network West Grampians 61 16
LGA Yarriambiack (S) 8 2
Region South-Western Victoria 1,587 498
State Victoria 7,321 2,329
Mathematical Methods (CAS) - Mean VCE Study Score - 2012 to 2015
Specialist Mathematics - Mean VCE Study Score - 2012 to 2015
2012 2013 2014 2015
Network 26.86 25.53 27.26 27.90
LGA 24.90 25.77 22.60 31.00
Region 27.80 27.84 28.11 28.10
State 29.05 29.21 29.37 29.36
School 25.75 24.22 22.00 35.00
0
5
10
15
20
25
30
35
2012 2013 2014 2015
Network 24.96 24.39 24.78 30.00
LGA 20.00 24.00 20.50 32.50
Region 26.65 27.59 27.81 27.17
State 28.82 29.25 29.52 29.47
School 19.00 0.00 0.00 32.50
0
5
10
15
20
25
30
35
63 Confidential - Not for distribution

VCE Mean Score - GAT Predicted Score vs Actual VCE ScoreEnglish 2015
Network: West Grampians
School: Murtoa College
Mean Score for School 2014
Murtoa College Predicted Actual Difference
English 30.29 32.21 1.92
0
10
20
30
40
50
0 10 20 30 40 50
Actual
Predicted
English Region School
0
10
20
30
40
50
0 10 20 30 40 50
Actual
Predicted
English Region Network
64 Confidential - Not for distribution

VCE Mean Score - GAT Predicted Score vs Actual VCE ScoreFurther Mathematics 2015
Network: West Grampians
School: Murtoa College
Mean Score for School 2014
Murtoa College Predicted Actual Difference
Further Mathematics 28.36 32.08 3.72
0
10
20
30
40
50
0 10 20 30 40 50
Actual
Predicted
Further Mathematics Region Network
0
10
20
30
40
50
0 10 20 30 40 50
Actual
Predicted
Further Mathematics Region School
65 Confidential - Not for distribution

VCE Mean Score - GAT Predicted Score vs Actual VCE ScoreMathematical Methods 2015
Network: West Grampians
School: Murtoa College
Mean Score for School 2014
Murtoa College Predicted Actual Difference
Mathematical Methods
0
10
20
30
40
50
0 10 20 30 40 50
Actual
Predicted
Mathematical Methods Region Network
0
10
20
30
40
50
0 10 20 30 40 50
Actual
Predicted
Mathematical Methods Region School
66 Confidential - Not for distribution

Victorian Certificate of Applied Learning (VCAL)
School Murtoa College 9
Network West Grampians 142
LGA Yarriambiack (S) 22
Region South-Western Victoria 2,209
State Victoria 8,317
VCAL Completion - 2012 to 2015
Vocational Education and Training (VET)
School Murtoa College 3
Network West Grampians 95
LGA Yarriambiack (S) 9
Region South-Western Victoria 2,129
State Victoria 7,463
VET Completion - 2012 to 2015
No of Students who
completed VCAL in 2015
No of VCE Students who completed at
least one VET certificate 2015
2012 2013 2014 2015
Network 36.7% 36.9% 38.0% 37.1%
LGA 34.0% 49.0% 57.5% 36.7%
Region 52.0% 56.2% 56.4% 55.8%
State 53.4% 56.0% 57.8% 56.9%
School 66.7% 66.7% 63.6% 52.9%
0%
20%
40%
60%
80%
100%
2012 2013 2014 2015
Network 33.8% 28.6% 30.6% 33.9%
LGA 47.4% 31.7% 24.6% 25.7%
Region 36.9% 37.2% 33.3% 33.9%
State 33.4% 34.3% 29.5% 29.7%
School 21.7% 24.0% 58.3% 18.8%
0%
20%
40%
60%
80%
100%
67 Confidential - Not for distribution

VET Certificates offered by SchoolMurtoa College
2015
VET Certificate
Certificate II in Automotive Studies (Pre-vocational)
Certificate II in Building and Construction
Certificate II in Community Services
Certificate II in Engineering
Certificate II in Engineering Studies
Certificate II in Furniture Making
Certificate II in Hairdressing
Certificate II in Kitchen Operations
Certificate II in Plumbing (Pre-Apprenticeship)
Certificate II in Retail Make-up & Skin Care
Certificate III in Carpentry
Certificate III in Catering Operations
68 Confidential - Not for distribution

Expulsion Data
2014 2015 2014 2015 2014 2015 2014 2015
Expulsions 1 1 64 63
Male 1 1 50 52
Female 14 11
Expulsion Details
Out of Home Care 4 2
Koorie 5 1
PSD 12 5
Appeals Denied 10 4
Appeals Upheld 1
Expulsion by Year Level
Prep
Year 1 1 1
Year 2
Year 3 1 1
Year 4 3 2
Year 5 2
Year 6 3 2
Year 7 7 11
Year 8 19 9
Year 9 1 1 16 17
Year 10 4 10
Year 11 9 6
Year 12 1
Ungraded 2
Total 1 1 64 63
School Network LGA Region
69 Confidential - Not for distribution

Attitudes to School Survey Participants
2015 School Murtoa College 20
Network West Grampians 870
Primary Students LGA Yarriambiack (S) 122
Region South-Western Victoria 20,707
State Victoria 79,980
Student Relationships Wellbeing
Teaching and Learning
ClassroomBehaviour
Connectedness toPeers
Student Safety
Network 3.1 4.2 4.3
LGA 3.0 4.1 4.0
Region 3.3 4.3 4.3
State 3.4 4.3 4.4
School 3.4 4.0 4.2
0.0
1.0
2.0
3.0
4.0
5.0
Student Distress Student Morale
Network 5.9 5.7
LGA 5.5 5.4
Region 5.9 5.7
State 6.0 5.7
School 5.4 5.5
0.0
1.0
2.0
3.0
4.0
5.0
6.0
7.0
Learning ConfidenceSchool
ConnectednessStimulating Learning Student Motivation
TeacherEffectiveness
Teacher Empathy
Network 4.0 4.4 4.1 4.5 4.4 4.4
LGA 3.9 4.2 4.0 4.3 4.2 4.3
Region 4.1 4.4 4.1 4.6 4.4 4.4
State 4.1 4.4 4.1 4.6 4.4 4.4
School 3.8 4.2 4.0 4.5 4.3 4.3
0.0
1.0
2.0
3.0
4.0
5.0
70 Confidential - Not for distribution

Attitudes to School Survey Participants
2015 School Murtoa College 166
Network West Grampians 2,421
Secondary Students LGA Yarriambiack (S) 371
Region South-Western Victoria 47,086
State Victoria 176,013
Student Relationships Wellbeing
Teaching and Learning
Learning ConfidenceSchool
ConnectednessStimulating Learning Student Motivation
TeacherEffectiveness
Teacher Empathy
Network 3.7 3.6 3.2 4.2 3.7 3.7
LGA 3.7 3.6 3.2 4.2 3.7 3.8
Region 3.7 3.6 3.2 4.3 3.7 3.7
State 3.7 3.6 3.2 4.2 3.6 3.6
School 3.7 3.7 3.2 4.2 3.8 3.9
0.0
1.0
2.0
3.0
4.0
5.0
ClassroomBehaviour
Connectedness toPeers
Student Safety
Network 3.1 4.0 4.3
LGA 3.2 4.0 4.4
Region 3.1 4.0 4.3
State 3.1 4.0 4.3
School 3.4 4.0 4.5
0.0
1.0
2.0
3.0
4.0
5.0
Student Distress Student Morale
Network 5.2 4.8
LGA 5.2 4.8
Region 5.2 4.7
State 5.1 4.7
School 5.4 4.9
0.0
1.0
2.0
3.0
4.0
5.0
6.0
7.0
71 Confidential - Not for distribution

School Staff Survey2015 School Murtoa College
Network West Grampians
Summary of Module Component Means LGA Yarriambiack (S)
Region South-Western Victoria
State Victoria
All Staff
Principal and Teachers Only
OverallScore
Academicemphasis
Collectiveefficacy
Collectivefocus onstudentlearning
Collectiveresponsibili
ty
Guaranteed andviable
curriculum
Parent andcommunityinvolveme
nt
Shielding/Buffering
Staff trustin
colleagues
Teachercollaborati
on
Trust instudents
andparents
Network 73.2 67.3 71.7 79.5 79.6 72.0 74.5 67.1 76.4 73.4 70.0
LGA 73.8 69.7 74.2 79.0 79.2 70.6 74.5 64.9 77.6 75.1 73.1
Region 73.4 68.9 72.5 80.8 80.7 74.6 73.1 66.1 76.8 70.6 69.9
State 74.3 70.1 74.0 80.9 81.5 75.0 74.8 66.4 77.9 70.9 71.3
School 65.7 66.7 70.4 70.6 72.2 60.4 67.5 51.8 67.1 60.2 69.8
0
20
40
60
80
100
All Staff
OverallScore
Academicemphasis
Collectiveefficacy
Collectivefocus onstudentlearning
Collectiveresponsibili
ty
Guaranteed andviable
curriculum
Parent andcommunityinvolveme
nt
Shielding/Buffering
Staff trustin
colleagues
Teachercollaborati
on
Trust instudents
andparents
Network 73.2 67.4 71.7 79.5 79.9 71.6 73.6 67.3 76.8 73.0 70.8
LGA 73.6 69.6 73.6 78.9 79.5 69.9 73.6 64.9 78.0 74.6 73.4
Region 73.5 69.4 72.8 81.0 81.1 74.2 72.2 66.0 77.2 69.9 70.7
State 74.3 70.5 74.4 81.0 81.9 74.7 74.0 66.3 78.2 70.3 72.0
School 65.3 65.8 69.7 70.8 72.8 58.9 66.4 51.0 69.7 58.4 69.4
0
20
40
60
80
100
Principal and Teachers
72 Confidential - Not for distribution

Parent Opinion Survey2015 School Murtoa College
Network West Grampians
Mean Factor Scores LGA Yarriambiack (S)
Region South-Western Victoria
State Victoria
School Climate
Student Behaviour Student Engagement
Approachability
BehaviourManagem
ent
Extra-Curricula
GeneralSatisfactio
n
Homework
LearningFocus
ParentInput
ReportingSchool
Improvement
Stimulating Learning
TeacherMorale
Transitions
Network 5.61 5.21 5.06 5.72 5.05 5.63 5.43 5.45 5.58 5.56 5.61 5.65
LGA 5.82 5.40 5.12 5.78 5.31 5.72 5.66 5.75 5.76 5.80 5.84 5.76
Region 5.74 5.45 4.99 5.87 5.16 5.72 5.34 5.55 5.66 5.76 5.79 5.78
State 5.73 5.46 5.03 5.86 5.11 5.72 5.35 5.54 5.64 5.75 5.80 5.78
School 5.51 5.54 5.08 5.69 4.83 5.57 5.00 4.82 5.57 5.58 5.75 5.57
0
1
2
3
4
5
6
7
School Climate
ClassroomBehaviour
Student Safety
Network 4.12 5.35
LGA 4.37 5.48
Region 4.25 5.48
State 4.25 5.47
School 4.58 5.70
0
1
2
3
4
5
6
7
Student Behaviour
Connectednessto Peers
SchoolConnectedness
Social SkillsStudent
Motivation
Network 5.75 5.58 5.70 5.38
LGA 5.84 5.69 5.84 5.59
Region 5.85 5.78 5.73 5.60
State 5.85 5.76 5.71 5.58
School 5.84 5.22 5.71 5.07
0
1
2
3
4
5
6
7
Student Engagement
73 Confidential - Not for distribution
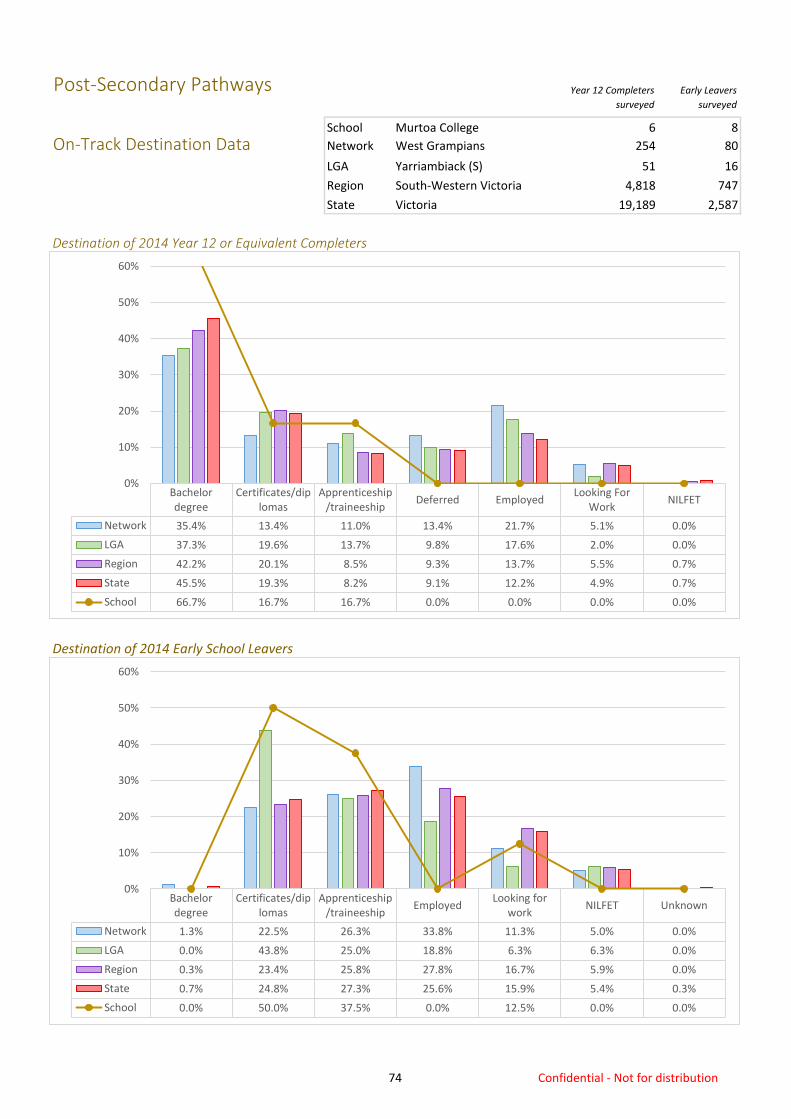
Post-Secondary Pathways
School Murtoa College 6 8
On-Track Destination Data Network West Grampians 254 80
LGA Yarriambiack (S) 51 16
Region South-Western Victoria 4,818 747
State Victoria 19,189 2,587
Destination of 2014 Year 12 or Equivalent Completers
Destination of 2014 Early School Leavers
Year 12 Completers
surveyed
Early Leavers
surveyed
Bachelordegree
Certificates/diplomas
Apprenticeship/traineeship
Deferred EmployedLooking For
WorkNILFET
Network 35.4% 13.4% 11.0% 13.4% 21.7% 5.1% 0.0%
LGA 37.3% 19.6% 13.7% 9.8% 17.6% 2.0% 0.0%
Region 42.2% 20.1% 8.5% 9.3% 13.7% 5.5% 0.7%
State 45.5% 19.3% 8.2% 9.1% 12.2% 4.9% 0.7%
School 66.7% 16.7% 16.7% 0.0% 0.0% 0.0% 0.0%
0%
10%
20%
30%
40%
50%
60%
Bachelordegree
Certificates/diplomas
Apprenticeship/traineeship
EmployedLooking for
workNILFET Unknown
Network 1.3% 22.5% 26.3% 33.8% 11.3% 5.0% 0.0%
LGA 0.0% 43.8% 25.0% 18.8% 6.3% 6.3% 0.0%
Region 0.3% 23.4% 25.8% 27.8% 16.7% 5.9% 0.0%
State 0.7% 24.8% 27.3% 25.6% 15.9% 5.4% 0.3%
School 0.0% 50.0% 37.5% 0.0% 12.5% 0.0% 0.0%
0%
10%
20%
30%
40%
50%
60%
74 Confidential - Not for distribution

Appendix - Data Set Definitions
Student Family Occupation (SFO)
Special Schools are included in the SFO median calculations for Network, LGA, Region and State
Student Family Education (SFE)
SFE calculation:
(Number of students x weighting for each educational category) / Total number of students)
Student Family Occupation Education (SFOE)
SFOE calculation: (SFO index + SFE index) / 2
Student Enrolment Projections
This data set utilises the Demographic Demand Forecast (DDF) which provides the forecast number of
students expected to live in a school’s catchment area.
Attendance Rates
Attendance rate is calculated on the number of actual full-time equivalent student-days attended by full-
time students in Years 1 to 12 as a percentage of the total number of possible student-days attended over
semester 1. Please note: This definition differs for the data published by ACARA on the 'My School' website
where attendance is calculated for Year 1 to Year 10 over the full school year.
Real Retention Rates (Secondary Students)
Proportion of Actual Students who remain from enrolled in the same school from X number of years
earlier.
Apparent Retention Rates (Secondary Students)
Enrolments expressed as a proportion of enrolments from X years earlier, for example: ARR Years 10-12 for
2014 = Year 12 enrolments in 2014 / Year 10 enrolments in 2012.
The term "apparent" retention rate reflects that retention rates are influenced by factors not taken into account by this measure such as:
students repeating year levels;
interstate and overseas migration;
transfer of students between education sectors or schools;
students who have left school previously, returning to continue their school education.
AEDI – Australian Early Development Index
The Australian Early Development Index (AEDI) is a set of measures about how children are developing in five different areas. These are:
physical health and wellbeing
social competence
emotional maturity
language and cognitive skills
communication skills and general knowledge. The data gives a national picture of children's health and development. The results pinpoint strengths in the community as well what can be improved.
75 Confidential - Not for distribution

Kindergarten Enrolments
Number of children attending their first year of state funded kindergarten program for children in the year
prior to school plus the number of children in an approved second year of state funded kindergarten.
Children are only approved for a second year of state funded kindergarten following an assessment by the
teacher that the child has delays in at least two areas of development and would benefit from a second
year of kindergarten.
ATSI Participation Rates
The number of enrolled children identified as being of Aboriginal and/or Torres Strait Islander origin and
their enrolment in kindergarten and prep.
or High. State benchmarks are 25% of students are expected to have low growth, 50% expected to have
medium growth and 25% are expected to have high growth.
Kindergarten Developmental Delays
Number of children attending a funded kindergarten program who have a continuing disability (including
intellectual, sensory or physical impairment) or developmental delay and may require assistance
(compared to children of a similar age) in one or more of the following areas: communication, mobility,
self-care, cognitive, interpersonal interactions, everyday tasks and routines.
English Online Interview (Primary Students)
English Online Interview (EOI) is an online tool for assessing the English skills of students in Prep. The
Interview assesses students across the three modes of English in AusVELS (the Australian Curriculum in
Victoria) – Reading, Writing and Speaking and Listening. The English Online Interview is a one-to-one
interview between a teacher and student, using texts and downloadable resources designed specifically
for the Interview. This data is used to generate reports that provide a point-in-time overview of student
achievement and valuable diagnostic information to inform program planning and resource allocation.
Naplan Top 3 Bands, Bottom 3 Bands
Top 3 bands, bottom 3 bands was a new performance threshold used in 2014. It aggregates the Naplan
bands in to two groups – the Top 3 Bands and the Bottom 3 bands, those in the bottom 3 bands are
deemed to not be meeting expected performance standards.
Naplan Bands
Results from each year level are assessed into six (6) bands. Results in the bottom band are considered
below the National Minimum Standard (NMS). Results in the second from bottom band are considered at
the National Minimum Standard (NMS). The remaining bands are progressively above than the NMS.
Naplan Relative Growth
Categorises the growth students make in an area of study over a 2 year period as Low, Medium or High.
State benchmarks are 25% of students are expected to have low growth, 50% expected to have medium
growth and 25% are expected to have high growth.
AUSVELS Teacher Judgments
Assessment and reporting of students graded from A to E standard against VELS
76 Confidential - Not for distribution

VCE Completion
The number of students eligible to complete VCE, number of students who satisfactorily completed VCE
and the percentage of VCE completion.
VCE Unit Score (including All Study Score)
Average student score is calculated as: Sum of student scores / No of students
VCAL Completion
This report provides a detailed breakdown of the number of students enrolled in VCAL, the number and
percentage of students who completed VCAL.
VET Completion
Data sourced by NCVER from the National VET in Schools Collection provides information on vocational
education and training (VET) undertaken by school students as part of their senior secondary certificate,
known as ‘VET in Schools’. The VET in Schools arrangement offers two main options. Students can
undertake school-based apprenticeships and traineeships or VET subjects and courses (the latter are
referred to as ‘other VET in Schools programs’). Completion rates refer to the equivalent VCE Units
GAT Predicted VCE Score
The predicted scores are produced by VCAA on the basis of: a student’s GAT scores, gender and average
GAT scores for students in the particular study in the school.
The model does not take into account any contextual information about individual schools or students. As
a result caution must be exercised in interpreting the above information otherwise erroneous conclusions
could be drawn.
On-Track Destination Data
On Track is a large scale survey run by the Victorian government to monitor the post-school destination
outcomes of Year 12 completers and early school leavers across Victoria. On Track ensures that Year 10 to
12 students from government and non-government schools are contacted six months after leaving school
to see if they are on a pathway to further education, training or employment. It also enables young people
to seek further advice and assistance via a referral service to help them achieve their education and
employment goals.
Attitude to School Survey
Primary School Data is obtained from students in Years 5-6.
Secondary School Data is obtained from Students in Year 7-12
77 Confidential - Not for distribution