Scatter plots/Correlation and Interpreting Graphs Week 19 December 9, 2013 (M) December 10, 2013 (T)
17
Scatter plots/Correlation and Interpreting Graphs Week 19 December 9, 2013 (M) December 10, 2013 (T)
-
Upload
robert-clarke -
Category
Documents
-
view
220 -
download
1
Transcript of Scatter plots/Correlation and Interpreting Graphs Week 19 December 9, 2013 (M) December 10, 2013 (T)
Scatter plots/Correlation and Interpreting Graphs
Week 19December 9, 2013 (M)December 10, 2013 (T)
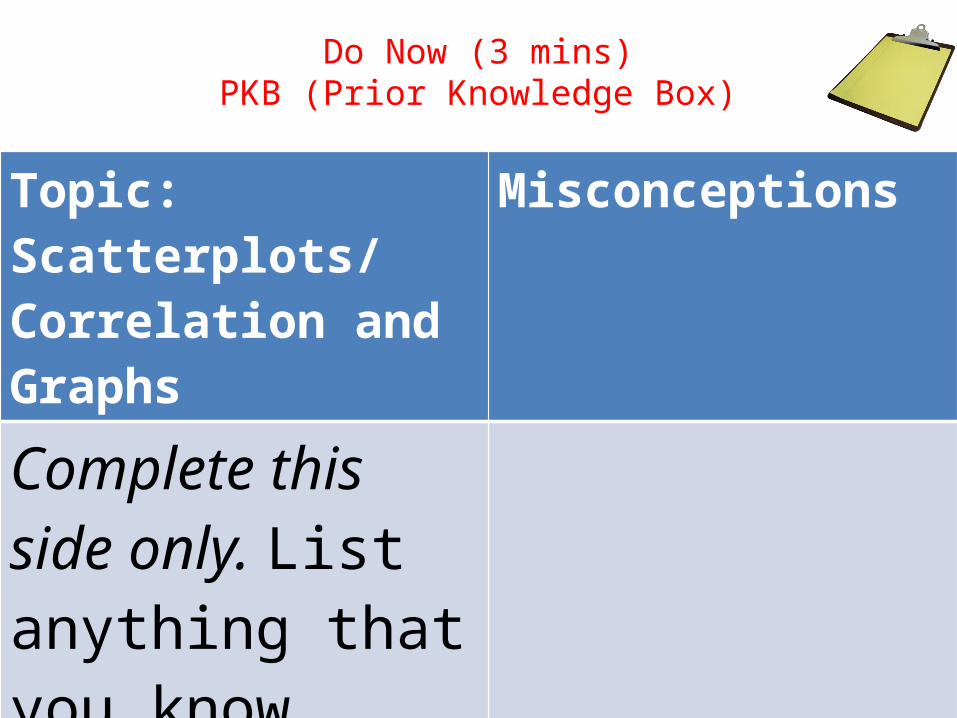
Do Now (3 mins)PKB (Prior Knowledge Box)
Topic: Scatterplots/ Correlation and Graphs
Misconceptions
Complete this side only. List anything that you know about the above topic.
STANDARDS7SDAP 1.1: Know various forms of display for ________; use the forms to _______ a single set of data or to ________ two sets of data.7SDAP 1.2: Represent two numerical __________ on a scatterplot and informally describe how the data points are distributed and any apparent ___________ that exists between the ____ variables (e.g., between time spent on homework and grade level).
OBJECTIVES1. Huskies will be able to _________ from
different displays of data, including scatterplots by __________the relationship of two variables.
2. Huskies will be able to ________ scatterplots by ___________ the data given.
3. Students will show a mastery by earning a 3 out of 4 (proficiency) on the exit slip.
VOCABULARY• Scatterplot- A graph that shows the
relationship between two _________.
VOCABULARY (cont.)• Positive Correlation- As one measurement
(x) _________, the other measurement (y) __________.
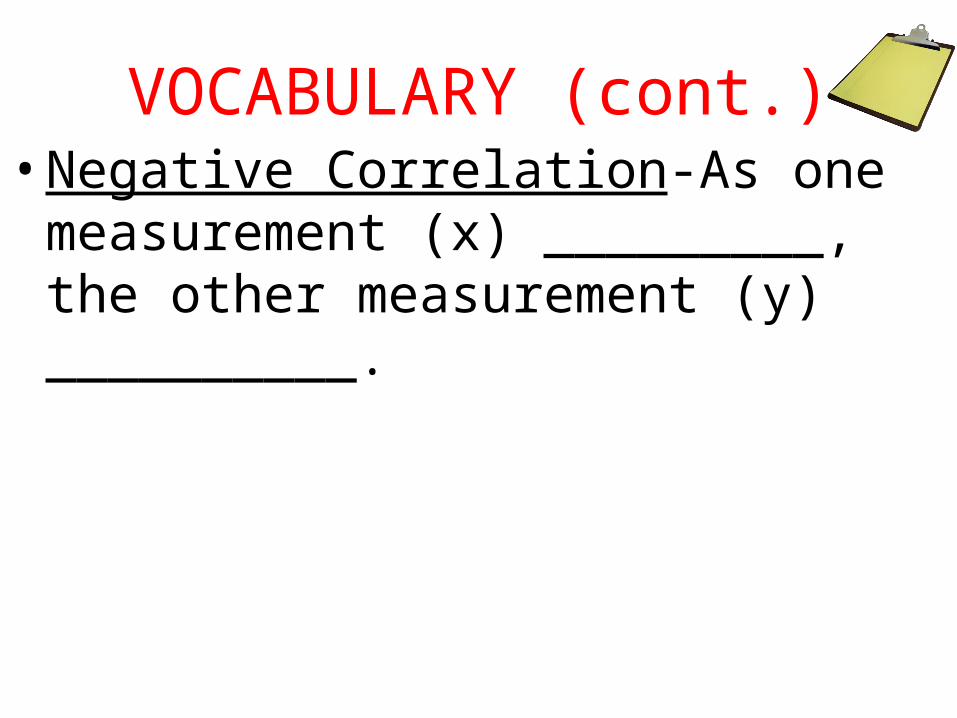
VOCABULARY (cont.)• Negative Correlation-As one measurement
(x) _________, the other measurement (y) __________.
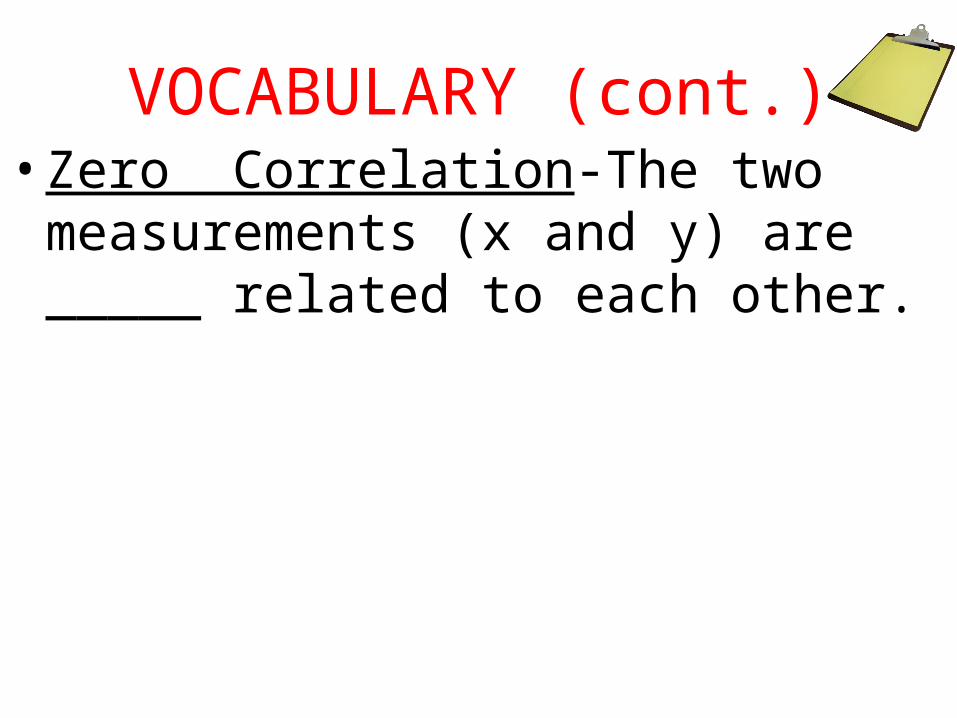
VOCABULARY (cont.)• Zero Correlation-The two measurements
(x and y) are _____ related to each other.
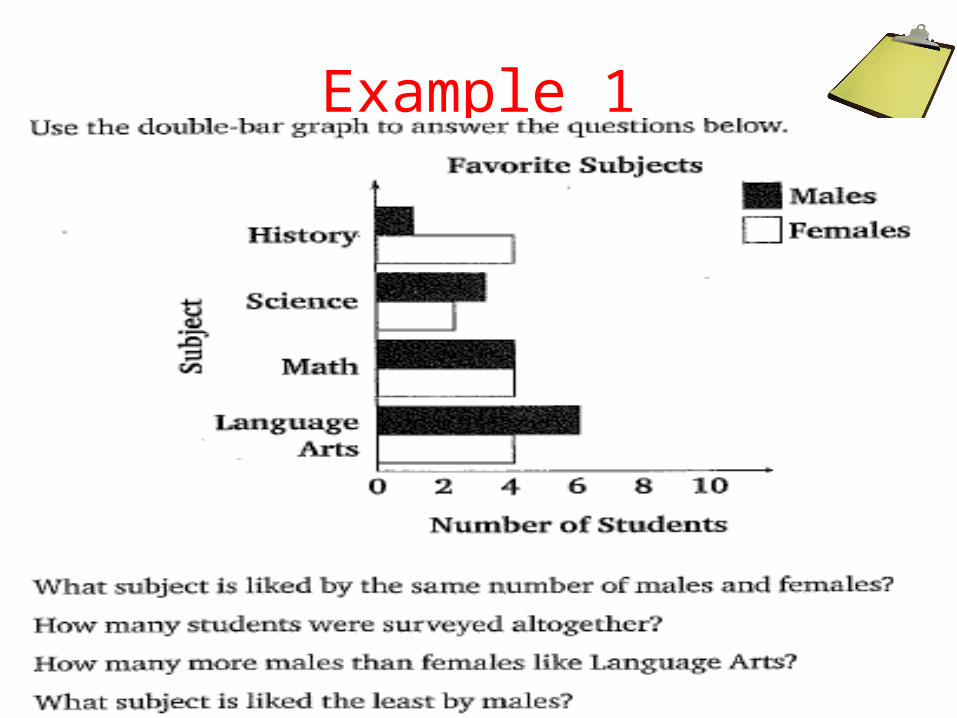
Example 1
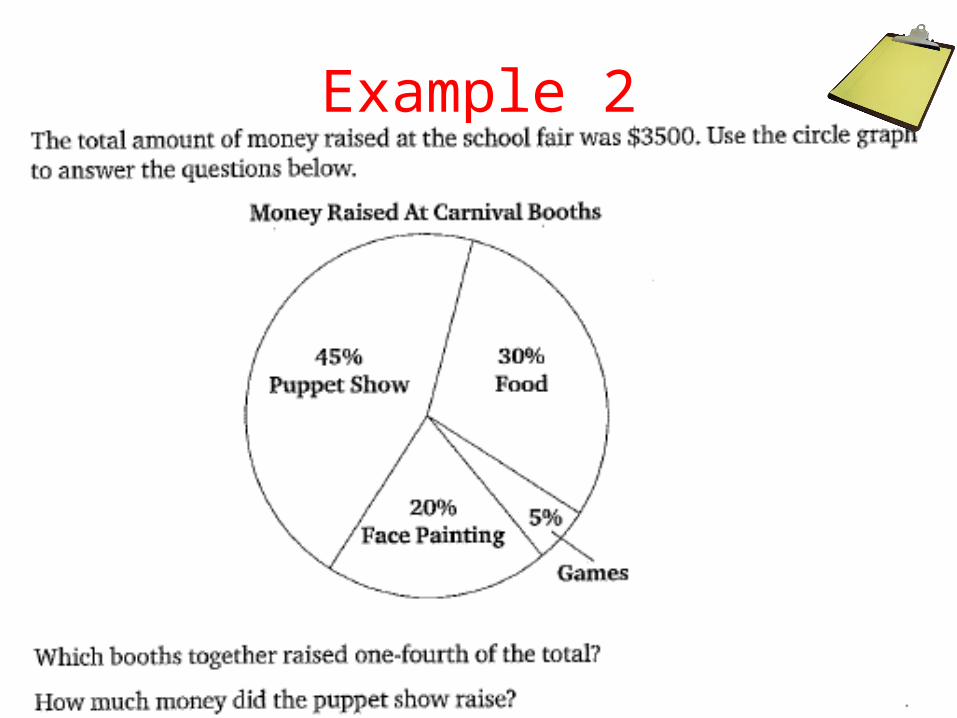
Example 2
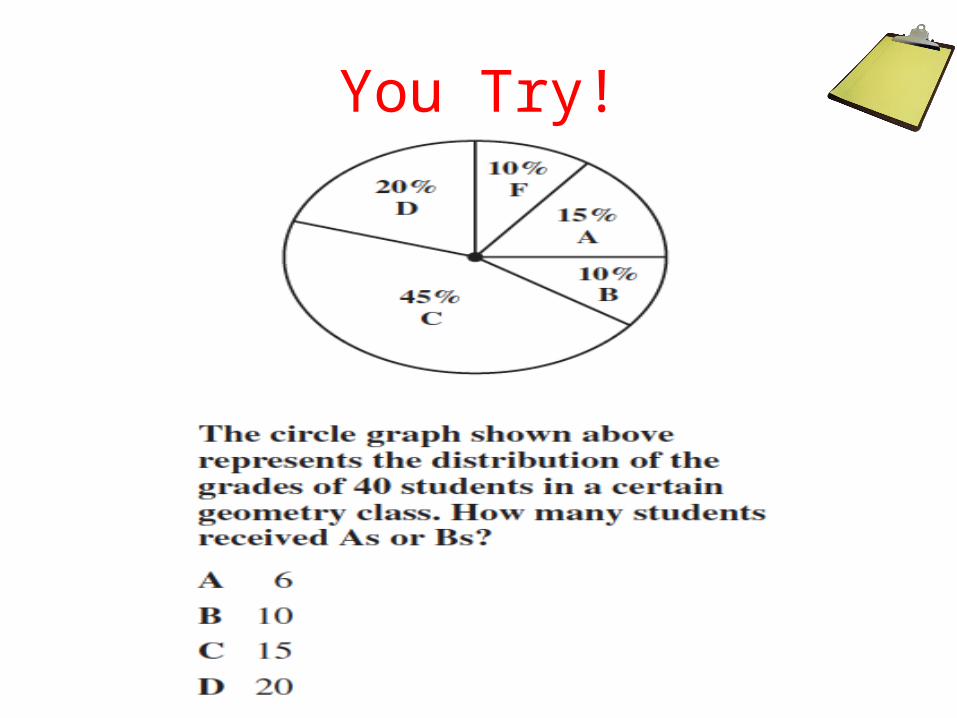
You Try!
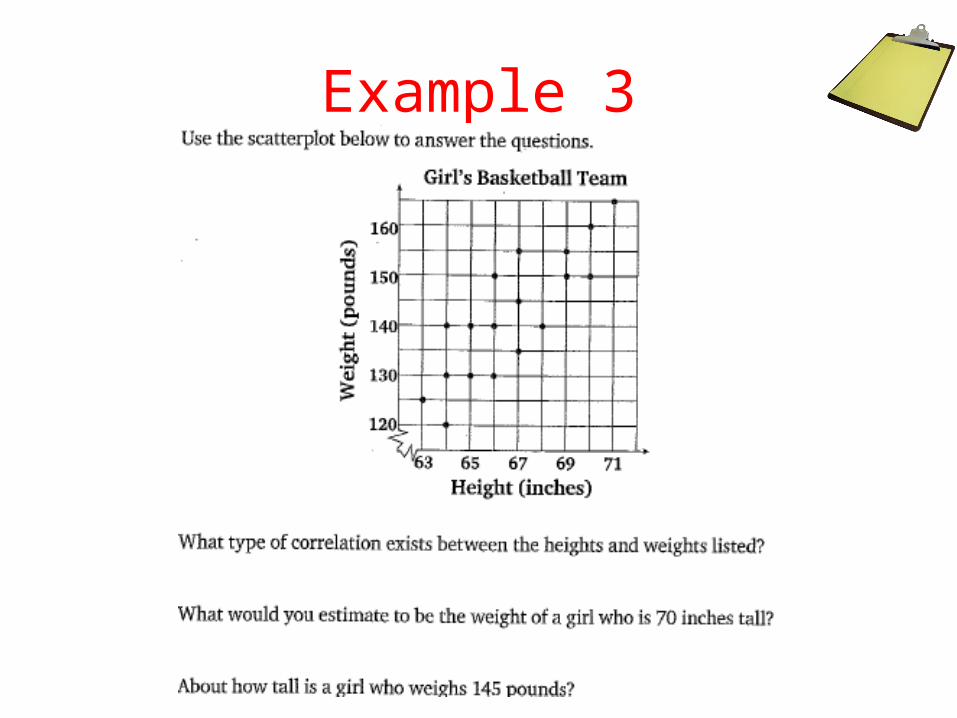
Example 3
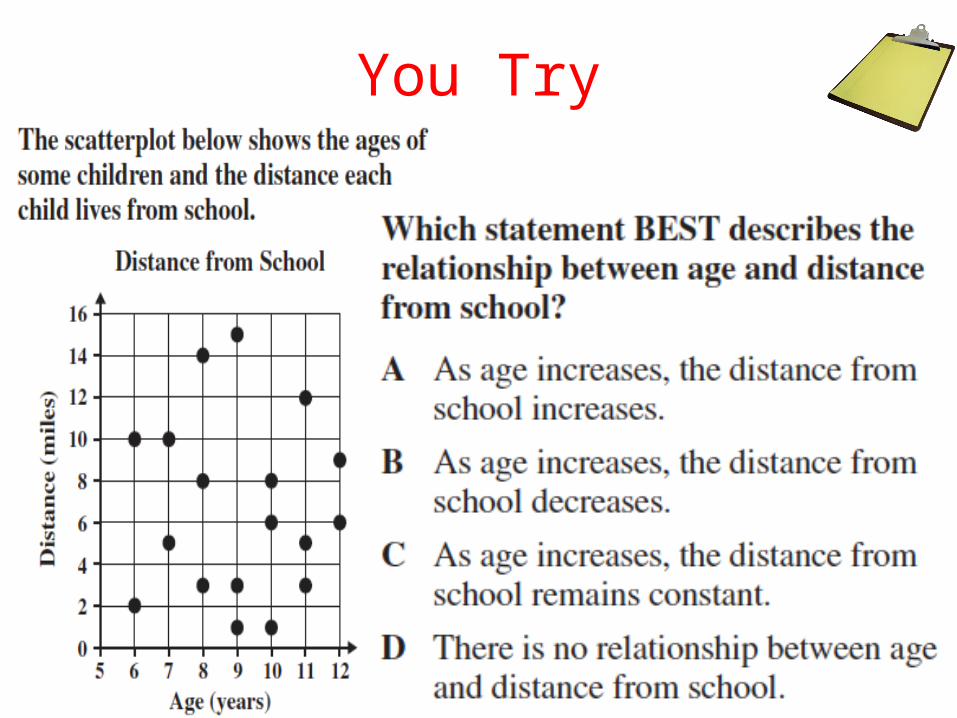
You Try
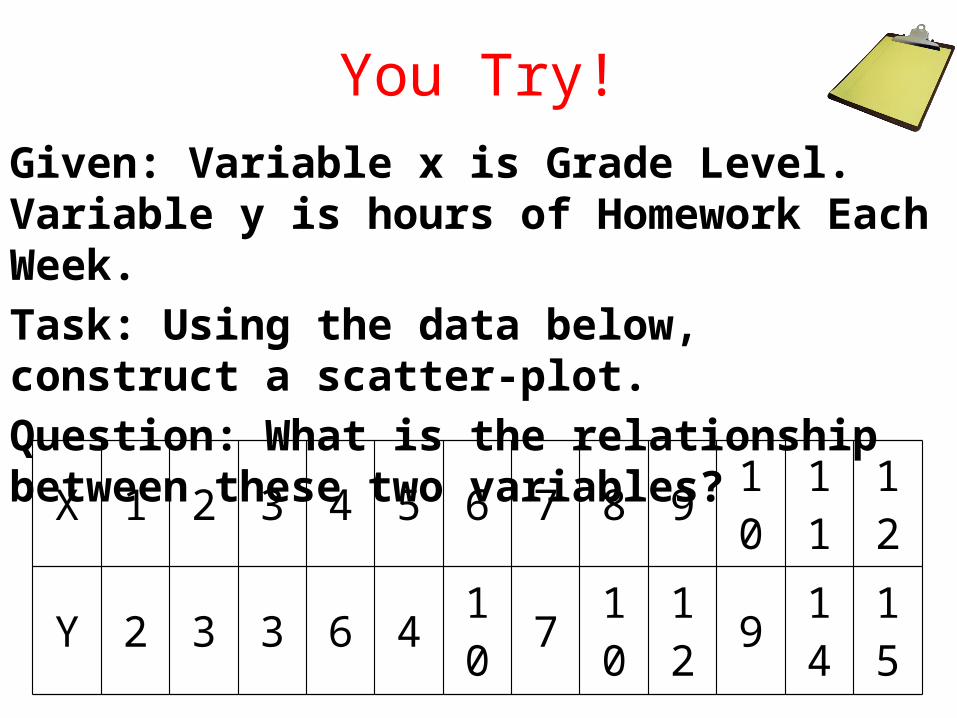
You Try!Given: Variable x is Grade Level. Variable y is hours of Homework Each Week.Task: Using the data below, construct a scatter-plot.Question: What is the relationship between these two variables?
X 1 2 3 4 5 6 7 8 9 10 11 12
Y 2 3 3 6 4 10 7 10 12 9 14 15
Prior Knowledge Box (PKB)Topic: Scatterplots/ Correlation and Graphs
Misconceptions
What did you think you knew but you found out was a misconception? If you didn’t have any prior knowledge, what did you learn/ review today?
Agenda
Homework- Who Makes Rainwater Mix with Dirt? (Worksheet)Bring Your Expo Pen to class.(DUE: P.1,3,5- Mondays and Thursday. P.2,4,6- Tuesdays and Fridays)
Culminating Project
Due December 13, 2013