Scatter Plot
8
Scatter Plot Example of data scattering between groups in experiment.
-
Upload
hollee-mcneil -
Category
Documents
-
view
30 -
download
0
description
Scatter Plot. Example of data scattering between groups in experiment. Scatter Plot. Example of data scattering within groups in experiment. Gene Profiles. Gene profile on raw Signal data. Gene Profiles. Gene profile on logged Signal data. Gene Profiles. - PowerPoint PPT Presentation
Transcript of Scatter Plot
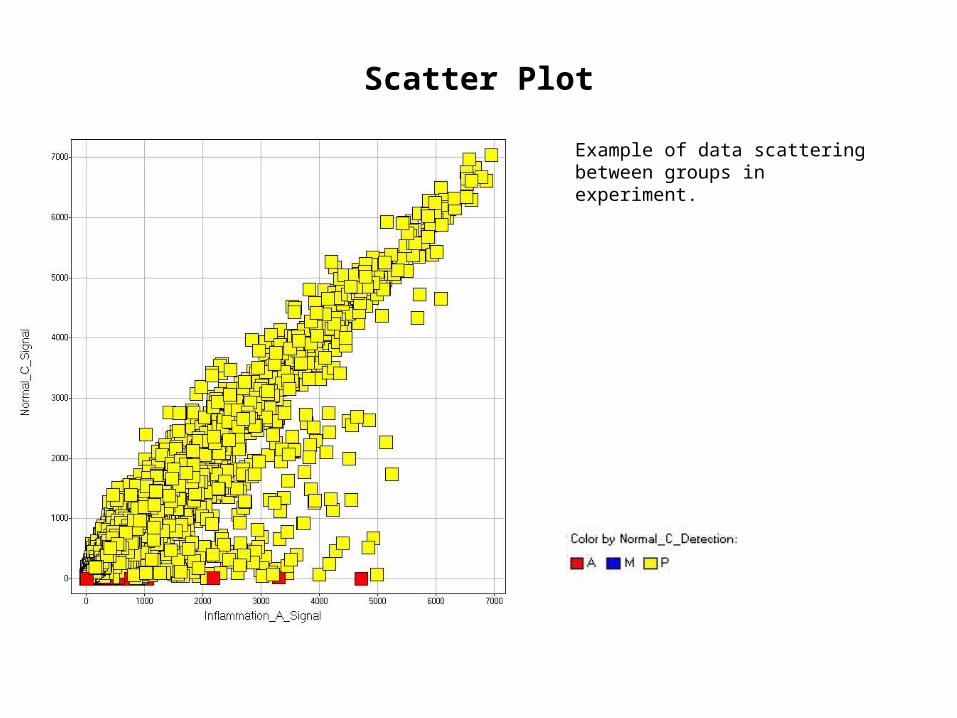
Scatter Plot
Example of data scattering between groups in experiment.
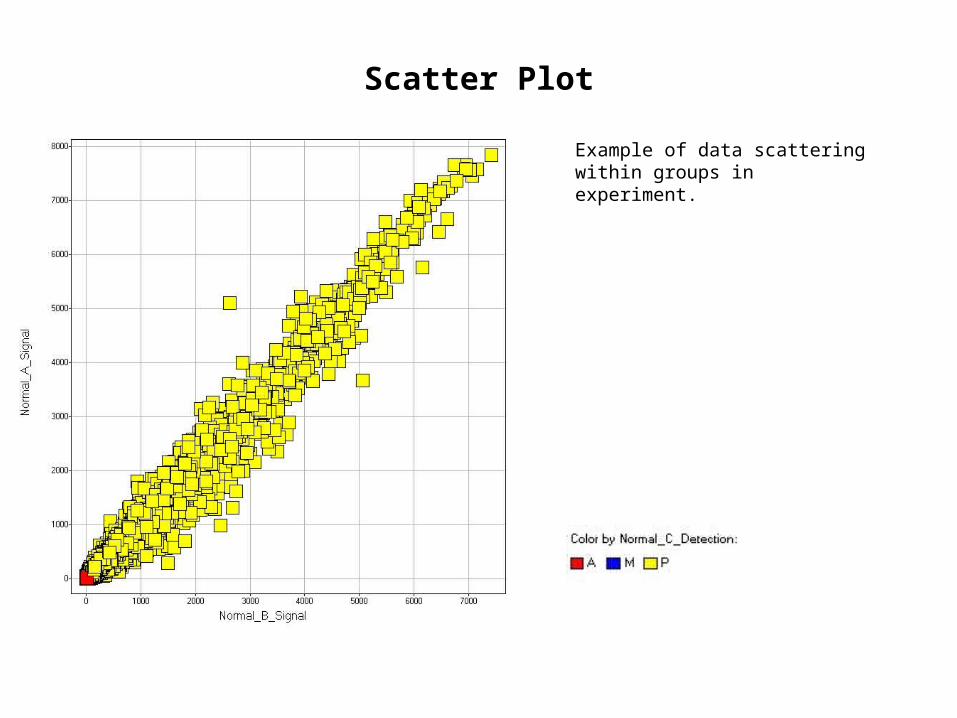
Scatter Plot
Example of data scattering within groups in experiment.
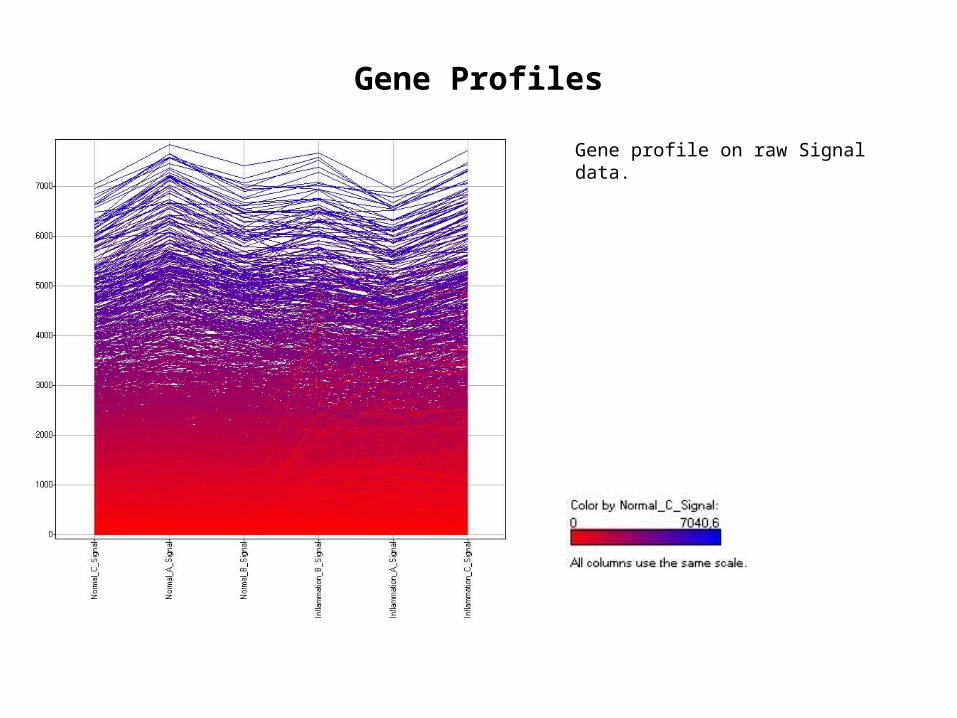
Gene Profiles
Gene profile on raw Signal data.
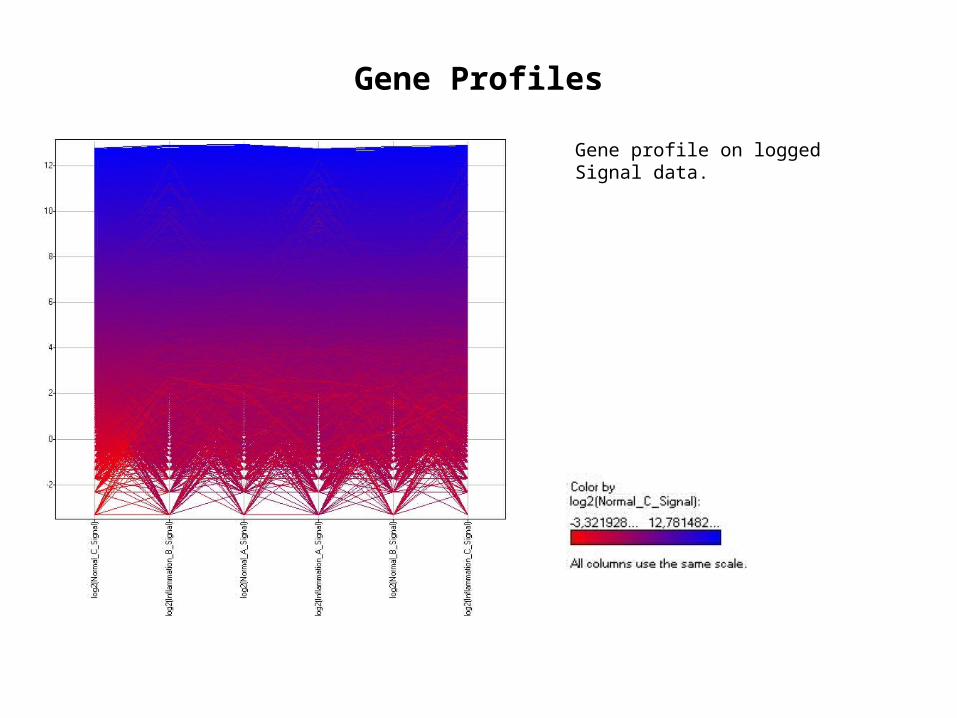
Gene Profiles
Gene profile on logged Signal data.
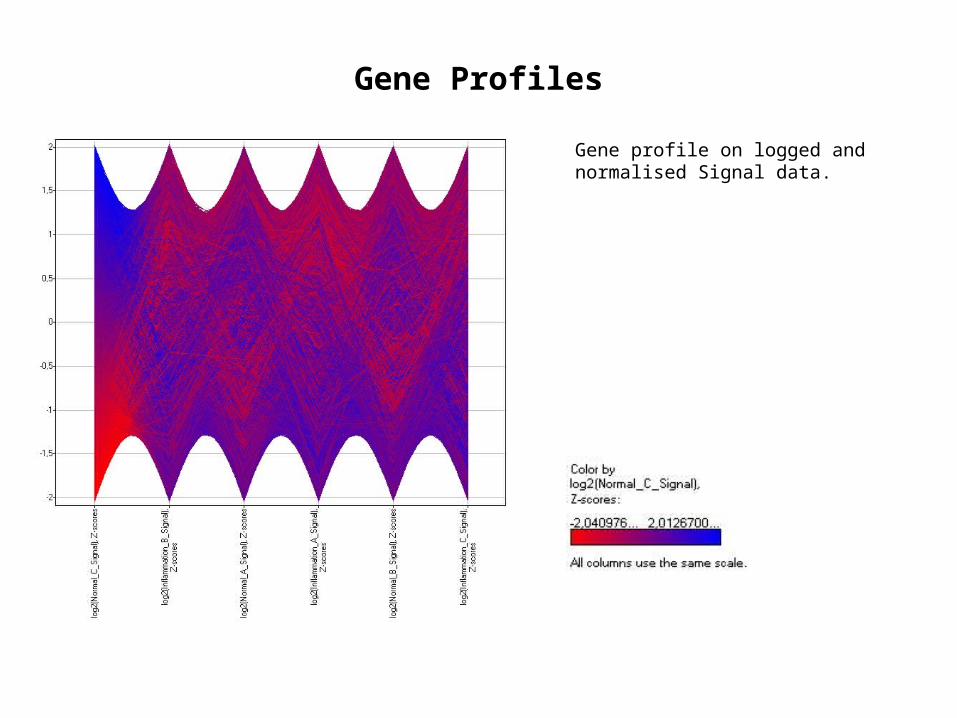
Gene Profiles
Gene profile on logged and normalised Signal data.
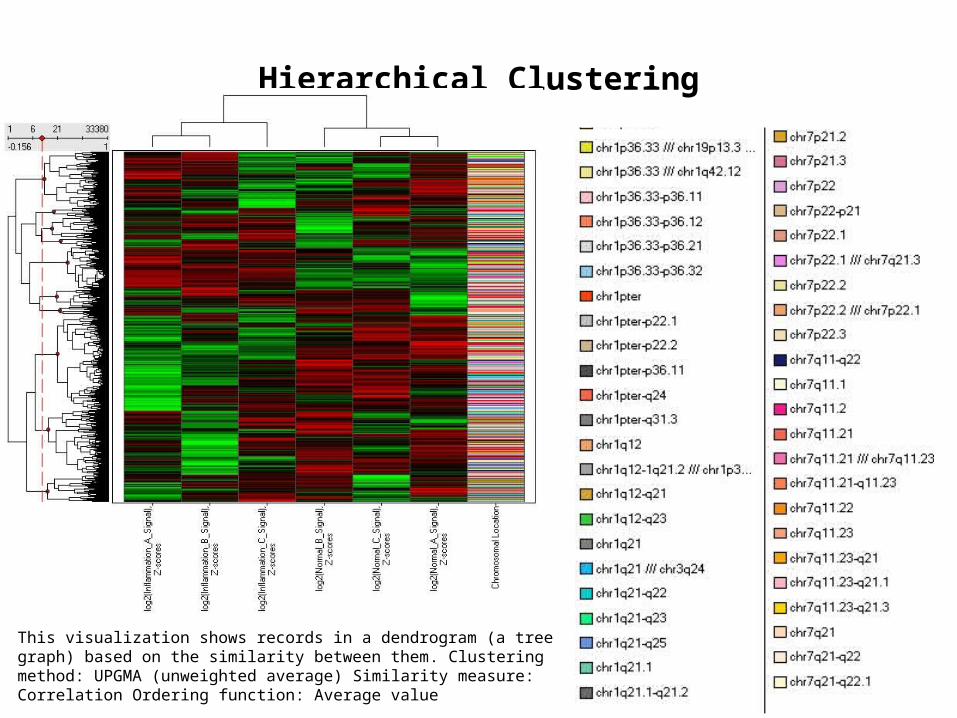
Hierarchical Clustering
This visualization shows records in a dendrogram (a tree graph) based on the similarity between them. Clustering method: UPGMA (unweighted average) Similarity measure: Correlation Ordering function: Average value
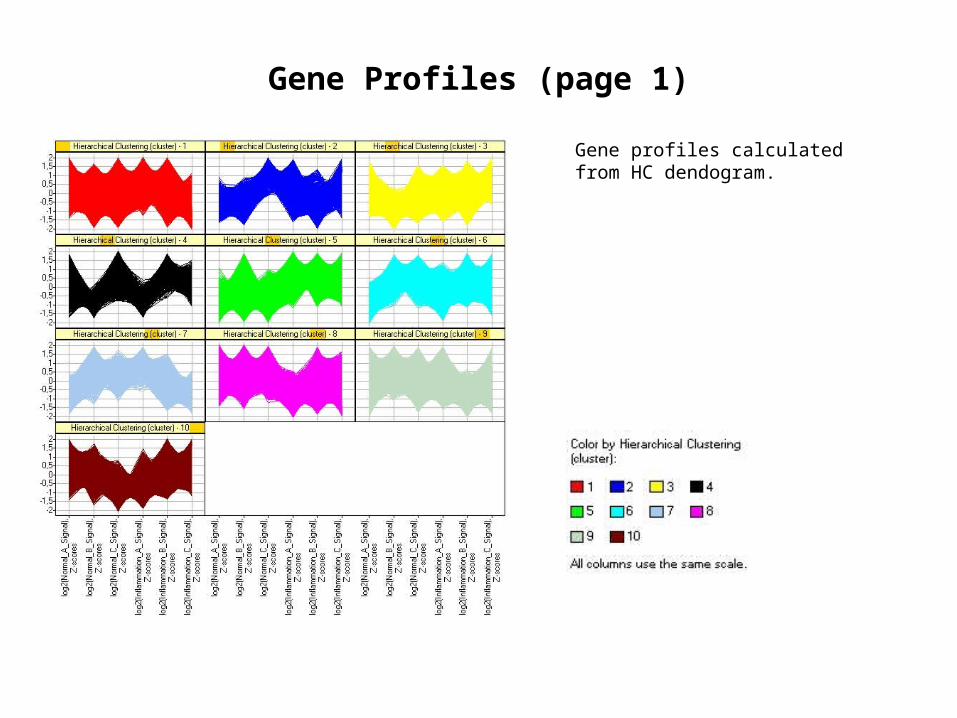
Gene Profiles (page 1)
Gene profiles calculated from HC dendogram.
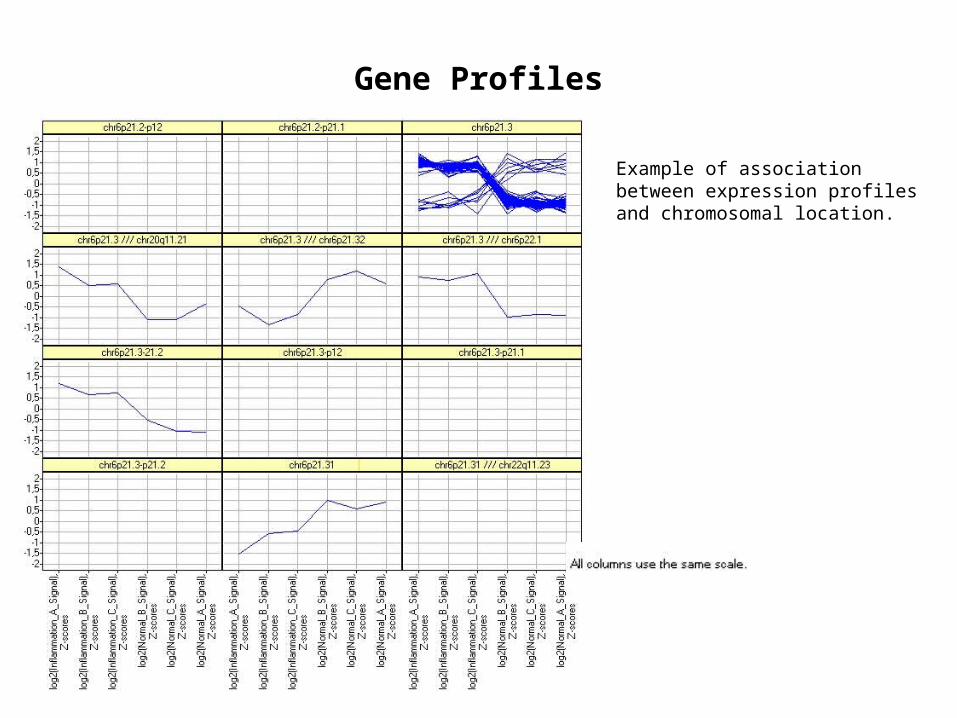
Gene Profiles
Example of association between expression profiles and chromosomal location.