Imaging coherent scatter radar, incoherent scatter radar, and
12
Imaging coherent scatter radar, incoherent scatter radar, and optical observations of quasiperiodic structures associated with sporadic E layers M. F. Larsen, 1 D. L. Hysell, 2 Q. H. Zhou, 3 S. M. Smith, 4 J. Friedman, 5 and R. L. Bishop 6 Received 1 September 2006; revised 17 January 2007; accepted 14 March 2007; published 20 June 2007. [1] During June and July 2002, a 30-MHz imaging coherent scatter radar was installed and operated on the island of St. Croix, to view the E region ionosphere above Arecibo, Puerto Rico. During the observing period, 10 events with discernible quasiperiodic echo structure were observed with the coherent scatter radar. In six of those events, simultaneous measurements were made with the Arecibo 430-MHz incoherent scatter radar. The imaging coherent scatter radar allows us to locate and track the echo structures within the volume illuminated by the transmitter, which shows structures that are generally aligned along wavefronts. A slight preference for motion of the structures toward the southwest is evident throughout the period, but the propagation directions and speeds vary greatly. The incoherent scatter radar measurements show a close correspondence between the occurrence of the coherent echoes and the location of the enhanced electron density structures. In particular, the coherent echoes occur when the electron density layers show uplifts. Citation: Larsen, M. F., D. L. Hysell, Q. H. Zhou, S. M. Smith, J. Friedman, and R. L. Bishop (2007), Imaging coherent scatter radar, incoherent scatter radar, and optical observations of quasiperiodic structures associated with sporadic E layers, J. Geophys. Res., 112, A06321, doi:10.1029/2006JA012051. 1. Introduction [2] In this paper, we summarize the observations of sporadic E layers and quasiperiodic (QP) echoes made during a 3-week period in the Caribbean in June and July 2002. The data set includes measurements made with an incoherent scatter radar, an imaging coherent scatter radar, an optical imaging system, and a lidar. We therefore have common volume measurements of the background plasma, the plasma structure and its motion, and the neutral structure and its motion. In this respect, the experiment provides a much more complete picture of the environment associated with QP echoes than has typically been available in earlier experiments. [3] A 30-MHz radar with multiple receivers and multiple receiving antenna baselines was installed on the island of St. Croix. The transmitting and receiving arrays were pointed toward the west-northwest in the direction toward Puerto Rico. The requirement for backscatter to occur is that the beam direction is perpendicular to the magnetic field lines. The locus of points in the lower E region defined in this way included a broad area over the western half of Puerto Rico that included the volume that can be sampled with the Arecibo 430-MHz incoherent scatter radar. The basic parameters of the experiment, the basic principles of the imaging radar technique, and the first results from one night of observations when particularly strong echoes were detected over Puerto Rico have been described by Hysell et al. [2004]. The geometry is shown in Figure 1. [4] The most commonly recognized indication of the presence of QP echo structure is also the feature that was first used by Yamamoto et al. [1991, 1992] to identify the phenomenon, namely, lines of echoes in the range-time- intensity (RTI) plots with negative slopes, i.e., slopes toward the radar. Typical periodicities between adjacent lines of echoes were found to be in the range of a few minutes to as much as 10 min in some cases. Although the initial observations suggested a consistent negative slope, subsequent observations showed both positive and negative slopes and a tendency for the slopes to reverse during the night [see, e.g., Hysell and Burcham, 1999; Pan and Larsen, 2000]. Furthermore, the imaging coherent scatter radar observations from St. Croix that were described in the earlier paper [Hysell et al., 2004] showed clearly that patterns in the RTIs that appear simple often mask a more complicated pattern of echolocations and echo scattering center movements in three-dimensional space. [5] The common volume observations with the Arecibo UHF incoherent scatter radar (ISR) and the St. Croix HF imaging coherent scatter radar (CSR) provide a unique view JOURNAL OF GEOPHYSICAL RESEARCH, VOL. 112, A06321, doi:10.1029/2006JA012051, 2007 Click Here for Full Articl e 1 Department of Physics and Astronomy, Clemson University, Clemson, South Carolina, USA. 2 Earth and Atmospheric Sciences, Cornell University, Ithaca, New York, USA. 3 Electrical and Computer Engineering Department, Miami University, Oxford, Ohio, USA. 4 Center for Space Physics, Boston University, Boston, Massachusetts, USA. 5 The Arecibo Observatory, Arecibo, Puerto Rico. 6 The Aerospace Corporation, Los Angeles, California, USA. Copyright 2007 by the American Geophysical Union. 0148-0227/07/2006JA012051$09.00 A06321 1 of 12
Transcript of Imaging coherent scatter radar, incoherent scatter radar, and
Imaging coherent scatter radar, incoherent scatter radar, and optical
observations of quasiperiodic structures associated with sporadic
E layers
M. F. Larsen,1 D. L. Hysell,2 Q. H. Zhou,3 S. M. Smith,4 J. Friedman,5 and R. L. Bishop6
Received 1 September 2006; revised 17 January 2007; accepted 14 March 2007; published 20 June 2007.
[1] During June and July 2002, a 30-MHz imaging coherent scatter radar was installedand operated on the island of St. Croix, to view the E region ionosphere aboveArecibo, Puerto Rico. During the observing period, 10 events with discerniblequasiperiodic echo structure were observed with the coherent scatter radar. In six of thoseevents, simultaneous measurements were made with the Arecibo 430-MHz incoherentscatter radar. The imaging coherent scatter radar allows us to locate and track the echostructures within the volume illuminated by the transmitter, which shows structuresthat are generally aligned along wavefronts. A slight preference for motion of thestructures toward the southwest is evident throughout the period, but the propagationdirections and speeds vary greatly. The incoherent scatter radar measurements show aclose correspondence between the occurrence of the coherent echoes and the location ofthe enhanced electron density structures. In particular, the coherent echoes occur when theelectron density layers show uplifts.
Citation: Larsen, M. F., D. L. Hysell, Q. H. Zhou, S. M. Smith, J. Friedman, and R. L. Bishop (2007), Imaging coherent scatter radar,
incoherent scatter radar, and optical observations of quasiperiodic structures associated with sporadic E layers, J. Geophys. Res., 112,
A06321, doi:10.1029/2006JA012051.
1. Introduction
[2] In this paper, we summarize the observations ofsporadic E layers and quasiperiodic (QP) echoes madeduring a 3-week period in the Caribbean in June and July2002. The data set includes measurements made with anincoherent scatter radar, an imaging coherent scatter radar,an optical imaging system, and a lidar. We therefore havecommon volume measurements of the background plasma,the plasma structure and its motion, and the neutral structureand its motion. In this respect, the experiment provides amuch more complete picture of the environment associatedwith QP echoes than has typically been available in earlierexperiments.[3] A 30-MHz radar with multiple receivers and multiple
receiving antenna baselines was installed on the island ofSt. Croix. The transmitting and receiving arrays werepointed toward the west-northwest in the direction towardPuerto Rico. The requirement for backscatter to occur is
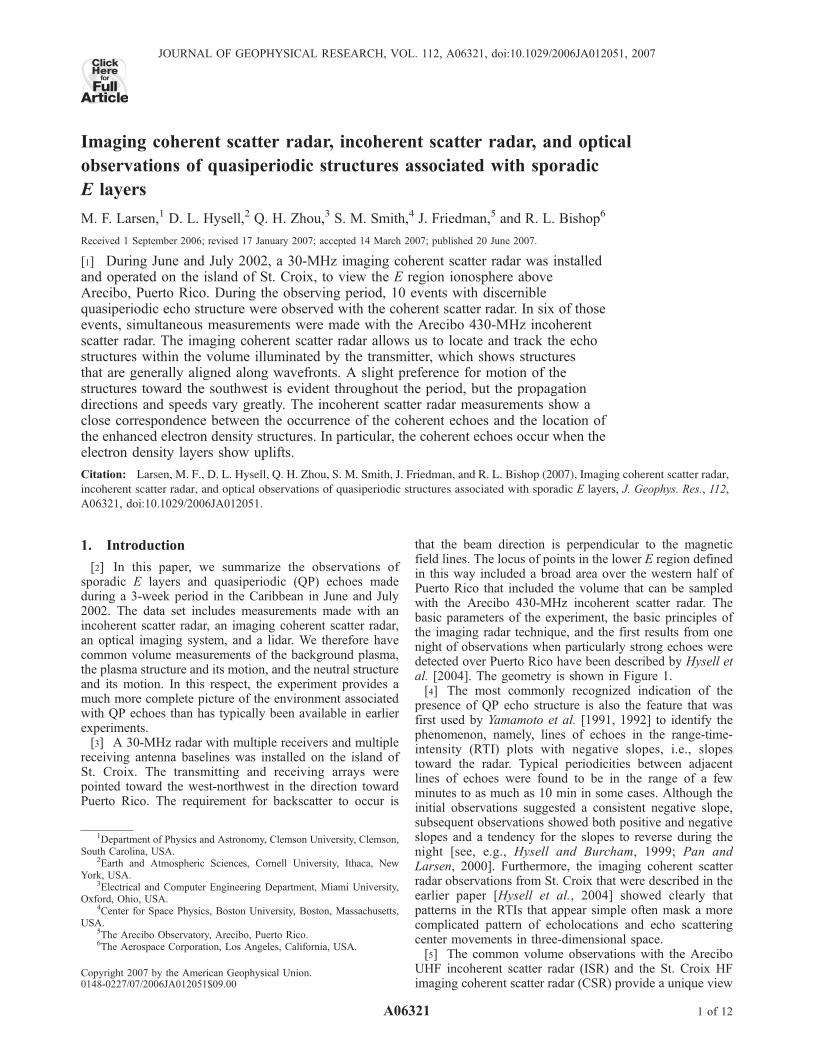
that the beam direction is perpendicular to the magneticfield lines. The locus of points in the lower E region definedin this way included a broad area over the western half ofPuerto Rico that included the volume that can be sampledwith the Arecibo 430-MHz incoherent scatter radar. Thebasic parameters of the experiment, the basic principles ofthe imaging radar technique, and the first results from onenight of observations when particularly strong echoes weredetected over Puerto Rico have been described by Hysell etal. [2004]. The geometry is shown in Figure 1.[4] The most commonly recognized indication of the
presence of QP echo structure is also the feature that wasfirst used by Yamamoto et al. [1991, 1992] to identify thephenomenon, namely, lines of echoes in the range-time-intensity (RTI) plots with negative slopes, i.e., slopestoward the radar. Typical periodicities between adjacentlines of echoes were found to be in the range of a fewminutes to as much as 10 min in some cases. Although theinitial observations suggested a consistent negative slope,subsequent observations showed both positive and negativeslopes and a tendency for the slopes to reverse during thenight [see, e.g., Hysell and Burcham, 1999; Pan andLarsen, 2000]. Furthermore, the imaging coherent scatterradar observations from St. Croix that were described in theearlier paper [Hysell et al., 2004] showed clearly thatpatterns in the RTIs that appear simple often mask a morecomplicated pattern of echolocations and echo scatteringcenter movements in three-dimensional space.[5] The common volume observations with the Arecibo
UHF incoherent scatter radar (ISR) and the St. Croix HFimaging coherent scatter radar (CSR) provide a unique view
JOURNAL OF GEOPHYSICAL RESEARCH, VOL. 112, A06321, doi:10.1029/2006JA012051, 2007ClickHere
for
FullArticle
1Department of Physics and Astronomy, Clemson University, Clemson,South Carolina, USA.
2Earth and Atmospheric Sciences, Cornell University, Ithaca, NewYork, USA.
3Electrical and Computer Engineering Department, Miami University,Oxford, Ohio, USA.
4Center for Space Physics, Boston University, Boston, Massachusetts,USA.
5The Arecibo Observatory, Arecibo, Puerto Rico.6The Aerospace Corporation, Los Angeles, California, USA.
Copyright 2007 by the American Geophysical Union.0148-0227/07/2006JA012051$09.00
A06321 1 of 12
of the processes and dynamics associated with QP echoes.The ISR backscatter shows the electron density structuresdirectly, and by scanning in azimuth, information about thehorizontal and vertical gradients in that structure can beobtained. The CSR backscatter requires perpendicularity ofthe beam to the magnetic field lines and the presence ofplasma structure at the scale size of half the radar wave-length. Some enhancement in the electron densities clearlyhas to be present as well to produce coherent scatter, but it isnot necessarily the case that the backscatter occurs wherethe largest density enhancements are found. The combina-tion of the ISR and CSR measurements can be used toexamine the relationship between the two.[6] Besides the ISR, the Arecibo Observatory also has
considerable optical instrumentation, including a resonancelidar and imagers operating at several different wavelengths.On one of the nights when QP echoes were observed withthe CSR, we were also able to obtain potassium lidar and557.7- and 630.0-nm all-sky imager data.[7] In the remainder of the paper we will focus on the
data from three nights of observations during the 3-weekperiod.
2. Observations
2.1. 14 June 2002
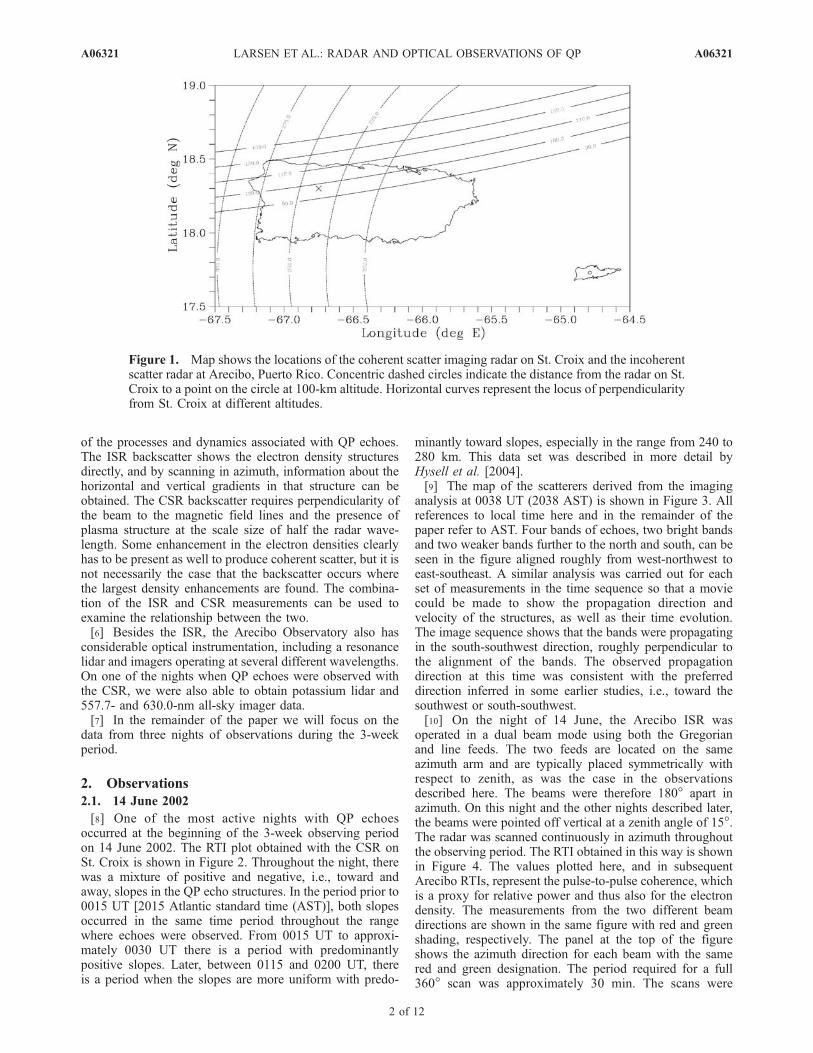
[8] One of the most active nights with QP echoesoccurred at the beginning of the 3-week observing periodon 14 June 2002. The RTI plot obtained with the CSR onSt. Croix is shown in Figure 2. Throughout the night, therewas a mixture of positive and negative, i.e., toward andaway, slopes in the QP echo structures. In the period prior to0015 UT [2015 Atlantic standard time (AST)], both slopesoccurred in the same time period throughout the rangewhere echoes were observed. From 0015 UT to approxi-mately 0030 UT there is a period with predominantlypositive slopes. Later, between 0115 and 0200 UT, thereis a period when the slopes are more uniform with predo-
minantly toward slopes, especially in the range from 240 to280 km. This data set was described in more detail byHysell et al. [2004].[9] The map of the scatterers derived from the imaging
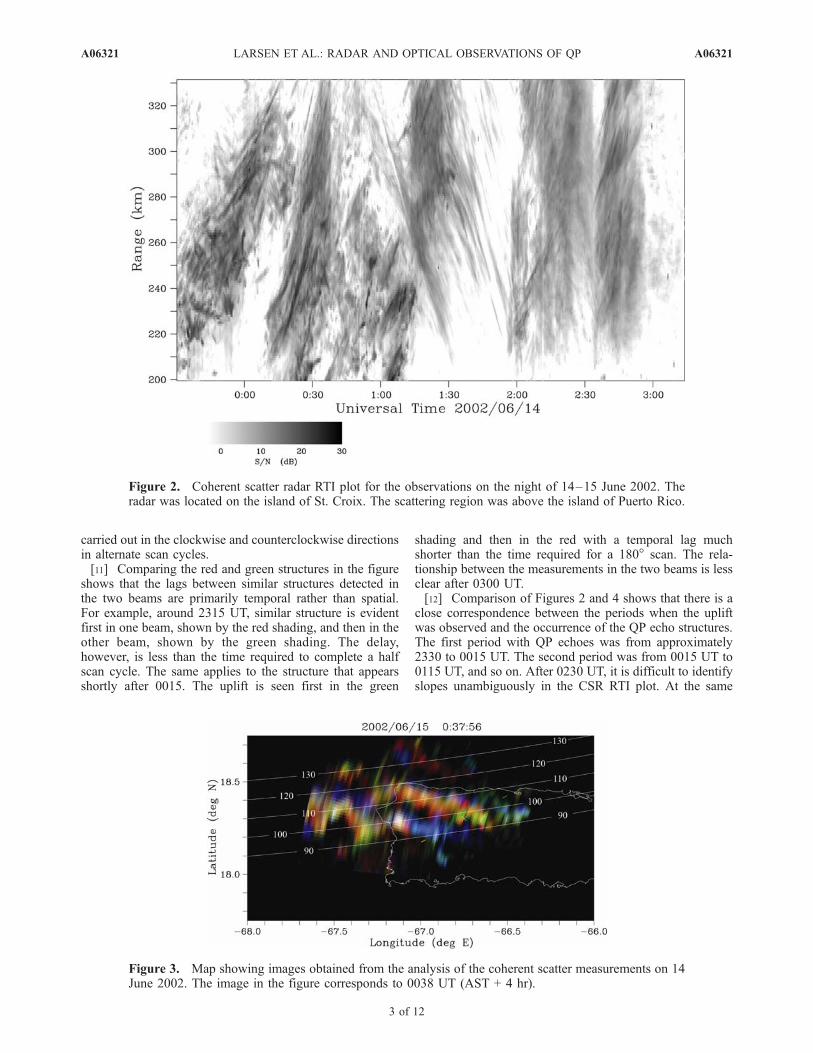
analysis at 0038 UT (2038 AST) is shown in Figure 3. Allreferences to local time here and in the remainder of thepaper refer to AST. Four bands of echoes, two bright bandsand two weaker bands further to the north and south, can beseen in the figure aligned roughly from west-northwest toeast-southeast. A similar analysis was carried out for eachset of measurements in the time sequence so that a moviecould be made to show the propagation direction andvelocity of the structures, as well as their time evolution.The image sequence shows that the bands were propagatingin the south-southwest direction, roughly perpendicular tothe alignment of the bands. The observed propagationdirection at this time was consistent with the preferreddirection inferred in some earlier studies, i.e., toward thesouthwest or south-southwest.[10] On the night of 14 June, the Arecibo ISR was
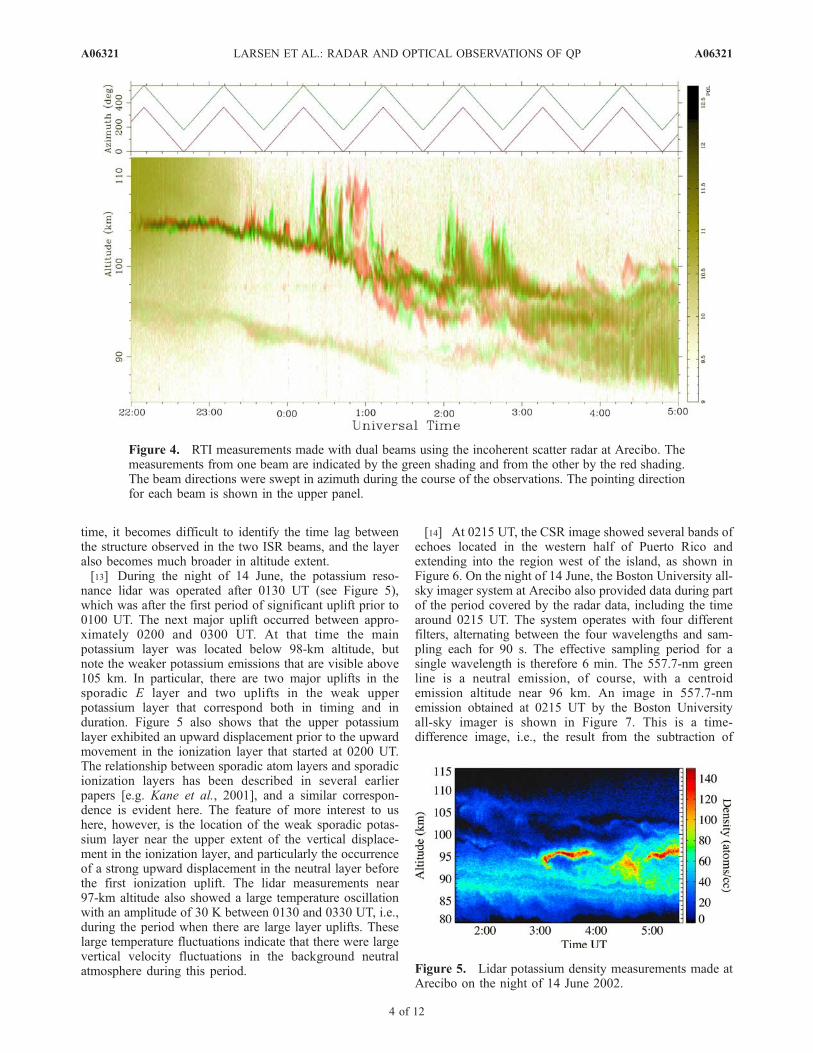
operated in a dual beam mode using both the Gregorianand line feeds. The two feeds are located on the sameazimuth arm and are typically placed symmetrically withrespect to zenith, as was the case in the observationsdescribed here. The beams were therefore 180� apart inazimuth. On this night and the other nights described later,the beams were pointed off vertical at a zenith angle of 15�.The radar was scanned continuously in azimuth throughoutthe observing period. The RTI obtained in this way is shownin Figure 4. The values plotted here, and in subsequentArecibo RTIs, represent the pulse-to-pulse coherence, whichis a proxy for relative power and thus also for the electrondensity. The measurements from the two different beamdirections are shown in the same figure with red and greenshading, respectively. The panel at the top of the figureshows the azimuth direction for each beam with the samered and green designation. The period required for a full360� scan was approximately 30 min. The scans were
Figure 1. Map shows the locations of the coherent scatter imaging radar on St. Croix and the incoherentscatter radar at Arecibo, Puerto Rico. Concentric dashed circles indicate the distance from the radar on St.Croix to a point on the circle at 100-km altitude. Horizontal curves represent the locus of perpendicularityfrom St. Croix at different altitudes.
A06321 LARSEN ET AL.: RADAR AND OPTICAL OBSERVATIONS OF QP
2 of 12
A06321
carried out in the clockwise and counterclockwise directionsin alternate scan cycles.[11] Comparing the red and green structures in the figure
shows that the lags between similar structures detected inthe two beams are primarily temporal rather than spatial.For example, around 2315 UT, similar structure is evidentfirst in one beam, shown by the red shading, and then in theother beam, shown by the green shading. The delay,however, is less than the time required to complete a halfscan cycle. The same applies to the structure that appearsshortly after 0015. The uplift is seen first in the green
shading and then in the red with a temporal lag muchshorter than the time required for a 180� scan. The rela-tionship between the measurements in the two beams is lessclear after 0300 UT.[12] Comparison of Figures 2 and 4 shows that there is a
close correspondence between the periods when the upliftwas observed and the occurrence of the QP echo structures.The first period with QP echoes was from approximately2330 to 0015 UT. The second period was from 0015 UT to0115 UT, and so on. After 0230 UT, it is difficult to identifyslopes unambiguously in the CSR RTI plot. At the same
Figure 3. Map showing images obtained from the analysis of the coherent scatter measurements on 14June 2002. The image in the figure corresponds to 0038 UT (AST + 4 hr).
Figure 2. Coherent scatter radar RTI plot for the observations on the night of 14–15 June 2002. Theradar was located on the island of St. Croix. The scattering region was above the island of Puerto Rico.
A06321 LARSEN ET AL.: RADAR AND OPTICAL OBSERVATIONS OF QP
3 of 12
A06321
time, it becomes difficult to identify the time lag betweenthe structure observed in the two ISR beams, and the layeralso becomes much broader in altitude extent.[13] During the night of 14 June, the potassium reso-
nance lidar was operated after 0130 UT (see Figure 5),which was after the first period of significant uplift prior to0100 UT. The next major uplift occurred between appro-ximately 0200 and 0300 UT. At that time the mainpotassium layer was located below 98-km altitude, butnote the weaker potassium emissions that are visible above105 km. In particular, there are two major uplifts in thesporadic E layer and two uplifts in the weak upperpotassium layer that correspond both in timing and induration. Figure 5 also shows that the upper potassiumlayer exhibited an upward displacement prior to the upwardmovement in the ionization layer that started at 0200 UT.The relationship between sporadic atom layers and sporadicionization layers has been described in several earlierpapers [e.g. Kane et al., 2001], and a similar correspon-dence is evident here. The feature of more interest to ushere, however, is the location of the weak sporadic potas-sium layer near the upper extent of the vertical displace-ment in the ionization layer, and particularly the occurrenceof a strong upward displacement in the neutral layer beforethe first ionization uplift. The lidar measurements near97-km altitude also showed a large temperature oscillationwith an amplitude of 30 K between 0130 and 0330 UT, i.e.,during the period when there are large layer uplifts. Theselarge temperature fluctuations indicate that there were largevertical velocity fluctuations in the background neutralatmosphere during this period.
[14] At 0215 UT, the CSR image showed several bands ofechoes located in the western half of Puerto Rico andextending into the region west of the island, as shown inFigure 6. On the night of 14 June, the Boston University all-sky imager system at Arecibo also provided data during partof the period covered by the radar data, including the timearound 0215 UT. The system operates with four differentfilters, alternating between the four wavelengths and sam-pling each for 90 s. The effective sampling period for asingle wavelength is therefore 6 min. The 557.7-nm greenline is a neutral emission, of course, with a centroidemission altitude near 96 km. An image in 557.7-nmemission obtained at 0215 UT by the Boston Universityall-sky imager is shown in Figure 7. This is a time-difference image, i.e., the result from the subtraction of
Figure 4. RTI measurements made with dual beams using the incoherent scatter radar at Arecibo. Themeasurements from one beam are indicated by the green shading and from the other by the red shading.The beam directions were swept in azimuth during the course of the observations. The pointing directionfor each beam is shown in the upper panel.
Figure 5. Lidar potassium density measurements made atArecibo on the night of 14 June 2002.
A06321 LARSEN ET AL.: RADAR AND OPTICAL OBSERVATIONS OF QP
4 of 12
A06321
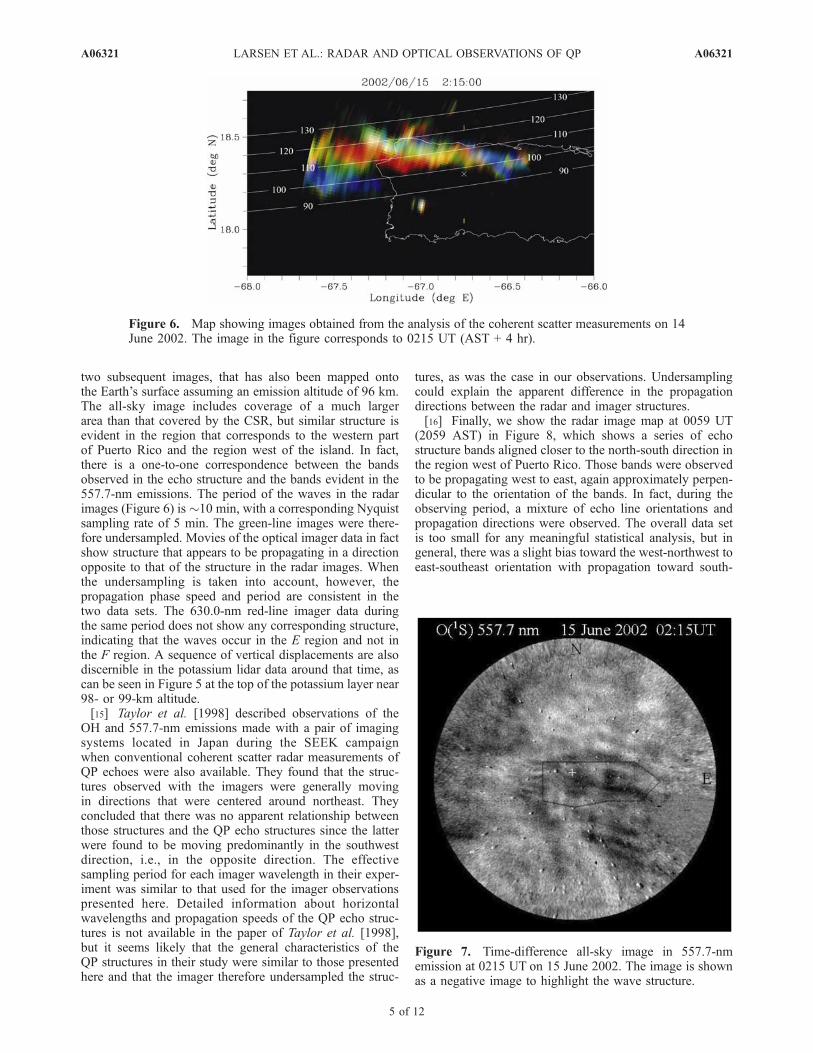
two subsequent images, that has also been mapped ontothe Earth’s surface assuming an emission altitude of 96 km.The all-sky image includes coverage of a much largerarea than that covered by the CSR, but similar structure isevident in the region that corresponds to the western partof Puerto Rico and the region west of the island. In fact,there is a one-to-one correspondence between the bandsobserved in the echo structure and the bands evident in the557.7-nm emissions. The period of the waves in the radarimages (Figure 6) is �10 min, with a corresponding Nyquistsampling rate of 5 min. The green-line images were there-fore undersampled. Movies of the optical imager data in factshow structure that appears to be propagating in a directionopposite to that of the structure in the radar images. Whenthe undersampling is taken into account, however, thepropagation phase speed and period are consistent in thetwo data sets. The 630.0-nm red-line imager data duringthe same period does not show any corresponding structure,indicating that the waves occur in the E region and not inthe F region. A sequence of vertical displacements are alsodiscernible in the potassium lidar data around that time, ascan be seen in Figure 5 at the top of the potassium layer near98- or 99-km altitude.[15] Taylor et al. [1998] described observations of the
OH and 557.7-nm emissions made with a pair of imagingsystems located in Japan during the SEEK campaignwhen conventional coherent scatter radar measurements ofQP echoes were also available. They found that the struc-tures observed with the imagers were generally movingin directions that were centered around northeast. Theyconcluded that there was no apparent relationship betweenthose structures and the QP echo structures since the latterwere found to be moving predominantly in the southwestdirection, i.e., in the opposite direction. The effectivesampling period for each imager wavelength in their exper-iment was similar to that used for the imager observationspresented here. Detailed information about horizontalwavelengths and propagation speeds of the QP echo struc-tures is not available in the paper of Taylor et al. [1998],but it seems likely that the general characteristics of theQP structures in their study were similar to those presentedhere and that the imager therefore undersampled the struc-
tures, as was the case in our observations. Undersamplingcould explain the apparent difference in the propagationdirections between the radar and imager structures.[16] Finally, we show the radar image map at 0059 UT
(2059 AST) in Figure 8, which shows a series of echostructure bands aligned closer to the north-south direction inthe region west of Puerto Rico. Those bands were observedto be propagating west to east, again approximately perpen-dicular to the orientation of the bands. In fact, during theobserving period, a mixture of echo line orientations andpropagation directions were observed. The overall data setis too small for any meaningful statistical analysis, but ingeneral, there was a slight bias toward the west-northwest toeast-southeast orientation with propagation toward south-
Figure 6. Map showing images obtained from the analysis of the coherent scatter measurements on 14June 2002. The image in the figure corresponds to 0215 UT (AST + 4 hr).
Figure 7. Time-difference all-sky image in 557.7-nmemission at 0215 UT on 15 June 2002. The image is shownas a negative image to highlight the wave structure.
A06321 LARSEN ET AL.: RADAR AND OPTICAL OBSERVATIONS OF QP
5 of 12
A06321
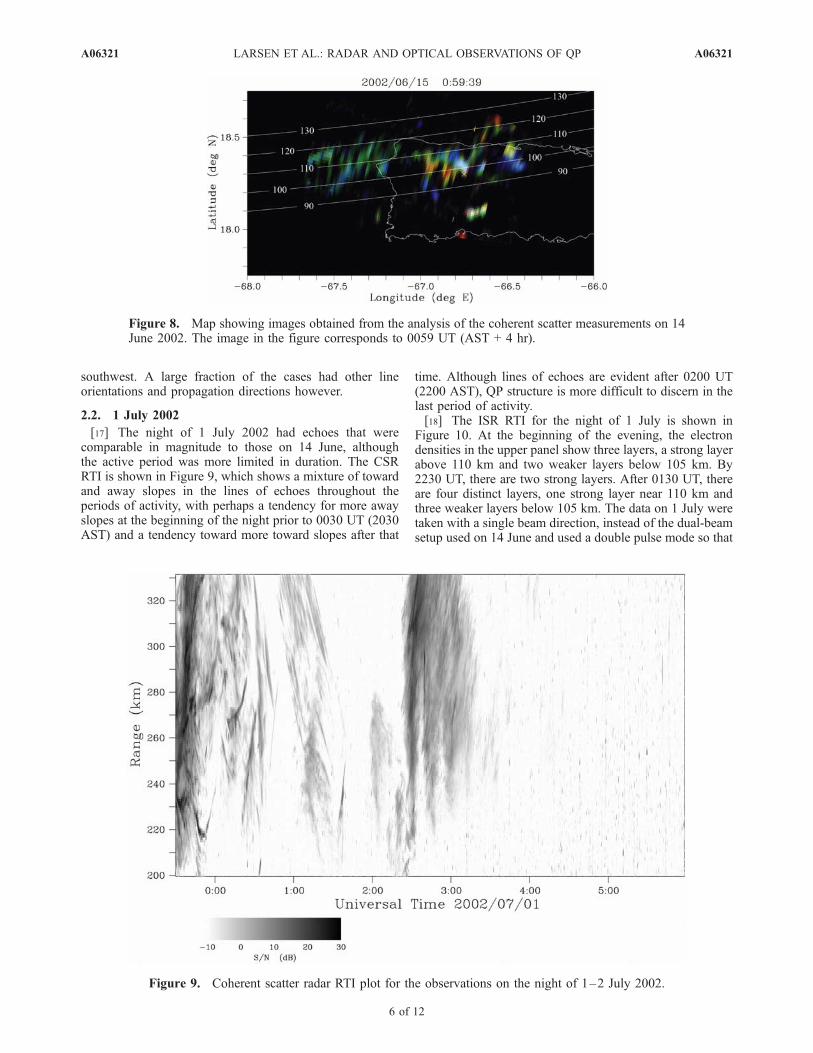
southwest. A large fraction of the cases had other lineorientations and propagation directions however.
2.2. 1 July 2002
[17] The night of 1 July 2002 had echoes that werecomparable in magnitude to those on 14 June, althoughthe active period was more limited in duration. The CSRRTI is shown in Figure 9, which shows a mixture of towardand away slopes in the lines of echoes throughout theperiods of activity, with perhaps a tendency for more awayslopes at the beginning of the night prior to 0030 UT (2030AST) and a tendency toward more toward slopes after that
time. Although lines of echoes are evident after 0200 UT(2200 AST), QP structure is more difficult to discern in thelast period of activity.[18] The ISR RTI for the night of 1 July is shown in
Figure 10. At the beginning of the evening, the electrondensities in the upper panel show three layers, a strong layerabove 110 km and two weaker layers below 105 km. By2230 UT, there are two strong layers. After 0130 UT, thereare four distinct layers, one strong layer near 110 km andthree weaker layers below 105 km. The data on 1 July weretaken with a single beam direction, instead of the dual-beamsetup used on 14 June and used a double pulse mode so that
Figure 8. Map showing images obtained from the analysis of the coherent scatter measurements on 14June 2002. The image in the figure corresponds to 0059 UT (AST + 4 hr).
Figure 9. Coherent scatter radar RTI plot for the observations on the night of 1–2 July 2002.
A06321 LARSEN ET AL.: RADAR AND OPTICAL OBSERVATIONS OF QP
6 of 12
A06321
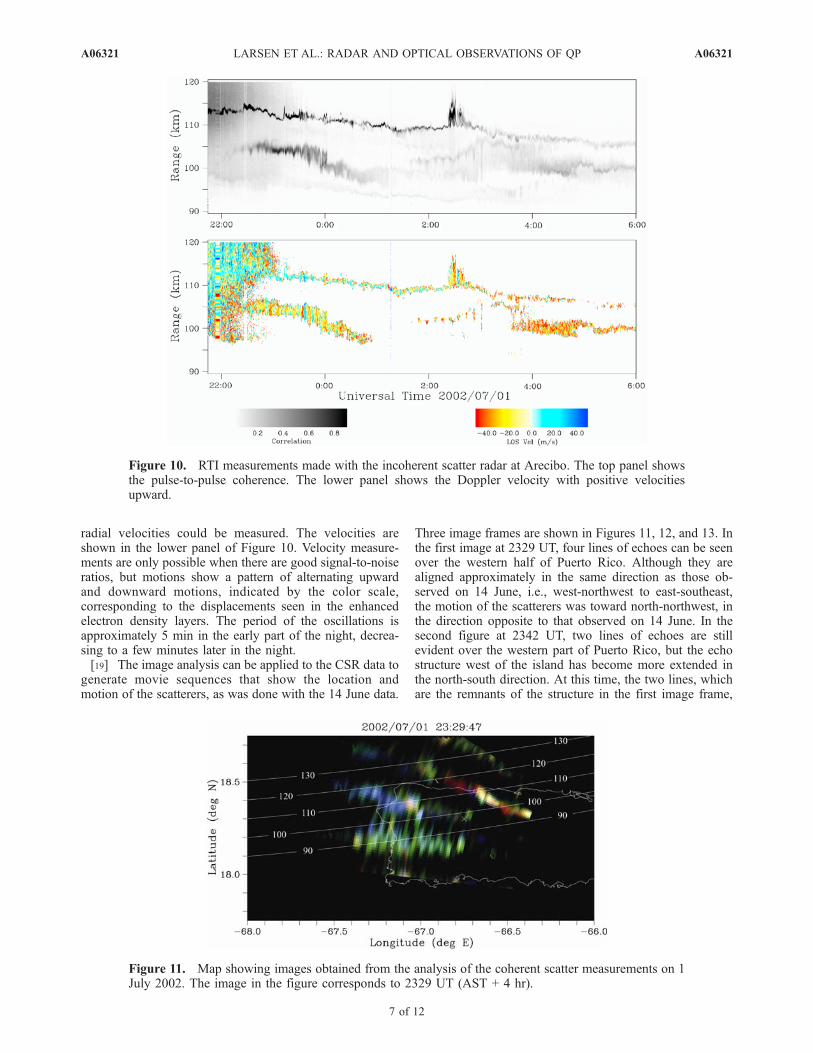
radial velocities could be measured. The velocities areshown in the lower panel of Figure 10. Velocity measure-ments are only possible when there are good signal-to-noiseratios, but motions show a pattern of alternating upwardand downward motions, indicated by the color scale,corresponding to the displacements seen in the enhancedelectron density layers. The period of the oscillations isapproximately 5 min in the early part of the night, decrea-sing to a few minutes later in the night.[19] The image analysis can be applied to the CSR data to
generate movie sequences that show the location andmotion of the scatterers, as was done with the 14 June data.
Three image frames are shown in Figures 11, 12, and 13. Inthe first image at 2329 UT, four lines of echoes can be seenover the western half of Puerto Rico. Although they arealigned approximately in the same direction as those ob-served on 14 June, i.e., west-northwest to east-southeast,the motion of the scatterers was toward north-northwest, inthe direction opposite to that observed on 14 June. In thesecond figure at 2342 UT, two lines of echoes are stillevident over the western part of Puerto Rico, but the echostructure west of the island has become more extended inthe north-south direction. At this time, the two lines, whichare the remnants of the structure in the first image frame,
Figure 10. RTI measurements made with the incoherent scatter radar at Arecibo. The top panel showsthe pulse-to-pulse coherence. The lower panel shows the Doppler velocity with positive velocitiesupward.
Figure 11. Map showing images obtained from the analysis of the coherent scatter measurements on 1July 2002. The image in the figure corresponds to 2329 UT (AST + 4 hr).
A06321 LARSEN ET AL.: RADAR AND OPTICAL OBSERVATIONS OF QP
7 of 12
A06321
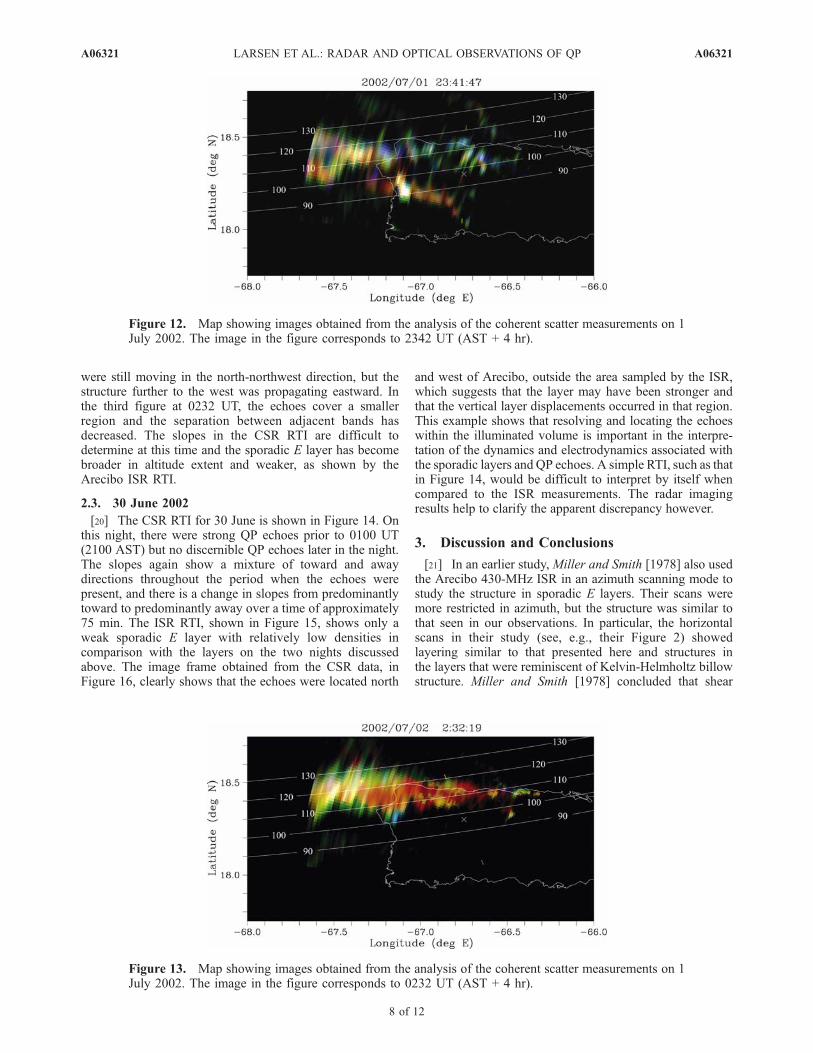
were still moving in the north-northwest direction, but thestructure further to the west was propagating eastward. Inthe third figure at 0232 UT, the echoes cover a smallerregion and the separation between adjacent bands hasdecreased. The slopes in the CSR RTI are difficult todetermine at this time and the sporadic E layer has becomebroader in altitude extent and weaker, as shown by theArecibo ISR RTI.
2.3. 30 June 2002
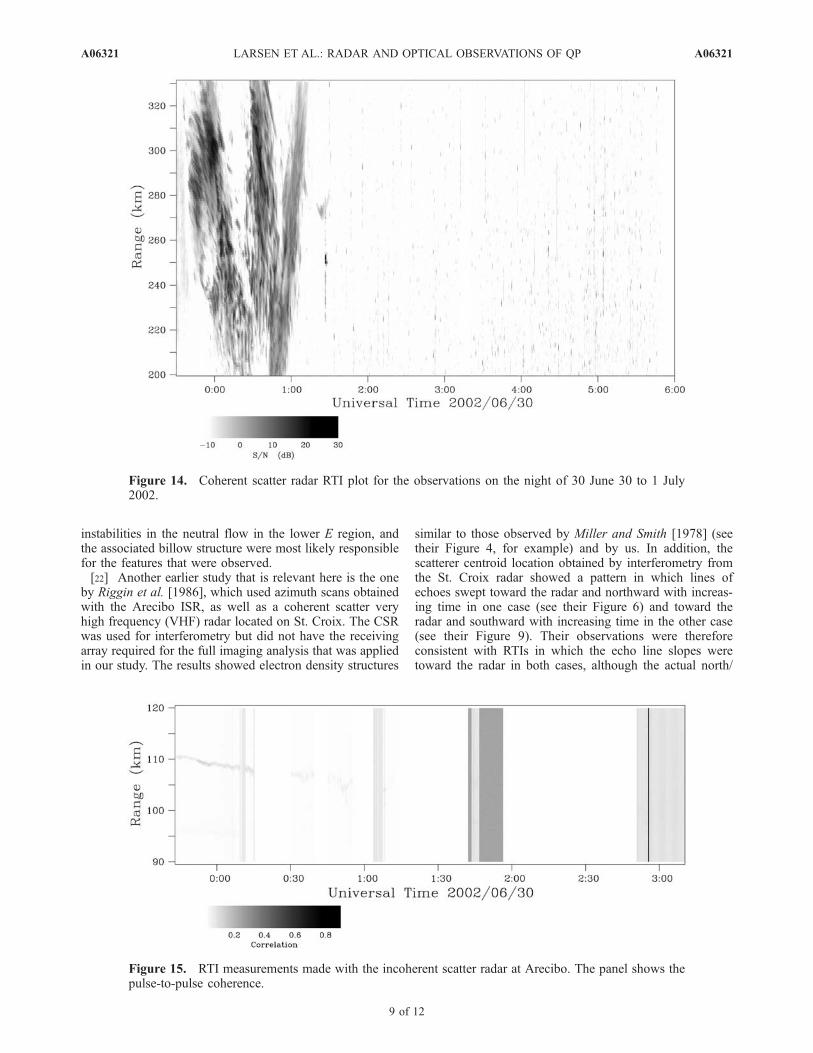
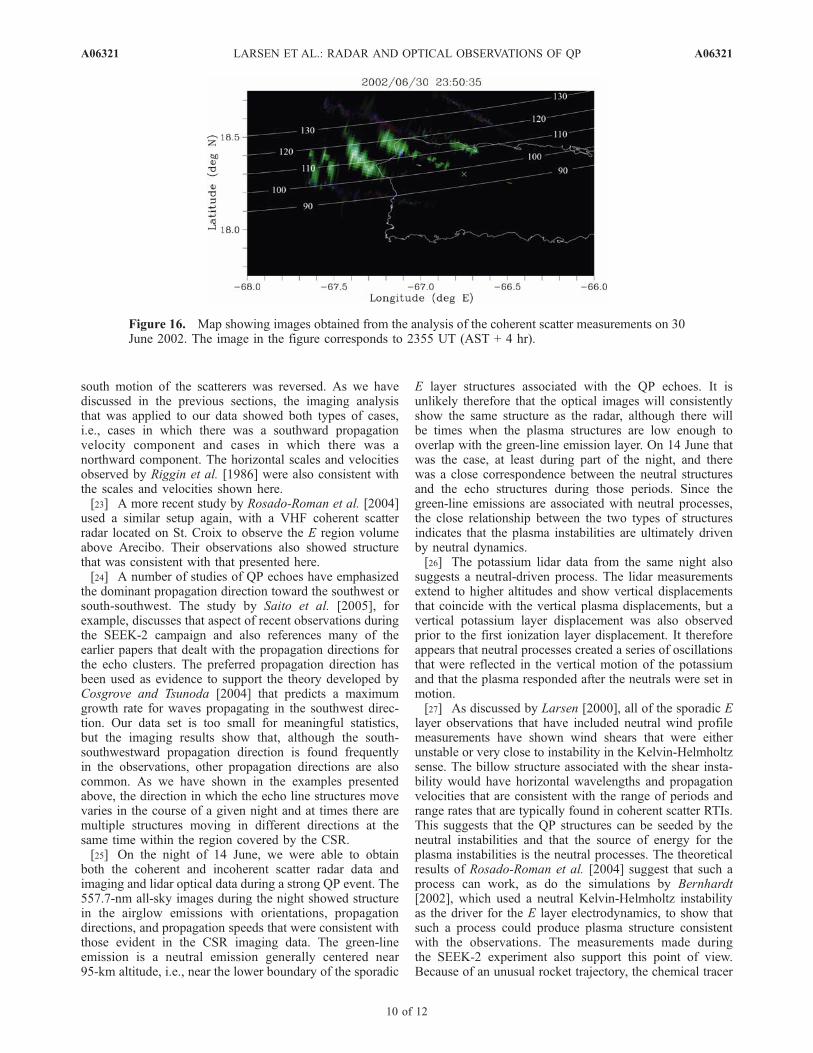
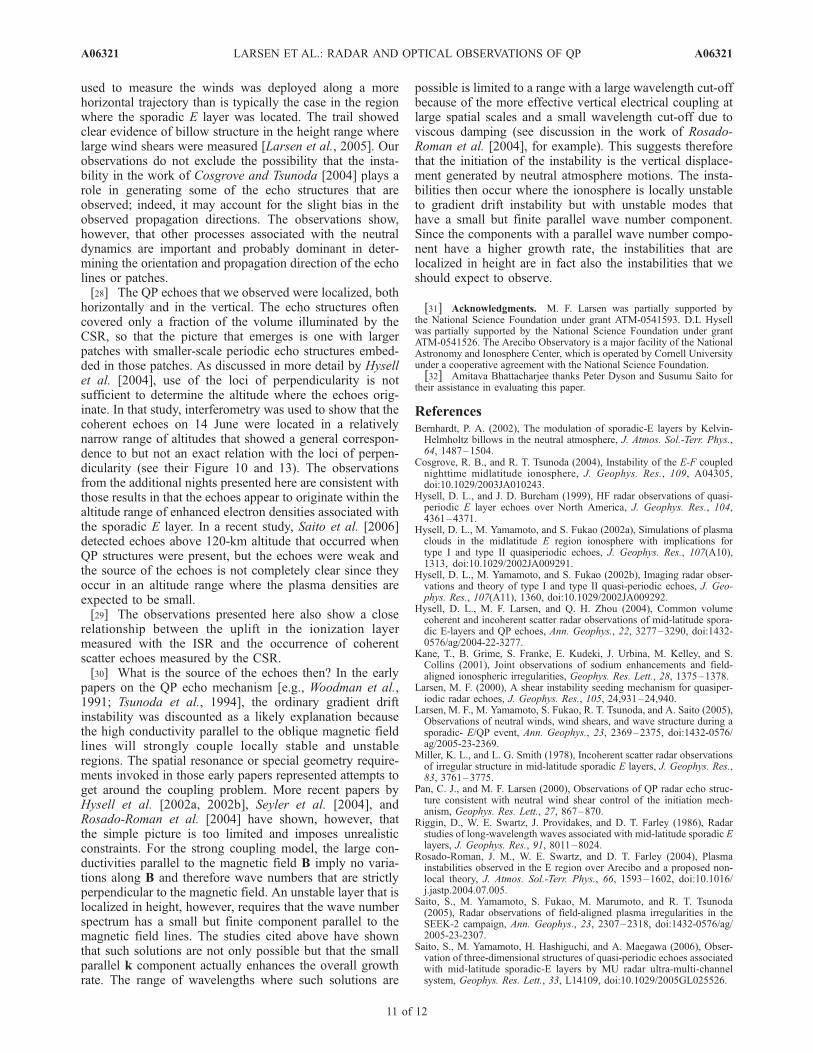
[20] The CSR RTI for 30 June is shown in Figure 14. Onthis night, there were strong QP echoes prior to 0100 UT(2100 AST) but no discernible QP echoes later in the night.The slopes again show a mixture of toward and awaydirections throughout the period when the echoes werepresent, and there is a change in slopes from predominantlytoward to predominantly away over a time of approximately75 min. The ISR RTI, shown in Figure 15, shows only aweak sporadic E layer with relatively low densities incomparison with the layers on the two nights discussedabove. The image frame obtained from the CSR data, inFigure 16, clearly shows that the echoes were located north
and west of Arecibo, outside the area sampled by the ISR,which suggests that the layer may have been stronger andthat the vertical layer displacements occurred in that region.This example shows that resolving and locating the echoeswithin the illuminated volume is important in the interpre-tation of the dynamics and electrodynamics associated withthe sporadic layers and QP echoes. A simple RTI, such as thatin Figure 14, would be difficult to interpret by itself whencompared to the ISR measurements. The radar imagingresults help to clarify the apparent discrepancy however.
3. Discussion and Conclusions
[21] In an earlier study, Miller and Smith [1978] also usedthe Arecibo 430-MHz ISR in an azimuth scanning mode tostudy the structure in sporadic E layers. Their scans weremore restricted in azimuth, but the structure was similar tothat seen in our observations. In particular, the horizontalscans in their study (see, e.g., their Figure 2) showedlayering similar to that presented here and structures inthe layers that were reminiscent of Kelvin-Helmholtz billowstructure. Miller and Smith [1978] concluded that shear
Figure 12. Map showing images obtained from the analysis of the coherent scatter measurements on 1July 2002. The image in the figure corresponds to 2342 UT (AST + 4 hr).
Figure 13. Map showing images obtained from the analysis of the coherent scatter measurements on 1July 2002. The image in the figure corresponds to 0232 UT (AST + 4 hr).
A06321 LARSEN ET AL.: RADAR AND OPTICAL OBSERVATIONS OF QP
8 of 12
A06321
instabilities in the neutral flow in the lower E region, andthe associated billow structure were most likely responsiblefor the features that were observed.[22] Another earlier study that is relevant here is the one
by Riggin et al. [1986], which used azimuth scans obtainedwith the Arecibo ISR, as well as a coherent scatter veryhigh frequency (VHF) radar located on St. Croix. The CSRwas used for interferometry but did not have the receivingarray required for the full imaging analysis that was appliedin our study. The results showed electron density structures
similar to those observed by Miller and Smith [1978] (seetheir Figure 4, for example) and by us. In addition, thescatterer centroid location obtained by interferometry fromthe St. Croix radar showed a pattern in which lines ofechoes swept toward the radar and northward with increas-ing time in one case (see their Figure 6) and toward theradar and southward with increasing time in the other case(see their Figure 9). Their observations were thereforeconsistent with RTIs in which the echo line slopes weretoward the radar in both cases, although the actual north/
Figure 14. Coherent scatter radar RTI plot for the observations on the night of 30 June 30 to 1 July2002.
Figure 15. RTI measurements made with the incoherent scatter radar at Arecibo. The panel shows thepulse-to-pulse coherence.
A06321 LARSEN ET AL.: RADAR AND OPTICAL OBSERVATIONS OF QP
9 of 12
A06321
south motion of the scatterers was reversed. As we havediscussed in the previous sections, the imaging analysisthat was applied to our data showed both types of cases,i.e., cases in which there was a southward propagationvelocity component and cases in which there was anorthward component. The horizontal scales and velocitiesobserved by Riggin et al. [1986] were also consistent withthe scales and velocities shown here.[23] A more recent study by Rosado-Roman et al. [2004]
used a similar setup again, with a VHF coherent scatterradar located on St. Croix to observe the E region volumeabove Arecibo. Their observations also showed structurethat was consistent with that presented here.[24] A number of studies of QP echoes have emphasized
the dominant propagation direction toward the southwest orsouth-southwest. The study by Saito et al. [2005], forexample, discusses that aspect of recent observations duringthe SEEK-2 campaign and also references many of theearlier papers that dealt with the propagation directions forthe echo clusters. The preferred propagation direction hasbeen used as evidence to support the theory developed byCosgrove and Tsunoda [2004] that predicts a maximumgrowth rate for waves propagating in the southwest direc-tion. Our data set is too small for meaningful statistics,but the imaging results show that, although the south-southwestward propagation direction is found frequentlyin the observations, other propagation directions are alsocommon. As we have shown in the examples presentedabove, the direction in which the echo line structures movevaries in the course of a given night and at times there aremultiple structures moving in different directions at thesame time within the region covered by the CSR.[25] On the night of 14 June, we were able to obtain
both the coherent and incoherent scatter radar data andimaging and lidar optical data during a strong QP event. The557.7-nm all-sky images during the night showed structurein the airglow emissions with orientations, propagationdirections, and propagation speeds that were consistent withthose evident in the CSR imaging data. The green-lineemission is a neutral emission generally centered near95-km altitude, i.e., near the lower boundary of the sporadic
E layer structures associated with the QP echoes. It isunlikely therefore that the optical images will consistentlyshow the same structure as the radar, although there willbe times when the plasma structures are low enough tooverlap with the green-line emission layer. On 14 June thatwas the case, at least during part of the night, and therewas a close correspondence between the neutral structuresand the echo structures during those periods. Since thegreen-line emissions are associated with neutral processes,the close relationship between the two types of structuresindicates that the plasma instabilities are ultimately drivenby neutral dynamics.[26] The potassium lidar data from the same night also
suggests a neutral-driven process. The lidar measurementsextend to higher altitudes and show vertical displacementsthat coincide with the vertical plasma displacements, but avertical potassium layer displacement was also observedprior to the first ionization layer displacement. It thereforeappears that neutral processes created a series of oscillationsthat were reflected in the vertical motion of the potassiumand that the plasma responded after the neutrals were set inmotion.[27] As discussed by Larsen [2000], all of the sporadic E
layer observations that have included neutral wind profilemeasurements have shown wind shears that were eitherunstable or very close to instability in the Kelvin-Helmholtzsense. The billow structure associated with the shear insta-bility would have horizontal wavelengths and propagationvelocities that are consistent with the range of periods andrange rates that are typically found in coherent scatter RTIs.This suggests that the QP structures can be seeded by theneutral instabilities and that the source of energy for theplasma instabilities is the neutral processes. The theoreticalresults of Rosado-Roman et al. [2004] suggest that such aprocess can work, as do the simulations by Bernhardt[2002], which used a neutral Kelvin-Helmholtz instabilityas the driver for the E layer electrodynamics, to show thatsuch a process could produce plasma structure consistentwith the observations. The measurements made duringthe SEEK-2 experiment also support this point of view.Because of an unusual rocket trajectory, the chemical tracer
Figure 16. Map showing images obtained from the analysis of the coherent scatter measurements on 30June 2002. The image in the figure corresponds to 2355 UT (AST + 4 hr).
A06321 LARSEN ET AL.: RADAR AND OPTICAL OBSERVATIONS OF QP
10 of 12
A06321
used to measure the winds was deployed along a morehorizontal trajectory than is typically the case in the regionwhere the sporadic E layer was located. The trail showedclear evidence of billow structure in the height range wherelarge wind shears were measured [Larsen et al., 2005]. Ourobservations do not exclude the possibility that the insta-bility in the work of Cosgrove and Tsunoda [2004] plays arole in generating some of the echo structures that areobserved; indeed, it may account for the slight bias in theobserved propagation directions. The observations show,however, that other processes associated with the neutraldynamics are important and probably dominant in deter-mining the orientation and propagation direction of the echolines or patches.[28] The QP echoes that we observed were localized, both
horizontally and in the vertical. The echo structures oftencovered only a fraction of the volume illuminated by theCSR, so that the picture that emerges is one with largerpatches with smaller-scale periodic echo structures embed-ded in those patches. As discussed in more detail by Hysellet al. [2004], use of the loci of perpendicularity is notsufficient to determine the altitude where the echoes orig-inate. In that study, interferometry was used to show that thecoherent echoes on 14 June were located in a relativelynarrow range of altitudes that showed a general correspon-dence to but not an exact relation with the loci of perpen-dicularity (see their Figure 10 and 13). The observationsfrom the additional nights presented here are consistent withthose results in that the echoes appear to originate within thealtitude range of enhanced electron densities associated withthe sporadic E layer. In a recent study, Saito et al. [2006]detected echoes above 120-km altitude that occurred whenQP structures were present, but the echoes were weak andthe source of the echoes is not completely clear since theyoccur in an altitude range where the plasma densities areexpected to be small.[29] The observations presented here also show a close
relationship between the uplift in the ionization layermeasured with the ISR and the occurrence of coherentscatter echoes measured by the CSR.[30] What is the source of the echoes then? In the early
papers on the QP echo mechanism [e.g., Woodman et al.,1991; Tsunoda et al., 1994], the ordinary gradient driftinstability was discounted as a likely explanation becausethe high conductivity parallel to the oblique magnetic fieldlines will strongly couple locally stable and unstableregions. The spatial resonance or special geometry require-ments invoked in those early papers represented attempts toget around the coupling problem. More recent papers byHysell et al. [2002a, 2002b], Seyler et al. [2004], andRosado-Roman et al. [2004] have shown, however, thatthe simple picture is too limited and imposes unrealisticconstraints. For the strong coupling model, the large con-ductivities parallel to the magnetic field B imply no varia-tions along B and therefore wave numbers that are strictlyperpendicular to the magnetic field. An unstable layer that islocalized in height, however, requires that the wave numberspectrum has a small but finite component parallel to themagnetic field lines. The studies cited above have shownthat such solutions are not only possible but that the smallparallel k component actually enhances the overall growthrate. The range of wavelengths where such solutions are
possible is limited to a range with a large wavelength cut-offbecause of the more effective vertical electrical coupling atlarge spatial scales and a small wavelength cut-off due toviscous damping (see discussion in the work of Rosado-Roman et al. [2004], for example). This suggests thereforethat the initiation of the instability is the vertical displace-ment generated by neutral atmosphere motions. The insta-bilities then occur where the ionosphere is locally unstableto gradient drift instability but with unstable modes thathave a small but finite parallel wave number component.Since the components with a parallel wave number compo-nent have a higher growth rate, the instabilities that arelocalized in height are in fact also the instabilities that weshould expect to observe.
[31] Acknowledgments. M. F. Larsen was partially supported bythe National Science Foundation under grant ATM-0541593. D.L Hysellwas partially supported by the National Science Foundation under grantATM-0541526. The Arecibo Observatory is a major facility of the NationalAstronomy and Ionosphere Center, which is operated by Cornell Universityunder a cooperative agreement with the National Science Foundation.[32] Amitava Bhattacharjee thanks Peter Dyson and Susumu Saito for
their assistance in evaluating this paper.
ReferencesBernhardt, P. A. (2002), The modulation of sporadic-E layers by Kelvin-Helmholtz billows in the neutral atmosphere, J. Atmos. Sol.-Terr. Phys.,64, 1487–1504.
Cosgrove, R. B., and R. T. Tsunoda (2004), Instability of the E-F couplednighttime midlatitude ionosphere, J. Geophys. Res., 109, A04305,doi:10.1029/2003JA010243.
Hysell, D. L., and J. D. Burcham (1999), HF radar observations of quasi-periodic E layer echoes over North America, J. Geophys. Res., 104,4361–4371.
Hysell, D. L., M. Yamamoto, and S. Fukao (2002a), Simulations of plasmaclouds in the midlatitude E region ionosphere with implications fortype I and type II quasiperiodic echoes, J. Geophys. Res., 107(A10),1313, doi:10.1029/2002JA009291.
Hysell, D. L., M. Yamamoto, and S. Fukao (2002b), Imaging radar obser-vations and theory of type I and type II quasi-periodic echoes, J. Geo-phys. Res., 107(A11), 1360, doi:10.1029/2002JA009292.
Hysell, D. L., M. F. Larsen, and Q. H. Zhou (2004), Common volumecoherent and incoherent scatter radar observations of mid-latitude spora-dic E-layers and QP echoes, Ann. Geophys., 22, 3277–3290, doi:1432-0576/ag/2004-22-3277.
Kane, T., B. Grime, S. Franke, E. Kudeki, J. Urbina, M. Kelley, and S.Collins (2001), Joint observations of sodium enhancements and field-aligned ionospheric irregularities, Geophys. Res. Lett., 28, 1375–1378.
Larsen, M. F. (2000), A shear instability seeding mechanism for quasiper-iodic radar echoes, J. Geophys. Res., 105, 24,931–24,940.
Larsen, M. F., M. Yamamoto, S. Fukao, R. T. Tsunoda, and A. Saito (2005),Observations of neutral winds, wind shears, and wave structure during asporadic- E/QP event, Ann. Geophys., 23, 2369–2375, doi:1432-0576/ag/2005-23-2369.
Miller, K. L., and L. G. Smith (1978), Incoherent scatter radar observationsof irregular structure in mid-latitude sporadic E layers, J. Geophys. Res.,83, 3761–3775.
Pan, C. J., and M. F. Larsen (2000), Observations of QP radar echo struc-ture consistent with neutral wind shear control of the initiation mech-anism, Geophys. Res. Lett., 27, 867–870.
Riggin, D., W. E. Swartz, J. Providakes, and D. T. Farley (1986), Radarstudies of long-wavelength waves associated with mid-latitude sporadic Elayers, J. Geophys. Res., 91, 8011–8024.
Rosado-Roman, J. M., W. E. Swartz, and D. T. Farley (2004), Plasmainstabilities observed in the E region over Arecibo and a proposed non-local theory, J. Atmos. Sol.-Terr. Phys., 66, 1593–1602, doi:10.1016/j.jastp.2004.07.005.
Saito, S., M. Yamamoto, S. Fukao, M. Marumoto, and R. T. Tsunoda(2005), Radar observations of field-aligned plasma irregularities in theSEEK-2 campaign, Ann. Geophys., 23, 2307–2318, doi:1432-0576/ag/2005-23-2307.
Saito, S., M. Yamamoto, H. Hashiguchi, and A. Maegawa (2006), Obser-vation of three-dimensional structures of quasi-periodic echoes associatedwith mid-latitude sporadic-E layers by MU radar ultra-multi-channelsystem, Geophys. Res. Lett., 33, L14109, doi:10.1029/2005GL025526.
A06321 LARSEN ET AL.: RADAR AND OPTICAL OBSERVATIONS OF QP
11 of 12
A06321
Seyler, C. E., J. M. Rosado-Roman, and D. T. Farley (2004), A nonlocaltheory of the gradient-drift instability in the ionospheric E-region at mid-latitudes, J. Atmos. Sol.-Terr. Phys., 66, 1627–1637.
Taylor, M. J., S. H. Seo, T. Nakamura, T. Tsuda, H. Fukunishi, and Y.Takahashi (1998), Long base-line measurements of short-period meso-spheric gravity waves during the SEEK campaign, Geophys. Res. Lett.,25, 1797–1800.
Tsunoda, R. T., S. Fukao, and M. Yamamoto (1994), On the origin of quasi-periodic radar backscatter from mid-latitude sporadic E, Radio Sci., 29,349.
Woodman, R. F., M. Yamamoto, and S. Fukao (1991), Gravity wave mod-ulation of gradient drift instabilities in mid-latitude sporadic E irregula-rities, Geophys. Res. Lett., 18, 1197.
Yamamoto, M., S. Fukao, R. F. Woodman, T. Ogawa, T. Tsuda, and S. Kato(1991), Midlatitude E region field-aligned irregularities observed with theMU radar, J. Geophys. Res., 96, 15943–15949.
Yamamoto, M., S. Fukao, T. Ogawa, T. Tsuda, and S. Kato (1992), Amorphological study on mid-latitude E-region field-aligned irregularitiesobserved with the MU radar, J. Atmos. Terr. Phys., 54, 769.
�����������������������R. L. Bishop, The Aerospace Corporation, Los Angeles, CA, USA.J. Friedman, The Arecibo Observatory, Arecibo, Puerto Rico.D. L. Hysell, Earth and Atmospheric Sciences, Cornell University, Ithaca,
NY, USA.M. F. Larsen, Department of Physics and Astronomy, Clemson
University, Clemson, SC 29634, USA. ([email protected])S. M. Smith, Center for Space Physics, Boston University, Boston, MA,
USA.Q. H. Zhou, Electrical and Computer Engineering Department, Miami
University, Oxford, OH, USA.
A06321 LARSEN ET AL.: RADAR AND OPTICAL OBSERVATIONS OF QP
12 of 12
A06321