Satellite Data Estimation of Gas Flaring Volumes · Satellite Data Estimation of Gas Flaring...
41
Satellite Data Estimation of Gas Flaring Volumes July 12, 2012 Christopher D. Elvidge, Ph.D. Earth Observation Group NOAA National Geophysical Data Center Boulder, Colorado 80305 [email protected] Kimberly Baugh, Mikhail Zhizhin, Feng Chi Hsu Cooperative Institute for Research in the Environmental Sciences University of Colorado 1
Transcript of Satellite Data Estimation of Gas Flaring Volumes · Satellite Data Estimation of Gas Flaring...

Satellite Data Estimation of Gas Flaring Volumes
July 12, 2012
Christopher D. Elvidge, Ph.D. Earth Observation Group
NOAA National Geophysical Data Center Boulder, Colorado 80305 [email protected]
Kimberly Baugh, Mikhail Zhizhin, Feng Chi Hsu
Cooperative Institute for Research in the Environmental Sciences University of Colorado
1

Gas Flaring
2
• A widely used practice to dispose of natural gas in oil production areas that lack infrastructure to make productive use of the gas. • More common in remote locations and in impoverished countries. • Reporting is poor since this is a waste disposal process. • Satellite data sources have the potential for global systematic observation of flares and estimation of flared gas volume / CO2 emissions.

The remote sensing of flares is based on detection of their radiant emissions
3

Three U.S. Sensors Provide High Temporal Frequency Global Observations Relevant to Gas Flaring
• DMSP-OLS (U.S. Air Force Defense Meteorological Satellite Program – Operational Linescan System). Currently in use for gas flares. Only works for flares at night. 1994 to present.
• NASA MODIS (Moderate resolution Imaging Spectrometer). On two satellites ~ four observations per day. Has potential – but will require algorithm re-work for combustion sources and clouds. 2000 to present.
• NASA-NOAA VIIRS (Visible Infrared Imaging Radiometer Suite). Works best at night. NGDC is funded to develop a gas flare monitoring January 18, 2012.
4

U.S. Air Force Defense Meteorological Satellite Program (DMSP) Operational Linescan System (OLS). Polar orbiting 3000 km swath 2.7 km ground sample distance (GSD) Two spectral bands: visible and thermal Nightly global coverage Flown since 1972 Will continue till ~2015
Visible
Thermal

DMSP Cloud-free Annual Composites
• No sunlit data • No solar contaminated data (from over horizon) • No moonlit data • Center half of swath • Exclude clouds
6

DMSP - Tracking Annual Coverages
7
DMSP - Tracking Cloud-Free Coverages
8

DMSP Average lights_x_pct A standardized global product
9

Nigeria F162004 = Red F141998 = Green F101992 = Blue Vectors drawn on gas flares.
Our primary data source has been global cloud-free composites of nighttime lights processed from data acquired from the Defense Meteorological Satellite Program (DMSP). Flares appears as large colored circles of light in red, green, blue composites.

EEZ Vectors Are Used to Allocate Offshore Gas Flares
11

Google Earth used to confirm the identity of flares
and label false detections
12

Global B
CM
Google Earth used to confirm the identity of flares

DMSP Intercalibration • PROBLEM: How to compare digital numbers
obtained from multiple satellites over time without on-board calibration?
• CURRENT APPROACH: Identify a set of stable sources and adjust all observations to match when viewing these sources.
• STABLE SOURCE: The Island of Sicily – “Frozen in time”.
14

DMSP - Why Intercalibrate
15

DMSP - Intercalibration
• Other locations were investigated, but Sicily worked best.
• All data were intercalibrated to F12 observations of Sicily in 1999.
1994 1999 2007
16

DMSP Intercalibration 2nd Order Regression
17
Intercalibration by Comparison to F12 1999 Sicily
F121
999
F152006

DMSP - Convergence Indicates Intercalibration is Working
18

DMSP - Calibration to Estimate Flared Gas Volumes
19

Example of Country Result
0
1
2
3
4
5
6
7
8
Estim
ated
Gas
Fla
red
(BCM
)
Angola
F12 BCM
F14 BCM
F15 BCM
F16 BCM
F18 BCM

DMSP - Global Estimates of Flared Gas Volume
21

Top Twenty Flaring Countries - 2011
22
0
5
10
15
20
25
30
35
40
Gas
Fla
red
[BCM
]
2011
2010

• Coarse spatial resolution of the OLS
2.7 km GSD 5+ km GIFOV • OLS lights are larger
than sources on the ground
• “Overglow” surrounds bright sources
• No visible band calibration
• 6 bit quantization • Urban centers saturate
in operational data • No 3-5 um band for fires
Shortcomings of DMSP Nighttime Lights
Contrast enhanced to show dim lighting

NASA MODIS • The MODIS fire detection algorithm is based on data values from two thermal bands and has
been designed to minimize false detections: T4>310 K and T4−T11 > 10 K. • MODIS data are radiometrically calibrated and tend not to saturate when fires are observed,
allowing for the calculation of brightness temperatures for fires and flares. • MODIS has dedicated fire bands which can distinguish gas flares from anthropogenic lighting
(i.e. cities) that are not resolved in the DMSP data. • With MODIS data thermal anomalies can be detected day or night with no seasonal
restrictions (other than cloud cover). • MODIS fire detections are not affected by lunar conditions or solar contamination, which
reduce the number of usable observations in DMSP data. • NASA collects both daytime and nighttime data from two satellites (TERRA and AQUA),
making it possible to observe gas flares at four different times during the day (morning, afternoon, mid-evening, and after midnight).
• It is possible that flaring could be manipulated to avoid detection by the DMSP, which has an overpass time of approximately 19:30 local time. This would be significantly more difficult with the four overpasses per day of MODIS (i.e. Terra and Aqua, each with a morning and night overpass).
• MODIS collects data at somewhat higher spatial resolution than DMSP (1 km versus 2.7 km).

MOD14 Data Product
Firemask Values
0-2: not processed
3: water 4: cloud 5: no fire 6: unknown 7-9: fires, low->high confidence
MODIS Band 22 (4um) MOD14 Firemask
Subset of Granule MYD14.A2009013.1010.005.2009014064727.hdf
Hotspots in MODIS 4um channel In Persian Gulf are not processed for fire detection.
Hotspots in MODIS 4um channel not tagged as fires indicating the conservative nature of NASA’s fire detection algorithm.
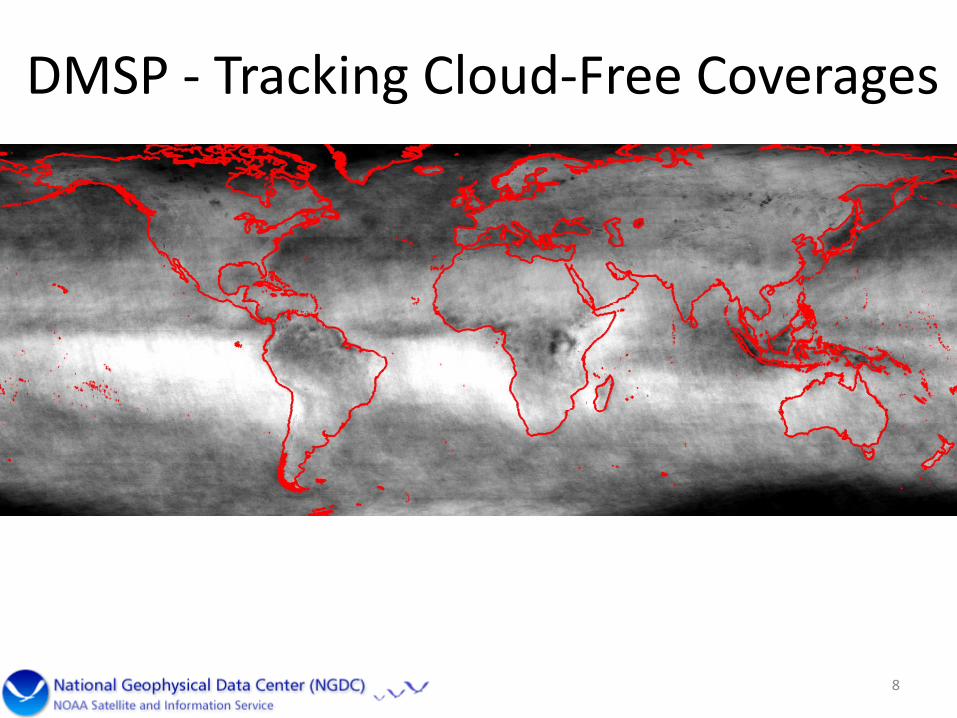
Problems with using the MODIS fire product for flares
• Offshore regions and lakes are not processed – thus there is no detection of offshore flaring or flares present in lakes (e.g. in places like Siberia).
• The MOD14 skips over many flares that can be seen visually in the thermal band imagery. This results in an under sampling of the available signal coming from gas flares. The MOD14 algorithm was developed for operational near real time detection of fires, for use by land and forest managers who deal with fires. The settings are intentionally conservative to avoid “false alarms” in the detection of fires.
• The MOD14 rarely detects flares with annual BCM levels under 0.2 BCM. • With the constraint of only using land based reference data (reported BCM) for individual
flares and countries leaves the calibration for estimation of gas flaring volumes sparse when compared to DMSP.
• We found a set of flares yielding unrealistically high BCM estimates (greater than three BCM) using the MOD14 composites. Most of these “monster flares” have unusually high percent frequencies of detection (PCT), which pushes their average fire radiative power times PCT values to unrealistically high levels. The problem is that the reference data are skewed toward small flares that are frequently not detected.
• The MODIS cloud product over detects clouds on flares.
26
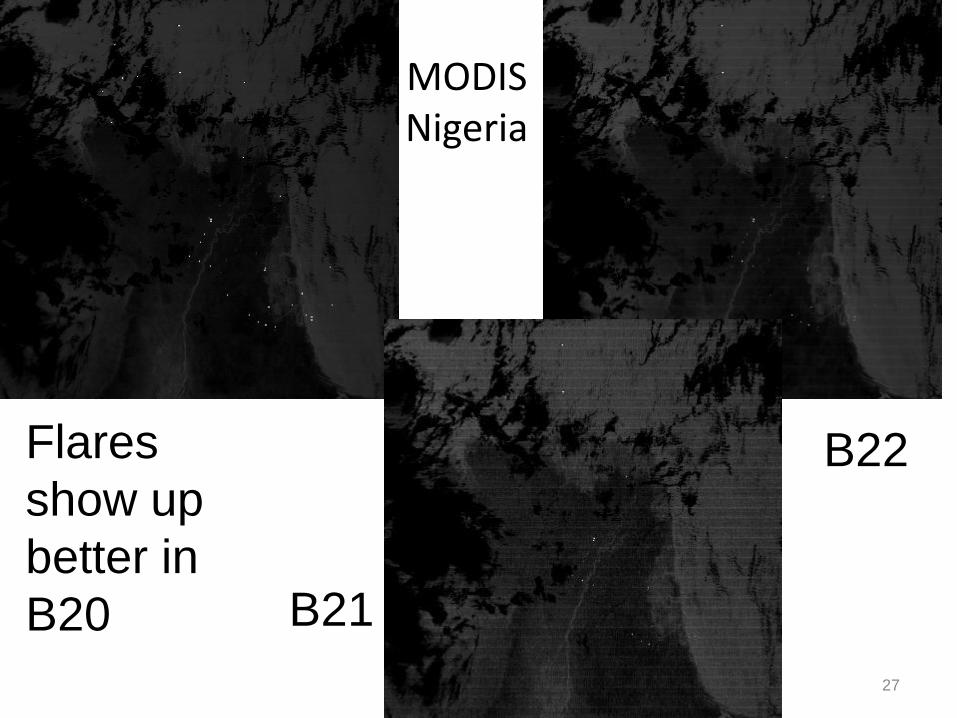
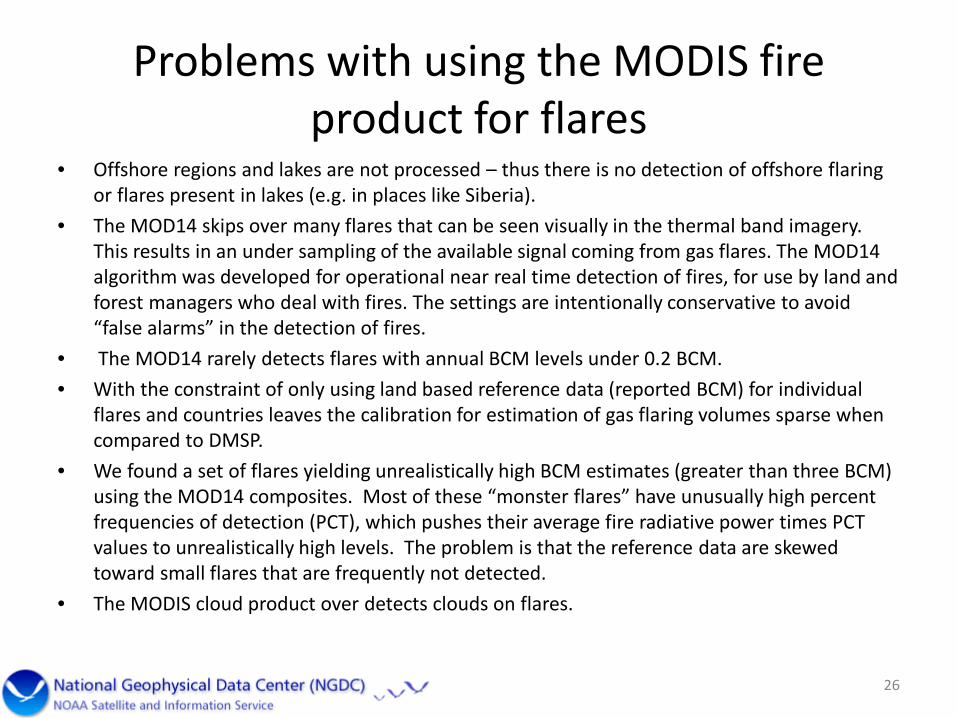
MODIS Nigeria
27
Flares show up better in B20 B21
B22

MODIS B22 minus B31
28

MODIS B20 minus B22
29
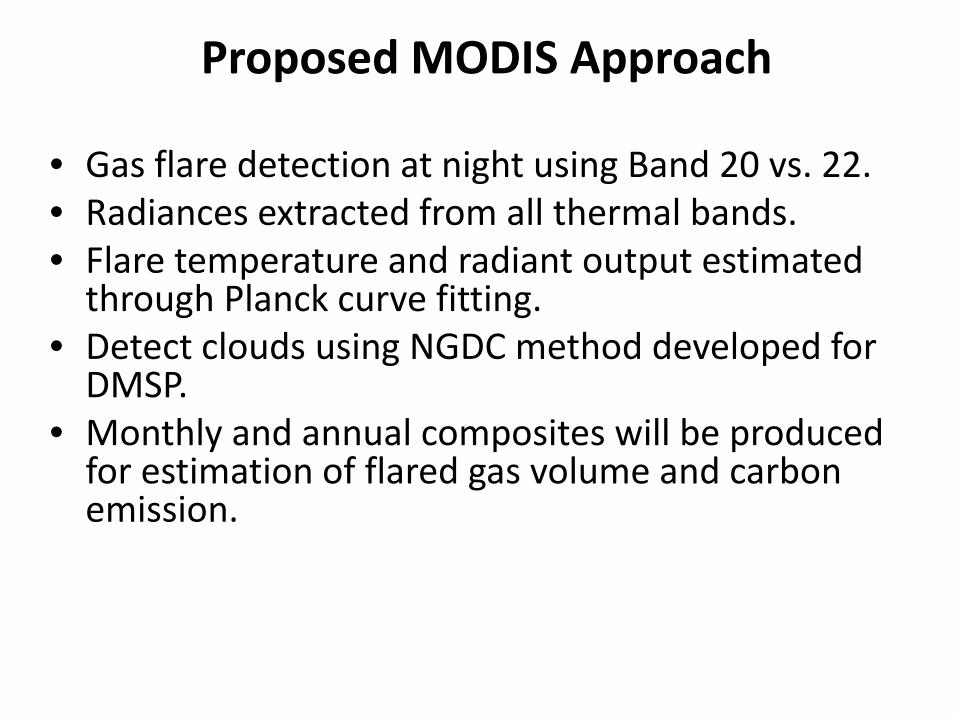
Proposed MODIS Approach
• Gas flare detection at night using Band 20 vs. 22. • Radiances extracted from all thermal bands. • Flare temperature and radiant output estimated
through Planck curve fitting. • Detect clouds using NGDC method developed for
DMSP. • Monthly and annual composites will be produced
for estimation of flared gas volume and carbon emission.


VIIRS - Persian Gulf May 3, 2012 Flares show up as “hotspot” in M12 (3.7 um) and M13 (4 um)
M12 M13 – the standard fire band

VIIRS - Persian Gulf May 3, 2012 Many more flares show up as “hotspot” in M10 (1.61 um)
M10 – more detections Less clutter – gas flares are Hotter than biomass burning
M13 – the standard fire band

VIIRS - At Night Gas Flares Can Be Detected in Four Short Wavelength Bands
DNB 0.7 um M7 0.865 um M8 1.24 um M10 1.61 um

VIIRS Approach
• Gas flare detection at night using the M10 band • Radiances extracted from DNB, M7,8,10,12,13,14,15,16. • Flare temperature and radiant output estimated through
Planck curve fitting • Daily summaries will be distributed as kml for display in
Google Earth • Monthly and annual composites will be produced for
estimation of flared gas volume and carbon emission

VIIRS June 17, 2012 IR-sources

VIIRS June 17, 2012 IR-sources
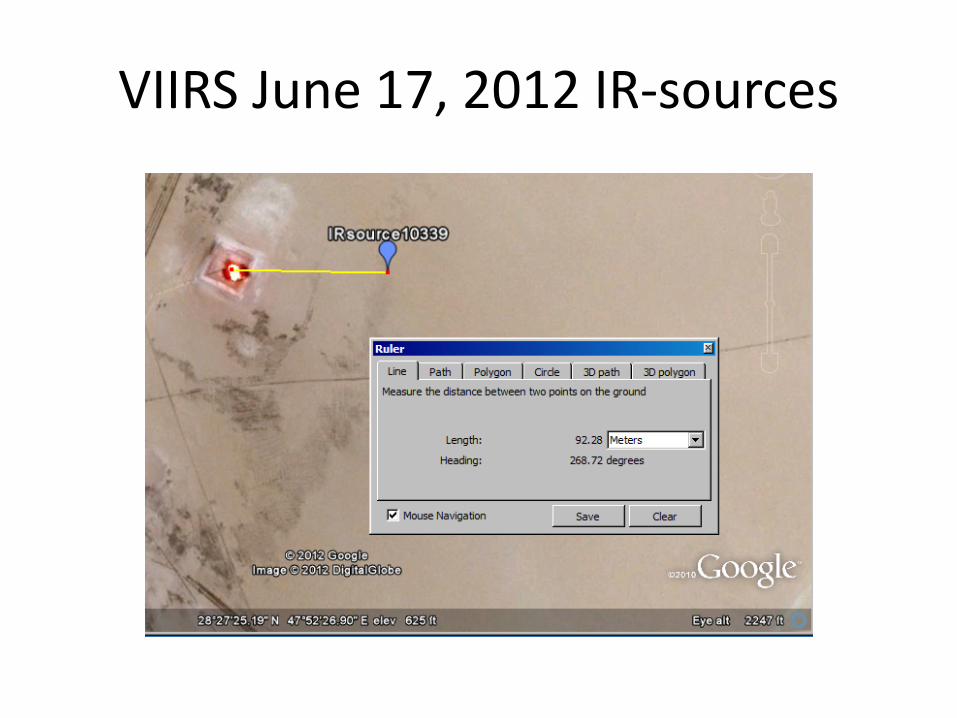
VIIRS June 17, 2012 IR-sources

• Simultaneous fitting assuming a hot source and a cooler background
– Use observed radiances from M7,8,10,12,13,14,15,16
– Solve of flare and background temperatures and magnitudes simultaneously
– Variables: TFLR, TBG, εFLR, εBG • Pros
– No external background pixel required – Possibility to remove BG values – Accommodates high intensity flares with
emission in M14-16 – Error can be estimated relative to observed
radiances – May be used to filter South Atlantic Anomaly
noise? • Cons
– Constraints are required to guide the solutions – Poor performance expected for low intensity
detections that lack detectable emission in M7-8
Flare Radiation
Background Radiation
Modeled Radiant Emissions
VIIRS Estimating Flare Temperature and Radiant Output
* = observed radiances

VIIRS Cloud Algorithm Identifies Flares as Cloud
M10 Basra, Iraq M13 Cloud mask Cloud optical thickness
Spectral confusion between clouds and gas flares

Summary • NGDC has produced an 18 year record of global gas
flaring (1994-2011). • Deriving a similar record from MODIS (2000-present) will
require a re-work of both the fire and cloud detection algorithms and a reprocessing of the MODIS archive. NGDC is working on the new algorithms.
• VIIRS provides substantial improvements over both DMSP and MODIS for global observation of gas flaring, but will also require a re-work of the fire and cloud detection algorithms.
• NGDC is funded to develop a gas flare monitoring system for VIIRS.