SAP Visual Intelligence - websmp105.sap-ag.desapidp/... · SAP Visual Intelligence is part of a...
39
Welcome to this executive summary of SAP Visual Intelligence. SAP Visual Intelligence inspires your business by providing the fastest, most engaging way of discovering answers from any data, through an interactive and visual experience. 1
-
Upload
hoangthien -
Category
Documents
-
view
238 -
download
0
Transcript of SAP Visual Intelligence - websmp105.sap-ag.desapidp/... · SAP Visual Intelligence is part of a...
Welcome to this executive summary of SAP Visual Intelligence.
SAP Visual Intelligence inspires your business by providing the fastest, most
engaging way of discovering answers from any data, through an interactive and
visual experience.
1
<no narration for this slide>
2
After completing this lesson, you will be able to:
Define the data discovery vision
Describe market trends and customer pain points
Identify who has purchasing power for data discovery solutions
Explain how SAP Visual Intelligence fits into the Analytics portfolio
Explain how the capabilities, components, and benefits of Visual Intelligence
help customers to achieve their business goals and address their pain points
Ignite Creative Ideas with SAP Visual Intelligence
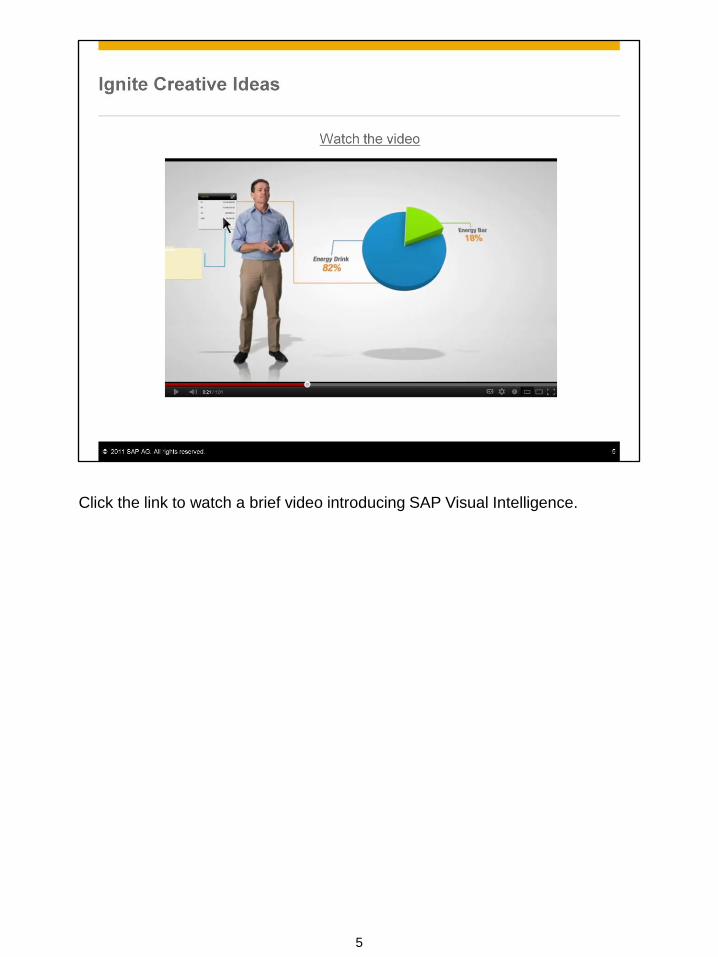
Click the link to watch a brief video introducing SAP Visual Intelligence.
5
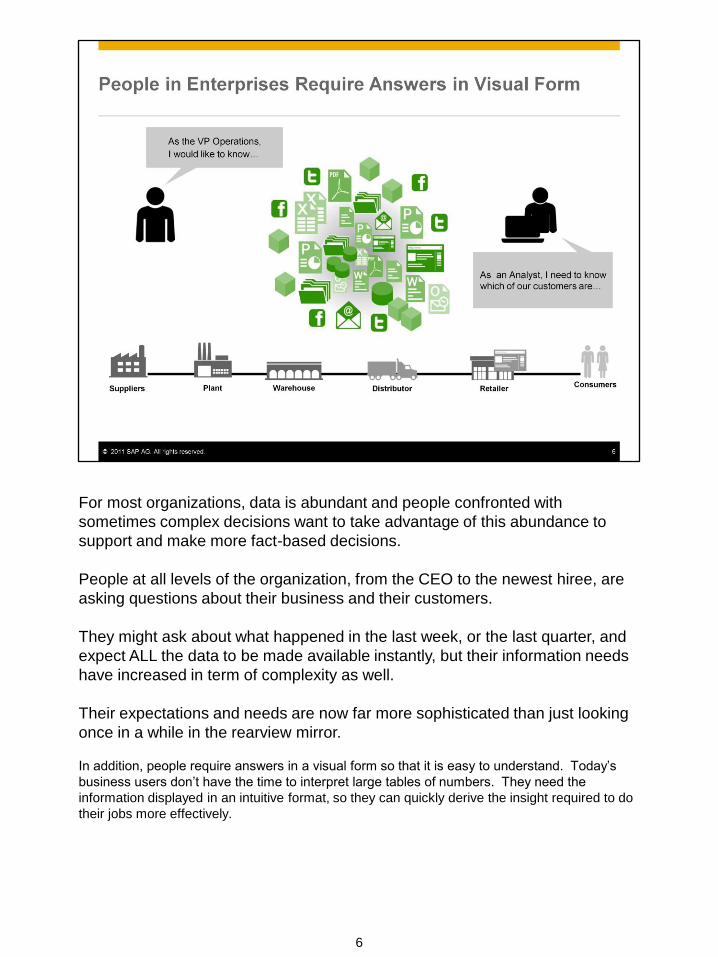
For most organizations, data is abundant and people confronted with
sometimes complex decisions want to take advantage of this abundance to
support and make more fact-based decisions.
People at all levels of the organization, from the CEO to the newest hiree, are
asking questions about their business and their customers.
They might ask about what happened in the last week, or the last quarter, and
expect ALL the data to be made available instantly, but their information needs
have increased in term of complexity as well.
Their expectations and needs are now far more sophisticated than just looking
once in a while in the rearview mirror.
In addition, people require answers in a visual form so that it is easy to understand. Today’s
business users don’t have the time to interpret large tables of numbers. They need the
information displayed in an intuitive format, so they can quickly derive the insight required to do
their jobs more effectively.
6
Today organizations and lines of business have the following challenges:
• Business users and departmental users often don’t have access to the raw
enterprise data that is managed by IT.
• Line of business users often have their own data sources that are not
connected to the enterprise data.
Business users often need to explore and visualize this data to make more
effective decisions.
• Often users need to combine these departmental or personal data sources
with data from enterprise sources to get a complete picture. However, today
power users and analysts don’t have the tools they need to merge and
manipulate these data sources without depending on IT.
These issues create bottlenecks with impede the analysis required by the
business.
SAP Visual Intelligence customers have an opportunity to take strategic
advantage of this data.
7
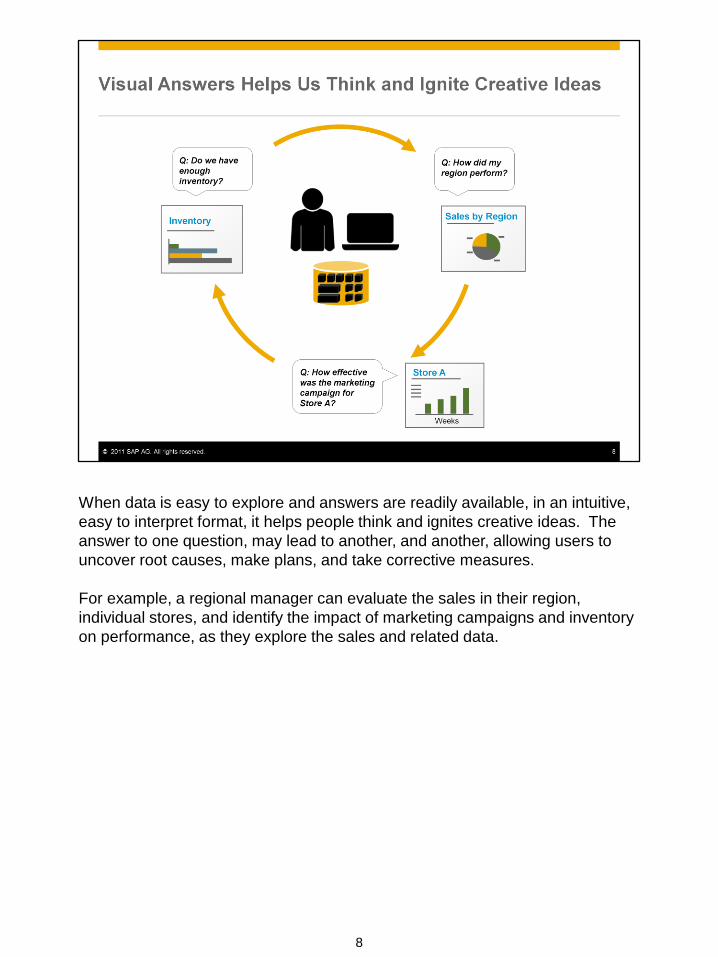
When data is easy to explore and answers are readily available, in an intuitive,
easy to interpret format, it helps people think and ignites creative ideas. The
answer to one question, may lead to another, and another, allowing users to
uncover root causes, make plans, and take corrective measures.
For example, a regional manager can evaluate the sales in their region,
individual stores, and identify the impact of marketing campaigns and inventory
on performance, as they explore the sales and related data.
8
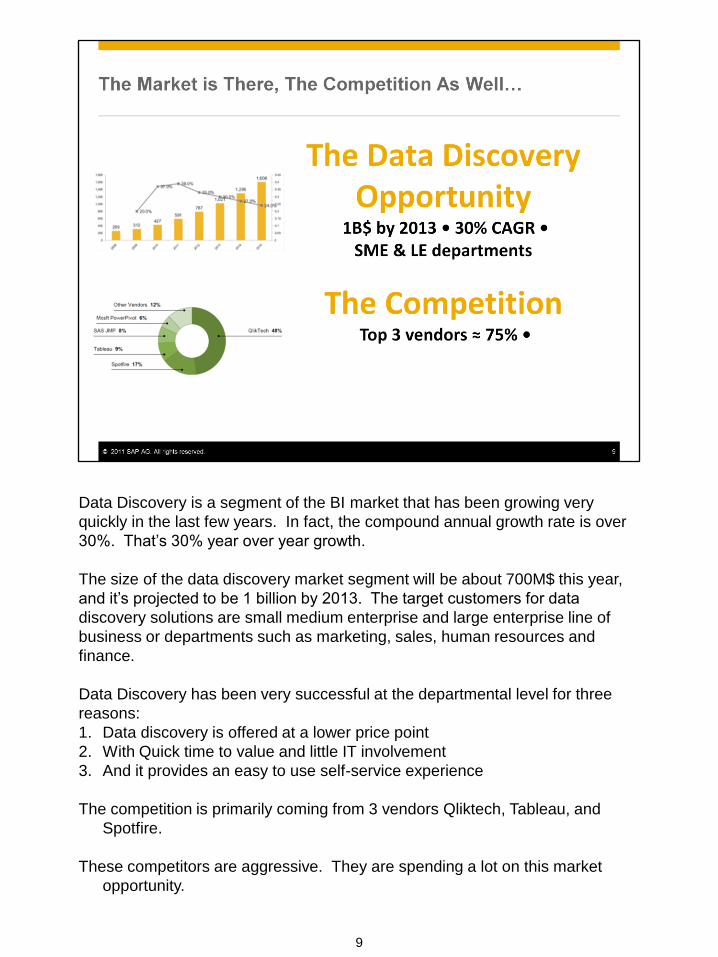
Data Discovery is a segment of the BI market that has been growing very
quickly in the last few years. In fact, the compound annual growth rate is over
30%. That’s 30% year over year growth.
The size of the data discovery market segment will be about 700M$ this year,
and it’s projected to be 1 billion by 2013. The target customers for data
discovery solutions are small medium enterprise and large enterprise line of
business or departments such as marketing, sales, human resources and
finance.
Data Discovery has been very successful at the departmental level for three
reasons:
1. Data discovery is offered at a lower price point
2. With Quick time to value and little IT involvement
3. And it provides an easy to use self-service experience
The competition is primarily coming from 3 vendors Qliktech, Tableau, and
Spotfire.
These competitors are aggressive. They are spending a lot on this market
opportunity.
9
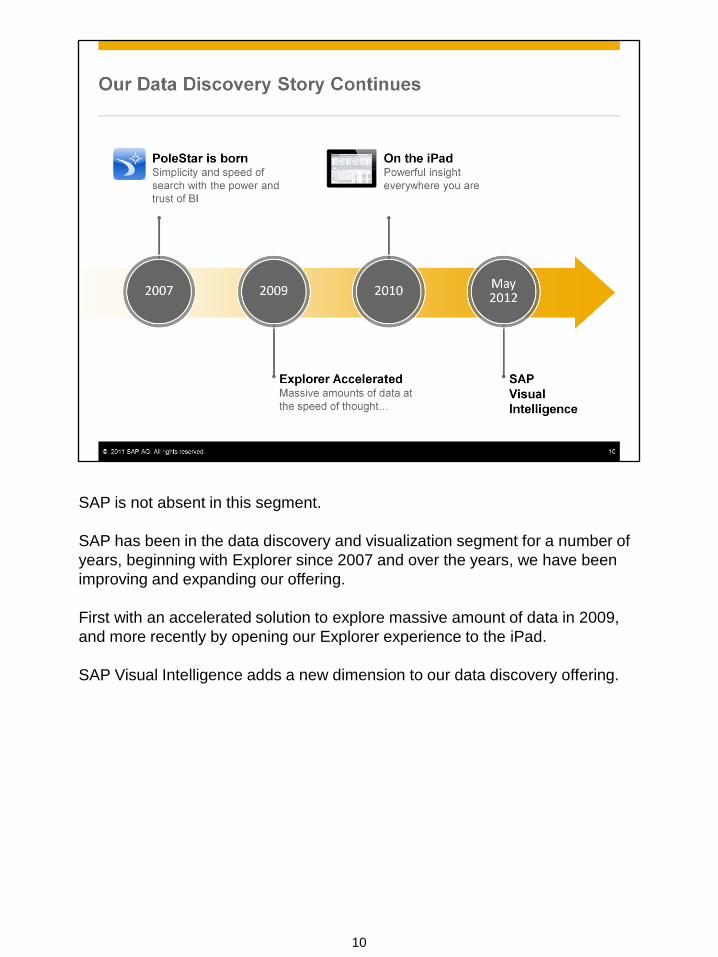
SAP is not absent in this segment.
SAP has been in the data discovery and visualization segment for a number of
years, beginning with Explorer since 2007 and over the years, we have been
improving and expanding our offering.
First with an accelerated solution to explore massive amount of data in 2009,
and more recently by opening our Explorer experience to the iPad.
SAP Visual Intelligence adds a new dimension to our data discovery offering.
10
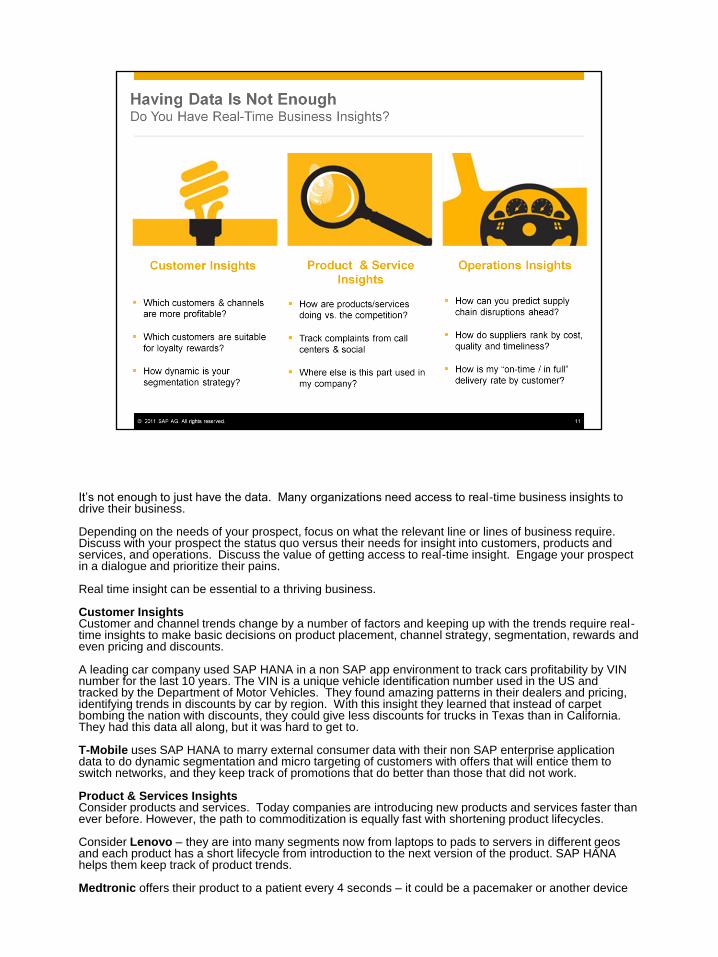
It’s not enough to just have the data. Many organizations need access to real-time business insights to drive their business. Depending on the needs of your prospect, focus on what the relevant line or lines of business require. Discuss with your prospect the status quo versus their needs for insight into customers, products and services, and operations. Discuss the value of getting access to real-time insight. Engage your prospect in a dialogue and prioritize their pains. Real time insight can be essential to a thriving business. Customer Insights Customer and channel trends change by a number of factors and keeping up with the trends require real-time insights to make basic decisions on product placement, channel strategy, segmentation, rewards and even pricing and discounts. A leading car company used SAP HANA in a non SAP app environment to track cars profitability by VIN number for the last 10 years. The VIN is a unique vehicle identification number used in the US and tracked by the Department of Motor Vehicles. They found amazing patterns in their dealers and pricing, identifying trends in discounts by car by region. With this insight they learned that instead of carpet bombing the nation with discounts, they could give less discounts for trucks in Texas than in California. They had this data all along, but it was hard to get to. T-Mobile uses SAP HANA to marry external consumer data with their non SAP enterprise application data to do dynamic segmentation and micro targeting of customers with offers that will entice them to switch networks, and they keep track of promotions that do better than those that did not work. Product & Services Insights Consider products and services. Today companies are introducing new products and services faster than ever before. However, the path to commoditization is equally fast with shortening product lifecycles. Consider Lenovo – they are into many segments now from laptops to pads to servers in different geos and each product has a short lifecycle from introduction to the next version of the product. SAP HANA helps them keep track of product trends. Medtronic offers their product to a patient every 4 seconds – it could be a pacemaker or another device
implanted in the body. Customer complaints from all sources (emails, web,
hospital, patient and physical calls) are analyzed in real-time (correlating them
with production dates, supplier parts used etc.) so that they keep one step
ahead with the problems and address them proactively and in complete
transparency with regulatory bodies and patients.
Caterpillar customizes a large volume of heavy construction equipment. By
utilizing analytics for routinely ordered combinations they can speed up the
process by providing standardized offerings. Also in R&D by doing parts
analysis (e.g. where else is this part used or “the reverse BOM (bill of material)
problem”) to understand reuse and reduce the number of variants.
Operations Insights
Think about Operations. Business happens in real-time – macro disruptions
like the Japanese earthquake or Thailand floods will affect your global supply
chain and pricing on commodities will fluctuate. Even micro or intra company
issues may require a proactive sense and respond mechanism – for example
a dynamic picking and packing process on the production line optimized by
delivery schedule (Charmers Sunbelt – a leading wholesale distributor of
alcoholic beverages).
11
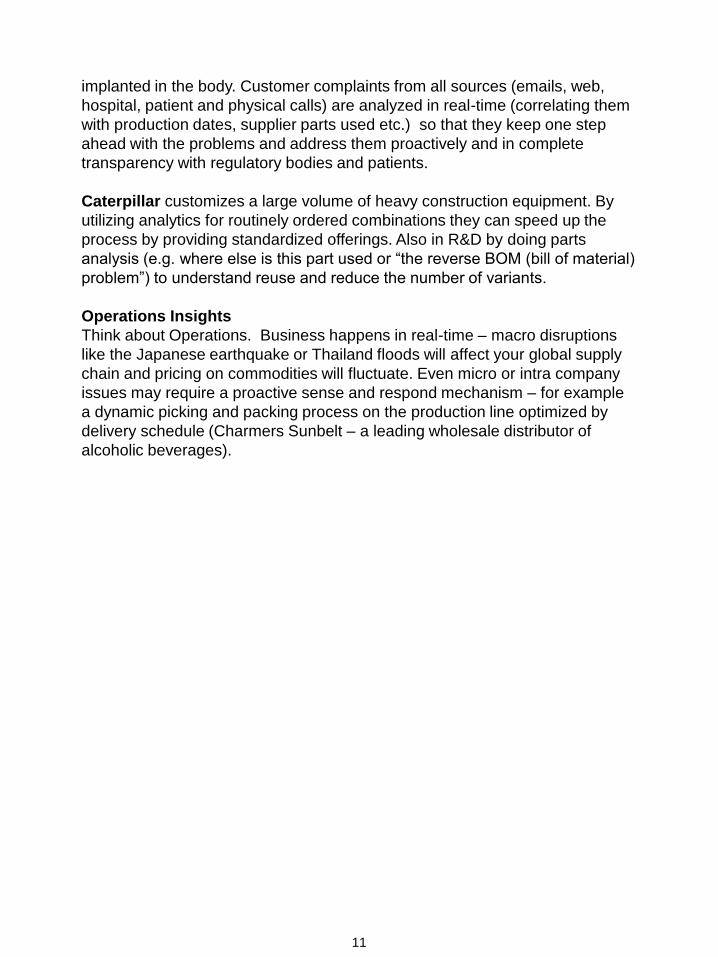
SAP BusinessObjects Explorer is a business intelligence client designed for all
business people – from a manager who wishes to swipe, tap, and zoom to get
the answers they need to the analysts who want to mash up all kinds of data
and create beautiful analytics
SAP BusinessObjects Explorer provides a fast and engaging way of
discovering answers from any data – from spreadsheets, enterprise data, and
Big Data.
Users can work on their own, or in collaboration with the entire department,
using a desktop or a tablet, online or offline, without having to wait for IT to get
answers.
12
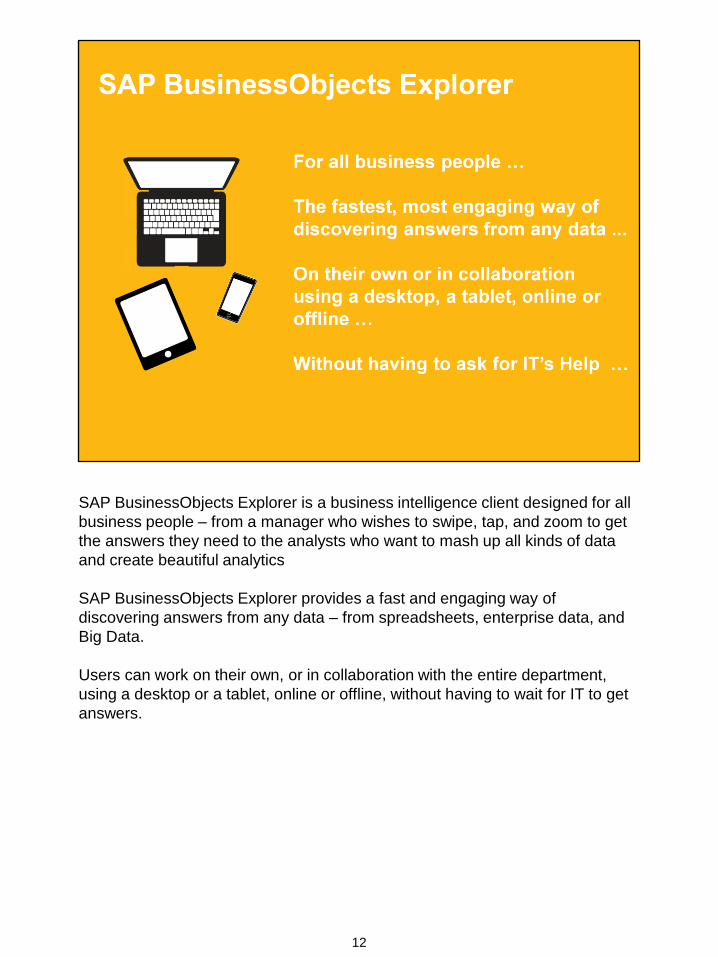
SAP Visual Intelligence expands the capabilities of SAP BusinessObjects
Explorer, by providing the tools that business analysts need to acquire, merge,
and manipulate corporate and personal data – big or small, without depending
on IT.
13
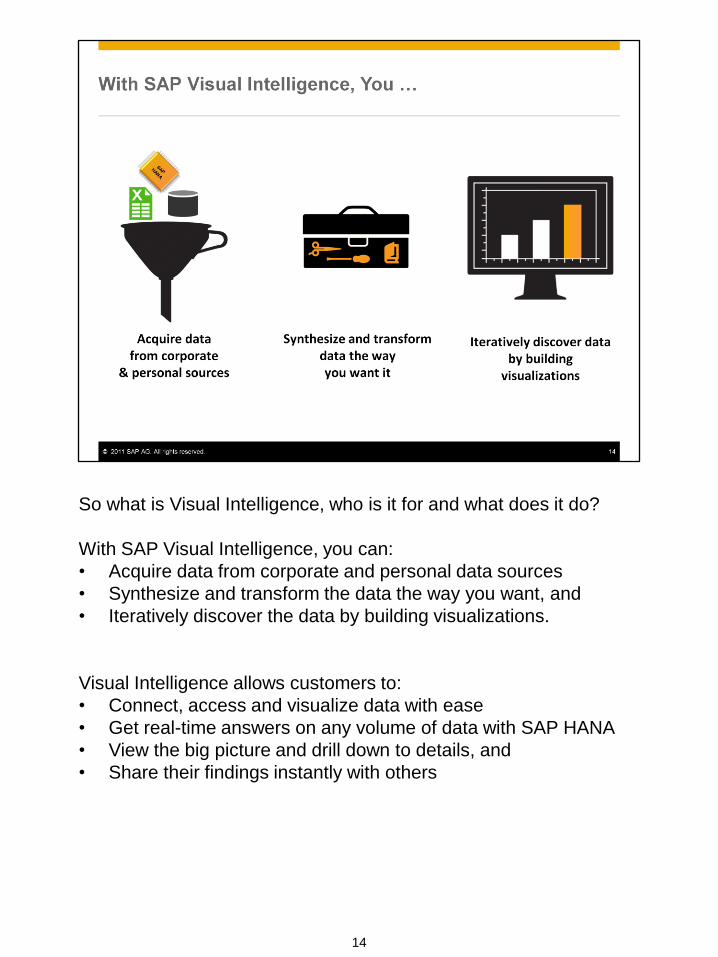
So what is Visual Intelligence, who is it for and what does it do?
With SAP Visual Intelligence, you can:
• Acquire data from corporate and personal data sources
• Synthesize and transform the data the way you want, and
• Iteratively discover the data by building visualizations.
Visual Intelligence allows customers to:
• Connect, access and visualize data with ease
• Get real-time answers on any volume of data with SAP HANA
• View the big picture and drill down to details, and
• Share their findings instantly with others
14
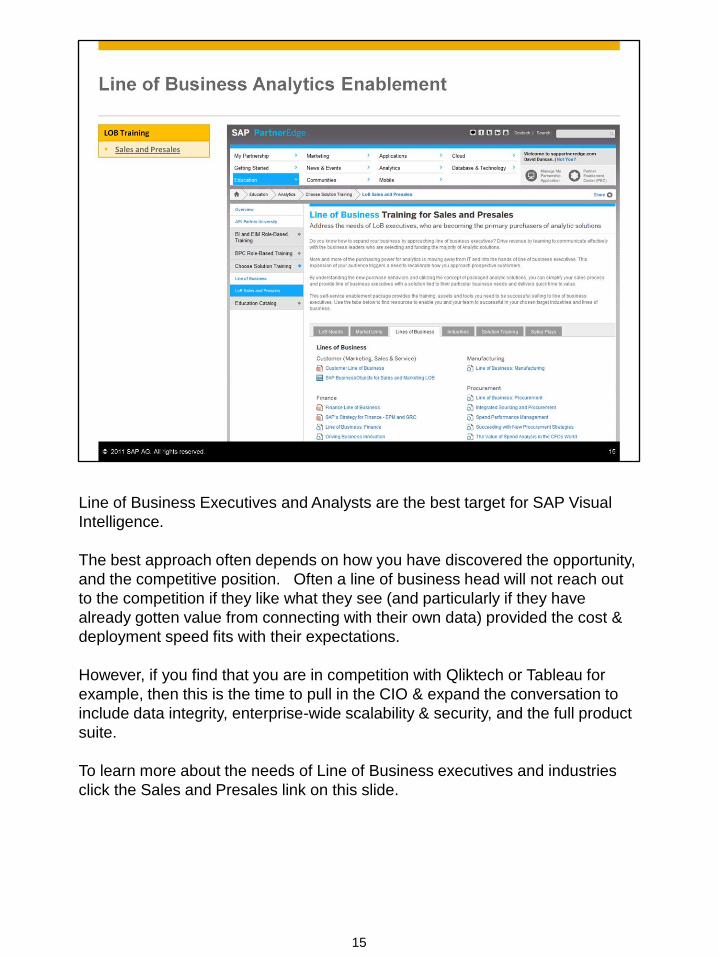
Line of Business Executives and Analysts are the best target for SAP Visual
Intelligence.
The best approach often depends on how you have discovered the opportunity,
and the competitive position. Often a line of business head will not reach out
to the competition if they like what they see (and particularly if they have
already gotten value from connecting with their own data) provided the cost &
deployment speed fits with their expectations.
However, if you find that you are in competition with Qliktech or Tableau for
example, then this is the time to pull in the CIO & expand the conversation to
include data integrity, enterprise-wide scalability & security, and the full product
suite.
To learn more about the needs of Line of Business executives and industries
click the Sales and Presales link on this slide.
15
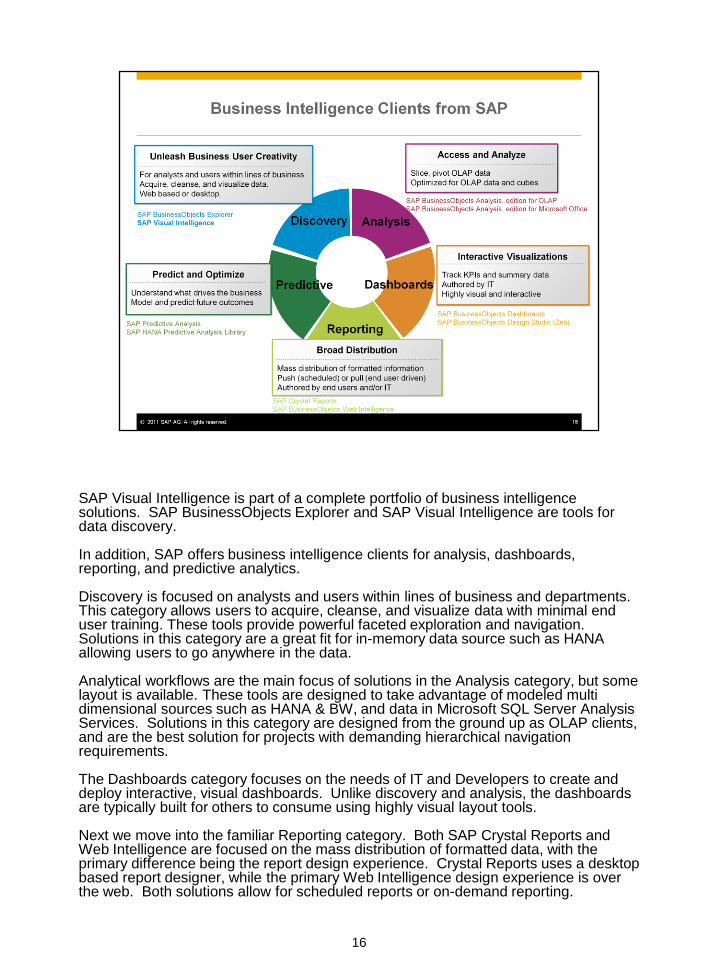
SAP Visual Intelligence is part of a complete portfolio of business intelligence solutions. SAP BusinessObjects Explorer and SAP Visual Intelligence are tools for data discovery. In addition, SAP offers business intelligence clients for analysis, dashboards, reporting, and predictive analytics. Discovery is focused on analysts and users within lines of business and departments. This category allows users to acquire, cleanse, and visualize data with minimal end user training. These tools provide powerful faceted exploration and navigation. Solutions in this category are a great fit for in-memory data source such as HANA allowing users to go anywhere in the data. Analytical workflows are the main focus of solutions in the Analysis category, but some layout is available. These tools are designed to take advantage of modeled multi dimensional sources such as HANA & BW, and data in Microsoft SQL Server Analysis Services. Solutions in this category are designed from the ground up as OLAP clients, and are the best solution for projects with demanding hierarchical navigation requirements. The Dashboards category focuses on the needs of IT and Developers to create and deploy interactive, visual dashboards. Unlike discovery and analysis, the dashboards are typically built for others to consume using highly visual layout tools. Next we move into the familiar Reporting category. Both SAP Crystal Reports and Web Intelligence are focused on the mass distribution of formatted data, with the primary difference being the report design experience. Crystal Reports uses a desktop based report designer, while the primary Web Intelligence design experience is over the web. Both solutions allow for scheduled reports or on-demand reporting.
16
Finally we have the Predictive category. The solutions in this category include
SAP Predictive Analysis.
Our Analytics portfolio also includes solutions for Enterprise Performance
Management, Governance Risk and Compliance, Analytic Applications and
Rapid Deployment Solutions. Our business intelligence and Analytics
solutions are integrated with our line of Application, Cloud, Mobile, and
Database & Technology offerings.
16
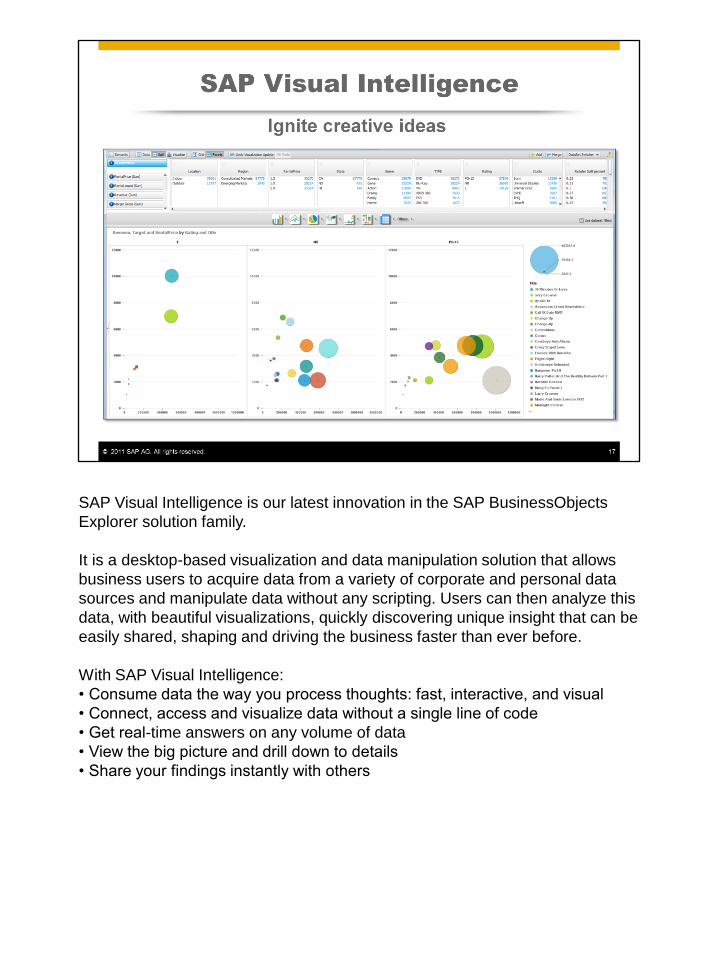
SAP Visual Intelligence is our latest innovation in the SAP BusinessObjects
Explorer solution family.
It is a desktop-based visualization and data manipulation solution that allows
business users to acquire data from a variety of corporate and personal data
sources and manipulate data without any scripting. Users can then analyze this
data, with beautiful visualizations, quickly discovering unique insight that can be
easily shared, shaping and driving the business faster than ever before.
With SAP Visual Intelligence:
• Consume data the way you process thoughts: fast, interactive, and visual
• Connect, access and visualize data without a single line of code
• Get real-time answers on any volume of data
• View the big picture and drill down to details
• Share your findings instantly with others
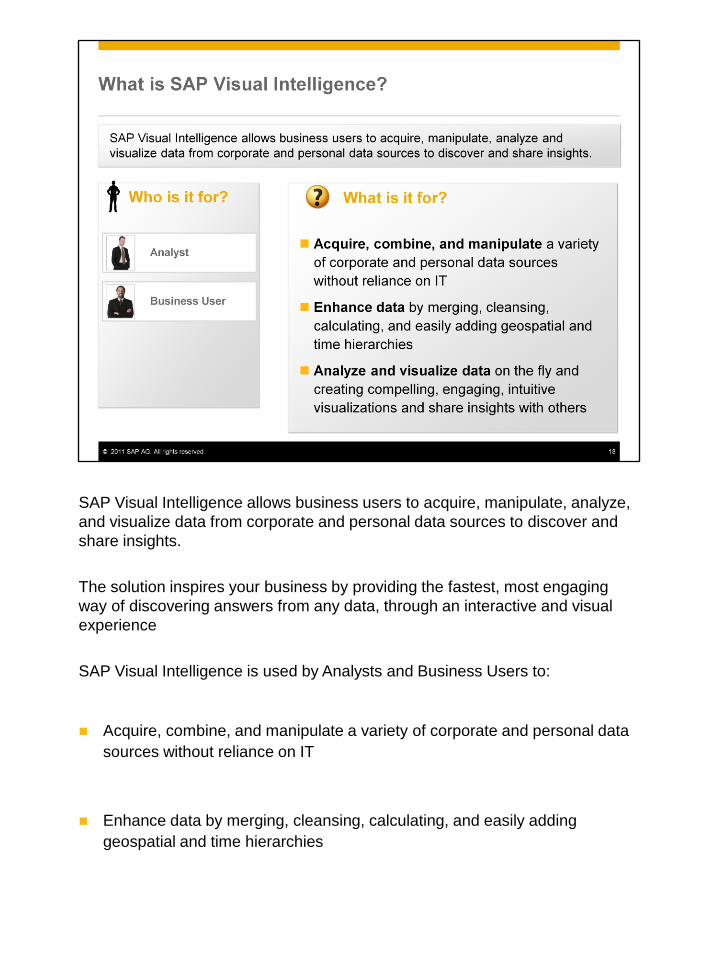
SAP Visual Intelligence allows business users to acquire, manipulate, analyze,
and visualize data from corporate and personal data sources to discover and
share insights.
The solution inspires your business by providing the fastest, most engaging
way of discovering answers from any data, through an interactive and visual
experience
SAP Visual Intelligence is used by Analysts and Business Users to:
Acquire, combine, and manipulate a variety of corporate and personal data
sources without reliance on IT
Enhance data by merging, cleansing, calculating, and easily adding
geospatial and time hierarchies

Analyze and visualize data on the fly and creating compelling, engaging,
intuitive visualizations and share insights with others
18
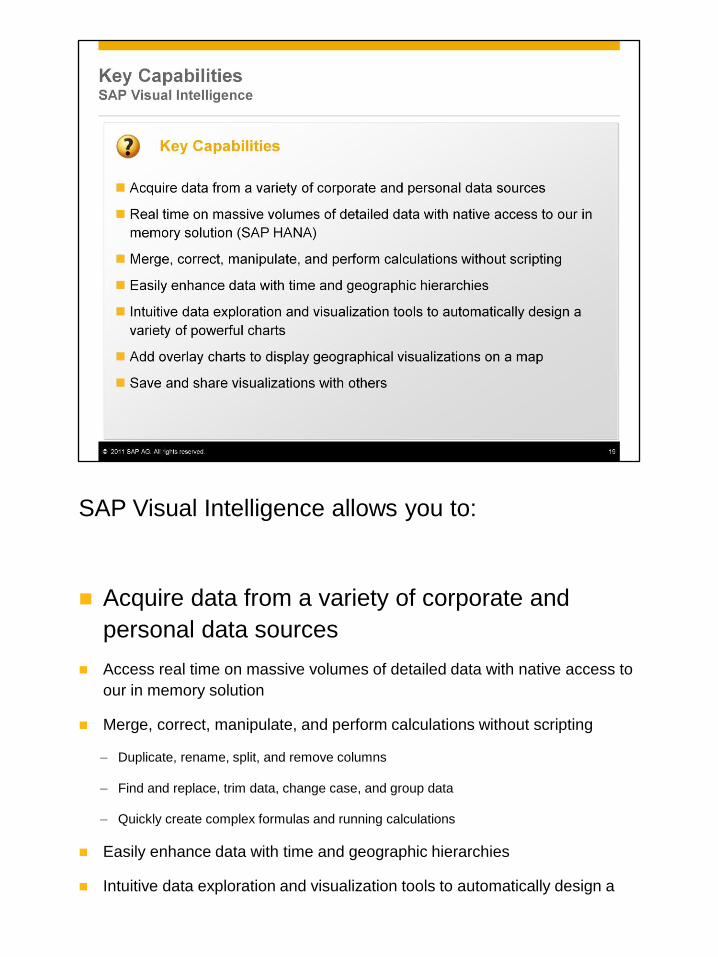
SAP Visual Intelligence allows you to:
Acquire data from a variety of corporate and
personal data sources
Access real time on massive volumes of detailed data with native access to
our in memory solution
Merge, correct, manipulate, and perform calculations without scripting
– Duplicate, rename, split, and remove columns
– Find and replace, trim data, change case, and group data
– Quickly create complex formulas and running calculations
Easily enhance data with time and geographic hierarchies
Intuitive data exploration and visualization tools to automatically design a

variety of powerful charts
Add overlay charts to display geographical
visualizations, such as pie charts on a map
Save and share visualizations with others
19
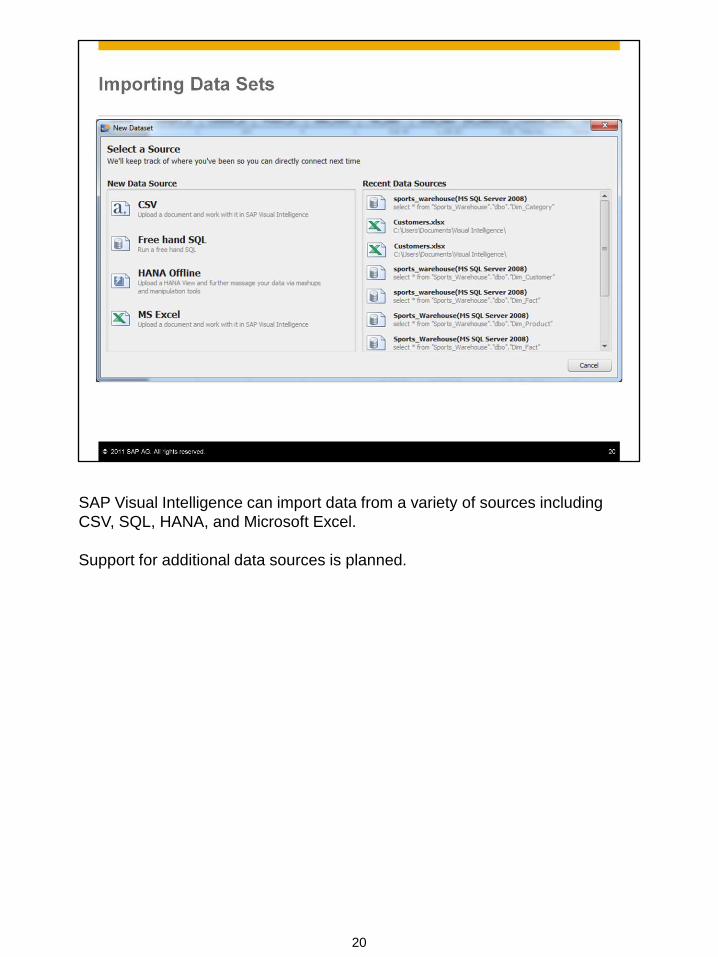
SAP Visual Intelligence can import data from a variety of sources including
CSV, SQL, HANA, and Microsoft Excel.
Support for additional data sources is planned.
20
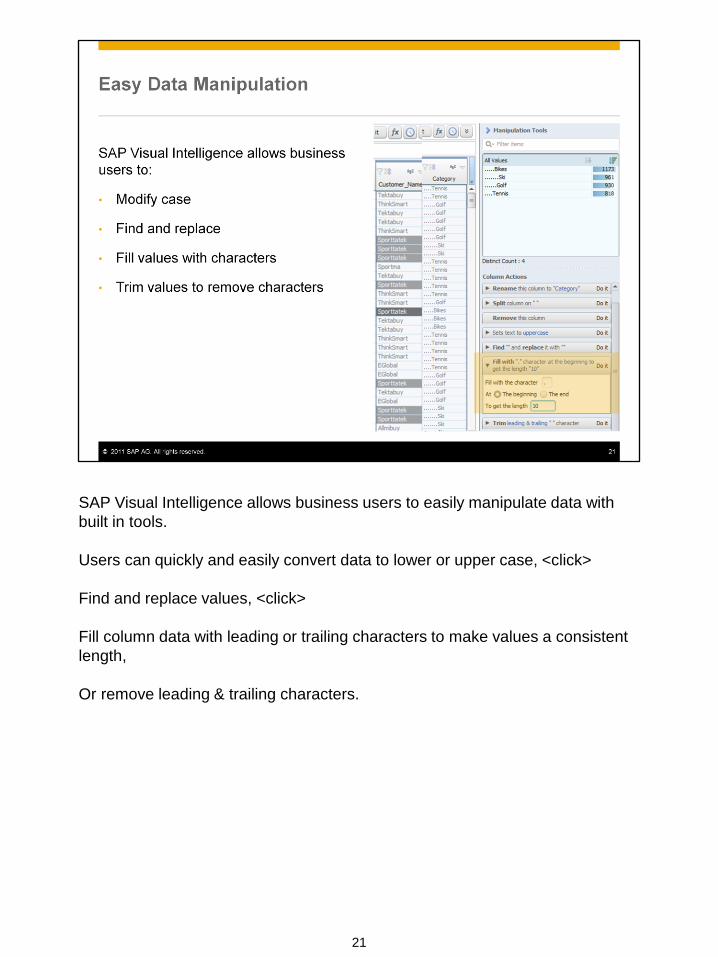
SAP Visual Intelligence allows business users to easily manipulate data with
built in tools.
Users can quickly and easily convert data to lower or upper case, <click>
Find and replace values, <click>
Fill column data with leading or trailing characters to make values a consistent
length,
Or remove leading & trailing characters.
21
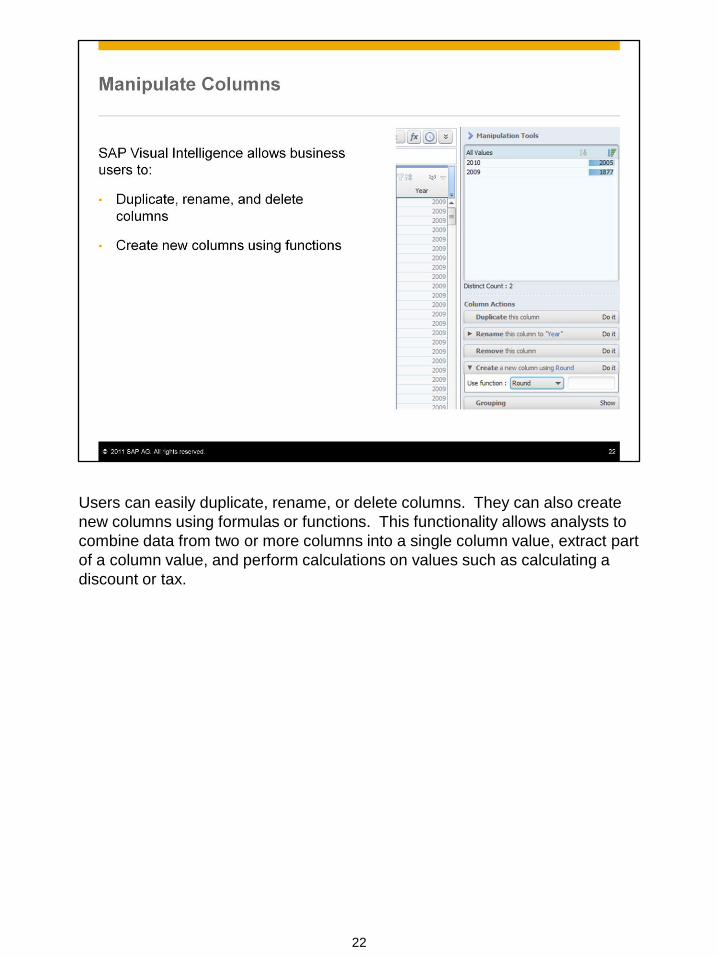
Users can easily duplicate, rename, or delete columns. They can also create
new columns using formulas or functions. This functionality allows analysts to
combine data from two or more columns into a single column value, extract part
of a column value, and perform calculations on values such as calculating a
discount or tax.
22
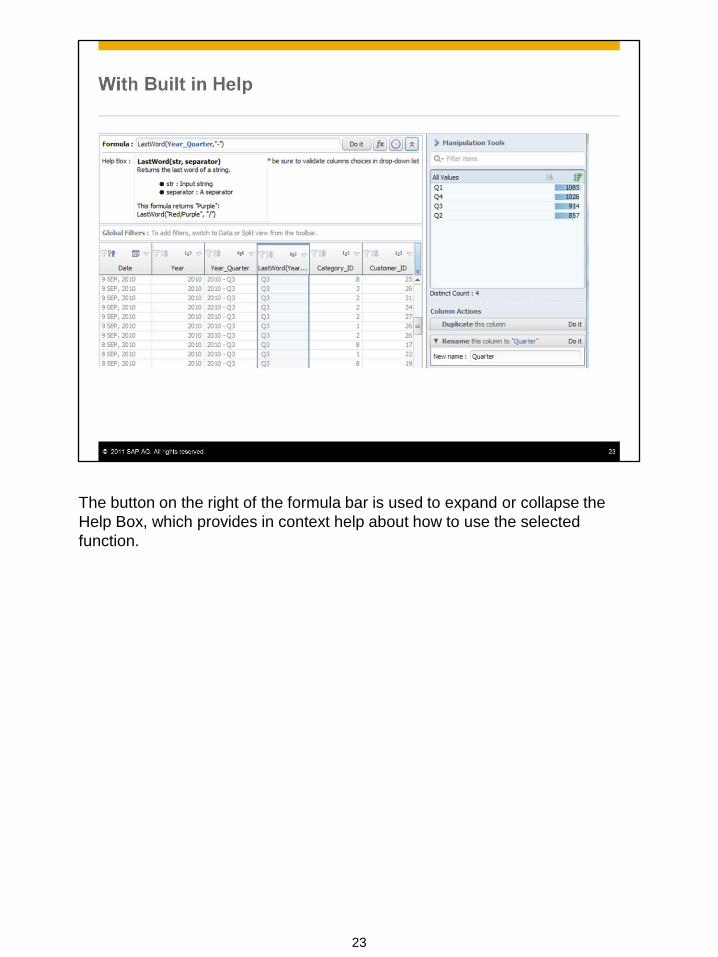
The button on the right of the formula bar is used to expand or collapse the
Help Box, which provides in context help about how to use the selected
function.
23
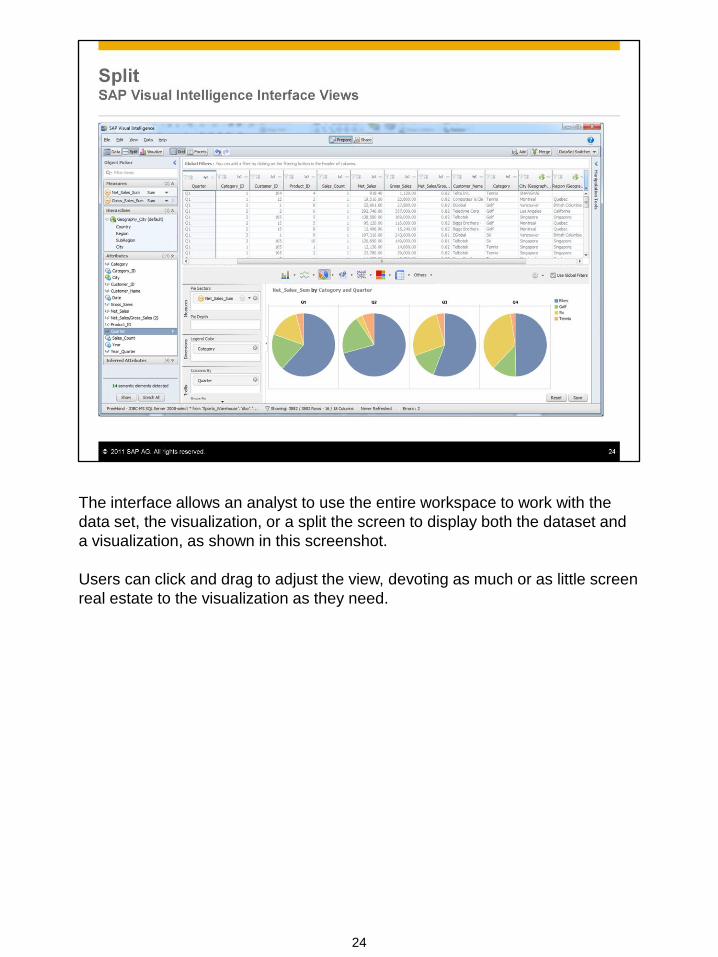
The interface allows an analyst to use the entire workspace to work with the
data set, the visualization, or a split the screen to display both the dataset and
a visualization, as shown in this screenshot.
Users can click and drag to adjust the view, devoting as much or as little screen
real estate to the visualization as they need.
24
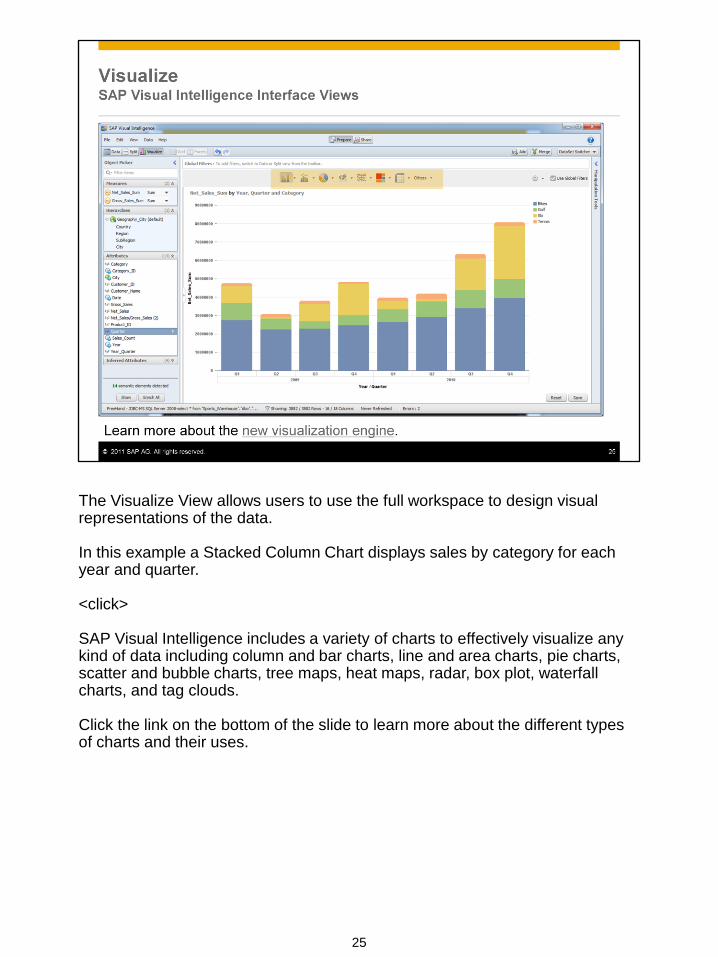
The Visualize View allows users to use the full workspace to design visual representations of the data. In this example a Stacked Column Chart displays sales by category for each year and quarter. <click> SAP Visual Intelligence includes a variety of charts to effectively visualize any kind of data including column and bar charts, line and area charts, pie charts, scatter and bubble charts, tree maps, heat maps, radar, box plot, waterfall charts, and tag clouds. Click the link on the bottom of the slide to learn more about the different types of charts and their uses.
25
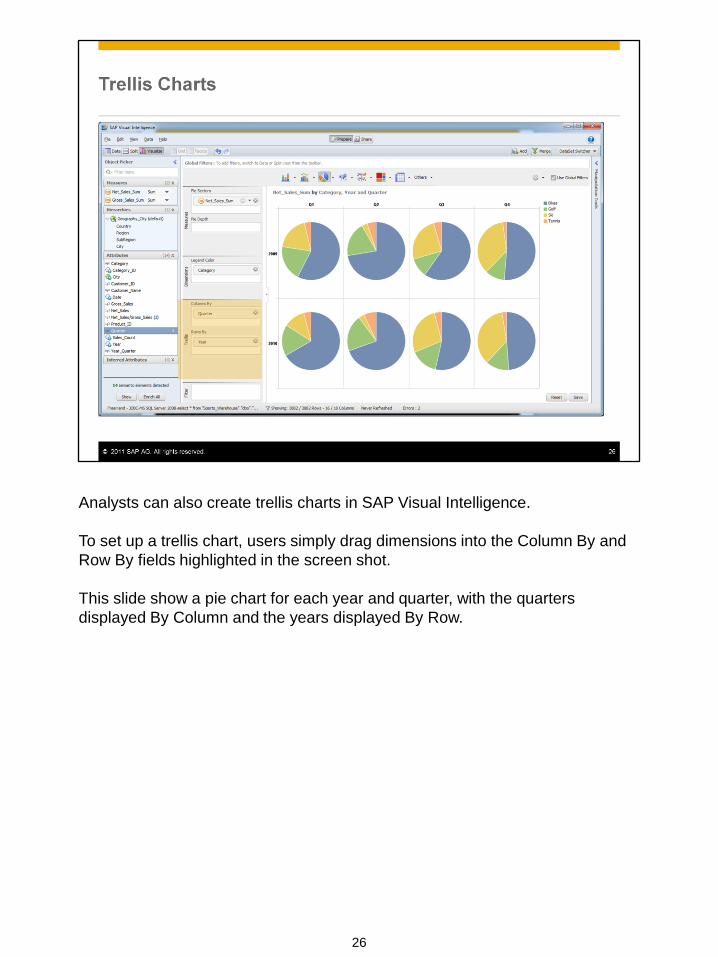
Analysts can also create trellis charts in SAP Visual Intelligence.
To set up a trellis chart, users simply drag dimensions into the Column By and
Row By fields highlighted in the screen shot.
This slide show a pie chart for each year and quarter, with the quarters
displayed By Column and the years displayed By Row.
26
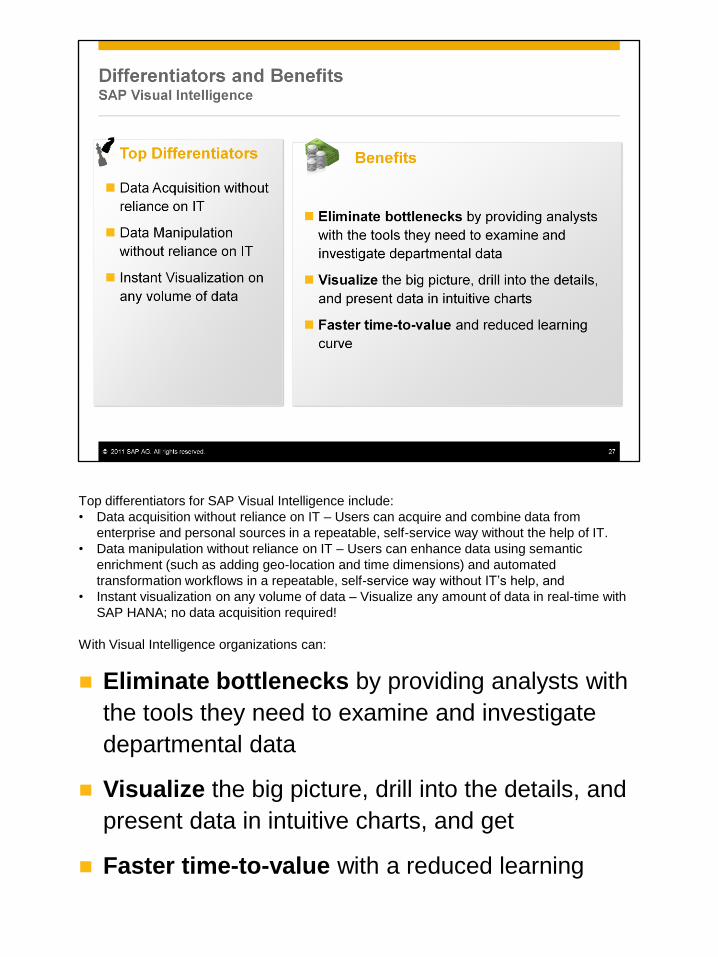
Top differentiators for SAP Visual Intelligence include:
• Data acquisition without reliance on IT – Users can acquire and combine data from
enterprise and personal sources in a repeatable, self-service way without the help of IT.
• Data manipulation without reliance on IT – Users can enhance data using semantic
enrichment (such as adding geo-location and time dimensions) and automated
transformation workflows in a repeatable, self-service way without IT’s help, and
• Instant visualization on any volume of data – Visualize any amount of data in real-time with
SAP HANA; no data acquisition required!
With Visual Intelligence organizations can:
Eliminate bottlenecks by providing analysts with
the tools they need to examine and investigate
departmental data
Visualize the big picture, drill into the details, and
present data in intuitive charts, and get
Faster time-to-value with a reduced learning

curve
27
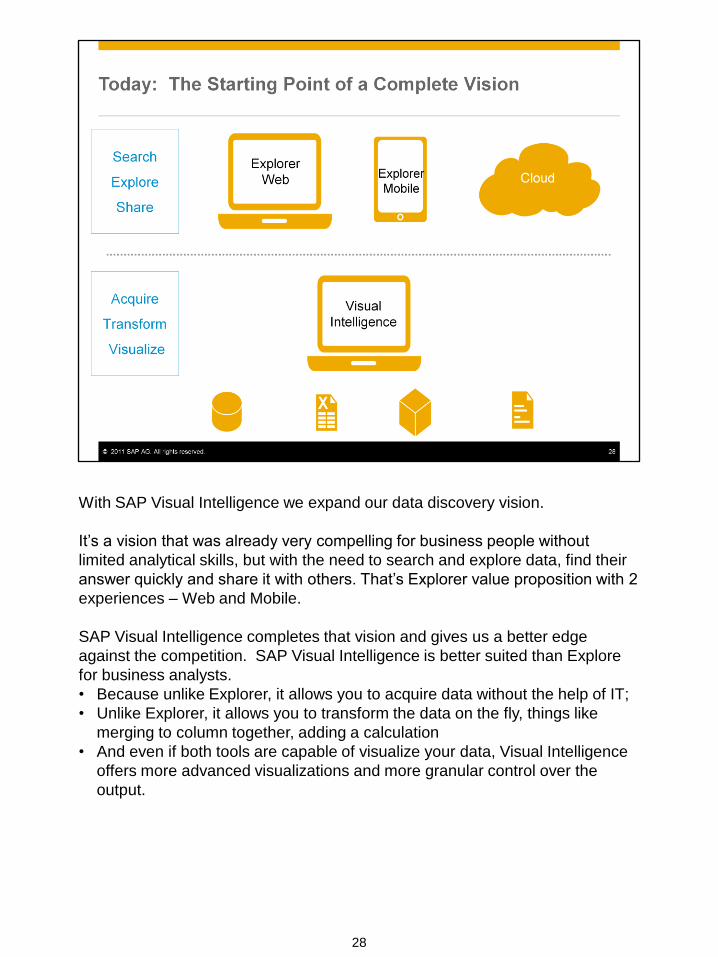
With SAP Visual Intelligence we expand our data discovery vision.
It’s a vision that was already very compelling for business people without
limited analytical skills, but with the need to search and explore data, find their
answer quickly and share it with others. That’s Explorer value proposition with 2
experiences – Web and Mobile.
SAP Visual Intelligence completes that vision and gives us a better edge
against the competition. SAP Visual Intelligence is better suited than Explore
for business analysts.
• Because unlike Explorer, it allows you to acquire data without the help of IT;
• Unlike Explorer, it allows you to transform the data on the fly, things like
merging to column together, adding a calculation
• And even if both tools are capable of visualize your data, Visual Intelligence
offers more advanced visualizations and more granular control over the
output.
28
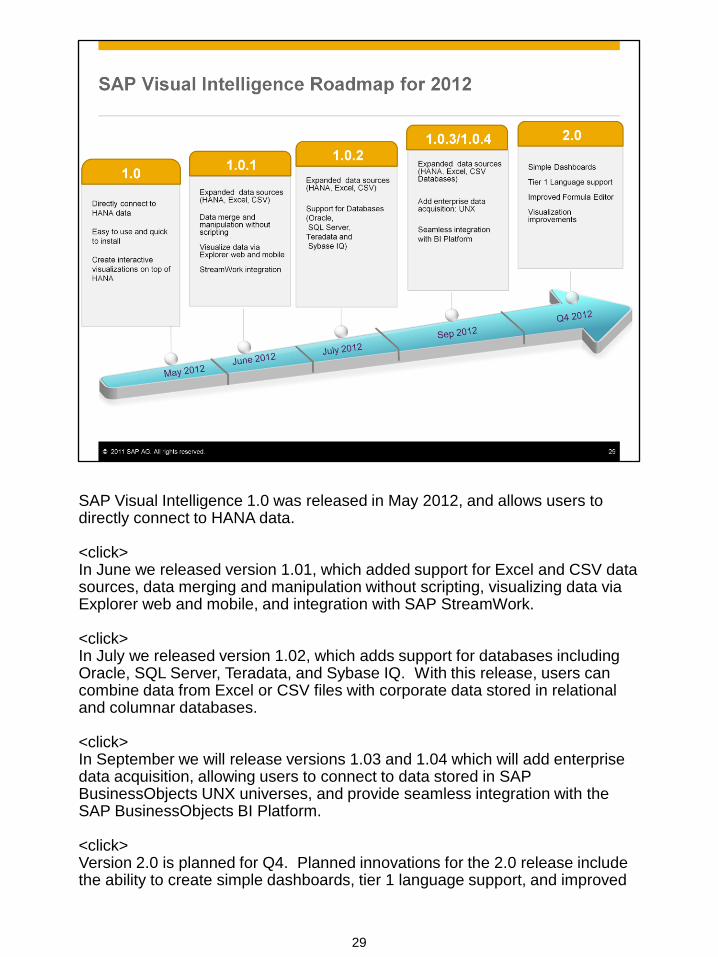
SAP Visual Intelligence 1.0 was released in May 2012, and allows users to directly connect to HANA data. <click> In June we released version 1.01, which added support for Excel and CSV data sources, data merging and manipulation without scripting, visualizing data via Explorer web and mobile, and integration with SAP StreamWork. <click> In July we released version 1.02, which adds support for databases including Oracle, SQL Server, Teradata, and Sybase IQ. With this release, users can combine data from Excel or CSV files with corporate data stored in relational and columnar databases. <click> In September we will release versions 1.03 and 1.04 which will add enterprise data acquisition, allowing users to connect to data stored in SAP BusinessObjects UNX universes, and provide seamless integration with the SAP BusinessObjects BI Platform. <click> Version 2.0 is planned for Q4. Planned innovations for the 2.0 release include the ability to create simple dashboards, tier 1 language support, and improved
29

formula editor, and enhancements to the visualizations.
29
30
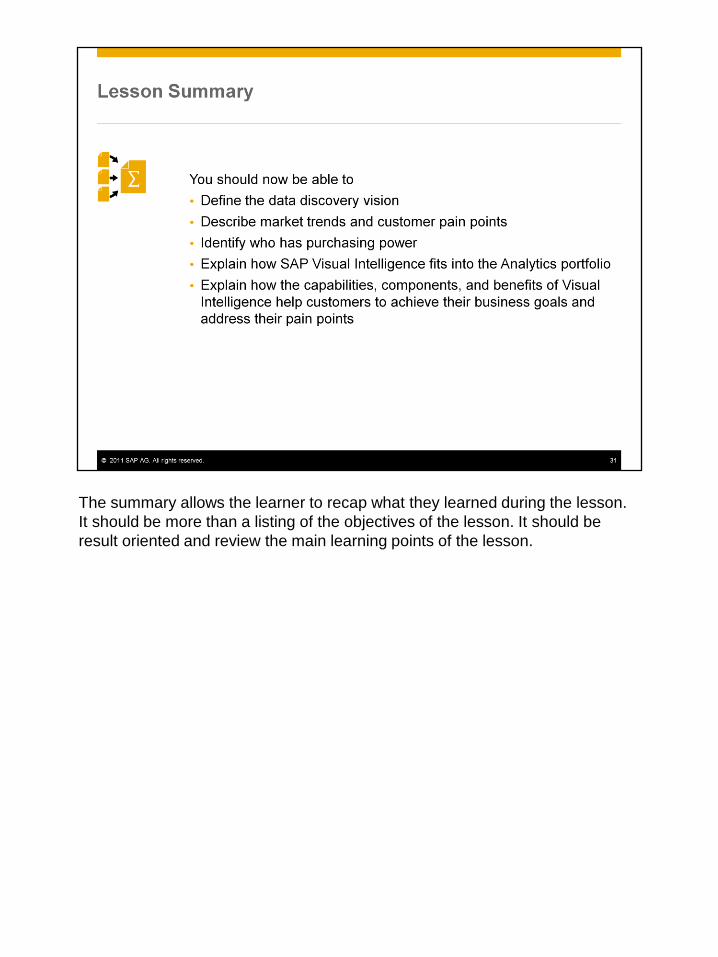
The summary allows the learner to recap what they learned during the lesson.
It should be more than a listing of the objectives of the lesson. It should be
result oriented and review the main learning points of the lesson.
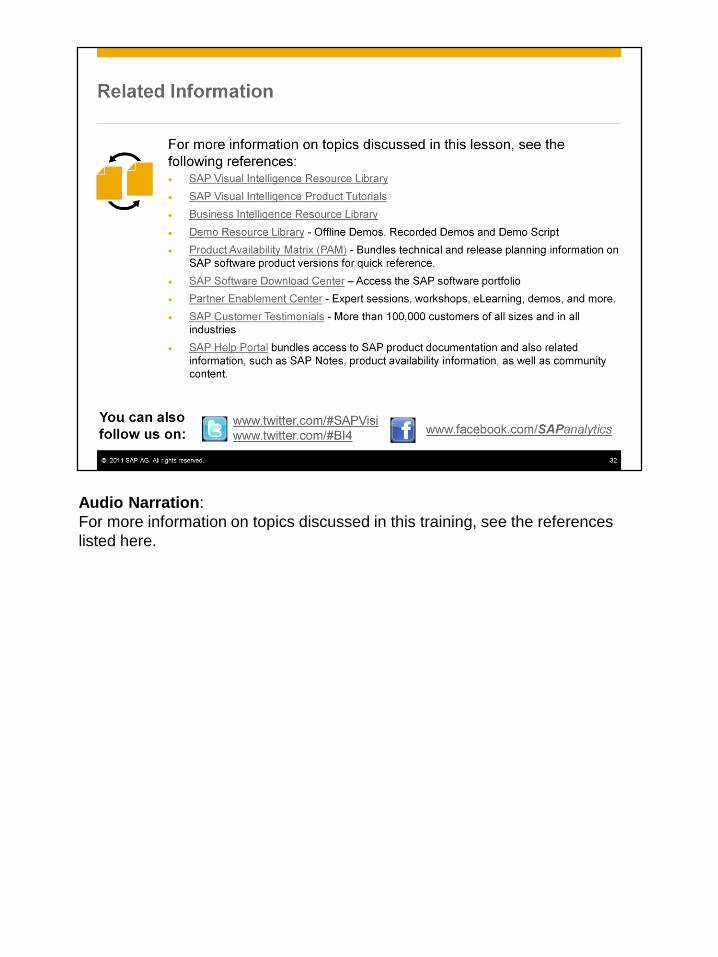
Audio Narration:
For more information on topics discussed in this training, see the references
listed here.
Thank you for attending this lesson.
33