SAP Report 120312 dfdfd
23
SAP EAM / Plant Maintenance Reliabilityweb.com • Reliability Roadmap Asset Management White Paper Series www.reliabilityweb.com • www.cmmscity.com Best Practices Price: $399.00
-
Upload
sanjeev-malik -
Category
Documents
-
view
239 -
download
1
description
dfsdf
Transcript of SAP Report 120312 dfdfd

SAP EAM / Plant Maintenance
Reliabilityweb.com • Reliability Roadmap Asset Management White Paper Series
www.reliabilityweb.com • www.cmmscity.com
Best PracticesPrice: $399.00
This independent research was conducted and the report was written without commercial sponsorship.
We are pleased to gain the endorsement of the enlightened sponsors listed below who’s support will allow
us to distribute this report without cost to the reader and to conduct more important research in the future.
www.dts-global.com www.ivara.com
www.omcsinternational.com
TM
www.mrgsolutions.com
www.reliabilityweb.com www.uptimemagazine.com
www.cmmscity.com www.maintenance.org
Supporting Organizations
Sponsoring Organizations
SAP and other SAP products and services mentioned herein as well as their respective logos are trademarks or registered trademarks of SAP AG in Germany and in several other countries all over the world.
Table of Contents 4 Executive Summary
6 General Information
9 Information Regarding Migration to SAP PM
10 Work Process Issues
11 Work Orders and Spare Parts
13 Planning
14 Use of Failure Codes
16 Training
17 Reporting
18 Use of Other Software Tools with SAP PM
19 Other Products Used with SAP PM
20 SAP PM User Group (ASUG) Membership
21 Summary
22 About the Authors
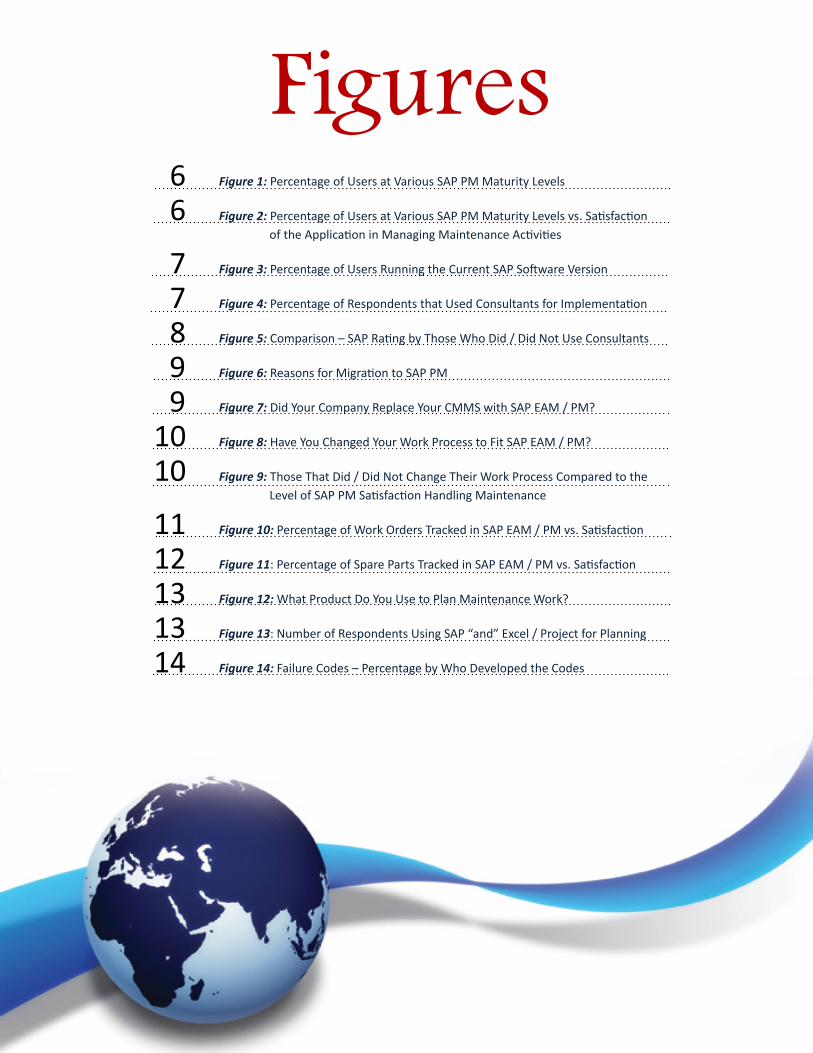
Figures 6 Figure 1: Percentage of Users at Various SAP PM Maturity Levels
6 Figure 2: Percentage of Users at Various SAP PM Maturity Levels vs. Satisfaction of the Application in Managing Maintenance Activities
7 Figure 3: Percentage of Users Running the Current SAP Software Version
7 Figure 4: Percentage of Respondents that Used Consultants for Implementation
8 Figure 5: Comparison – SAP Rating by Those Who Did / Did Not Use Consultants
9 Figure 6: Reasons for Migration to SAP PM
9 Figure 7: Did Your Company Replace Your CMMS with SAP EAM / PM?
10 Figure 8: Have You Changed Your Work Process to Fit SAP EAM / PM?
10 Figure 9: Those That Did / Did Not Change Their Work Process Compared to the Level of SAP PM Satisfaction Handling Maintenance
11 Figure 10: Percentage of Work Orders Tracked in SAP EAM / PM vs. Satisfaction
12 Figure 11: Percentage of Spare Parts Tracked in SAP EAM / PM vs. Satisfaction
13 Figure 12: What Product Do You Use to Plan Maintenance Work?
13 Figure 13: Number of Respondents Using SAP “and” Excel / Project for Planning
14 Figure 14: Failure Codes – Percentage by Who Developed the Codes
15 Figure 15: Failure Code Development Strategies vs. Satisfaction
16 Figure 16: Comparison Staff Training vs. SAP PM Satisfaction
16 Figure 17: Comparison – Maintenance Employee Training vs. SAP PM Satisfaction
17 Figure 18: Use of SAP PM Reporting vs. Satisfaction
17 Figure 19: Comparison of SAP PM Report Use / Satisfaction and Staff Training
18 Figure 20: Use of Other Software in Conjunction with SAP PM
18 Figure 21: Use of Other Software with SAP PM vs. Satisfaction
19 Figure 22: Use of Other Software Products In Conjunction with SAP PM
20 Figure23: Membership in SAP User Group (ASUG)
4
Second only to energy, maintenance costs are a significant portion of every company’s expense budget. Recognizing this fact, companies have implemented strategies to alter the perception that maintenance is a necessary evil to one where maintenance is considered a strong contributor to the company’s profitability. One of these strategies is the integration of the computerized maintenance management system (CMMS) into the company’s information and decision-making network utilizing tools such as SAP Plant Maintenance.
In order to gain a better and deeper understanding of the use of SAP PM as a profitability partner, Reliabilityweb.com surveyed 700 maintenance managers and reliability professionals. This report will provide insight into the use of SAP PM by those surveyed as well as provide suggestions for further improvement to increase value, not simply for the maintenance organization but for the company as a whole.
Significant InsightsThe survey results showed that 65% of the respondents felt that SAP PM was a good to excellent tool for managing maintenance activities. This is somewhat different than the industry perception that SAP is not a good maintenance management tool. This will be explored further throughout this document. The companies that have successfully utilized SAP PM in the maintenance arena have included the following in their business strategy:• Software was aligned with the internal work processes. In many cases
this required customization which was achieved with the use of outside consultants in order to utilize their extensive experience.
• All work orders and spare parts information was included in the system along with the elimination of legacy tools that previously supported these processes.
• Extensive training was provided both during implementation and after deployment to enhance understanding and gain acceptance.
Executive Summary
The promises of an integrated Enterprise Asset Management System (EAM) such as SAP include:
• Visible maintenance processes
• Standardized maintenance processes
• Visible maintenance performance metrics
5
• Increased understanding and utilization of reporting from within the SAP software vs. exporting data to third-party tools such as Excel.
• Inclusion of other tools and applications within the SAP PM that support the overall maintenance effort and provide deeper and more robust functionality in key business areas.
Action to Drive ImprovementSAP PM can provide significant business value specifically due to its integration of financial, materials management, and other systems within a company’s business network. This can only be accomplished if action is taken to:
1. Make full use of SAP PM functionality in order to attain maximum value from the product, the employee user base, and the associated work processes
2. Eliminate past practices that detract from the integration capability of the software
3. Provide ongoing training to increase understanding of the tool and ultimately acceptance for its use.
These items and others will be addressed in greater detail in the following chapters of this report.
SAP PMThis report refers to the popular and past name for the SAP Plant Maintenance (PM) module. The term SAP EAM is the current form. In this report - the use of SAP PM is synonymous with SAP EAM.
About This ReportThis report is an independent survey of 700 maintenance managers and reliability engineers on their implementation experiences and utilization of SAP Plant Maintenance. The survey was conducted by Reliabilityweb.com, an online community of over 50,000 maintenance and reliability professionals worldwide. The survey was not sponsored by any commercial organization and all information regarding the respondents is confidential.
©Copyright 2010 Reliabilityweb.com. All rights reserved. Duplication is prohibited. Reliabilityweb.com, PO Box 60075, Fort Myers, FL 33906 USA
Give people data and they will use it.
Provide communication and it knocks down walls.

6
General InformationFigure 1: Percentage of Users at Various SAP PM Maturity Levels(Note: Those respondents not using SAP PM are excluded from this chart.)
14%
44% 42%
0%
20%
40%
60%
80%
100%
Less than 1 year 1 - 5 years More than 5 years
Perc
ent o
f Res
pond
ents
(N
= 58
6)
Based on the survey data, the majority of the respondents were mature SAP PM users with 86% using the application for more than one year, and almost half of the survey respondents using SAP PM for more than five years.
Figure 2: Percentage of Users at Various SAP PM Maturity Levels vs. Satisfaction of the Application in Managing Maintenance Activities(Note: Those respondents not using SAP PM are excluded from this table.)
Overall Rating SAP PM Managing Maintenance
Poor Fair Good Excellent
The
Per
cent
age
of
R
esp
ond
ents
Usi
ng
SA
P B
y Y
ear
> 5
28% 58%1 to 5
<1 2% 4% 7% 1%
Often user maturity level does not guarantee that the application adequately supports maintenance management activities. To clarify the relationship between maturity and use, the respondents were asked about the ability of SAP PM to manage maintenance. Fifty-eight percent of the mature respondents, and an additional 8% using the application less than one year, rated the system either good or excellent in support of maintenance. This high rating of the application in support of maintenance
Leaders used SAP implementation as an opportunity to re-engineer and standardize maintenance reliability best practices.
Laggards thought they were simply installing a software tool.

7
activities is significant! Nevertheless, 34% rated SAP’s ability to support maintenance in either the fair or poor category. This will be explored deeper in the Training and Work Process sections of this report.
Figure 3: Percentage of Users Running the Current SAP Software Version
63%
37%
0%
20%
40%
60%
80%
100%
Yes No
Perc
ent o
f Res
pond
ents
(N
= 64
4)
Another area of general interest is the question of whether or not the user community is staying current with the vendor’s software releases. This is important on two fronts. First, new releases provide improved functionality which enables the application to address the needs of the users in their performance of the work. Second, new releases often provide patches to correct issues discovered in the current release either by the vendor or the user community. Both of these benefits make “staying current” an attractive alternative to not staying current. The issues that often delay the migration to the most current release are the time it takes to integrate what is being delivered into the current work process, training the users in the new functionality, and last but not least, testing the release to make certain that when deployed it will not cause problems. It is encouraging to see that the survey indicates that 63% of the respondents are using the current version of the application which indicates that these issues are being addressed.
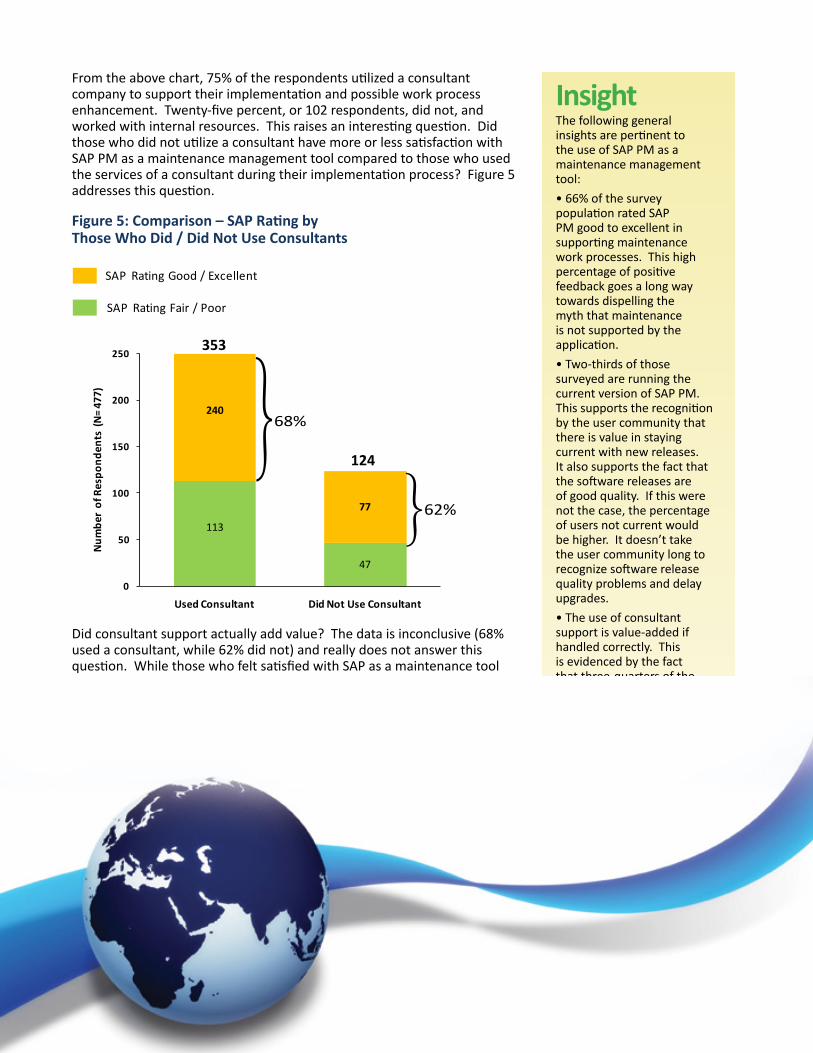
Figure 4: Percentage of Respondents that Used Consultants for Implementation
75%
25%
0%
20%
40%
60%
80%
100%
Used Consultant Did Not Use Consultant
Perc
ent o
f Res
pond
ents
(N
= 50
2)
The companies that have successfully utilized SAP PM in the maintenance arena have included the following in their business strategy:
• Software was aligned with the internal work processes. In many cases this required customization which was achieved with the use of outside consultants in order to utilize their extensive experience.• All work orders and spare parts information was included in the system along with the elimination of legacy tools that previously supported these processes.• Extensive training was provided both during implementation and after deployment to enhance understanding and gain acceptance.• Increased understanding and utilization of reporting from within the SAP software vs. exporting data to third-party tools such as Excel.• Inclusion of other tools and applications within the SAP PM that support the overall maintenance effort and provide deeper and more robust functionality in key business areas.
8
From the above chart, 75% of the respondents utilized a consultant company to support their implementation and possible work process enhancement. Twenty-five percent, or 102 respondents, did not, and worked with internal resources. This raises an interesting question. Did those who did not utilize a consultant have more or less satisfaction with SAP PM as a maintenance management tool compared to those who used the services of a consultant during their implementation process? Figure 5 addresses this question.
Figure 5: Comparison – SAP Rating by Those Who Did / Did Not Use Consultants
SAP Rating Good / Excellent
SAP Rating Fair / Poor
113
47
240
77
0
50
100
150
200
250
Used Consultant Did Not Use Consultant
Num
ber
of R
espo
nden
ts (
N=
477)
Did consultant support actually add value? The data is inconclusive (68% used a consultant, while 62% did not) and really does not answer this question. While those who felt satisfied with SAP as a maintenance tool and did not use a consultant in the process may feel satisfied, the following questions need to be addressed to clarify the issue:
• Did the effort without a consultant in a support role take longer and actually cost more internal dollars than the cost of the external support?
• Were all of the work processes addressed and modified using “best practices”? While internal resources may have a firm understanding of these practices, external consultants have a broad range of experience and can add value possibly not even considered internally.
• Was the training of high quality and did the students learn the “tricks of the trade”? These tricks, or best methods, to utilize the software are things that internal resources would not know since they would have no prior knowledge of the software. Consultants, on the other hand, bring this experience to the table.
If the answers to the above questions were not “yes,” then the rationale for consultant use in a software work process implementation effort is sound. While the survey did not answer these questions, the data indicating that 68% (353) of those surveyed employed consultant support validates the approach.
353
124
353
}68%
}62%
Insight The following general insights are pertinent to the use of SAP PM as a maintenance management tool:
• 66% of the survey population rated SAP PM good to excellent in supporting maintenance work processes. This high percentage of positive feedback goes a long way towards dispelling the myth that maintenance is not supported by the application.
• Two-thirds of those surveyed are running the current version of SAP PM. This supports the recognition by the user community that there is value in staying current with new releases. It also supports the fact that the software releases are of good quality. If this were not the case, the percentage of users not current would be higher. It doesn’t take the user community long to recognize software release quality problems and delay upgrades.
• The use of consultant support is value-added if handled correctly. This is evidenced by the fact that three-quarters of the surveyed population used consultant support in the SAP PM implementation. However, 30% of those using a consultant still rated SAP PM in support of maintenance either fair or poor. There could be a multitude of reasons for this result including how the consultant support was utilized, among others. If a consultant is going to be used in support of this type of initiative, role clarity is important. Both external and internal resources bring value; it is how they are blended into an effective work team that counts.
9
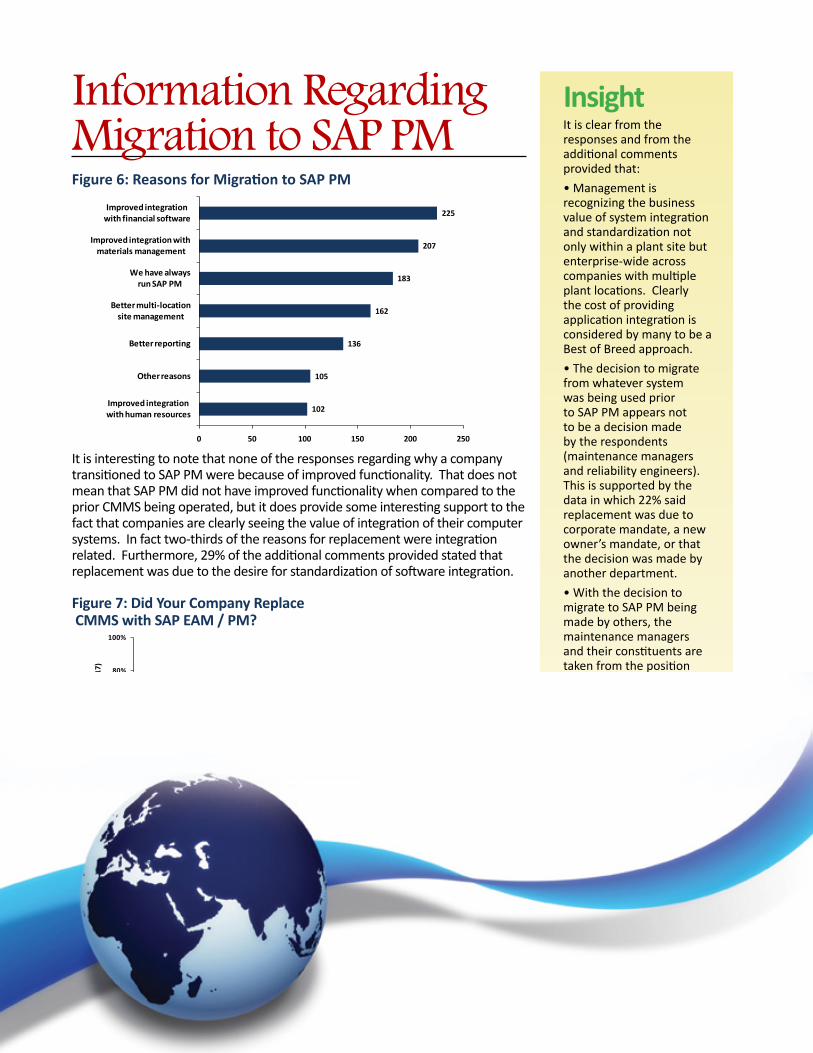
Information Regarding Migration to SAP PMFigure 6: Reasons for Migration to SAP PM
102
105
136
162
183
207
225
0 50 100 150 200 250
Improved integration with human resources
Other reasons
Better reporting
Better multi-location site management
We have always run SAP PM
Improved integration withmaterials management
Improved integration with financial software
It is interesting to note that none of the responses regarding why a company transitioned to SAP PM were because of improved functionality. That does not mean that SAP PM did not have improved functionality when compared to the prior CMMS being operated, but it does provide some interesting support to the fact that companies are clearly seeing the value of integration of their computer systems. In fact two-thirds of the reasons for replacement were integration related. Furthermore, 29% of the additional comments provided stated that replacement was due to the desire for standardization of software integration.
Figure 7: Did Your Company Replace CMMS with SAP EAM / PM?
67%
33%
0%
20%
40%
60%
80%
100%
No Yes
Perc
ent o
f Res
pond
ents
(N
= 61
7)
The information provided in Figure 7 is also interesting. Two-thirds of the respondents stated that their companies did not replace an existing CMMS with SAP PM. This means that they have been operating SAP PM for an extended period of time which further supports recognition of the value-add provided by system integration. The write-in responses also provided some valuable data. Of the 192 write-in responses, 24% replaced Maximo, 10% replaced Datastream/Infor Products, and 10% replaced in-house systems – all non-integrated applications. Maximo is a registered trademark of IBM. Datastream is a trademark of Infor.
Insight It is clear from the responses and from the additional comments provided that:
• Management is recognizing the business value of system integration and standardization not only within a plant site but enterprise-wide across companies with multiple plant locations. Clearly the cost of providing application integration is considered by many to be a Best of Breed approach.
• The decision to migrate from whatever system was being used prior to SAP PM appears not to be a decision made by the respondents (maintenance managers and reliability engineers). This is supported by the data in which 22% said replacement was due to corporate mandate, a new owner’s mandate, or that the decision was made by another department.
• With the decision to migrate to SAP PM being made by others, the maintenance managers and their constituents are taken from the position of decision maker to one where they must adopt the new system and adapt to the manner in which it functions. Often a system is just as much a part of the organizational culture as other aspects of the business. Change is difficult and being forced to move to a new application by corporate or other departments clearly could explain why new users – less than one year using SAP PM – would be evenly split in the system’s overall rating in support of maintenance activity (see Figure 2).
10
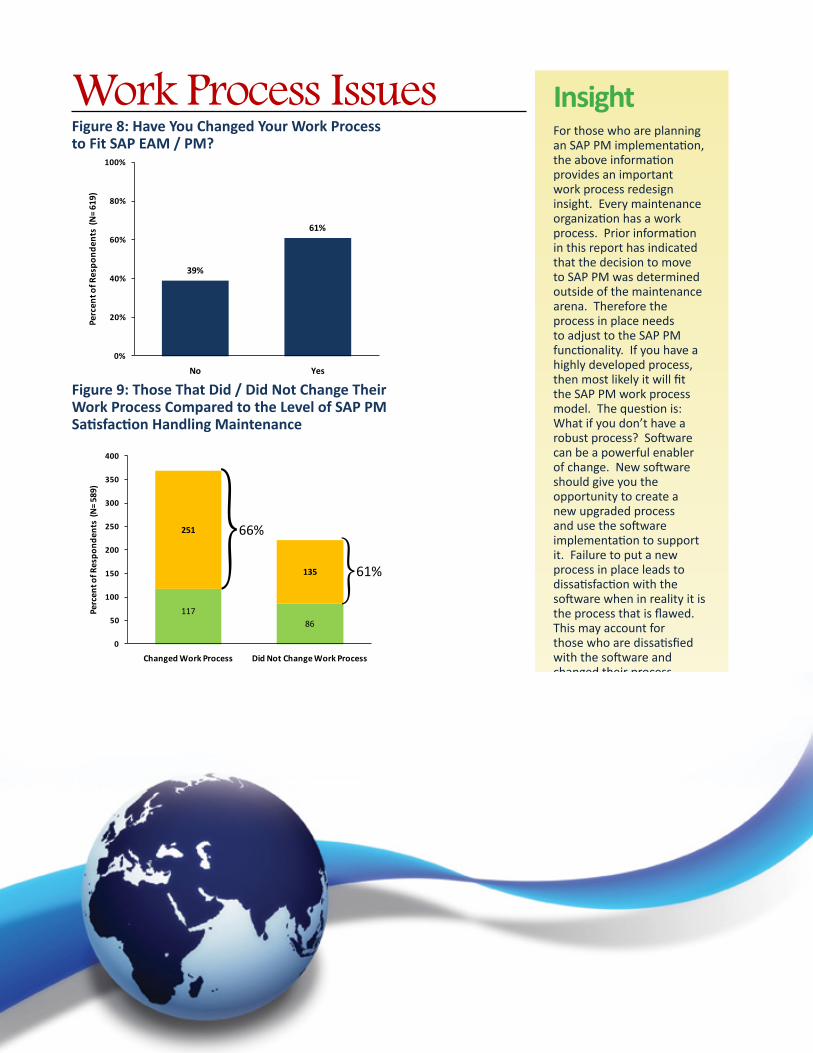
Work Process IssuesFigure 8: Have You Changed Your Work Process to Fit SAP EAM / PM?
39%
61%
0%
20%
40%
60%
80%
100%
No Yes
Perc
ent o
f Res
pond
ents
(N
= 61
9)
Figure 9: Those That Did / Did Not Change Their Work Process Compared to the Level of SAP PM Satisfaction Handling Maintenance
11786
251
135
0
50
100
150
200
250
300
350
400
Changed Work Process Did Not Change Work Process
Perc
ent o
f Res
pond
ents
(N
= 58
9)
It is to be expected that a new CMMS will require some modification to the work process in order to accommodate the new system. However, the maintenance work process at its basic level consists of work identification, planning, scheduling, execution, and work order close out. The level of work process complexity beyond this basic level will often dictate if major process change is required. From the above charts, almost two-thirds of the respondents had a need to modify their existing work process. However, what we don’t know is whether the existing process was poor and SAP PM enabled improvement, or simply that the process was changed due to system requirements imposed by the new program.
Figure 9 adds additional information. It appears that the level of SAP PM satisfaction was virtually the same for those who did and those who did not change their maintenance work process. This might indicate that those who changed their process to address the functionality provided by SAP PM really did not have one which was highly developed. If this were the case, then changing the process along with the SAP PM implementation would provide a higher level of satisfaction with the software. Conversely those who had robust processes that fit the SAP PM model would equally be satisfied with the software while not having to make process modifications.
}61%
Insight
For those who are planning an SAP PM implementation, the above information provides an important work process redesign insight. Every maintenance organization has a work process. Prior information in this report has indicated that the decision to move to SAP PM was determined outside of the maintenance arena. Therefore the process in place needs to adjust to the SAP PM functionality. If you have a highly developed process, then most likely it will fit the SAP PM work process model. The question is: What if you don’t have a robust process? Software can be a powerful enabler of change. New software should give you the opportunity to create a new upgraded process and use the software implementation to support it. Failure to put a new process in place leads to dissatisfaction with the software when in reality it is the process that is flawed. This may account for those who are dissatisfied with the software and changed their process after implementation and those who tried to maintain the legacy process within the context of improved functionality.
}66%
11
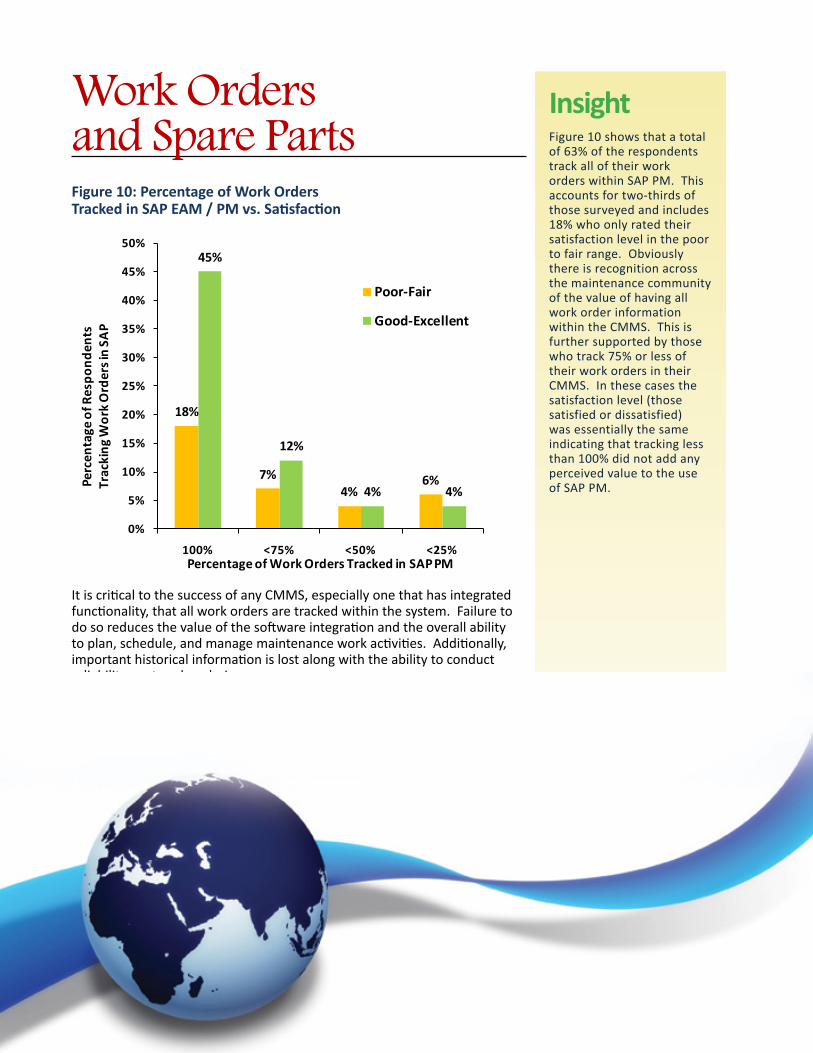
Work Orders and Spare PartsFigure 10: Percentage of Work Orders Tracked in SAP EAM / PM vs. Satisfaction
18%
7%4%
6%
45%
12%
4% 4%
0%
5%
10%
15%
20%
25%
30%
35%
40%
45%
50%
100% <75% <50% <25%
Perc
enta
ge o
f Res
pond
ents
Tr
acki
ng W
ork
Ord
ers i
n SA
P
Percentage of Work Orders Tracked in SAP PM
Poor-Fair
Good-Excellent
It is critical to the success of any CMMS, especially one that has integrated functionality, that all work orders are tracked within the system. Failure to do so reduces the value of the software integration and the overall ability to plan, schedule, and manage maintenance work activities. Additionally, important historical information is lost along with the ability to conduct reliability-centered analysis.
Insight
Figure 10 shows that a total of 63% of the respondents track all of their work orders within SAP PM. This accounts for two-thirds of those surveyed and includes 18% who only rated their satisfaction level in the poor to fair range. Obviously there is recognition across the maintenance community of the value of having all work order information within the CMMS. This is further supported by those who track 75% or less of their work orders in their CMMS. In these cases the satisfaction level (those satisfied or dissatisfied) was essentially the same indicating that tracking less than 100% did not add any perceived value to the use of SAP PM.

12
Figure 11: Percentage of Spare Parts Tracked in SAP EAM / PM vs. Satisfaction
16%
7%
3%
9%
36%
16%
7% 7%
0%
5%
10%
15%
20%
25%
30%
35%
40%
100% <75% <50% <25%
Perc
enta
ge o
f Res
pond
ents
Tr
acki
ng S
pare
s in
SAP
Percentage of Spares Tracked in SAP PM
Poor-Fair
Good-Excellent
The data related to the tracking of spares within the CMMS is somewhat different than that of work orders. Only 51% of those surveyed track all of their spares in SAP PM, and only 36% have expressed good to excellent satisfaction with the system’s ability to manage maintenance. This raises some significant questions: How and where is the data related to spare parts tracked and stored? How do those who do not use SAP PM to track spares acquire life cycle cost or reliability data for their assets? Clearly information gaps of this nature can be serious leading to less than adequate reliability analysis along with the possibility of making wrong business decisions, each of which can seriously impact a company’s bottom line.
Insight
There may be reasons for this apparent low level of spares integration to SAP PM. Regardless of the reason, a strong business case can be made for making spares and general stock information part of the integrated system. Not only is there significant benefit for maintenance but also for materials management and finance as well. An organization can spend as much as one-third of the maintenance budget on parts, and therefore it is imperative that the historical usage information be available across the many organizations that use this data for analysis and cost control. This can only occur if the majority of the parts are tracked within the CMMS.
Best Practice A CMMS/EAM cannot support enhanced maintenance performance or productivity without complete and accurate information. Imagine the chaos created by a similar lack of detail in your company accounting information system. You must track 100% of your maintenance activity and 100% of maintenance and repair spares in the CMMS/EAM to get the greatest return.
13
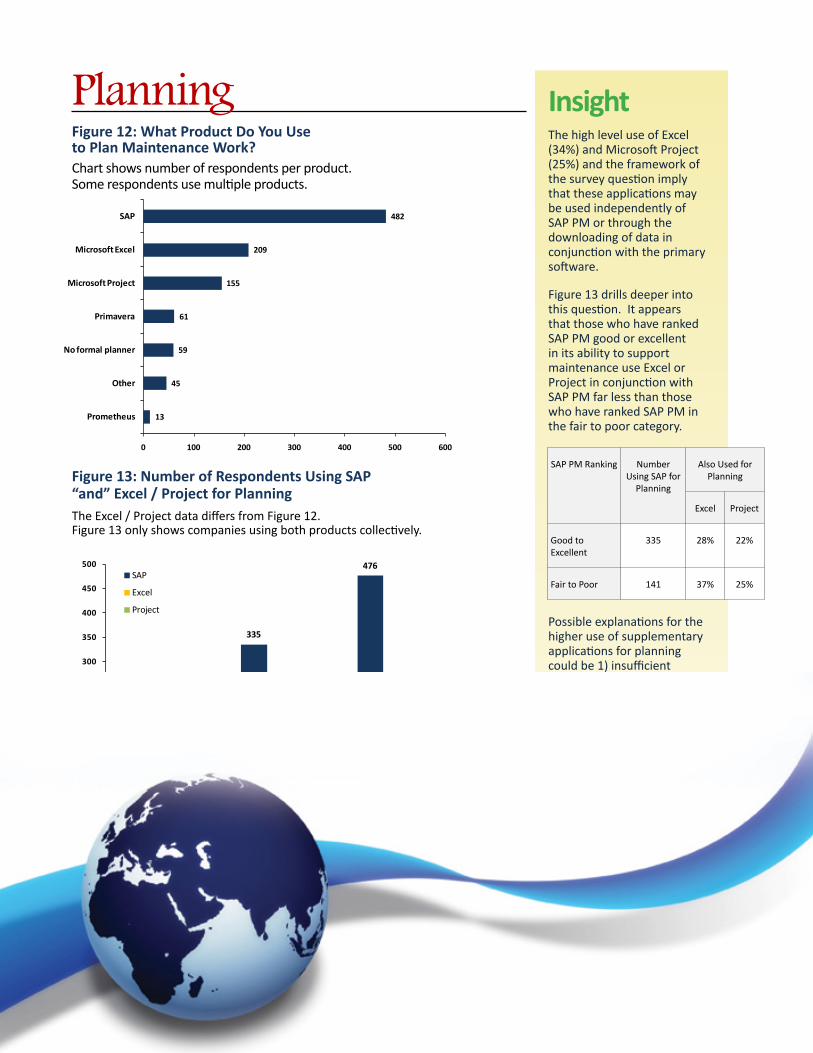
PlanningFigure 12: What Product Do You Use to Plan Maintenance Work?
13
45
59
61
155
209
482
0 100 200 300 400 500 600
Prometheus
Other
No formal planner
Primavera
Microsoft Project
Microsoft Excel
SAP
Figure 13: Number of Respondents Using SAP “and” Excel / Project for Planning
141
335
476
53
96
149
36
79
115
0
50
100
150
200
250
300
350
400
450
500
Fair-Poor
Excellent -Good
Total
SAP
Excel
Project
Planning is a critical part of the maintenance work process. Without planning and scheduling of the work, there is lack of direction and sub-optimization of the maintenance resources. Figure 12 shows that 80% of those surveyed use SAP PM for their planning activities. This is encouraging since the planning process drives all other aspects of maintenance activity and ultimately, through job completion, returns costs and analytical data back into the system. This is beneficial for maintenance, but due to the integrated aspect of the software, it is also beneficial to other organizations that have alternative uses of the work order data.
Insight
The high level use of Excel (34%) and Microsoft Project (25%) and the framework of the survey question imply that these applications may be used independently of SAP PM or through the downloading of data in conjunction with the primary software.
Figure 13 drills deeper into this question. It appears that those who have ranked SAP PM good or excellent in its ability to support maintenance use Excel or Project in conjunction with SAP PM far less than those who have ranked SAP PM in the fair to poor category.
Possible explanations for the higher use of supplementary applications for planning could be 1) insufficient change management during implementation causing continued reliance on old processes and legacy tools, or 2) insufficient training not just during deployment but on a continuous basis as new employees are exposed to SAP PM. Each of these issues can be corrected by forcing increased use of SAP PM in the planning effort and reducing applications that are used as crutches in lieu of SAP PM.
Chart shows number of respondents per product. Some respondents use multiple products.
The Excel / Project data differs from Figure 12. Figure 13 only shows companies using both products collectively.
SAP PM Ranking
Number Using SAP for
Planning
Also Used for
Planning
Excel
Project
Good to Excellent
335
28%
22%
Fair to Poor
141
37%
25%
14
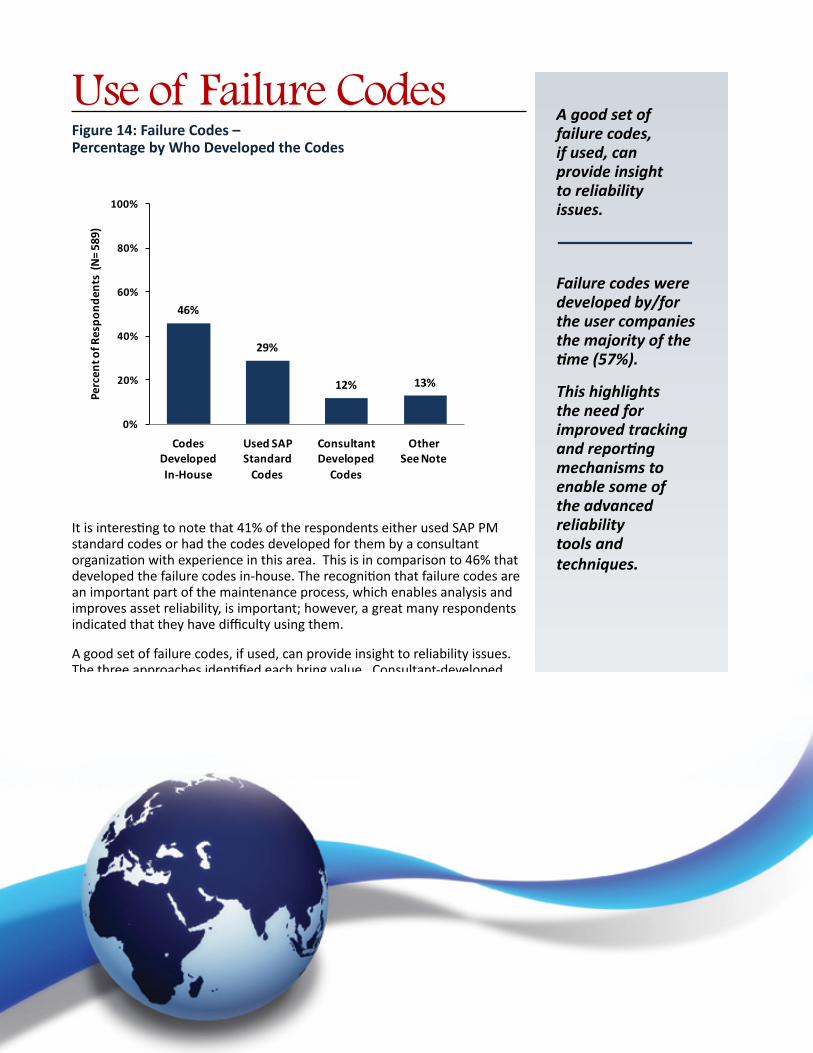
Use of Failure CodesFigure 14: Failure Codes – Percentage by Who Developed the Codes
46%
29%
12% 13%
0%
20%
40%
60%
80%
100%
CodesDevelopedIn-House
Used SAPStandard
Codes
Consultant Developed
Codes
OtherSee Note
Perc
ent o
f Res
pond
ents
(N
= 58
9)
It is interesting to note that 41% of the respondents either used SAP PM standard codes or had the codes developed for them by a consultant organization with experience in this area. This is in comparison to 46% that developed the failure codes in-house. The recognition that failure codes are an important part of the maintenance process, which enables analysis and improves asset reliability, is important; however, a great many respondents indicated that they have difficulty using them.
A good set of failure codes, if used, can provide insight to reliability issues. The three approaches identified each bring value. Consultant-developed codes bring the experience of the consultant, which has often been fine-tuned over many years and many work engagements. SAP PM standard codes have been created with this same level of industry knowledge by the vendor interacting with their customers and the user group. The in-house developed codes can have the same value as the others; however, they are influenced by those in-house who may not have as broad an experience base as the former two sources for the codes. The important factor in the process of obtaining good value is the use of the codes.
Figure 15 further explores the question of SAP PM satisfaction related to the strategy employed in failure code creation.
A good set of failure codes, if used, can provide insight to reliability issues.
Failure codes were developed by/for the user companies the majority of the time (57%).
This highlights the need for improved tracking and reporting mechanisms to enable some of the advanced reliability tools and techniques.
15
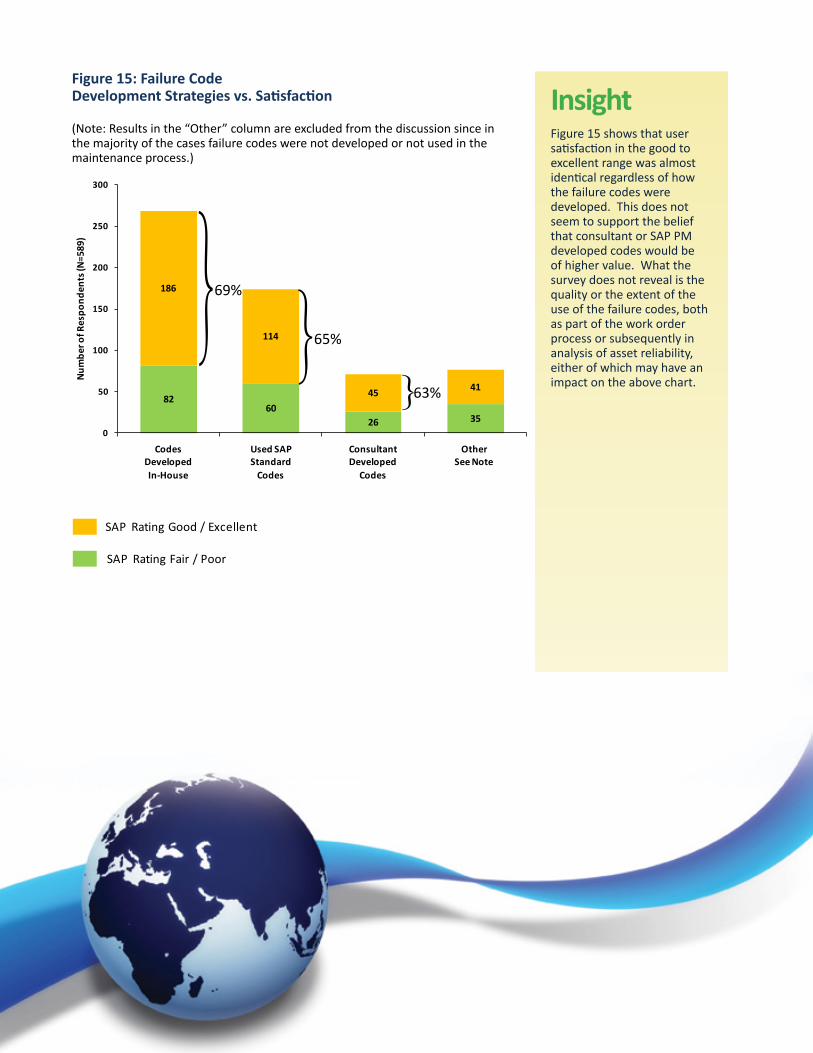
Figure 15: Failure Code Development Strategies vs. Satisfaction
(Note: Results in the “Other” column are excluded from the discussion since in the majority of the cases failure codes were not developed or not used in the maintenance process.)
8260
26 35
186
114
45 41
0
50
100
150
200
250
300
CodesDevelopedIn-House
Used SAPStandard
Codes
Consultant Developed
Codes
OtherSee Note
Num
ber o
f Res
pond
ents
(N=5
89)
SAP Rating Good / Excellent
SAP Rating Fair / Poor
Insight
Figure 15 shows that user satisfaction in the good to excellent range was almost identical regardless of how the failure codes were developed. This does not seem to support the belief that consultant or SAP PM developed codes would be of higher value. What the survey does not reveal is the quality or the extent of the use of the failure codes, both as part of the work order process or subsequently in analysis of asset reliability, either of which may have an impact on the above chart.}
}69%
}65%
63%
16
TrainingFigure 16: Comparison – Staff Training vs. SAP PM Satisfaction
Overall Rating SAP PM
Poor Fair Good Excellent
Per
cent
age
of
the
Mai
nten
ance
Sta
ff
Rec
eivi
ngTr
aini
ng -
Pas
t 12
Mo
nths 100%
13% 36%>75%
>50%
>25%
22% 29%>5%
0
Training in the use of a CMMS tool is not a one-time event. It is a continuous process. After all, how do the second, third, and future generations of users learn to use the application without ongoing training? The answer, a dangerous one, is that they are trained by those whose jobs they are filling. If you consider that 15% of the knowledge of how to use the software is lost by each successive generation, it is clear that this is not a sound approach. Ongoing training is the answer.
Figure 17: Comparison – Maintenance Employee Training vs. SAP PM Satisfaction
Overall Rating SAP PM
Poor Fair Good Excellent
The
Num
ber
of
Day
s / Y
ear
of
Trai
ning
Pro
vid
ed to
M
aint
enan
ce E
mp
loye
es
>5
1% 8%2-5
1
33% 58%0
Employee training is a different story. It appears from Figure 17 that additional training beyond one day per year did not add any significant level of satisfaction within the workforce. The question that remains unanswered is: How much does the workforce use the software, and is ongoing training needed?
Insight Figure 16 clearly makes the case for ongoing structured training. In the case where more than 50% of the staff received training in the past year, the level of satisfaction with SAP PM in the good to excellent range (36%) was three times higher than those who expressed dissatisfaction (13%), but had the same level of training. Furthermore, for those that received very little training over the past year, there was little difference between those satisfied or dissatisfied with the software.
Insight In many instances the workforce has little access to the CMMS and only receives training in the very specific areas in which they need to interact. In other companies, the workforce has been enabled to use the software as part of the job, and while they do not need the level of training that a planner would receive, training is still important. In either case, the workforce would not require a great deal of training which explains the low number of days of training per year. The level of use could also explain the level of satisfaction and dissatisfaction, the enabled organizations having a higher regard for the software due to their ability to use it extensively.
Best PracticeTraining is a huge area for software improvement and gain. Training makes any system easier to use, and if people are comfortable using the system, they are more likely to participate in its success. Training will teach users how to make the CMMS/EAM work for them rather than them seeing the CMMS/EAM as extra work. Develop a strategy for CMMS/EAM training on a continuing basis for improved productivity.

17
ReportingFigure 18: Use of SAP PM Reporting vs. Satisfaction
Overall Rating SAP PM Managing Maintenance
Poor - FairGood -
Excellent
Is S
AP
Use
d t
o
Gen
erat
eR
epo
rts?
(n
= 5
86)
Yes 18% 46%
No 16% 20%
Figure 19: Comparison of SAP PM Report Use / Satisfaction and Staff Training
Using SAP PM Reports
Not Using SAP PM Reports
29
18 1827
16 1420
28
0
20
40
60
80
100
120
>75% to 100% >50% >25% >5%
105
55 53
38
2620
26 28
0
20
40
60
80
100
120
>75% to 100% >50% >25% >5%
Figure 18 clearly shows that there is a higher level of satisfaction with SAP PM as a maintenance management tool among those who use SAP reports (46% good to excellent rating vs. 18% fair to poor rating). The indication from this statistic is that SAP PM reports deliver the information necessary for monitoring, analysis, and other associated tasks that require good data. The satisfaction levels provided by those who do not use the reports is more evenly split – 20% good to excellent vs. 16% fair to poor.
Percent Staff TrainingSAP Satisfaction Level - Fair to Poor
Percent Staff TrainingSAP Satisfaction Level - Good to Excellent
Insight Using Figure 19, we can explore the use of SAP PM reporting to bring another element to the discussion – training. The left-hand chart shows those who rated SAP PM in support of maintenance in the good to excellent range. The x-axis lists the various levels of staff training year by year. Clearly those with more training (>75% to 100%) employed SAP PM reporting far more than those who had less training in the use of the software. One would suspect from this data that training and report use go hand-in-hand.
Within the low levels of training (>5% through 50%) satisfaction levels with the software were almost the same. This would tend to validate that lower levels of yearly training were not significant in driving higher use of the reporting functionality, even among those satisfied with the software.
In the right-hand chart – those who rated SAP PM in the fair to poor range – it appears that higher levels of training did not drive higher use of the reporting functionality. In this case, the company needs to first improve satisfaction, then, with increased training, report usage should improve.
Only a small percentage (13%) mentioned BW or BO indicating the maintenance departments isolation from native SAP functionality.
18
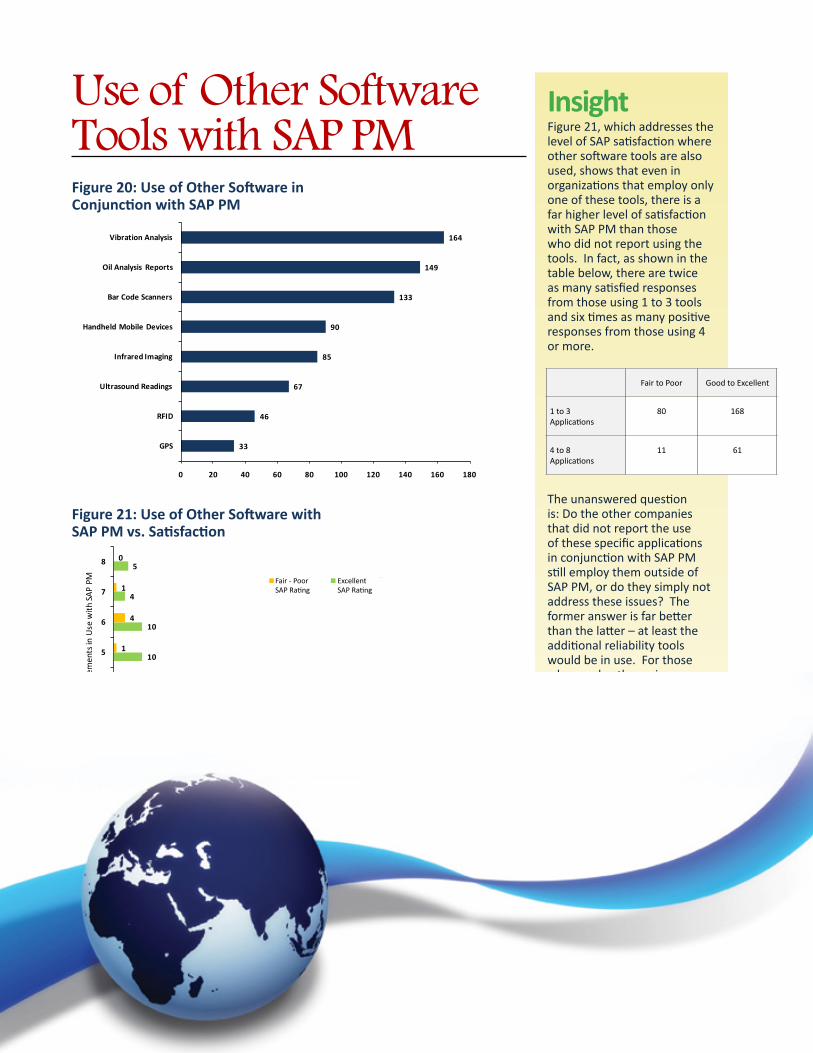
Use of Other SoftwareTools with SAP PMFigure 20: Use of Other Software in Conjunction with SAP PM
33
46
67
85
90
133
149
164
0 20 40 60 80 100 120 140 160 180
GPS
RFID
Ultrasound Readings
Infrared Imaging
Handheld Mobile Devices
Bar Code Scanners
Oil Analysis Reports
Vibration Analysis
Figure 21: Use of Other Software with SAP PM vs. Satisfaction
92
51
25
32
10
10
4
5
51
16
13
5
1
4
1
0
0 20 40 60 80 100
1
2
3
4
5
6
7
8
Num
ber o
f Add
ition
al E
lem
ents
in U
se w
ith S
AP P
M Fair - PoorSAP Rating
Good - ExccllentSAP Rating
It is encouraging to note the number of respondents who use other software applications with functionality that is very specific and aimed at improved asset reliability. No one application can do it all, especially when the organization is targeting specific areas of reliability such as vibration analysis or infrared imaging.
In addition, the use of bar code scanners, handheld mobile devices, and RFID functionality indicates that other initiatives are in place that focus on efforts such as operation care and the use of bar codes to streamline many maintenance work processes.
Insight Figure 21, which addresses the level of SAP satisfaction where other software tools are also used, shows that even in organizations that employ only one of these tools, there is a far higher level of satisfaction with SAP PM than those who did not report using the tools. In fact, as shown in the table below, there are twice as many satisfied responses from those using 1 to 3 tools and six times as many positive responses from those using 4 or more.
The unanswered question is: Do the other companies that did not report the use of these specific applications in conjunction with SAP PM still employ them outside of SAP PM, or do they simply not address these issues? The former answer is far better than the latter – at least the additional reliability tools would be in use. For those who employ the various software tools listed outside of SAP PM, they may find the level of satisfaction with the SAP PM application would improve if they were used in conjunction with one another.
Fair to Poor
Good to Excellent
1 to 3 Applications
80
168
4 to 8 Applications
11
61
Number of Respondents
Excellent SAP Rating
Fair - Poor SAP Rating

19
Other Products Used with SAP PMFigure 22: Use of Other Software Products In Conjunction with SAP PM
1
2
5
6
7
7
14
14
17
18
21
21
23
24
46
88
198
436
0 50 100 150 200 250 300 350 400 450 500
INOVx Asset Certainty
Oniqua Enterprise Reliability
NRX Asset Hub
24/7 Tango
Oniqua Maint. Analyzer
Mincom LinkOne
Ivara EXP
OSIsoft PI
Prometheus Group
Meridium APM
PMO-2000
Synactive GuiXT
MeridiumRCMO
Impress
Other
Primavera
Microsoft Project
Microsoft Excel
Number of Respondents
Insight Part of the customization process often involves the utilization of third-party technologies (i.e., a hybrid solution) to account for SAP PM’s perceived gaps to meet plant needs or requirements. A high number of the respondents utilized secondary technology in support of SAP PM. Predominant use appears to be with Microsoft Excel and Project which we have seen occurs frequently in the planning and reporting areas. However, what we have also seen is that the satisfaction level with SAP PM in support of maintenance is far higher than those who do not employ these tools. We have also seen that staff training has a lot to do with use and satisfaction. Quite possibly, additional training would enable those still dependent on legacy processes employing Microsoft tools in lieu of SAP PM, to abandon them and use their primary CMMS.
Microsoft Excel and Microsoft Project are registered trademarks of Microsoft Corporation. Other trademarks are property of their owners.
20
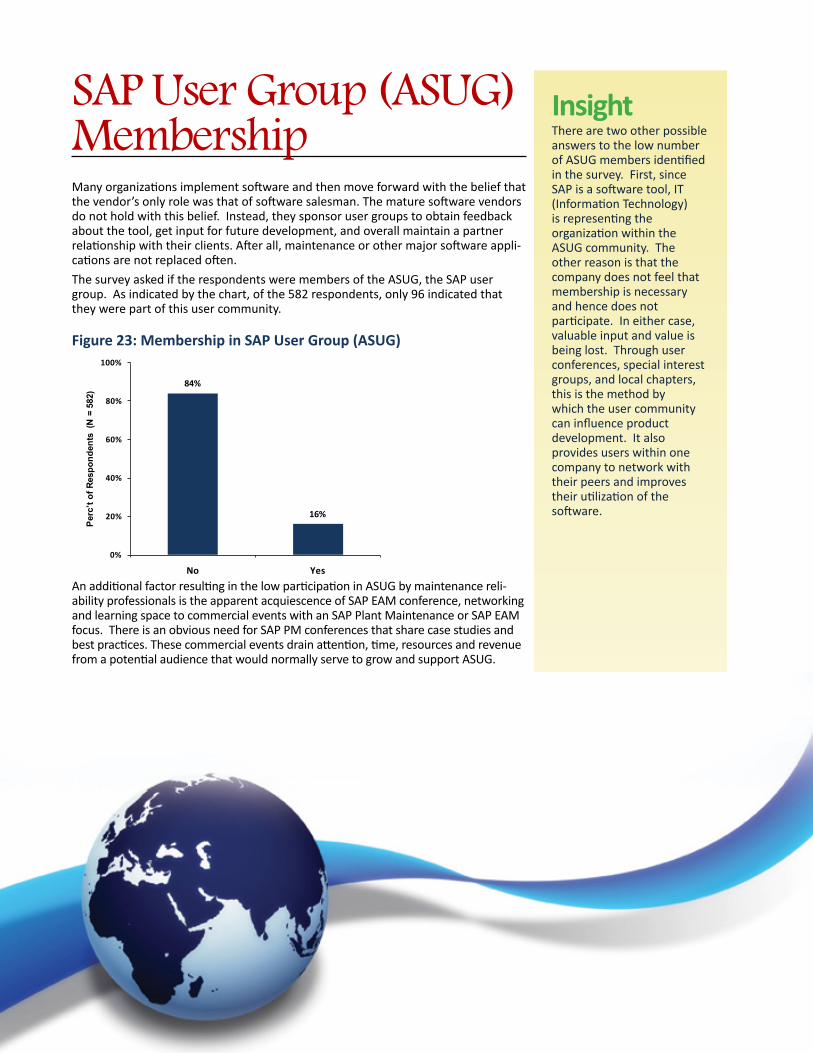
SAP User Group (ASUG) MembershipMany organizations implement software and then move forward with the belief that the vendor’s only role was that of software salesman. The mature software vendors do not hold with this belief. Instead, they sponsor user groups to obtain feedback about the tool, get input for future development, and overall maintain a partner relationship with their clients. After all, maintenance or other major software appli-cations are not replaced often.
The survey asked if the respondents were members of the ASUG, the SAP user group. As indicated by the chart, of the 582 respondents, only 96 indicated that they were part of this user community.
Figure 23: Membership in SAP User Group (ASUG)
84%
16%
0%
20%
40%
60%
80%
100%
No Yes
Per
c’t
of
Res
po
nd
ents
(N
= 5
82)
An additional factor resulting in the low participation in ASUG by maintenance reli-ability professionals is the apparent acquiescence of SAP EAM conference, networking and learning space to commercial events with an SAP Plant Maintenance or SAP EAM focus. There is an obvious need for SAP PM conferences that share case studies and best practices. These commercial events drain attention, time, resources and revenue from a potential audience that would normally serve to grow and support ASUG.
Further research supports the high level of interest in networking and learning re-lated to SAP EAM based on the 4000+ Reliabilityweb.com opt-in e-mail subscribers registering for an impendent SAP EAM publication. This is further verified by active SAP EAM online communities and discussion groups at MaintenanceForums.com (www.maintenanceforums.com) and the Association for Maintenance Professionals (www.maintenance.org).
As there is a predisposition for companies that invest in SAP as an ERP platform to support officially sanctioned software user groups, it appears ASUG has a large op-portunity to assert its leadership in the maintenance reliability community where SAP EAM market share is estimated to be between 30%-35% of all maintenance management and asset management software systems in use. It is suggested that ASUG can broaden its influence by offering user group conferences that add value to SAP EAM users and ASUG as well as commercial supporters such as SAP AG and the SAP supplier community.
Action to Drive Improvement The recommended action item to 1) gain benefits from a partnership with the software vendor, 2) drive software improvement, and 3) network with peers to learn best practices is to re-evaluate the value of membership for maintenance and reliability professions in ASUG.
Insight There are two other possible answers to the low number of ASUG members identified in the survey. First, since SAP is a software tool, IT (Information Technology) is representing the organization within the ASUG community. The other reason is that the company does not feel that membership is necessary and hence does not participate. In either case, valuable input and value is being lost. Through user conferences, special interest groups, and local chapters, this is the method by which the user community can influence product development. It also provides users within one company to network with their peers and improves their utilization of the software.
21
SummaryMany maintenance practitioners have expressed dissatisfaction with SAP PM’s ability to support maintenance activities. There are many possible reasons for this opinion; however, the survey results contained in this report in many ways dispel this belief.
Change is difficult. It can be made even more difficult when an organization such as maintenance is forced to abandon their legacy CMMS and learn to utilize a new one, especially if they have not had a great deal of input into the decision. This, coupled with low levels of training, can foster resistance to the change, delaying deployment, causing frustration in those who have to learn new ways to work, and ultimately resulting in expressed dissatisfaction with the software. These problems can and must be overcome not just for success in the maintenance arena, but for success across the company.
They key is to address the implementation as a process, not a project. The new software and its associated work processes need constant care and feeding if you expect them to integrate into the organization’s culture. There are eight key points to consider.
They are referred to as the Eight Elements of Change.• Leadership – The leaders must be visibly committed to the success of
the effort remembering that it is a process change, not a project with a finite end point.
• Work Process – The work process must adapt to the new software without loss of the value that existed in the former process, but gaining the value offered by the new software.
• Structure – Where necessary, the structure may need alteration to be able to accommodate the process changes. This is an opportunity to leverage improved maintenance performance such as hiring full-time planners and a separate work scheduler.
• Learning – As we have seen, training is critical, not just during implementation but on a continuous basis. It improves acceptance and use, and avoids loss of functionality as employees train their replacements when they leave the job.
• Technology – Maximum use of the software (SAP PM and other identified tools) is important to acceptance. Legacy tools such as Microsoft Excel and Project, while they have their place, should not be an acceptable alternative to the use of SAP PM functionality.
• Communication – It is important that constant communication take place about the effort. People are afraid of change, and without information about what is happening, they create it, often to the detriment of the effort.
• Interrelationships – New software and the associated process changes have a way of breaking the strong interrelationships among people and departments. These interrelationships are how things get done. Now they are going to be different. If this aspect of change is not considered, confusion will be the result.
Satisfaction with SAP PM is influenced by a number of factors:
• Tracking all work
• Tracking all spares
• Reporting mastery
• Customization—modifying SAP PM and internal plant process for better alignment; use of third-party technologies to “bridge the gap”
• Consultants—use of outside consultants to drive that customization
• Training—training all maintenance employees and keeping up with continuing education regarding SAP PM
Moving toward Best Practice strategies to bridge the gap in any of these areas will go a long way toward enhancing user satisfaction which also would be indicative of more effective use of SAP to support effective maintenance processes.

22
• Rewards – The reward when deploying a powerful new software tool is the value it brings to the company’s bottom line. If people understand this and can see the results, they will be far more involved with trying to make the effort a success.
Steve Thomas has 40 years of experience working in the petrochemical industry. During this time, through personal involvement at all levels of the maintenance and reliability work process, he has gained vast experience in all phases of the business. Coupled with a B.S. in Electrical Engineering from Drexel University and M.S. degrees in both Systems Engineering and Organizational Dynamics from the University of Pennsylvania, this experience has enabled him to add significant value to the many projects on which he has worked. In addition, he has published
six books on this and other subjects through Industrial Press, Inc., and Reliabilityweb.com., the most recent being Asset Data Integrity is Serious Business and Measuring Maintenance Workforce Productivity Made Simple, both of which were published in October 2010.
AuthorsThis report was written by Steve Thomas with additional insights by Terry Wireman, CPMM, and Terrence O’Hanlon, CMRP
Terry Wireman Mr. Wireman helps organizations develop “Best-In-Class” maintenance and reliability policies and practices. As an international expert in maintenance management, he has assisted hundreds of companies in North America, Europe, and the Pacific Rim to improve their maintenance effectiveness. In addition, he has authored twenty-three textbooks, numerous white papers, and magazine articles related to maintenance management process and technology. Mr. Wireman has been a featured speaker at conferences, technical association events
and University sponsored workshops, domestically and internationally.
Terrence O’Hanlon Terrence O’Hanlon, CMRP is the Pub-lisher of Reliabilityweb.com and Uptime Magazine. He is a Certified Maintenance & Reliability Professional and is the acting Executive Director of the Association for Maintenance Professionals (AMP). Mr. O’Hanlon is also a member of the American Society of Mechanical Engineers, The Association of Facilities Engineers, Society of Maintenance and Reliability Professionals and the Society of Tribologists and Lubrication Engineers. Reliabilityweb.com is an online community of over 55,000 maintenance
and reliability professionals worldwide created in 1999. A free weekly e-mail newsletter with tutorials, articles, tips and more is available online at: http://www.reliabilityweb.com
If you are a current SAP PM user, we hope you can use this information to improve your use of this very valuable tool and the other
software tools that support it. This change for the better will vastly improve not only the use of the software, but far more importantly, your maintenance
management work processes, productivity, reliability, and ultimately the bottom line performance of your company.
If you are interested in learning more about the SAP PM Best Practices Survey, please feel free to e-mail Terrence O’Hanlon at the address below.
Reliabilityweb.com • PO Box 60075 • Fort Myers • FL 33906 [email protected] • www.reliabilityweb.com
SAP for Plant MaintenanceAccording to the German standard DIN 31051, plant maintenance comprises “all measures for maintaining and restoring the target condition as well as determining and assessing the actual condition of the technical equipment in a system.”
Whereas DIN 31051 applies to the individual parts of a system and associated measures, system-oriented plant maintenance focuses on safeguarding the functioning of a production system as a whole. Plant maintenance in this sense belongs to system logistics, the primary goals of which are planning, creating and maintaining system availability.
Excerpted from SAP R/3 Plant Maintenance: Making It Work for Your Business Addison-Wesley Professional ISBN: 0201675323