Sap 2013 Annual Report
316
2013 ANNUAL REPORT The Best-Run Businesses Run SAP ®
-
Upload
selvakumar-rm -
Category
Documents
-
view
239 -
download
0
Transcript of Sap 2013 Annual Report

2013 An
nu
Al R
epoRt
2013 AnnuAl RepoRt
The Best-Run Businesses Run SAP®
WhAt We RepoRt
We present our financial, social, and environmental performance in the SAP Integrated Report 2013, which is available at sapintegratedreport.com.
This Annual Report 2013 is an extract from the SAP Integrated Report 2013. It comprises all of the information required by accounting and disclosure standards applicable to us.

Key Facts
performance summary € millions, unless otherwise stated
Financial key performance indicators
Software and cloud subscriptions (IFRS) 5,212 4,928 6
Non-IFRS adjustments 63 73 –14
Software and cloud subscriptions (non-IFRS) 5,275 5,001 5
Software and software-related service revenue (IFRS) 13,950 13,165 6
Non-IFRS adjustments 82 81 1
Software and software-related service revenue (non-IFRS) 14,032 13,246 6
Total revenue (IFRS) 16,815 16,223 4
Non-IFRS adjustments 82 81 1
Total revenue (non-IFRS) 16,897 16,304 4
Operating profit (IFRS) 4,479 4,041 11
Non-IFRS adjustments 1,035 1,148 –10
Operating profit (non-IFRS) 5,514 5,190 6
Operating margin as a percentage (IFRS) 26.6 24.9 7
Operating margin as a percentage (non-IFRS) 32.6 31.8 3
Free cash flow 3,266 3,281 0
Net liquidity –1,467 –2,502 41
Days’ sales outstanding (DSO, in days) 62 59 5
Equity ratio (total equity as a percentage of total assets) 59 54 10
operating expensesResearch and development 2,282 2,261 1
Research and development (as a percentage of total revenue) 14 14 0
Number of employees in research and development at year-end1) 17,804 18,012 –1
Financial performance measuresWeighted average shares outstanding, basic (in millions) 1,193 1,192 0
Earnings per share, basic (in €) 2.79 2.35 19
Dividend per ordinary share (in €) 1.00 0.85 18
SAP share price at year-end (in €) 62.31 60.69 3
Market capitalization (in € billions) 76.5 74.7 2

performance summary € millions, unless otherwise stated
employees and personnel expensesNumber of employees at year-end1) 66,572 64,422 3
Personnel expenses per employee – excluding share-based payments (in € thousands) 109 111 –1
Women working at SAP (as a percentage) 31 30 3
Women in management2) (total, as a percentage) 21.2 20.8 2
Employee Engagement Index (as a percentage) 77 79 –3
Business Health Culture Index (as a percentage) 67 66 2
Employee retention (as a percentage) 93.5 94.0 –1
environmentGreenhouse gas emissions (in kilotons) 545 485 12
Greenhouse gas emissions per employee1) (in tons) 8.3 7.9 5
Greenhouse gas emissions per € revenue (in grams) 32.4 30.0 8
Total energy consumption (in GWh) 910 860 6
Energy consumed per employee1) (in kWh) 13,900 14,000 –1
Data center energy consumed (in GWh) 173 160 8
Data center energy per employee1) (in kWh) 2,633 2,598 1
Renewable energy sourced (as a percentage) 43 51 –16
CustomersNet Promoter Score (as a percentage) 12.1 8.9 36
1) Full-time equivalents 2) Numbers based on year-end

1
Who We ARe
More than 253,500 customers use SAP innovations such as the SAP HANA platform and SAP Cloud powered by SAP HANA to meet complex business challenges and operate profitably, adapt continuously, and grow sustainably. SAP empowers people and organizations to work together more efficiently and use real-time business insight more effec-tively. By empowering companies of all sizes and in all industries to make a difference, SAP helps the world run better and improve people’s lives.

Contents
to our stakeholders
Combined Management report
Financial statements
additional Information
551
161283
2
to our Stakeholders
Letter from the Co-CEOsGlobal Managing BoardInvestor RelationsCorporate Governance ReportReport from the Supervisory BoardCompensation ReportResponsibility StatementIndependent Auditor’s Report
Combined Management Report
General Information About This Management ReportOverview of the SAP GroupVision, Mission, and StrategyBusiness ModelPortfolio of Products, Solutions, and ServicesCustomersResearch and Development Partner EcosystemAcquisitionsEmployees and Social InvestmentsEnergy Consumption and Greenhouse Gas EmissionsInternal Management SystemEconomy and the MarketReport on Economic PositionReport on the Economic Position of SAP AGOverall Financial PositionCorporate GovernanceInformation Concerning TakeoversOpportunity ReportRisk ReportSupplementary ReportReport on Expected Developments
5
610121621324647
51
52
53545759656871727379829092
110113114116119122152153
Consolidated Financial Statements IFRS
Consolidated Income Statements Consolidated Statements of Comprehensive IncomeConsolidated Statements of Financial PositionConsolidated Statements of Changes in EquityConsolidated Statements of Cash FlowsNotes to the Consolidated Financial StatementsManagement’s Annual Report on Internal Control over Financial Reporting in the Consolidated Financial Statements
Additional Information
Five-Year SummaryGlossaryAddressesFinancial and Sustainability PublicationsFinancial CalendarPublication Details
161
162163
164
166
168
169
281
283
284287308309310311
3

overview ofSAp Group
With more than 253,500 customers in over
180 countries, the SAP Group employs more than
66,500 people in major countries.
To learn more about the SAP Group please visit www.sapintegratedreport.com

to our StakeholdersLetter from the Co-CEOsGlobal Managing BoardInvestor RelationsCorporate Governance ReportReport from the Supervisory BoardCompensation ReportResponsibility StatementIndependent Auditor’s Report
56
10121621324647
5
Letter from the Co-Ceos
6 To Our Stakeholders
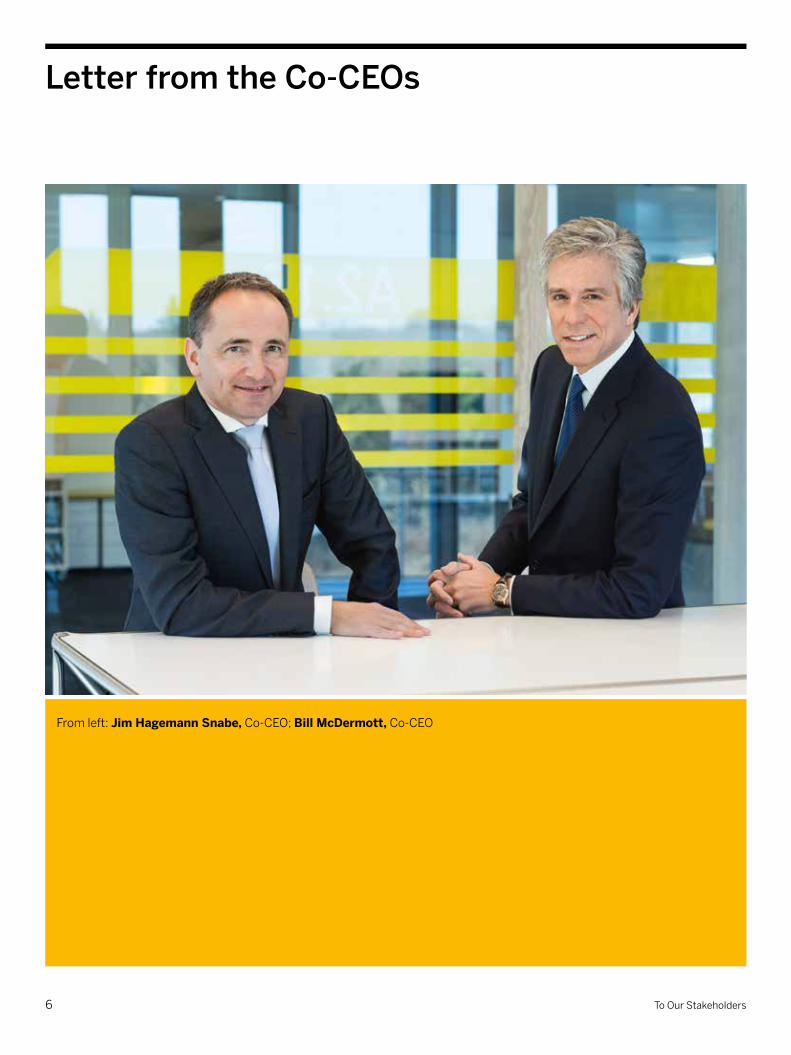
From left: Jim hagemann Snabe, Co-CEO; Bill McDermott, Co-CEO
Dear Stakeholders,
In 2010, we launched our customer-centric innovation strategy based on a strong conviction that yesterday’s technologies could not solve tomorrow’s challenges.
We listened to our customers that wanted to adopt innovation faster, analyze unprecedented amounts of data, reach their customers and consumers across all channels, and manage their mobile workers. In response, we expanded our portfolio by investing in cloud-based solutions and mobile technology – and by introducing SAP HANA, our game-changing in-memory technology.
Now, in 2014, it is clear that our strategy was the right one. Today, cloud, mobile, and Big Data are the dominant themes in the IT industry. With four consecutive years of double-digit growth, our success is evident. We are the fastest-growing mega-cap company in the enterprise software industry. For 2013, we reported €16.9 billion non-IFRS total revenue, with 11% constant currency growth in software and cloud subscription revenue (5% at actual currencies). In the same period, our non-IFRS operating margin increased to 33.5% at constant currencies (32.6% at actual currencies). We have more than 253,500 customers from companies of all sizes, across 25 industries, in mature as well as emerging markets.
With the market position and innovation pipeline we have today, we now have a unique opportunity to deliver significantly more value to our customers and reshape the technology landscape for lower cost and higher performance. The trends we identified in 2010 have only accelerated, and we remain focused and determined to win in rapidly growing areas, especially in cloud and in-memory technology. Our SAP HANA technology has evolved from a real-time database to a true in-memory platform. SAP HANA now allows companies to radically simplify their IT infrastructure. In 2013, we put our entire SAP Business Suite on SAP HANA. Going forward, our software portfolio and the innovations of our partner ecosystem will be built on the foundation of SAP HANA. In the three years since its launch, SAP HANA has generated nearly €1.2 billion in revenue and has become one of the fastest-growing products in the history of enterprise software. In 2013 alone, SAP HANA generated €664 million in revenue, which is an increase of 69% over the previous year at constant currencies.
7Letter from the Co-Ceos

Cloud computing has now become mainstream and is a widely accepted delivery model in the United States, and increasingly in Asia and Europe. The cloud offers an unprecedented opportunity to simplify software delivery and speed to value as customers get immediate access to innovation. Our annual cloud revenue run rate reached €1.06 billion at the end of 2013. For the year, we reported €757 million non-IFRS cloud subscription and support revenue. Today, SAP Cloud powered by SAP HANA is the broadest cloud portfolio in the industry. More than 35 million users work with our solutions in the cloud, and approximately 1.4 million companies trade over half a trillion U.S. dollars of goods and services through our cloud-based Ariba Network. Our strategy was always embedded in a higher purpose and vision to “help the world run better and improve people’s lives.” In a world of limited resources, we are proud that, with our solutions, 10 million people in South Africa now have access to banking services with their mobile phones, urban governments in more than 50 countries deliver better services to their citizens, and people in more than 21 countries have easier access to education. In addition, we continue to uphold our commitment to the United Nations Global Compact.
Our non-financial performance indicators remained strong in 2013: We increased our Net Promoter Score by 3.2%. We also reduced our carbon footprint by 9% since the beginning of 2008. And, for the seventh time in a row, we have been ranked the number one software company in the Dow Jones Sustainability Index. As more customers choose our cloud solutions and our data centers grow, our total energy use will also increase. In 2014, we are addressing this growth by powering all of our data centers with 100% renewable energy. Moreover, we achieved an employee engagement score of 77%, which is among the highest benchmarks for this indicator. We are especially proud of our more than 66,500 employees, and thank them wholeheartedly for their hard work and innovative spirit.
8 To Our Stakeholders
Our momentum and strong foundation allows us to be bold about our future and set ambitious goals. By 2017, we expect to deliver at least €22 billion in total revenue (thereof €3.0–€3.5 billion from our cloud business). To capture the growth in the cloud, we have extended the time horizon for our 35% operating margin target to 2017. Further, we aim to increase customer loyalty by another four percentage points in 2014. In addition, we remain committed to increasing our already high level of employee engagement to 82% by 2015. In a world of increasing velocity, innovation is imperative. But innovation must never lose sight of the human spirit, which craves simplicity and clarity. That is why our focus now is to “simplify everything so we can do anything.” With this guiding principle, we believe SAP is positioned to deliver profitable growth – and to continue our vision of helping the world run better while improving people’s lives.
Best regards,
Bill Mcdermott Jim Hagemann snabe Co-CEO, SAP AG Co-CEO, SAP AG
9Letter from the Co-Ceos
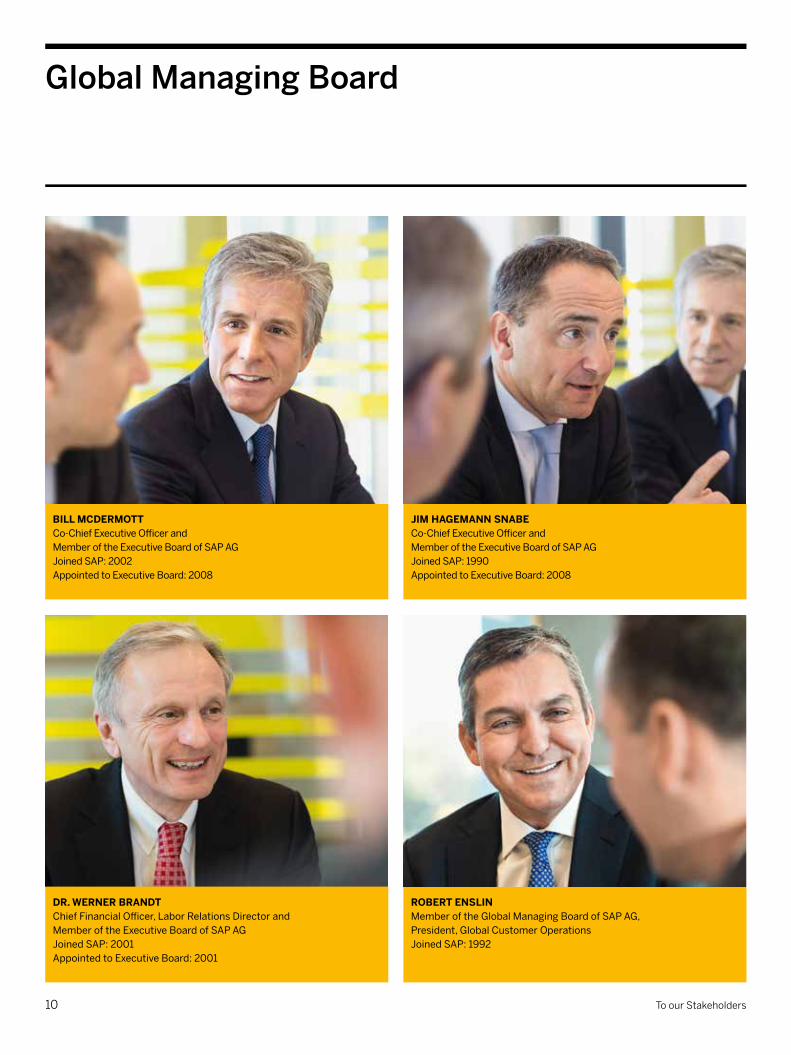
Global Managing Board
DR. WeRneR BRAnDtChief Financial Officer, Labor Relations Director and Member of the Executive Board of SAP AG Joined SAP: 2001 Appointed to Executive Board: 2001
RoBeRt enSlInMember of the Global Managing Board of SAP AG, President, Global Customer Operations Joined SAP: 1992
BIll MCDeRMottCo-Chief Executive Officer and Member of the Executive Board of SAP AG Joined SAP: 2002 Appointed to Executive Board: 2008
JIM hAGeMAnn SnABeCo-Chief Executive Officer and Member of the Executive Board of SAP AG Joined SAP: 1990 Appointed to Executive Board: 2008
To our Stakeholders10
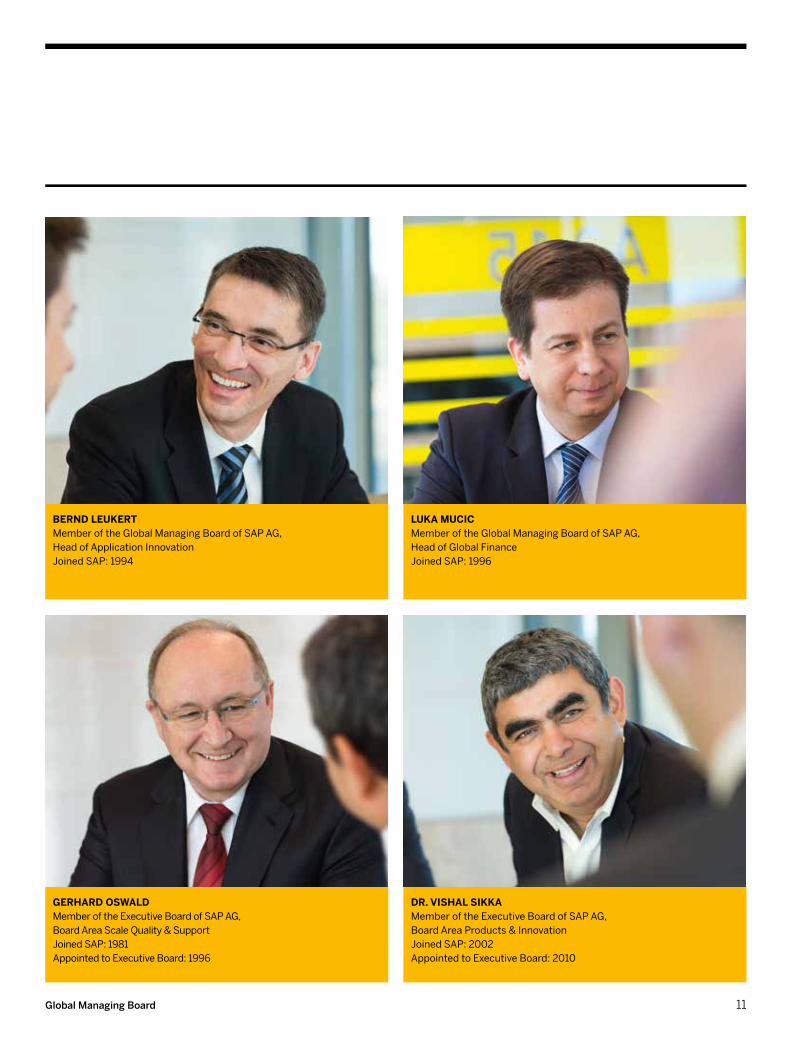
GeRhARD oSWAlD Member of the Executive Board of SAP AG, Board Area Scale Quality & Support Joined SAP: 1981 Appointed to Executive Board: 1996
DR. VIShAl SIkkAMember of the Executive Board of SAP AG, Board Area Products & Innovation Joined SAP: 2002 Appointed to Executive Board: 2010
BeRnD leukeRtMember of the Global Managing Board of SAP AG, Head of Application Innovation Joined SAP: 1994
lukA MuCICMember of the Global Managing Board of SAP AG, Head of Global Finance Joined SAP: 1996
Global Managing Board 11
SAP stock came under pressure at the start of April as the markets weakened. It picked up momentum again after we announced our first-quarter results on April 19, and, with the markets rallying, reached €64.05, its high for the quarter, on May 15. Disappointing economic growth figures for China, the announcement of personnel changes on the SAP Executive Board, and the ex-dividend price adjustment after the Annual General Meeting of Shareholders on June 4 then caused the price to fall. It recovered soon after when SAP announced that it would acquire hybris.
The share price fell in the second half of July, and traded at €55.12 on July 23. On July 18 we published our second-quarter results and adjusted our revenue guidance for 2013, due to the industry transformation in the cloud business. The SAP Supervisory Board proposed Jim Hagemann Snabe, who had announced that he would step down as co-CEO, to the Annual General Meeting of Shareholders in May 2014 as a candidate for Supervisory Board membership. The after-effects of SAP's adjusted revenue outlook coupled with a general reluctance to invest in the software sector pushed the share price down to €53.42 on September 5, its lowest level of the quarter.
At the beginning of October, investor worries ahead of our third-quarter results and weak market sentiment pushed the share price down to its lowest level for the year of €52.20 on October 9. After we confirmed our outlook guidance on Octo-ber 21 and announced another quarter of double-digit growth, the share price passed the €60.00 mark in the second half of November. The market also welcomed the news that SAP would tap into China's cloud market through a joint venture with China Telecom. After profit-taking in early December, a general year-end rally began mid-month that lifted the DAX to a new all-time high on December 27. Buoyed by this, the SAP share price climbed to finish the year at €62.31.
On January 21, 2014, SAP published its preliminary fourth-quarter and full-year results for 2013 and announced it had pushed back the target date for operating margin to help capture growth opportunities in the cloud. SAP now expects to reach its non-IFRS operating margin goal of 35% by 2017 rather than in 2015 as previously stated. Investors reacted to the news with caution, causing SAP stock to fall to €59.62.
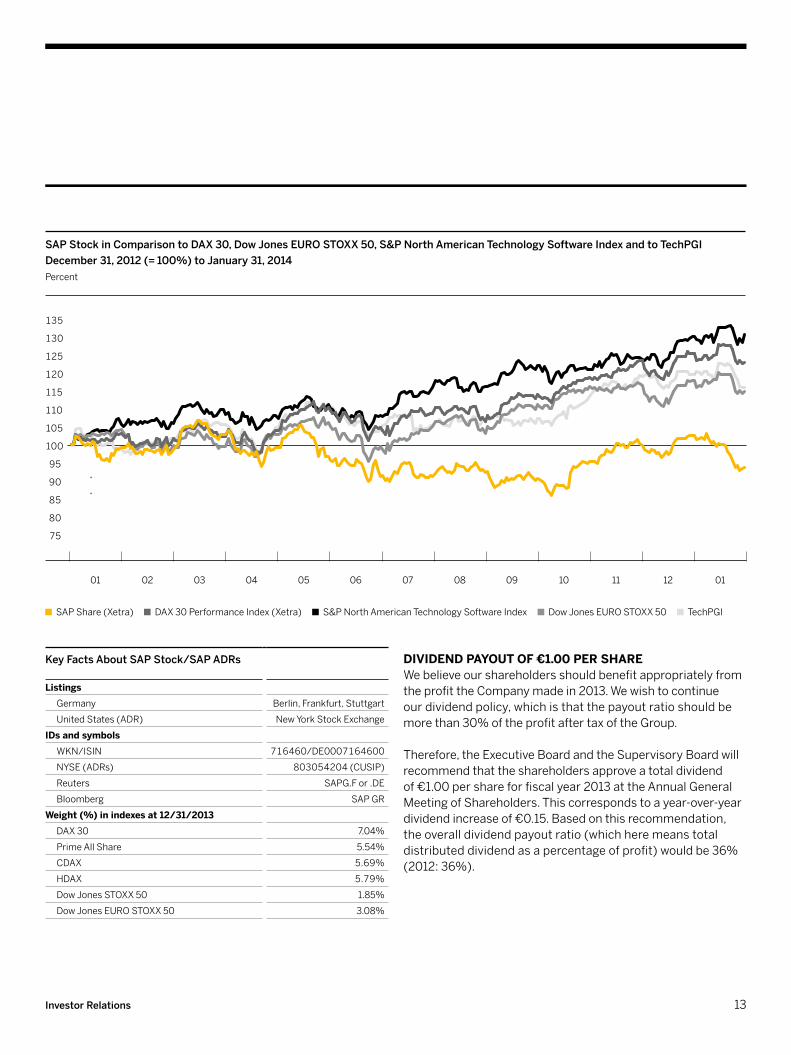
After significantly outperforming the major indexes in 2012, SAP stock increased 2.7% in 2013, while the DAX index increased 25.5%. Throughout the year SAP was in continuous dialog with investors about our strategy for innovation and growth. The key topics discussed were the SAP HANA platform, SAP’s shift to the cloud, the Ariba network business, and the changes to the SAP Executive Board in 2013.
StoCk MARketS At ReCoRD leVelSIn 2013, the U.S. Federal Reserve's ultra-loose monetary policy and low base interest rates in Europe boosted stock markets. Liquid financial markets repeatedly sent key indexes such as the U.S. Dow Jones Industrial Average index and Germany's DAX 30 to record levels.
In 2012, SAP stock gained 48.6%, ahead of major indexes. In 2013, the blue-chip and industry indexes made up ground, while SAP stock rose a further 2.7%. The DAX 30 and the Dow Jones EURO STOXX 50 index of blue-chip stocks in the euro area gained 25.5% and 18% respectively in 2013. The Dow Jones Industrial Average index gained 26.5%, the S&P 500 29.6%, and the S&P North American Technology Software Index 30.2%. SAP stock performed below average compared to other technology stocks: The Technology Peer Group Index (TechPGI), which lists ten major technology companies, rose 19.7%.
SAp StoCk At hIGheSt pRICe SInCe MARCh 2000After closing at €60.69 on the Xetra trading system at the end of 2012, SAP stock fell to €57.82 on January 22, 2013, its lowest level for the quarter. The publication of our preliminary final-quarter and full-year results on January 23 put the share price on an upward trajectory. The prospect of the Federal Reserve sticking to its stimulus program and a successful CeBIT for SAP lifted the share price on March 15 to €64.80, its highest value for the year and a level it had not seen since March 2000. In mid-March, the DAX passed the 8,000 point mark for the first time since December 2007.
Investor relations
12 To Our Stakeholders
Key Facts about sap stock/sap adrs
listings
Germany Berlin, Frankfurt, Stuttgart
United States (ADR) New York Stock Exchange
IDs and symbols WKN/ISIN 716460/DE0007164600
NYSE (ADRs) 803054204 (CUSIP)
Reuters SAPG.F or .DE
Bloomberg SAP GR
Weight (%) in indexes at 12/31/2013DAX 30 7.04%
Prime All Share 5.54%
CDAX 5.69%
HDAX 5.79%
Dow Jones STOXX 50 1.85%
Dow Jones EURO STOXX 50 3.08%
DIVIDenD pAyout oF €1.00 peR ShAReWe believe our shareholders should benefit appropriately from the profit the Company made in 2013. We wish to continue our dividend policy, which is that the payout ratio should be more than 30% of the profit after tax of the Group. Therefore, the Executive Board and the Supervisory Board will recommend that the shareholders approve a total dividend of €1.00 per share for fiscal year 2013 at the Annual General Meeting of Shareholders. This corresponds to a year-over-year dividend increase of €0.15. Based on this recommendation, the overall dividend payout ratio (which here means total distributed dividend as a percentage of profit) would be 36% (2012: 36%).
sap stock in Comparison to daX 30, dow Jones euro stoXX 50, s&p North american technology software Index and to techpGI December 31, 2012 (= 100%) to January 31, 2014Percent
SAP Share (Xetra) DAX 30 Performance Index (Xetra) S&P North American Technology Software Index Dow Jones EURO STOXX 50 TechPGI
01 02 03 04 05 06 07 08 09 10 11 12 01
135
130
125
120
115
110
105
100
95
90
85
80
75
SAP-Aktie im Vergleich zum DAX 30, zum EURO STOXX 50 und zum S&P North American Technology Software Index und zum TechPGI 31. Dezember 2012 (= 100 %) bis 31. Januar 2014Prozent
■ SAP-Aktie (Xetra) ■ DAX 30 Performanceindex (Xetra) ■ S&P North American Technology Software Index ■ Dow Jones EURO STOXX 50 ■ TechPGI
135
130
125
120
115
110
105
100
95
90
85
80
75
01 02 03 04 05 06 07 08 09 10 11 12 01
13Investor relations
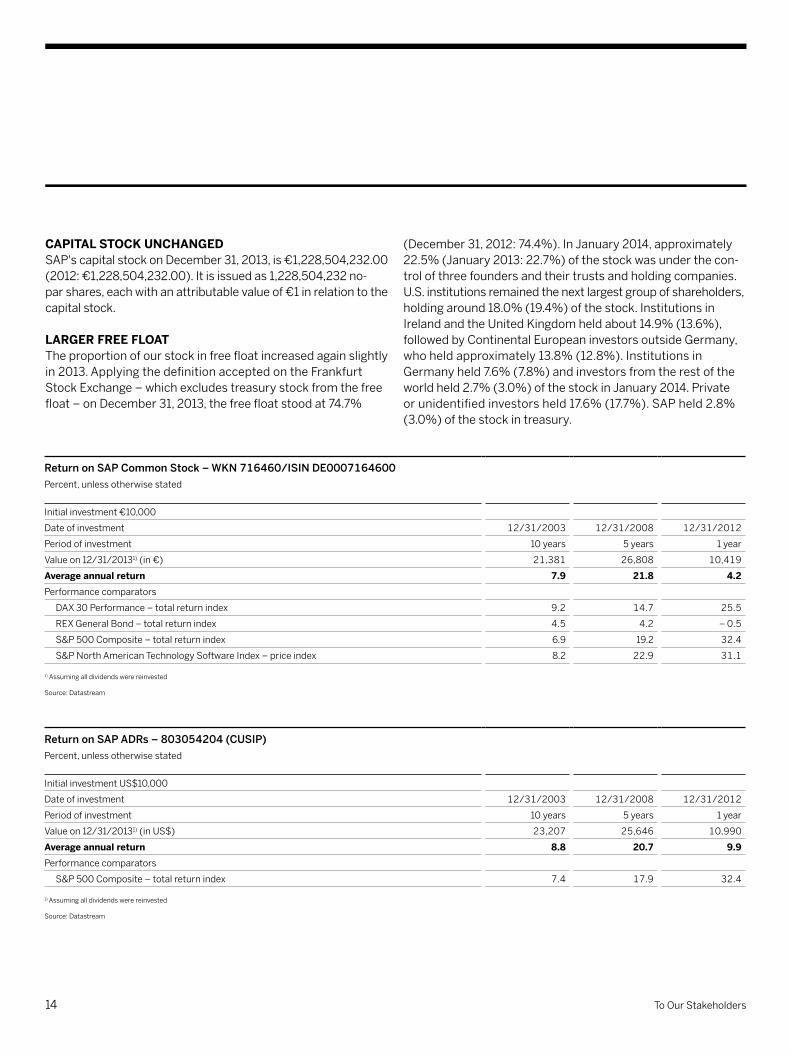
(December 31, 2012: 74.4%). In January 2014, approximately 22.5% (January 2013: 22.7%) of the stock was under the con-trol of three founders and their trusts and holding companies. U.S. institutions remained the next largest group of shareholders, holding around 18.0% (19.4%) of the stock. Institutions in Ireland and the United Kingdom held about 14.9% (13.6%), followed by Continental European investors outside Germany, who held approximately 13.8% (12.8%). Institutions in Germany held 7.6% (7.8%) and investors from the rest of the world held 2.7% (3.0%) of the stock in January 2014. Private or unidentified investors held 17.6% (17.7%). SAP held 2.8% (3.0%) of the stock in treasury.
CApItAl StoCk unChAnGeDSAP's capital stock on December 31, 2013, is €1,228,504,232.00 (2012: €1,228,504,232.00). It is issued as 1,228,504,232 no- par shares, each with an attributable value of €1 in relation to the capital stock.
lARGeR FRee FloAtThe proportion of our stock in free float increased again slightly in 2013. Applying the definition accepted on the Frankfurt Stock Exchange – which excludes treasury stock from the free float – on December 31, 2013, the free float stood at 74.7%
Return on SAP Common Stock – WKN 716460/ISIN DE0007164600Percent, unless otherwise stated
Initial investment €10,000
Date of investment 12/31/2003 12/31/2008 12/31/2012
Period of investment 10 years 5 years 1 year
Value on 12/31/20131) (in €) 21,381 26,808 10,419
Average annual return 7.9 21.8 4.2Performance comparators
DAX 30 Performance – total return index 9.2 14.7 25.5
REX General Bond – total return index 4.5 4.2 – 0.5
S&P 500 Composite – total return index 6.9 19.2 32.4
S&P North American Technology Software Index – price index 8.2 22.9 31.1
1) Assuming all dividends were reinvested
Source: Datastream
Return on SAP ADRs – 803054204 (CUSIP)Percent, unless otherwise stated
Initial investment US$10,000
Date of investment 12/31/2003 12/31/2008 12/31/2012
Period of investment 10 years 5 years 1 year
Value on 12/31/20131) (in US$) 23,207 25,646 10,990
Average annual return 8.8 20.7 9.9Performance comparators
S&P 500 Composite – total return index 7.4 17.9 32.4
1) Assuming all dividends were reinvested
Source: Datastream
14 To Our Stakeholders
CoMMunICAtIon WIth InVeStoRSSAP aims for the greatest possible transparency and openness in a continuous dialog with our shareholders. In several hundred one-on-one meetings held at SAP, during investor road shows worldwide, and at investor events, we answered inquiries from institutional investors and analysts about our business and strategy. We also held telephone conferences and analyst meetings when we published our quarterly results. Investor presentations at the SAPPHIRE NOW conferences, which took place in Beijing, China, and in Orlando, Florida, in the United States, were key elements of our communication with the financial markets. In addition, SAP engages in regular dialog with socially responsible investors (SRIs), by providing insight into SAP’s environmental, social, and corporate governance policies.
CoMpRehenSIVe SeRVICe FoR pRIVAte InVeStoRSProviding a full service for retail investors is a priority for SAP. Our services for private investors include investor presentations at various retail shareholder events, the shareholder hotline, e-mail contact at [email protected], investor relations information on our public Web site www.sap.com/investor, and a mobile Web site m.sapinvestorrelations.com. We provide a range of information for investors about SAP and SAP stock online, including press releases delivered by e-mail, social media including information provided on our SAP Investor Relations Twitter feed @sapinvestor, our quarterly SAP INVESTOR magazine, which investors can subscribe to free of charge, and a text message service. We also publish an overview of the latest analyst assessments in collaboration with Vara Research. All key events at which members of our Executive Board speak to financial analysts and institutions are broadcast live on the Internet, and we post the presentation materials on the investor relations area of our public Web site.
15Investor relations
ReSponSIBle MAnAGeMentWe are a global company with numerous subsidiaries around the world and an international shareholder base, so we need good governance. Good corporate governance means managing the Company accountably and transparently to secure long-term value, which is also the purpose of the standards and principles that apply in Germany and the world. We believe our shareholders, business partners, employees, and the financial markets reward good corporate governance with the increased trust they place in our Company.
CoRpoRAte GoVeRnAnCe At SApBecause SAP is listed on a German stock exchange, our corporate governance is based on the German Stock Corporation Act and on the German Corporate Governance Code (the “Code” in this report). Since SAP is also listed in the United States, we comply with the rules that apply to German companies listed on the New York Stock Exchange (NYSE). These include the requirements, as they apply to foreign private issuers, of the NYSE Corporate Governance Standards, the U.S. Sarbanes-Oxley Act of 2002, and the U.S. Securities and Exchange Commission (SEC). As required by the German Stock Corporation Act, section 161, SAP’s Executive and Supervisory Boards provide the Company’s shareholders with information about our implementation of the German Corporate Governance Code’s recommendations by publishing an annual declaration of implementation. In addition, the Executive Board publishes a corporate governance statement pursuant to the German Commercial Code, section 289 a, describing certain aspects of the Company’s corporate governance in greater detail. In accordance with section 3.10 sentence 1 of the German Corporate Governance Code, the Executive and Supervisory Boards report below about corporate governance at SAP in 2013.
exeCutIVe BoARDThe SAP Executive Board currently has five members. It is solely responsible for managing the Company. It has a duty to exercise its management powers in the interest of the Company and in pursuit of the sustained growth of corporate value. It discusses and agrees its strategy for the Company with the Supervisory Board, ensures compliance with the requirements of the law throughout the Group, and maintains effective risk management structures and internal risk controls.
GloBAl MAnAGInG BoARDIn May 2012, to help with its work the Executive Board set up the Global Managing Board. It currently comprises all of the Executive Board and four other global managers who play a part in directing large sections of the business. These additional members are appointed by the Executive Board with the Supervisory Board’s consent. The Global Managing Board has a coordinating function, advises the Executive Board and helps it make decisions, but the Executive Board retains overall responsibility for everything the Company does. It meets regularly and its meetings are chaired by the co-CEOs.
SupeRVISoRy BoARDThe SAP Supervisory Board has 16 members who, in equal numbers, represent the shareholders and the employees. It appoints, monitors, and advises the Executive Board. The Executive Board involves the Supervisory Board in decisions on matters of fundamental importance for the Company. The Supervisory Board has reserved to itself the approval of certain defined transactions of fundamental importance.
CoMpoSItIon oF the SupeRVISoRy BoARD In accordance with the recommendation in section 5.4.1, paragraph 2, of the Code, the Supervisory Board has defined the following objectives for its own composition:
– There should never be fewer than two people from the international stage on the shareholder representatives’ side of the Supervisory Board.
– No Supervisory Board member should be an employee, consultant, or director of a significant SAP competitor.
Corporate Governance report
16 To Our Stakeholders

– At least four shareholder representatives on the Supervisory Board should be independent members in the meaning of section 5.4.2 of the Code.
– No member of the Supervisory Board should be older than 75 years.
– At least one woman should sit on the Supervisory Board as a shareholder representative.
We believe the current composition of the Supervisory Board fulfills all of these objectives.
The General Meeting of Shareholders elects the shareholders’ side of the Supervisory Board. The Code recommends (at section 5.4.1, third paragraph, first sentence) that when the Supervisory Board proposes candidates for shareholders to elect or re-elect to the Supervisory Board, it should take into account the objectives it set for its own composition. In our Declaration of Implementation dated October 29, 2013, we reported that we did not follow that recommendation. Our Supervisory Board will, of course, have regard to the adopted objectives when seeking to identify suitable persons for candi-dacy and when preparing its recommendation of candidates to the General Meeting of Shareholders. In the interest of SAP, however, we must be in a position to recommend to the General Meeting of Shareholders those candidates we believe are best suited for the vacant Supervisory Board seats. Ordinarily, one of the suitability criteria will be whether a person’s candidacy is consistent with the defined objectives. However, that need not always be the only decisive criterion for proposing a particular candidate. Company law, which empowers the General Meeting of Shareholders to elect members to the Supervisory Board, requires neither that the Meeting adhere to the Supervisory Board’s objectives nor that it elect the Supervisory Board’s proposed candidates.
The Supervisory Board has regard to the following requirements for its composition:
– The Supervisory Board has at all times to be composed in such a way that its members as a group possess the knowledge, ability, and expert experience required to properly complete its tasks in our global IT company.
– Pursuant to the German Stock Corporation Act, section 100 (5), the Supervisory Board must at all times have at least one independent member with significant, recent, and relevant financial or auditing experience.
InDepenDenCe oF the SupeRVISoRy BoARDSAP believes a sufficient degree of independence of our Supervisory Board members is essential for effective and responsible corporate management and control. As reported above, our Supervisory Board has a defined objective for its composition regarding the minimum number of independent members on the shareholder representative side, as recom-mended in the Code, section 5.4.1, paragraph 2. At its meeting on October 10, 2013, the Supervisory Board determined that all of its shareholder representative members are independent in the meaning of the Code, section 5.4.2 and that the number of independent members is sufficient in the meaning of that section. The Audit Committee is chaired by Erhard Schipporeit, who for many years was the chief financial officer of a DAX company that is also listed on a U.S. stock exchange and therefore qualifies as an independent financial expert in the meaning of the German Stock Corporation Act, section 100 (5), and the equivalent U.S. provisions.
DIVeRSIty In the CoMpAnyThe Executive Board follows the recommendation in section 4.1.5 of the Code that requires executive boards to have regard to diversity when appointing people to leadership positions, and in particular to employ appropriate numbers of women in such positions. In support of this, we maintain a diversity policy for company leadership appointments. In May 2011, we also set a target to increase the percentage of women in leadership positions from 18% at the beginning of 2011 to 25% in 2017. We believe this is an ambitious target because there are still more men than women studying engineering subjects. It goes without saying that ability is still the primary selection criterion for any position at SAP. Globally, the percentage of women in leadership positions at the end of 2013 was 21.2 %.
17Corporate Governance report
CoRpoRAte GoVeRnAnCe StAteMentThe Executive Board published our corporate governance statement for 2013 pursuant to the German Commercial Code, section 289 a, on February 19, 2014. It is available on SAP’s Web site at www.sap.com/corporate-en/investors/governance. It includes the current declaration of implementation pursuant to the German Stock Corporation Act, section 161, certain information on corporate governance practices, and an account of how the Executive Board and the Supervisory Board work, who sits on which Supervisory Board committees, and how those committees work.
CoDe oF BuSIneSS ConDuCtSAP’s corporate governance includes our Code of Business Conduct for employees and members of the Executive Board. The Code of Business Conduct expresses the high standards that we require from our employees and Executive Board members and sets out the main principles that guide our business conduct toward customers, business partners, and shareholders. We see our Code of Business Conduct as the standard for our dealings involving customers, business partners, vendors, shareholders, and competitors. By following our Code of Business Conduct, we demonstrate a commitment against all forms of unfair competitive practice, corruption, and misrepresentation. A Global Compliance Office reporting to our general counsel monitors worldwide compliance with our Code of Business Conduct and other policies applying within the Group. It regularly reviews these internal policies, revises them if necessary, and delivers related employee training.
the WoRk oF the exeCutIVe AnD SupeRVISoRy BoARDSThe Executive Board and Supervisory Board cooperate closely for the benefit of the Company. The Executive Board regularly provides the Supervisory Board with full and timely reports on all material matters of strategy, business planning and performance, including any deviations of actual business performance from plan, risks, risk management, and corporate compliance. We provide our shareholders with in-depth information about how the Executive and Supervisory Boards work, how the committees are composed, and how these committees work, in our corporate governance statement. For
Section 5.1.2 of the Code contains the recommendation that supervisory boards should strive for an appropriate representation of women at executive board level as well. The Supervisory Board complies with this provision and has ruled that when a new member is needed for the Executive Board, applications should be sought from within SAP and from outside, and that the shortlist should be 50% women if possible. When we decide whom to appoint, the strengths and perfor-mance of the candidates would always be more important than their sex. Another long-term aim of the diversity policy for company leadership appointments mentioned above is to build a diverse pool of potential candidates for future Executive Board vacancies.
As reported above, the Supervisory Board has defined concrete objectives to promote diversity in its own membership and achieve an appropriate percentage of women members, as envisioned in the second paragraph of section 5.4.1 in the Code.
DeClARAtIon oF IMpleMentAtIon puRSuAnt to the GeRMAn StoCk CoRpoRAtIon ACt, SeCtIon 161Every year, the Executive Board and Supervisory Board issue a declaration stating whether SAP has implemented and is following the Code’s recommendations, and identifying any recommendations that the Company has not followed – with an explanation of why it has not done so. The declaration of implementation that we filed on October 29, 2013, is on the company Web site at www.sap.com/corporate-en/investors/governance/policies-statutes. Implementation declarations published in previous years are also available on this Web site, and links are provided to current and previous versions of the Code. As reported in the declaration of implementation, we follow all but eight of the 105 recommendations in the current Code. The reasons we do not follow these particular recommendations are described in detail in the declaration of implementation.
We voluntarily follow all six suggestions in the current Code.
18 To Our Stakeholders

more information about the joint work of the Executive and Supervisory Boards and about the work of the Supervisory Board and its committees in 2013, see the Report from the Supervisory Board.
ApplyInG InteRnAtIonAl CoRpoRAte GoVeRnAnCe StAnDARDSAs noted above, SAP is an NYSE-listed company and we are therefore subject to certain U.S. financial legislation (including among others the Sarbanes-Oxley Act of 2002) and to the applicable SEC and NYSE regulations. Besides implementing the requirements of the Sarbanes-Oxley Act, section 404, and other Sarbanes-Oxley Act requirements, including conducting an annual audit of our internal control over financial reporting, we comply with those of the corporate governance standards codified in the NYSE Listed Company Manual, section 303A, that bind foreign private issuers. The section 303A standards that apply to SAP include the requirement to have an audit committee composed of members who are independent in the meaning of the Sarbanes-Oxley Act, and related reporting requirements. In accordance with the SEC and NYSE corporate governance rules, we have also published, at Item 16G in our annual report on Form 20-F, a report on the significant differ-ences between the NYSE corporate governance standards and the German corporate governance rules, which we apply. We publish our annual report on Form 20-F on our Web site at www.sap.com/corporate-en/investors/newsandreports/reports in English only.
tRAnSpARenCy, CoMMunICAtIon, AnD SeRVICe FoR ShAReholDeRSOur shareholders can obtain full and timely information about SAP on our Web site and can access current and historical Company data. Among other information, we post all of our financial reports, all relevant news about the Company’s governing bodies and their corporate governance documenta-tion, information requiring ad-hoc (current) disclosure, press releases, and news of directors’ dealings notifiable pursuant to the German Securities Trading Act, section 15 a. Shareholders and the public are able to watch a live broadcast of the entire Annual General Meeting of Shareholders on the Internet. They can vote their shares at the meeting or instruct a proxy of their
choice or one of the proxies provided for that purpose by SAP. Our shareholders are also able to participate in the Annual General Meeting of Shareholders on the Internet and to vote their shares by postal ballot. The details are in the invitation to the Annual General Meeting of Shareholders. All of the docu-mentation related to the Annual General Meeting of Sharehold-ers is posted in good time on SAP’s Web site at www.sap.com/corporate-en/investors/governance/meetings. FInAnCIAl ACCountInG, RISk MAnAGeMent, AnD InteRnAl ContRolThe June 2013 Annual General Meeting of Shareholders appointed KPMG to audit the SAP AG and the consolidated financial statements. We prepare the SAP AG financial statements in accordance with the German Commercial Code and our consolidated financial statements in accordance with IFRS. We prepare a management report, as required by the German Commercial Code, and the Form 20-F annual report in accordance with SEC requirements. The Executive Board is responsible for financial accounting. The Supervisory Board approves the SAP AG financial statements, the consolidated financial statements, and the combined management report.
In addition to our annual financial statements, we also prepare quarterly reports for the first, second, and third quarters. Our quarterly reports comply with the German Securities Trading Act and are submitted to the Audit Committee of the Supervisory Board before they are published.
19Corporate Governance report
In 2012, SAP engaged its external independent auditor KPMG to conduct an audit on SAP’s worldwide compliance management system (CMS) according to the German auditing standard IDW PS 980 “Principles for the Proper Performance of Reasonable Assurance Engagements Relating to Compliance Management Systems”. The audit covered the appropriateness, implementation and operating effectiveness of SAP’s CMS in the areas of corruption and antitrust law in the period from July 1 to December 31, 2012. The audit was completed on July 5, 2013.
exeCutIVe BoARD AnD SupeRVISoRy BoARD ShAReholDInGS Section 6.3 sentence 2 in the Code recommends that the entire holdings of SAP shares shall be reported separately for the Management Board and Supervisory Board in the Corporate Governance Report. In fulfillment of this recommen-dation we refer to the Compensation Report of our Combined Management Report for 2013 which contains the respective data.
In German stock corporation and commercial law, there are special requirements for internal risk management that apply to SAP. To meet them, our global risk management system supports risk planning, identification, analysis, handling, and elimination. We maintain standard documentation of all our internal control structures and continually evaluate their effectiveness. As a company listed on the NYSE, we instruct our auditor, KPMG, to conduct an annual audit of our internal control over financial reporting in accordance with the requirements of the U.S. Sarbanes-Oxley Act of 2002, section 404. The audit as at December 31, 2013, confirmed that our internal control is effective. In compliance with the reporting requirements in the German Commercial Code, sections 289 (5) and 315 (2)(5), the combined SAP AG and SAP Group management report contains full information about the principal features of the internal controls and risk management structure applying to SAP’s consolidated financial reporting.
20 To Our Stakeholders
As the Supervisory Board, our role is to look beyond the financial results to also evaluate the Company’s overall vision and direction. SAP anticipated the fundamental shift in IT to cloud computing and to the real-time business process management that in-memory technology makes possible, and, as a market leader, is driving this change.
SAP HANA has revolutionized database technology and created the next generation of real-time business platforms. With total license revenue of €1.2 billion in less than three years and more than 3,000 customers worldwide, SAP HANA is the most successful product in SAP’s history. This technology is the basis of all SAP applications in the future.
The Company’s rapidly-growing cloud business also demonstrates its leadership in that segment. Cloud solutions from SAP have more than 35 million users, making SAP the largest cloud company worldwide. In 2013, it recorded
Dear Shareholders,
SAP had a very successful 2013. The Company had the fourth consecutive year of double-digit growth in non-IFRS software and software-related service revenue, accelerated its transition to a cloud company, continued to grow its core business, and increased its profitability. This combination of achievements is unique in the software industry and shows that the Company’s long-term strategy for innovation and growth is successful. In 2013, non-IFRS total revenue was €16.9 billion. Non-IFRS software and software-related service revenue increased 11% at constant currencies (by 6% to €14.0 billion at current exchange rates). Non-IFRS operating income increased by 14% to €5.9 billion at constant currencies. The operating margin widened by 150 basis points to 33.5% at constant currencies.
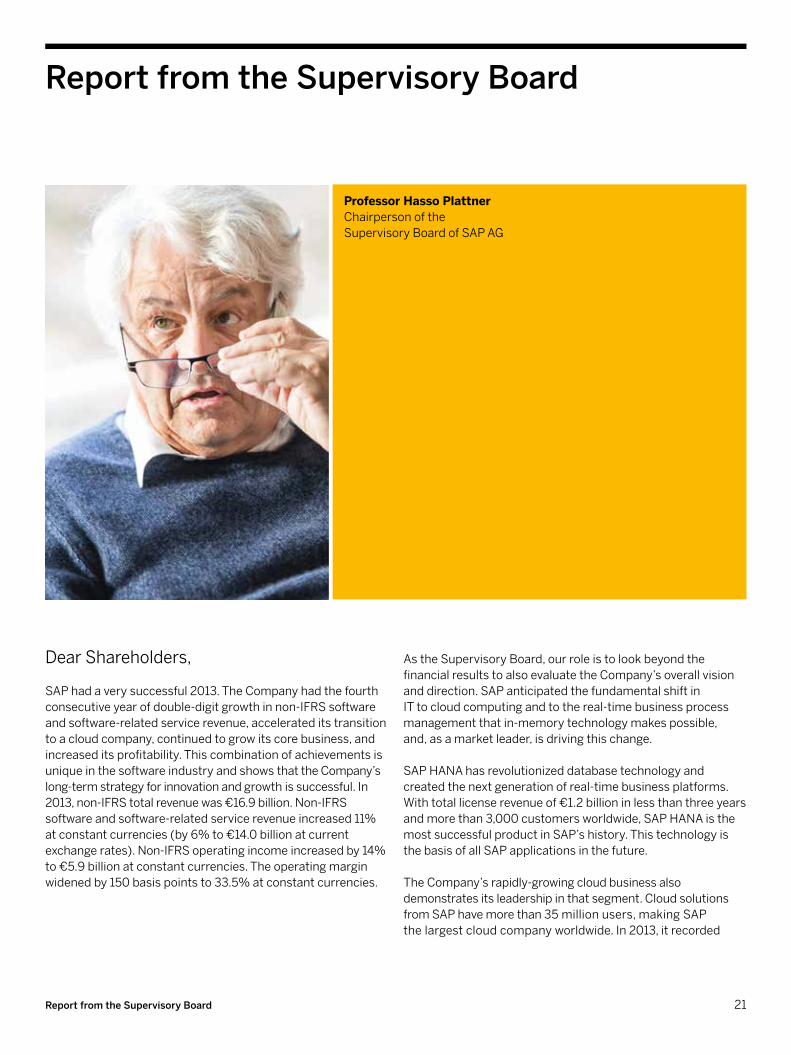
professor hasso plattner Chairperson of the Supervisory Board of SAP AG
report from the supervisory Board
21report from the supervisory Board
cloud subscription and support revenue of €757 million. The Company’s new technologies and the dynamism of its cloud business are the foundation for long-term and profitable growth and for extending its market leadership.
We follow these developments closely in the course of our Supervisory Board work. As always, the Supervisory Board relies on an open and sincere dialog with the Executive Board to efficiently organize and perform our duties. In our report, we describe the ongoing close cooperation between the two boards, the topics discussed at meetings of the Supervisory Board, the work of our committees, corporate governance at SAP, and the audit of SAP AG and the consolidated financial statements.
CoopeRAtIon BetWeen the exeCutIVe AnD SupeRVISoRy BoARDSIn 2013, we discharged the duties imposed on us by the law and by the Company’s Articles of Incorporation. We were continuously consulted by the Executive Board on the running of the Company; we scrutinized and monitored the work of management for legal compliance, adherence to proper accounting principles, appropriateness, and cost-effectiveness. The Executive and Supervisory Boards consulted on the Company’s strategy and regularly discussed progress on its implementation. We were involved whenever the Executive Board made decisions of fundamental importance to SAP.
The Supervisory Board received regular, full, and timely reports from the Executive Board, both from members in person and in written documents. Those reports chiefly concerned the Company’s strategy, plans, business performance, risks, risk management, compliance, and transactions of special significance for SAP. The Executive Board also indicated when the Company’s business deviated from the plans and targets and explained these deviations.
The content and scope of the Executive Board’s reports fully met the requirements that the Supervisory Board had placed on them. In addition to these reports, the Supervisory Board received supplementary information from the Executive Board. In particular, the Executive Board was available at Supervisory Board meetings for discussions and to answer our questions. We questioned and probed the Executive Board to satisfy ourselves that the information it provided us was plausible. The Supervisory Board maintains a list of the categories of transactions for which the Executive Board must obtain the Supervisory Board’s consent. The Supervisory Board continually reviews the list to see if it requires amendment. It was most recently amended in 2013. The Supervisory Board carefully considered all transactions in the listed categories and discussed them with the Executive Board, focusing on the benefits, risks, and other effects of each transaction. The Supervisory Board agreed to all transactions for which its consent was sought by the Executive Board.
The Executive Board also kept the chairperson of the Supervisory Board fully informed between meetings of the Supervisory Board and its committees. In particular, the co-CEOs met regularly with the chairperson of the Supervisory Board to discuss SAP’s strategy, planning, the Company’s business performance, risks, risk management, compliance, and other key topics and decisions. The Supervisory Board chairperson was informed without delay of important events that were significant for assessing SAP’s position and progress or for the management and governance of the Company.
SupeRVISoRy BoARD MeetInGS AnD ReSolutIonSThere were four ordinary meetings and two extraordinary meetings of the Supervisory Board in 2013. Resolutions of the Supervisory Board were adopted at these meetings or by correspondence vote. It is customary practice at our meetings that the Executive Board withdraws while we deliberate on items that pertain to the Executive Board or require discussion among Supervisory Board members alone. This happened at all Supervisory Board meetings in 2013. The Supervisory Board discussed the following matters and, where necessary, made resolutions.
22 To Our Stakeholders
We approved the engagement of a law firm in which a member of the Supervisory Board is a partner. The member concerned was excluded from the deliberations and voting on this matter.
The Executive Board reviewed business in 2012 and presented other management information, such as SAP’s market position and the Company’s plans through 2015.
The General and Compensation Committee, the Technology and Strategy Committee, the Audit Committee, the Finance and Investment Committee, and the Nomination Committee reported to us on their meetings. The General and Compensation Committee referred to the agenda items discussed at that same Supervisory Board meeting. The Audit Committee described progress on the 2012 financial statements and reported that at its last meeting it had been briefed about the findings from the audit’s focus areas. The Committee also reported on its deliberations on the Company’s internal control systems. The Finance and Investment Committee informed us about the annual report it receives on SAP Ventures and SAP HANA Real-Time Fund activities and about its discussions on the Company’s plans to establish a third venture capital fund. The Technology and Strategy Committee gave us an account of SAP HANA Enterprise Cloud, SAP Managed Services, and the user experience strategy it was discussing.
Meeting in March (Meeting to Discuss the Financial Statements)At our meeting on March 21, 2013, the Supervisory Board first turned its attention to SAP AG’s 2012 financial statements and the consolidated financial statements, the audits conducted by KPMG AG Wirtschaftsprüfungsgesellschaft (KPMG), and the Executive Board’s proposed resolution on the appropriation of retained earnings for 2012. The Audit Committee reported on all matters for which it is responsible in connection with the 2012 financial statements, particularly on the form and scope of its examination of the documents relating to the financial statements, and recommended that the Supervisory Board approve them. The auditor attended the meeting. Referring in particular to the six audit focus topics that had been agreed between the auditor and the Audit Committee, the auditor reported in detail on the audit and on the results. The auditor also related the discussions on those matters at the two p receding meetings of the Audit Committee. The auditor then discussed the results with the Supervisory Board and
Resolution Adopted by Correspondence in JanuaryIn January 2013, the Supervisory Board approved by correspondence vote the appointment of Rodolpho Cardenuto as president of the America region.
Meeting in FebruaryAt our meeting on February 14, 2013, the Supervisory Board discussed the 2013 budget. Based on the operational plan for 2013, which the Executive Board presented in detail, we agreed to the 2013 budget presented by the Executive Board, including the 2013 capital expenditure budget and liquidity plan.
We also received and discussed the recommendation of the General and Compensation Committee concerning Executive Board variable compensation for 2012. We first determined performance against the defined targets, and then decided the payouts for Executive Board members entitled under the 2012 short-term incentive (STI) plan by considering this performance and the discretionary element. We discussed performance against the annual financial targets for the 2010 and 2011 medium-term incentive (MTI) plans and determined the payout of the 2010 MTI plan. We determined the performance against the 2012 tranche of the RSU Milestone Plan 2015. We then turned our attention to Executive Board compensation for 2013. We identified the key performance indicators (KPIs) and set the target numbers for each KPI in the 2013 STI plan and their relative weightings. We adopted a resolution on Executive Board members’ individual allocation of rights under the RSU Milestone Plan 2015 (2013 tranche). Finally, we evaluated the appropriateness of the Executive Board members’ compen-sation for 2013, and in each case found it to be appropriate in terms of amount, structure, objective criteria, and for each member’s responsibilities and tasks.
On the recommendation of the General and Compensation Committee, we extended the Executive Board appointment of Werner Brandt from January 1, 2014, through June 30, 2014, amended his contract, and set his 2014 compensation.
23report from the supervisory Board
answered our questions. The Supervisory Board approved the audit. There were no findings from our own examination, so we gave our consent to the SAP AG and consolidated financial statements for 2012. We checked and endorsed the Executive Board’s proposal concerning the appropriation of retained earnings. In addition, we agreed our proposed resolutions for the agenda of the Annual General Meeting of Shareholders in June 2013. We adopted a proposal to the Annual General Meeting of Shareholders concerning the election of an auditor for 2013 that followed the recommendation of the Audit Committee.
At this meeting, we also deliberated on the Executive Board’s proposal to convert SAP AG to a European company (Societas Europaea, or SE), which would require Supervisory Board approval. After an in-depth discussion, the Supervisory Board gave its approval for the Executive Board to prepare the con-version of the Company’s legal form to an SE. A resolution on the conversion is to be put to the shareholders at the 2014 Annual General Meeting of Shareholders.
The Executive Board presented the forecast for the second quarter and reported on SAP HANA developments and plans.
Because a Supervisory Board member had left his previous law firm and had become a partner in another law firm, we approved the transfer of the Company’s engagements with the member’s previous law firm to the new firm, and consented to two additional engagements with that new firm. The Supervisory Board member concerned did not take part in the deliberations on these matters or the vote on the related resolution.
Under the appropriate agenda items, the Audit Committee and the Technology and Strategy Committee reported on their recent meetings.
Resolution Adopted by Correspondence in AprilThe Executive Board had chosen a law firm to advise on the employee co-determination procedure and preparation of the relevant documents ahead of the Company’s conversion to an SE. A member of the Supervisory Board is a partner in this law firm. In April 2013, the Supervisory Board approved by correspondence the instruction of this law firm to the extent the Executive Board envisioned and at the fees and hourly rates negotiated for the services. The Supervisory Board member concerned abstained from voting on the resolution.
Resolutions Adopted by Correspondence in MayOn the recommendation of the Finance and Investment Committee, in May 2013, we approved by correspondence additional capital for the SAP HANA Real-Time Fund and the creation of, and capital for, the new SAP Ventures II Fund.
In a second correspondence vote, we appointed Werner Brandt as labor relations director because Luisa Deplazes Delgado was about to leave the Executive Board and we approved the appointment of Bernd Leukert and Luka Mucic to the Global Managing Board with effect from July 1, 2013.
extraordinary Meeting in JuneAt our extraordinary meeting on June 4, 2013, we addressed the departure of Lars Dalgaard and Luisa Deplazes Delgado from the Executive Board. On the recommendation of the General and Compensation Committee, we adopted resolutions on the termination agreements with Luisa Deplazes Delgado and Lars Dalgaard, and on the consulting contract with Lars Dalgaard. The Executive Board also informed us about changes to its schedule of portfolios prompted by the departure of Lars Dalgaard and Luisa Deplazes Delgado. In a significant change designed to simplify the organizational structure and create one development organization, responsibility for all innovations was passed to Executive Board member Vishal Sikka. Gerhard Oswald’s portfolio was redefined as Scale, Quality & Support, to include responsibility for SAP HANA Enterprise Cloud. As part of these changes to the schedule of portfolios, Werner Brandt took over responsibility for Global HR.
24 To Our Stakeholders

Executive Board member to include the period from July 1, 2014, to December 31, 2016, and approved the extension of his appointment contract accordingly.
The Executive Board updated us about the preparations for the conversion of SAP AG to an SE.
The committees reported from their meetings on topics we had not covered elsewhere on the agenda. The Finance and Investment Committee presented in detail its deliberations from May and June about the planned acquisition of hybris. The Audit Committee reported on the quarter’s results, the audit focus areas for 2013, and the regular review of the Company’s system of internal controls. The Special Committee updated us on TomorrowNow litigation.
After the Executive Board had left the meeting, we discussed succession planning for the Executive and Global Managing Boards.
extraordinary Meeting in JulyWe held an extraordinary meeting by telephone conference on July 21, 2013. Jim Hagemann Snabe had informed us that he wished to step down from the Executive Board. After careful deliberation, the Supervisory Board decided to recommend him to the Annual General Meeting of Shareholders in May 2014 as a candidate for Supervisory Board membership, provided the statutory conditions were met for waiving the "cooling-off" period. We then deliberated on Jim Hagemann Snabe’s contract termination agreement. We resolved to terminate his appointment contract by mutual agreement with effect from the end of the Annual General Meeting of Shareholders on May 21, 2014.
We also discussed the acquisition of hybris. The Executive Board presented the grounds for acquiring the company, the agreed purchase price, and the terms of the purchase agreement. We discussed the key considerations of the acquisition and, on the recommendation of the Finance and Investment Committee, we approved the acquisition of hybris and the financing of the acquisition. In accordance with the applicable plan terms and conditions, we agreed that the targets of the long-term RSU Milestone Plan 2015, the 2013 STI, and the 2011 MTI should be adjusted to eliminate any nonrecurring effects of the hybris acquisition on Executive Board compensation.
Meeting in JulyThe meeting on July 11, 2013, was held in San Martin, California. The Supervisory Board had the opportunity to join the opening ceremony of the SAP Center in San Jose, visit SAP Labs in Palo Alto, and meet the representatives of major U.S. customers and SAP Ventures’ portfolio companies.
At our July meeting, the Executive Board gave us an account of business in the second quarter of 2013, performance in the first half-year, and the forecast for the second half-year. Notably, it informed us about the revenue of each division and region in the second quarter of 2013, the performance of the cloud division, and SAP’s competitive position in general. We discussed in detail the directors’ and officers’ group liability insurance policies that we take out from year to year, and approved them.
As proposed by the General and Compensation Committee, the Supervisory Board resolved to adjust the compensation of Executive Board member Vishal Sikka to reflect his increased responsibilities. Referring to a report that the independent compensation consulting firm Hostettler, Kramarsch & Partner had prepared, we checked that the compensation the Committee had proposed was appropriate and then approved it. We also resolved to extend Gerhard Oswald’s term of office as an
25report from the supervisory Board

Resolutions Adopted by Correspondence in AugustOn August 16, 2013, the Supervisory Board agreed by correspondence on the terms and conditions and the details of Jim Hagemann Snabe’s contract termination agreement that we had discussed at July’s extraordinary meeting. Under the termination agreement with Jim Hagemann Snabe, he receives fixed compensation for his Executive Board tenure in 2013 and 2014. A report from Ernst & Young confirmed the opinion we had reached in our own review that this compensation was appropriate. Apart from that, we have not agreed to make any payments in connection with Jim Hagemann Snabe’s leaving.
Resolutions Adopted by Correspondence in SeptemberOn September 6, 2013, again by correspondence and with the Executive Board’s agreement, we resolved to update the Company’s declaration of implementation of the German Corporate Governance Code (the “Code” in this report) pursuant to the German Stock Corporation Act, section 161. The declaration had to be updated because, under the termination agreement with Jim Hagemann Snabe, he receives only fixed cash compensation elements for his Executive Board tenure in 2013 and 2014. The agreement contains these arrangements because Jim Hagemann Snabe would transfer to the Supervisory Board if the conditions of the German Stock Corporation Act, section 100 (2)(4) are fulfilled and the Annual General Meeting of Shareholders elects him. An advantage of the agreed fixed cash compensation elements is that they avoid a conflict of interest for Jim Hagemann Snabe. If he were to receive the variable compensation elements SAP ordinarily pays its Executive Board members, such a conflict of interest would arise on his transfer to the Supervisory Board because (some) elements of his Supervisory Board compensation package would converge with those of the remaining Executive Board members.
Meeting in octoberIn our meeting on October 10, 2013, the Executive Board reported on third-quarter business and preliminary results. We then discussed strategy with the Executive Board in light of the Company’s performance.
After the Executive Board had left the meeting, we deliberated on a successor to Werner Brandt as chief financial officer. We agreed to appoint Luka Mucic to this position for a term of three years with effect from July 1, 2014. We discussed
Ernst & Young’s report on the appropriateness of the compensation that was to be offered to Luka Mucic. Our own review of the compensation had found it appropriate. We then agreed that and the other terms and conditions of Luka Mucic’s Executive Board appointment contract.
On the recommendation of the General and Compensation Committee, we resolved to again adjust the targets of the 2013 STI plan, 2011 MTI plan, and RSU Milestone Plan 2015. The targets had been adjusted for the hybris acquisition. Since the acquisition was completed later than expected, the targets had to be readjusted to the actual acquisition date.
The Executive Board gave a detailed account of developments in the cloud business, SAP Business Suite powered by SAP HANA, research, and support.
The next item on the agenda was the topic of women on the Executive Board and in leadership at SAP. The Executive Board reported on how the Company’s measures to promote diversity and increase the number of women in leadership positions were progressing.
We received a progress report on the preparations for converting SAP AG to an SE and were informed of who were the members of the Special Negotiating Body.
In agreement with the Executive Board, the Supervisory Board then adopted, for regular publication in October 2013, the annual declaration of implementation of the German Corporate Governance Code pursuant to the German Stock Corporation Act, section 161. The General and Compensation Committee reported that it had met immediately prior to our meeting to verify compliance with the declaration of implementation of the Code. The Supervisory Board determined that we have a sufficient number of independent members. Some Supervisory Board members currently have business dealings with SAP or hold senior positions in companies that currently have business dealings with SAP, or have done so in the course of the year. SAP’s business dealings with these persons or companies are or were at arm’s length. In our view, especially given the limited scope and materiality of those dealings, they did not affect the independence of the Supervisory Board members concerned and do not give rise to any substantial and not merely temporary conflict of interest in the meaning of the
26 To Our Stakeholders
– General and Compensation Committee: Hasso Plattner (chairperson), Panagiotis Bissiritsas, Wilhelm Haarmann, Lars Lamadé, Bernard Liautaud, Margret Klein-Magar
– audit Committee: Erhard Schipporeit (chairperson), Stefan Schulz, Inga Wiele, Klaus Wucherer
– Finance and Investment Committee: Wilhelm Haarmann (chairperson), Panagiotis Bissiritsas, Hartmut Mehdorn, Kurt Reiner
– technology and strategy Committee: Hasso Plattner (chairperson), Stefan Schulz (deputy chairperson), Pekka Ala-Pietilä, Anja Feldmann, Christiane Kuntz-Mayr, Bernard Liautaud, Margret Klein-Magar (joined in November 2013), Kurt Reiner, Mario Rosa-Bian (left in October 2013), Inga Wiele, Klaus Wucherer
– people and organization Committee: Hasso Plattner (chairperson), Anja Feldmann, Wilhelm Haarmann, Christiane Kuntz-Mayr, Lars Lamadé, Hartmut Mehdorn, Mario Rosa-Bian, Stefan Schulz
– Mediation Committee: Hasso Plattner (chairperson), Christiane Kuntz-Mayr, Hartmut Mehdorn, Mario Rosa-Bian
– Nomination Committee: Hasso Plattner (chairperson), Pekka Ala-Pietilä, Bernard Liautaud
– special Committee: Hasso Plattner (chairperson), Pekka Ala-Pietilä, Wilhelm Haarmann, Margret Klein-Magar, Lars Lamadé, Erhard Schipporeit
Each of the committees was active in 2013 except the Mediation Committee, which has never had to meet in the history of SAP.
For more information about the Supervisory Board committees and their duties, see SAP’s corporate governance statement pursuant to the German Commercial Code, section 289a, published on SAP’s Web site at: www.sap.com/corporate-en/investors/governance/index.epx.
During 2013, the committees focused on the following topics:– The General and Compensation Committee held eight
regular meetings, and outside these meetings it passed three resolutions by correspondence. A regular topic on its agenda was succession planning at Executive Board and Global Managing Board levels. The committee prepared the Supervisory Board’s resolutions on Executive Board compensation and on the compensation of the members of the Global Managing
Code. Specially designed questionnaires were sent to Supervisory Board and Executive Board members in August 2013 in connection with the regular review of the efficiency of the Supervisory Board’s activities pursuant to section 5.6 of the Code. Ahead of the meeting, we had received a written copy of the Supervisory Board chairperson’s analysis of the results of the survey concerning the efficiency of the work of the Supervisory Board and its committees. We discussed his analysis at the meeting.
On the recommendation of the General and Compensation Committee we resolved to set up a new committee for employee and organizational matters, the People and Organization Committee. We appointed the following members to the People and Organization Committee: Hasso Plattner (chairperson), Anja Feldmann, Wilhelm Haarmann, Christiane Kuntz-Mayr, Lars Lamadé, Hartmut Mehdorn, Mario Rosa-Bian, and Stefan Schulz. The committee is tasked with advising the Executive Board and Supervisory Board on recruitment, people development, major organizational changes, succession planning for the Global Managing Board and other executive positions, employee salary structures and budget, equal opportunities for women at SAP, and employee surveys. We approved a related change to the membership of the Technology and Strategy Committee. Margret Klein-Magar replaces Mario Rosa-Bian, who will step down from this committee. We were then informed about progress on the Company’s activities to attract talented university graduates worldwide and discussed this matter with the Executive Board.
The General and Compensation Committee, the Technology and Strategy Committee, and the Finance and Investment Committee reported on their recent meetings.
Resolution Adopted by Correspondence in novemberIn November, the Supervisory Board approved by correspon-dence the Executive Board’s plans to lease a new building in Paris to bring four SAP facilities together in one location.
the WoRk oF the SupeRVISoRy BoARD CoMMItteeSThe committees made a key contribution to the work of the Supervisory Board and reported on their work to us. The following committees were in place in 2013 (as of December 31, 2013):
27report from the supervisory Board
Board. It deliberated on the annual Capital Market Compliance Officer’s Report, the preparations for appointing a successor to Werner Brandt as chief financial officer, and the conversion of SAP AG to an SE. At its May 2013 meeting, the Committee discussed the termination agreements for Lars Dalgaard and Luisa Deplazes Delgado, who had resigned from the Executive Board. It also deliberated on compensation for Global Managing Board members. At its September meeting, the Committee agreed the resolutions it would propose to the Supervisory Board regarding adjustments to the STI, MTI, and long-term incentive (LTI) variable elements of compensation for Executive Board members. As explained above, the adjustments were required to eliminate the nonrecurring effects of the hybris acquisition. It also prepared the Supervisory Board’s resolution on Luka Mucic’s appointment as chief financial officer and deliberated on the plans to set up the People and Organization Committee and this new committee’s composition and tasks. At its October 2013 meeting, the Committee discussed the Company’s implementation of the German Corporate Governance Code recommendations and prepared the Supervisory Board’s decisions with respect to the submission of the declaration of implementation of the Code and on the independence of Supervisory Board members. It also prepared the Supervisory Board’s decision about who should sit on the People and Organization Committee and the tasks of that committee.
– The Finance and Investment Committee held four meetings, one of which was a joint meeting with the Technology and Strategy Committee. It also adopted one resolution by correspondence vote. At its meeting on February 11, 2013, the Committee received an update on the SAP Ventures and the SAP HANA Real-Time Fund. It discussed proposals for a new SAP Ventures Fund and for increasing the capital of the SAP HANA Real-Time Fund. It received a summary of equity investments in 2013 and of the work of our Mergers & Acquisitions team. At its May and June 2013 meetings, the Committee deliberated on the hybris acquisition. The Executive Board provided detailed information about its plans to acquire the company, and the Committee resolved
to recommend the acquisition to the Supervisory Board. At their joint meeting in October 2013, the Finance and Investment Committee and the Technology and Strategy Committee were informed about SAP’s competitive position and acquisition planning and analysis, and were updated on SAP HANA Enterprise Cloud, and discussed these matters. In November 2013, the Finance and Investment Committee approved by correspondence vote the sale of certain assets of a U.S. subsidiary of Sybase, Inc.
– The audit Committee held four meetings at which members attended in person and four telephone conference meetings. One focus of its work was SAP’s financial reporting, especially the SAP AG and consolidated financial statements, the combined SAP Group and SAP AG management report, and the Form 20-F annual report for 2012. Reviewing the system of risk management in the Group, oversight of the financial reporting process, the systems of internal control and risk management, and the internal audit were also key topics at its meetings. In several of its meetings in 2013, the Audit Committee received updates on the progress and results of the external audit on SAP’s worldwide compliance management system (CMS) for the areas of anticorruption and competition law. The Audit Committee’s view that the compliance pro-cesses at SAP are well designed, carefully implemented, and effective was strengthened by the results of the independent external audit of the CMS. In addition, the Committee did preparatory work on the Supervisory Board’s proposals to the Annual General Meeting of Shareholders for the distribution of retained earnings and the auditor to be elected for 2013, and verified the recommended auditor’s independence. Following the election of the auditor, the Audit Committee decided with the auditor on the focus areas of the audit and agreed the auditor’s fee. The Audit Committee deliberated regularly on SAP’s business performance and its impact on the Company’s financial accounting. It discussed with the Executive Board the 2012 results, the findings of the 2012 audit, the 2013 quarterly results and quarterly reports, and the auditor’s quarterly reviews of selected software agreements. The auditor attended all physical meetings of the Audit Committee meetings, and most of its teleconference meetings and reported in depth on its audit work and on its quarterly reviews of
28 To Our Stakeholders
– The special Committee is tasked with coordinating and managing the Supervisory Board’s external legal counsel concerned with the investigation and analysis of the facts in connection with the TomorrowNow litigation. The Special Committee invited the Company’s attorneys to its July meeting, held in St. Martin, California, so that they could inform the Committee in person about the latest develop-ments and the court of appeals’ potential verdicts.
– The new people and organization Committee held its inaugural meeting and adopted its rules of procedure in December 2013. It deliberated on the results of the 2013 employee survey and analyzed them closely. It was informed about personnel planning and development at SAP, and discussed proposals for improvements to the recruitment process.
Regular reports from the committees ensured that the Supervisory Board was kept fully informed of all matters covered by the committees and were able to discuss them thoroughly.
CoRpoRAte GoVeRnAnCeSAP’s corporate governance officer monitored our compliance with those recommendations in the Code with which, in our declaration, we claim to comply, and reported in full to the General and Compensation Committee. Members of the Executive Board and of the Supervisory Board had no conflicts of interest that sections 4.3.4 and 5.5.2 of the Code require to be disclosed to the Supervisory Board. As we reported above, the Supervisory Board consented to the conclusion of contracts with a member of the Supervisory Board. There was also a transaction between the Company and a member of the Executive Board. It was consistent with industry standards and was immaterial. The General and Compensation Committee consented to this transaction. The Company made no other contracts with members of the Executive Board or Supervisory Board that would have required a prior resolution of the Supervisory Board.
For more information about Code compliance, see the Execu-tive and Supervisory Boards’ Corporate Governance Report. The Supervisory Board closely examined the Executive Board’s corporate governance statement pursuant to the German Commercial Code, section 289a. We approved the statement with the combined SAP Group and SAP AG management report.
selected software agreements. In addition to these discussions in the physical meetings, the Executive Board held telephone conferences with the Audit Committee before the announcement of the preliminary quarterly results to inform Committee members about progress on the quarterly financial statements and the quarterly reviews of selected software agreements, and about the preliminary quarterly results. The Audit Committee also discussed each quarterly report with the Executive Board in these telephone conferences. At its July 10 meeting, the Audit Committee was informed by KPMG about the planned audit focus areas. At its meeting on October 9, 2013, the Committee was informed about the governance model for the human resources function with particular regard to risk management and people management. It discussed the effectiveness of the Company’s internal control structure, internal audit service, and compliance system, as described above. The Committee also reviewed the internal audit service’s audit plan.
– The technology and strategy Committee met four times in 2013. It discussed the key technology trends in the software industry in the years to come and SAP’s corporate and product strategies. The meetings primarily addressed SAP HANA technology and plans to use SAP HANA as the platform for SAP applications. The Committee’s work also focused on the Company’s cloud computing strategy and its implementation. As reported above, in October the Committee held a joint meeting with the Finance and Investment Committee to discuss SAP’s acquisition strategy and review past acquisitions. The Committee discussed the user experience strategy and the strategy for customer relationship management applications.
– The Nomination Committee, whose members are all shareholder representatives, held one meeting in 2013. At this meeting, in February, it deliberated on the future composition of the Supervisory Board and the plans to convert SAP AG to an SE.
29report from the supervisory Board
SAp AG AnD ConSolIDAteD FInAnCIAl RepoRtS FoR 2013KPMG audited the SAP AG and consolidated financial reports for 2013. The Annual General Meeting of Shareholders elected KPMG as the SAP AG and SAP Group auditor on June 4, 2013. The Supervisory Board proposed the appointment of KPMG on the recommendation of the Audit Committee. Before proposing KPMG to the Annual General Meeting of Shareholders as auditor for the year, the chairperson of the Supervisory Board and the Audit Committee obtained confirmation from KPMG that circumstances did not exist that might prejudice or raise any doubt concerning its independence as the Company’s auditor. In that connection, KPMG informed us of the volume of other services it provided to the Group in the past year and had been engaged to provide in the year to come. The Supervisory Board has agreed with KPMG that the auditor should report to the Supervisory Board and record in the auditor’s report any fact found during the audit that is inconsistent with the declaration given by the Executive Board and the Supervisory Board concerning implementation of the German Corporate Governance Code. KPMG examined the SAP AG financial statements prepared in accordance with the German Commercial Code, the consolidated financial statements prepared in accordance with International Financial Reporting Standards (IFRSs) as required by the German Commercial Code, section 315a, and the combined SAP Group and SAP AG management report, and certified them without qualification. The auditor thus confirmed that, in its opinion and based on its audit in accordance with the applicable accounting principles, the SAP AG and consolidated financial statements give a true and fair view of the net assets, financial position, and results of operations of SAP AG and the SAP Group. The auditor also confirmed that the combined SAP AG and SAP Group management report is consistent with the corresponding financial statements and as a whole gives a suitable view of the position of SAP AG and the SAP Group and of foreseeable
opportunities and risks. KPMG had completed its audit of SAP’s internal control systems over financial reporting and certified without qualification that it complies with the applicable U.S. standards. The auditor states in its opinion that it considers SAP’s internal controls over financial reporting to be effective in all material respects. All Audit Committee and Supervisory Board members received the documents concerning the financial statements mentioned above, the audit reports prepared by KPMG, and the Executive Board’s proposal concerning the appropriation of retained earnings in good time.
On February 20, 2014, the Executive Board prepared the financial reports of SAP AG and the Group for 2014, comprising the SAP AG financial statements, the consolidated financial statements, and the combined management report, and submitted them to the Supervisory Board without delay.
At the meeting of the Audit Committee on Wednesday, March 19, 2014, and at the meeting of the Supervisory Board on Thursday, March 20, 2014, the Executive Board explained the financial statements of SAP AG and the SAP Group and its proposal concerning the appropriation of retained earnings. At the meetings, members of the Executive Board also answered questions from the Audit Committee and the Supervisory Board. It also explained the annual report on Form 20-F to the Audit Committee meeting.
After the explanations from the Executive Board, the Audit Committee and the Supervisory Board reviewed the financial statement documents in the light of KPMG’s audit reports. The representatives of the auditor who attended presented full reports on the audit and the results of the audit to the Audit Committee and Supervisory Board meetings and explained the audit report. The auditor also reported that it had not identified any material weaknesses in our internal control and risk- management systems for financial reporting. Both the Audit Committee and the Supervisory Board asked detailed questions
30 To Our Stakeholders
the interests of the shareholders. We also discussed these matters with the auditor. On recommendation of the Audit Committee, we then endorsed the Executive Board’s proposal concerning the appropriation of retained earnings. We approved this present report.
MeMBeRShIp ChAnGeS on the SupeRVISoRy BoARD AnD exeCutIVe BoARD The following members left the Executive Board: Lars Dalgaard on May 31, 2013; and Luisa Deplazes Delgado on June 30, 2013. The Supervisory Board appointed Executive Board member Werner Brandt as labor relations director.
The Supervisory Board thanks the Executive Board, the managing directors of the Group companies, and all of our employees for their hard work and dedication in 2013. We would also like to thank our customers and partners. Without them, our Company’s success would not be possible.
For the Supervisory Board
Hasso plattner(Chairperson)
about the form, scope, and results of the audit. The Audit Committee reported to the Supervisory Board on its own review of the financial accounts, its discussions with the Executive Board and with the auditor, and its supervision of the financial reporting process. It confirmed that as part of its supervisory work, it had addressed the effectiveness of internal control, risk management, and internal auditing systems of the SAP Group and found them to be effective.
The Committee also reported that KPMG had told it no circumstances had arisen that might give cause for concern about KPMG’s impartiality and had listed the services it had provided that were not part of the audit. The Committee reported that it had examined the auditor’s independence, taking the non-audit services it had rendered into consideration, and stated that in the Committee’s opinion the auditor possessed the required degree of independence.
The Audit Committee and the Supervisory Board were able to satisfy themselves that KPMG had conducted the audit properly. In particular, they concluded that both the audit reports and the audit itself fulfilled the legal requirements. On the basis of the report and the Audit Committee’s recommendation, the Supervisory Board approved the audit and, because there were no findings from our own examination, we gave our consent to the SAP AG financial statements, the consolidated financial statements, and the combined management report (including the Executive Board’s corporate governance statement pursuant to the German Commercial Code, section 289a). The financial statements and combined management report were thus formally adopted. The Supervisory Board’s opinion of the Company and the Group coincided with that of the Executive Board as set out in the combined management report. The Supervisory Board considered the proposal presented by the Executive Board concerning the appropriation of retained earnings. In doing so, we considered to the requirements of dividends policy, the effects on the liquidity of the Group, and
31report from the supervisory Board
The following criteria apply to the elements of Executive Board compensation for 2013:– The fixed element is paid as a monthly salary.– The variable compensation under the STI 2013 plan depends
on the SAP Group’s performance against the KPI target values for non-IFRS constant currency software revenue growth and non-IFRS constant currency operating margin increase as well as non-IFRS constant currency new and upsell billings. In addition, the STI element has a discretionary component that allows the Supervisory Board, after the end of the period in question, to address not only an Executive Board member’s individual performance, but also SAP’s performance in terms of market position, innovative power, customer satisfaction, employee satisfaction, and attractiveness as an employer. Moreover, if there has been any extraordinary and unfore-seeable event the Supervisory Board can, at its reasonable discretion, retroactively adjust payouts up or down in the interest of SAP. On February 13, 2014, the Supervisory Board assessed SAP’s performance against the agreed targets and determined the amount of STI payable. The STI pays out after the Annual General Meeting of Shareholders in May 2014.
– The long-term incentive element is called the RSU Milestone Plan 2015. “RSU” stands for “restricted share unit.” This four-year plan focuses on the SAP share price and on certain objectives derived from our Company strategy for the years through 2015. For each of the four years, the members of the Executive Board are allocated a certain number of SAP RSUs for the respective year based on a budget amount that was granted to each Executive Board member in 2012 already for the years 2012 through 2015. The number of RSUs allocated to each member for a given year is his or her target amount (an amount in euros) for that year divided by the SAP share price over a reference period (defined in the RSU Milestone Plan 2015 terms) at the beginning of the year in question. The number of RSUs an Executive Board member actually earns in respect of a given year depends on Company performance against the objectives for that year (a year is a “performance period” in the plan). The objectives derive from SAP’s strategy for the period to 2015. The plan objectives
CoMpenSAtIon FoR exeCutIVe AnD SupeRVISoRy BoARD MeMBeRSThis compensation report outlines the criteria that we applied for the year 2013 to determine compensation for Executive Board and Supervisory Board members, discloses the amount of compensation paid, and describes the compensation systems. It also contains information about Executive Board members’ share-based payment plans, shares held by Executive Board and Supervisory Board members, and the directors’ dealings required to be disclosed in accordance with the German Securities Trading Act.
CoMpenSAtIon FoR exeCutIVe BoARD MeMBeRS
Compensation System for 2013Executive Board members’ compensation for 2013 is intended to reflect SAP’s size and global presence as well as our economic and financial standing. The compensation level is internationally competitive to reward committed, successful work in a dynamic business environment.
The Executive Board compensation package is performance-based. In 2013, it had three elements: – A fixed annual salary– A variable short-term incentive (STI) plan to reward
performance in the plan year– A Restricted Share Unit-based long-term incentive (LTI) plan
tied to the price of SAP shares (RSU Milestone Plan 2015)
The Supervisory Board set a compensation target for the sum of the fixed and the variable elements. It reviews, and if appropriate revises, this compensation target every year. The review takes into account SAP’s business performance and the compensation paid to board members at comparable companies on the international stage. The amount of variable compensation depends on SAP’s performance against performance targets that the Supervisory Board sets for each plan year. The performance targets are key performance indicator (KPI) values aligned to the SAP budget for the plan year.
Compensation report1)
1) This Compensation report is part of the audited management report.
32 To Our Stakeholders
relate to two key performance indicators (KPIs): our non-IFRS total revenue and our non-IFRS operating profit. The KPI targets have already been set for the entire life of the RSU Milestone Plan 2015 for the years 2012 to 2015 and will merely be adjusted for the effects of key acquisitions. After the end of each fiscal year, the Supervisory Board assesses the Company’s performance against the objectives set for that year and determines the number of RSUs to be finally allocated to (and which then vest in) each Executive Board member. There are objective-based performance hurdles to clear each year before any RSUs can vest. There is also a cap: Normally, the quantity of vested RSUs a member can attain in respect of a plan year is capped at 150% of his or her initial RSU allocation for that year. The Company strategy underlying the RSU Milestone Plan 2015 focuses on where SAP aims to be by 2015, so the plan gives greater weight to performance against the KPI targets for 2015 (the final year of the plan) than against the targets for 2012 through 2014. After the end of 2015, the number of vested RSUs a member of the Executive Board actually receives for that year is revised. In circumstances where the targets for the individual years are not achieved but the 2015 targets are achieved, the outcome of this revision would be that a member would receive as many vested RSUs for 2015 as would make up for any that he or she did not receive in the earlier years by reason of failure to achieve targets. On the other hand, if the Company underachieves against the 2015 objectives, Executive Board members may in a worst case scenario lose all of the vested RSUs allocated to them for 2015. All vested RSUs are subject to a three-year holding period. The holding period commences at the end of the year for which the RSUs were allocated. The amount an RSU eventually pays out depends on the SAP share price at the end of the holding period. A member who leaves the Executive Board before the end of the plan retains his or her vested RSUs for completed plan years but does not retain any allocated but unvested RSUs for the year during which he or she leaves. If a member leaves the Executive Board before the beginning of the subsequent year, no RSUs are finally allocated.
Each vested RSU entitles its holder to a (gross) payout corresponding to the price of one SAP share after the end of the three-year holding period. The applicable share price is measured over a reference period defined in the RSU Mile-stone Plan 2015 terms. Subject to the requirements in the German Stock Corporation Act, section 87 (1), the Supervisory Board is entitled to revise the STI and the LTI in extraordinary and unforeseeable circumstances. For the terms and details of the RSU Milestone Plan 2015, see the Notes to Consolidated Financial Statements section, Note (27). The number of RSUs to be issued to each member of the Executive Board in 2013 by way of long-term incentive was decided by the Supervisory Board on February 14, 2013. An additional long-term incentive plan (LTI HANA) has been dedicated to Vishal Sikka to align his remuneration to his new expanded role with regard to SAP HANA. The LTI HANA for the years 2013 to 2015 consists of three annual compensation components with an assessment period of three years that will be cash-settled after this period. The LTI HANA is linked to KPIs specific to SAP HANA.
The contracts of Executive Board members Bill McDermott, Lars Dalgaard, and Vishal Sikka include clauses that determine the exchange rates for the translation of euro-denominated compensation into U.S. dollars.
In 2010 and 2011, the Executive Board members were granted a variable medium-term incentive (MTI) plan to reward perfor-mance in the plan year and the two subsequent years. The variable compensation under the MTI 2011 granted for the fiscal year 2011 depends on the Group’s performance over the three years 2011 to 2013 against the KPI target values for software and software-related service revenue growth and earnings per share (both of which are non-IFRS, constant cur-rency values). In addition, the MTI element has a discretionary component that is assessed by the Supervisory Board at the end of the plan period. The close of the fiscal year 2013 represents the end of the plan period for the MTI 2011, and therefore the corresponding entitlement under the MTI 2011 is included in the compensation for the fiscal year 2013. The payment will be due after the Annual General Meeting of Shareholders in May 2014.
33Compensation report

In 2012, the Executive Board members already received the LTI grants for the years 2012 to 2015, which are dependent on their uninterrupted tenure as Executive Board members in the years in question. Although these allocations are tied to the respective years and thus – from an economic perspective – represent compensation for the Executive Board members in the respective years, for the purpose of disclosure in the Compensation Report the grants had to be included in the total
compensation for Executive Board members for the year in which the grants were allocated (in 2012) pursuant to section 314 of the German Commercial Code (HGB). The share-based payment amounts in the table above disclose the LTI grants for the year 2013 that were already granted in 2012 and included in the total compensation for 2012. Consequently they are excluded from the total Executive Board compensation for 2013 (see second next paragraph) calculated as required under section 314 of the German Commercial Code.
executive Board Members’ Compensation for 2013€ thousands
Fixed elements performance-Related element Compensation for 20131)
Short-Term and Medium-Term Incentive Elements
Long-Term Incentive Element
Salary Other1) STI MTI 2011 Share-Based Payment (RSU Milestone Plan
2015)2)
Bill McDermott (co-CEO) 1,150.0 1,570.5 1,737.2 1,011.1 4,143.5 9,612.3
Jim Hagemann Snabe (co-CEO) 1,150.0 6,082.9 1,737.2 1,011.1 – 9,981.2
Dr. Werner Brandt 700.0 29.0 1,051.5 611.0 1,486.4 3,877.9
Lars Dalgaard (until May 31, 2013)3) 291.7 203.3 469.1 – – 964.1
Luisa Deplazes Delgado (until June 30, 2013)3) 350.0 26.1 421.0 – – 797.1
Gerhard Oswald 700.0 17.0 1,051.5 611.0 1,486.4 3,865.9
Dr. Vishal Sikka 700.0 383.6 1,051.5 611.0 1,486.4 4,232.5
total 5,041.7 8,312.4 7,519.0 3,855.2 8,602.7 33,331.0
1) Insurance contributions, benefits in kind, expenses for maintenance of two households, relocation costs, non-recurring payments, use of aircraft, tax, cash disbursement of long-term incentive element, discrete payments arising through application of the fixed exchange rate clause. The effects from the application of the fixed exchange rate clause are disclosed under “Other” (in the prior year under the different compensation components). Further, these amounts are shown in the year of payment rather than in the year of entitlement of the underlying compensation. The amount for Jim Hagemann Snabe under “Other” includes the fixed payments for the 2012 and 2013 RSUs according to the description below.
2) Compensation attributable to Executive Board members for 2013 including the 2013 plan tranche of LTI 2015 based on the grant value at time of grant.3) Salary and STI for 2013 are pro rata temporis amounts until the end of the respective term. The RSUs allocated for 2013 are forfeited upon the end of their contract.
34 To Our Stakeholders

Jim Hagemann Snabe resigned his seat on the Executive Board with effect from May 21, 2014 (Annual General Meeting of Shareholders). The SAP Supervisory Board will propose that he be elected to the SAP Supervisory Board by the SAP share-holders on the same day. Mr. Snabe’s termination agreement provides as follows: To replace the payout for 2012 RSUs under the RSU Milestone Plan that on allocation in 2012 were valued €4,318,400 based on a stock price of €45.26, he will be paid €6,485,800 gross based on a stock price of €52.96 (that is, the mean of the 2012 and 2013 reference prices) discounted at 2% because of early payment. Of that amount, €4,318,400, which was already allocated in 2012 and which was the grant value at time of grant, was already included in 2012 compensa-tion. The difference of €2,167,400 is included in the total compensation for 2013 (see below). The RSUs allocated for 2013 were converted into a fixed payment of €3,768,300 (gross amount) based on a share price of €58.69, a target achievement of 92.97%, and it is discounted at an interest rate of 2% over the period to the original contractual disbursement date. This amount will be paid out after the close of the Annual General Meeting of Shareholders in May 2014.
To compensate for his 2014 RSUs, Mr. Snabe will receive a prorated payment of €1,700,000 in respect of the period he serves in 2014. This amount will also be paid out after the close of the Annual General Meeting of Shareholders in May 2014.
Including allocations for 2014 and 2015 to Gerhard Oswald (€1,574,800 each) that were allocated in 2013 in line with the extension of his Executive Board contract, the total Executive Board compensation calculated as required under section 314 of the German Commercial Code amounts to €24,109,600, thereof: Bill McDermott €5,468,800, Jim Hagemann Snabe €6,212,900, Werner Brandt €2,391,500, Lars Dalgaard €964,100, Luisa Deplazes Delgado €797,100, Gerhard Oswald €5,529,100, and Vishal Sikka €2,746,100.
The share-based payment amounts in 2013 result from the following RSUs under the RSU Milestone Plan 2015.
share-Based payment under rsu Milestone plan 2015
Grants for 2013Quantity Total Grant Value
at Time of Grant1)
€ thousands
Bill McDermott (co-CEO) 73,289 4,143.5
Jim Hagemann Snabe (co-CEO)2) – –
Dr. Werner Brandt 26,290 1,486.4
Lars Dalgaard (until May 31, 2013)2) – –
Luisa Deplazes Delgado (until June 30, 2013)2)
– –
Gerhard Oswald 26,290 1,486.4
Dr. Vishal Sikka 26,290 1,486.4
total 152,159 8,602.7
1) The grant value of each RSU allocated in 2013 was €56.54. 2) The allocations for Jim Hagemann Snabe (73,289 RSUs) were converted into a fixed payment. The allocations
for Lars Dalgaard (26,290 RSUs) and Luisa Deplazes Delgado (21,562 RSUs) forfeited upon the end of their contract. Consequently they are not disclosed in the table above.
35Compensation report
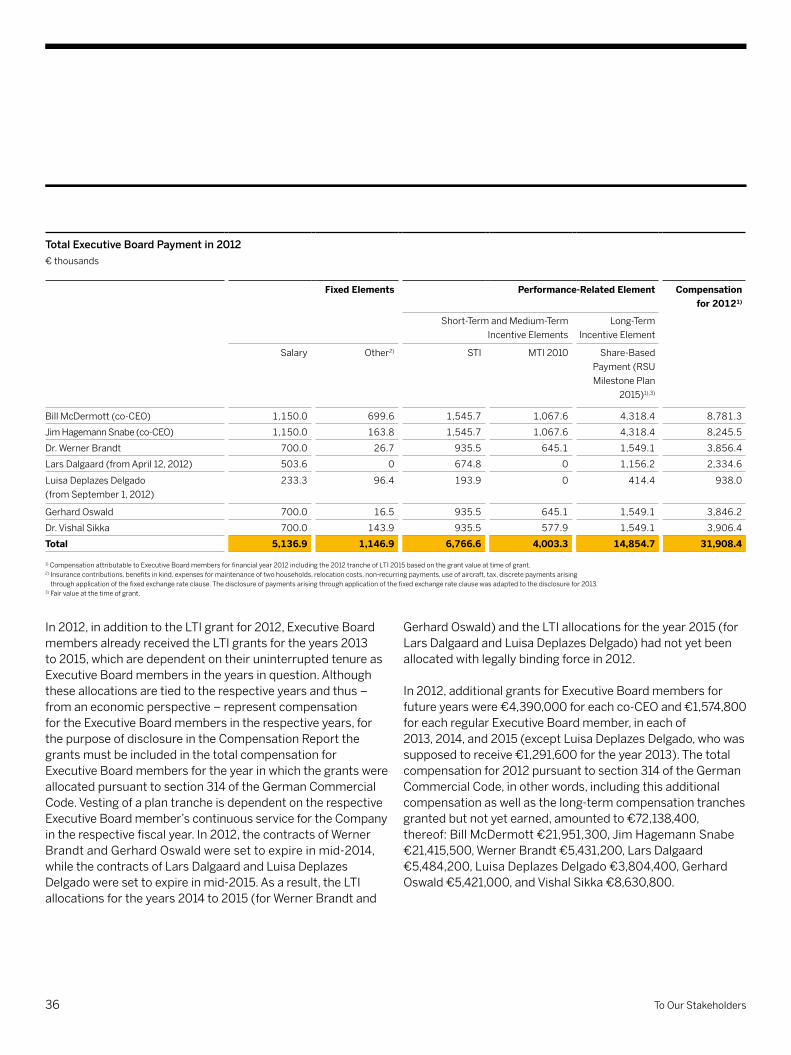
In 2012, in addition to the LTI grant for 2012, Executive Board members already received the LTI grants for the years 2013 to 2015, which are dependent on their uninterrupted tenure as Executive Board members in the years in question. Although these allocations are tied to the respective years and thus – from an economic perspective – represent compensation for the Executive Board members in the respective years, for the purpose of disclosure in the Compensation Report the grants must be included in the total compensation for Executive Board members for the year in which the grants were allocated pursuant to section 314 of the German Commercial Code. Vesting of a plan tranche is dependent on the respective Executive Board member’s continuous service for the Company in the respective fiscal year. In 2012, the contracts of Werner Brandt and Gerhard Oswald were set to expire in mid-2014, while the contracts of Lars Dalgaard and Luisa Deplazes Delgado were set to expire in mid-2015. As a result, the LTI allocations for the years 2014 to 2015 (for Werner Brandt and
Gerhard Oswald) and the LTI allocations for the year 2015 (for Lars Dalgaard and Luisa Deplazes Delgado) had not yet been allocated with legally binding force in 2012.
In 2012, additional grants for Executive Board members for future years were €4,390,000 for each co-CEO and €1,574,800 for each regular Executive Board member, in each of 2013, 2014, and 2015 (except Luisa Deplazes Delgado, who was supposed to receive €1,291,600 for the year 2013). The total compensation for 2012 pursuant to section 314 of the German Commercial Code, in other words, including this additional compensation as well as the long-term compensation tranches granted but not yet earned, amounted to €72,138,400, thereof: Bill McDermott €21,951,300, Jim Hagemann Snabe €21,415,500, Werner Brandt €5,431,200, Lars Dalgaard €5,484,200, Luisa Deplazes Delgado €3,804,400, Gerhard Oswald €5,421,000, and Vishal Sikka €8,630,800.
total executive Board payment in 2012€ thousands
Fixed elements performance-Related element Compensation for 20121)
Short-Term and Medium-Term Incentive Elements
Long-Term Incentive Element
Salary Other2) STI MTI 2010 Share-Based Payment (RSU Milestone Plan
2015)1),3)
Bill McDermott (co-CEO) 1,150.0 699.6 1,545.7 1,067.6 4,318.4 8,781.3
Jim Hagemann Snabe (co-CEO) 1,150.0 163.8 1,545.7 1,067.6 4,318.4 8,245.5
Dr. Werner Brandt 700.0 26.7 935.5 645.1 1,549.1 3,856.4
Lars Dalgaard (from April 12, 2012) 503.6 0 674.8 0 1,156.2 2,334.6
Luisa Deplazes Delgado (from September 1, 2012)
233.3 96.4 193.9 0 414.4 938.0
Gerhard Oswald 700.0 16.5 935.5 645.1 1,549.1 3,846.2
Dr. Vishal Sikka 700.0 143.9 935.5 577.9 1,549.1 3,906.4
total 5,136.9 1,146.9 6,766.6 4,003.3 14,854.7 31,908.4
1) Compensation attributable to Executive Board members for financial year 2012 including the 2012 tranche of LTI 2015 based on the grant value at time of grant.2) Insurance contributions, benefits in kind, expenses for maintenance of two households, relocation costs, non-recurring payments, use of aircraft, tax, discrete payments arising
through application of the fixed exchange rate clause. The disclosure of payments arising through application of the fixed exchange rate clause was adapted to the disclosure for 2013.3) Fair value at the time of grant.
36 To Our Stakeholders
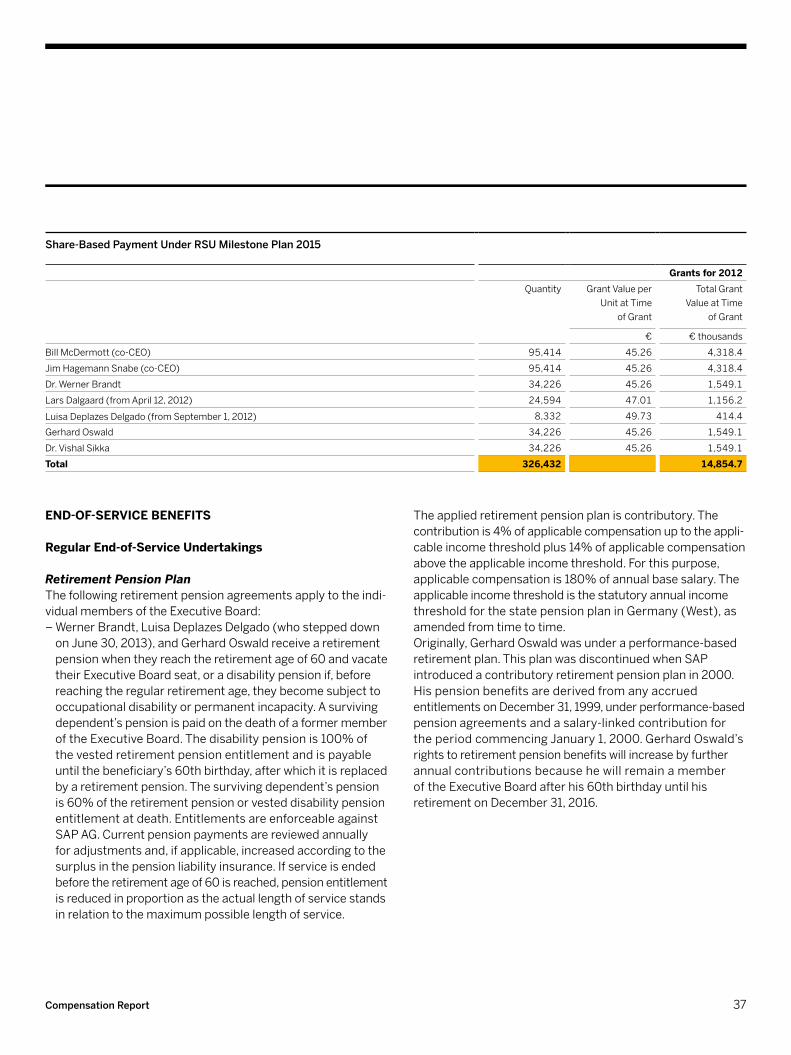
enD-oF-SeRVICe BeneFItS
Regular end-of-Service undertakings
Retirement Pension PlanThe following retirement pension agreements apply to the indi-vidual members of the Executive Board:– Werner Brandt, Luisa Deplazes Delgado (who stepped down
on June 30, 2013), and Gerhard Oswald receive a retirement pension when they reach the retirement age of 60 and vacate their Executive Board seat, or a disability pension if, before reaching the regular retirement age, they become subject to occupational disability or permanent incapacity. A surviving dependent’s pension is paid on the death of a former member of the Executive Board. The disability pension is 100% of the vested retirement pension entitlement and is payable until the beneficiary’s 60th birthday, after which it is replaced by a retirement pension. The surviving dependent’s pension is 60% of the retirement pension or vested disability pension entitlement at death. Entitlements are enforceable against SAP AG. Current pension payments are reviewed annually for adjustments and, if applicable, increased according to the surplus in the pension liability insurance. If service is ended before the retirement age of 60 is reached, pension entitlement is reduced in proportion as the actual length of service stands in relation to the maximum possible length of service.
The applied retirement pension plan is contributory. The contribution is 4% of applicable compensation up to the appli-cable income threshold plus 14% of applicable compensation above the applicable income threshold. For this purpose, applicable compensation is 180% of annual base salary. The applicable income threshold is the statutory annual income threshold for the state pension plan in Germany (West), as amended from time to time. Originally, Gerhard Oswald was under a performance-based retirement plan. This plan was discontinued when SAP introduced a contributory retirement pension plan in 2000. His pension benefits are derived from any accrued entitlements on December 31, 1999, under performance-based pension agreements and a salary-linked contribution for the period commencing January 1, 2000. Gerhard Oswald’s rights to retirement pension benefits will increase by further annual contributions because he will remain a member of the Executive Board after his 60th birthday until his retirement on December 31, 2016.
share-Based payment under rsu Milestone plan 2015
Grants for 2012Quantity Grant Value per
Unit at Time of Grant
Total Grant Value at Time
of Grant
€ € thousands
Bill McDermott (co-CEO) 95,414 45.26 4,318.4
Jim Hagemann Snabe (co-CEO) 95,414 45.26 4,318.4
Dr. Werner Brandt 34,226 45.26 1,549.1
Lars Dalgaard (from April 12, 2012) 24,594 47.01 1,156.2
Luisa Deplazes Delgado (from September 1, 2012) 8,332 49.73 414.4
Gerhard Oswald 34,226 45.26 1,549.1
Dr. Vishal Sikka 34,226 45.26 1,549.1
total 326,432 14,854.7
37Compensation report
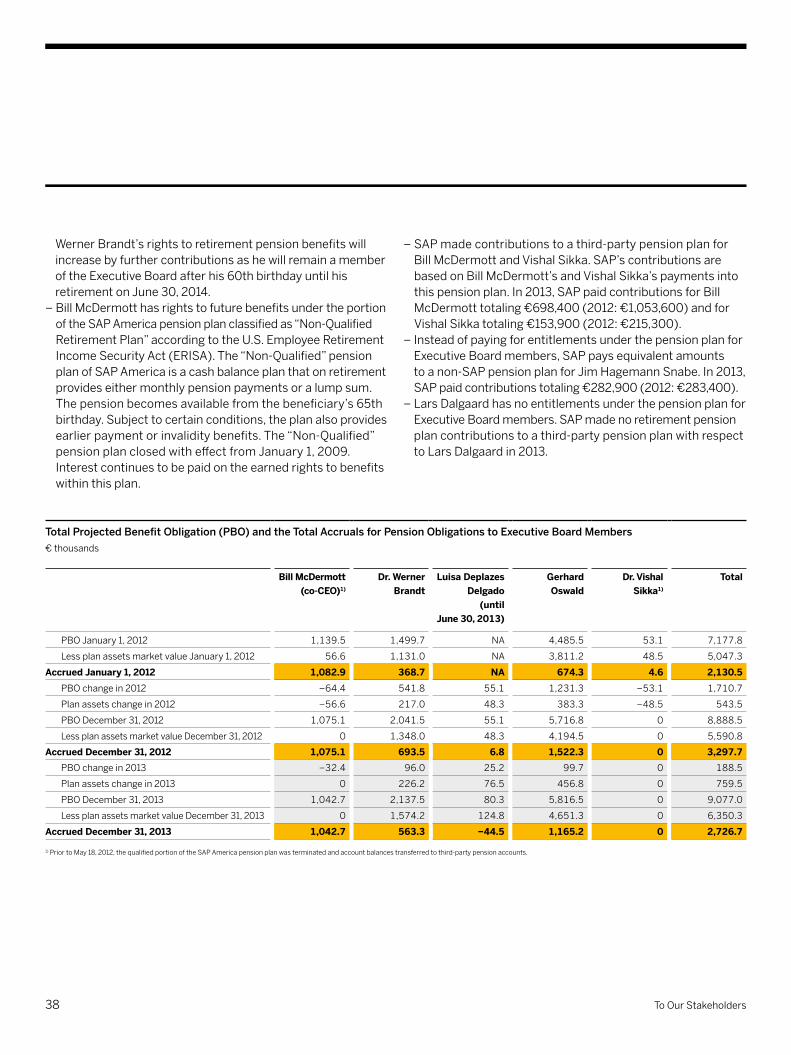
– SAP made contributions to a third-party pension plan for Bill McDermott and Vishal Sikka. SAP’s contributions are based on Bill McDermott’s and Vishal Sikka’s payments into this pension plan. In 2013, SAP paid contributions for Bill McDermott totaling €698,400 (2012: €1,053,600) and for Vishal Sikka totaling €153,900 (2012: €215,300).
– Instead of paying for entitlements under the pension plan for Executive Board members, SAP pays equivalent amounts to a non-SAP pension plan for Jim Hagemann Snabe. In 2013, SAP paid contributions totaling €282,900 (2012: €283,400).
– Lars Dalgaard has no entitlements under the pension plan for Executive Board members. SAP made no retirement pension plan contributions to a third-party pension plan with respect to Lars Dalgaard in 2013.
Werner Brandt’s rights to retirement pension benefits will increase by further contributions as he will remain a member of the Executive Board after his 60th birthday until his retirement on June 30, 2014.
– Bill McDermott has rights to future benefits under the portion of the SAP America pension plan classified as “Non-Qualified Retirement Plan” according to the U.S. Employee Retirement Income Security Act (ERISA). The “Non-Qualified” pension plan of SAP America is a cash balance plan that on retirement provides either monthly pension payments or a lump sum. The pension becomes available from the beneficiary’s 65th birthday. Subject to certain conditions, the plan also provides earlier payment or invalidity benefits. The “Non-Qualified” pension plan closed with effect from January 1, 2009. Interest continues to be paid on the earned rights to benefits within this plan.
Total Projected Benefit Obligation (PBO) and the Total Accruals for Pension Obligations to Executive Board Members€ thousands
Bill McDermott (co-Ceo)1)
Dr. Werner Brandt
luisa Deplazes Delgado
(until June 30, 2013)
Gerhard oswald
Dr. Vishal Sikka1)
total
PBO January 1, 2012 1,139.5 1,499.7 NA 4,485.5 53.1 7,177.8
Less plan assets market value January 1, 2012 56.6 1,131.0 NA 3,811.2 48.5 5,047.3
Accrued January 1, 2012 1,082.9 368.7 nA 674.3 4.6 2,130.5PBO change in 2012 −64.4 541.8 55.1 1,231.3 −53.1 1,710.7
Plan assets change in 2012 −56.6 217.0 48.3 383.3 −48.5 543.5
PBO December 31, 2012 1,075.1 2,041.5 55.1 5,716.8 0 8,888.5
Less plan assets market value December 31, 2012 0 1,348.0 48.3 4,194.5 0 5,590.8
Accrued December 31, 2012 1,075.1 693.5 6.8 1,522.3 0 3,297.7PBO change in 2013 −32.4 96.0 25.2 99.7 0 188.5
Plan assets change in 2013 0 226.2 76.5 456.8 0 759.5
PBO December 31, 2013 1,042.7 2,137.5 80.3 5,816.5 0 9,077.0
Less plan assets market value December 31, 2013 0 1,574.2 124.8 4,651.3 0 6,350.3
Accrued December 31, 2013 1,042.7 563.3 −44.5 1,165.2 0 2,726.7
1) Prior to May 18, 2012, the qualified portion of the SAP America pension plan was terminated and account balances transferred to third-party pension accounts.
38 To Our Stakeholders

The following table presents the net present values of the postcontractual non-compete abstention payments. The net present values in the table reflect the discounted present value of the amounts that would be paid in the fictitious scenario in which the Executive Board members leave SAP at the end of their respective current contract terms and their final average contractual compensation prior to their departure equals the compensation in 2013. Actual postcontractual non-compete payments will likely differ from these amounts depending on the time of departure and the compensation levels and target achievements at the time of departure.
Net present Values of the postcontractual Non-Compete abstention payments€ thousands
Contract term expires
net present Value of post-
contractual non-Compete Ab-
stention payment
Bill McDermott (co-CEO) June 30, 2017 4,534.1
Dr. Werner Brandt June 30, 2014 1,933.3
Gerhard Oswald December 31, 2016 1,846.3
Dr. Vishal Sikka December 31, 2017 1,958.9
total 10,272.6
After his resignation as a member of the Executive Board, Jim Hagemann Snabe will receive monthly abstention compensation over a period of twelve months for the post-contractual non-compete period totaling €3,015,500 (gross).
early end-of-Service undertakings
Severance PaymentsThe standard contract for all Executive Board members provides that on termination before full term (for example, where the member’s appointment is revoked, where the member becomes occupationally disabled, or in connection
The table below shows the annual pension entitlement of each member of the Executive Board on reaching age 60 based on entitlements from SAP under performance-based and salary-linked plans vested on December 31, 2013.
annual pension entitlement€ thousands
Vested on December 31,
2013
Vested on December 31,
2012
Bill McDermott (co-CEO)1) 88.4 78.1
Dr. Werner Brandt 89.82) 88.2
Luisa Deplazes Delgado (until June 30, 2013)3) 5.8 2.3
Gerhard Oswald 267.94) 259.95)
1) The rights shown here for Bill McDermott refer solely to rights under the SAP America pension plan.2) Due to the last extension of Werner Brandt’s contract beyond his 60th birthday, this value represents the
retirement pension entitlement that he would receive after his current Executive Board contract expires on June 30, 2014, based on the entitlements vested on December 31, 2013.
3) Due to changes in tax regulations in Germany, for commitments after January 1, 2012, the minimum age to receive pension payments increased to age 62. The value shown for Luisa Deplazes Delgado for 2013 represents the retirement pension entitlement that she would receive at the age of 62 based on the entitlements vested by the end of her contract.
4) Due to the most recent extension of Gerhard Oswald's contract beyond June 30, 2014, this value represents the retirement pension entitlement that he would receive after his current Executive Board contract expires on December 31, 2016, based on the entitlements vested on December 31, 2013.
5) Due to the last extension of Gerhard Oswald's contract beyond his 60th birthday, this value represents the retirement pension entitlement that he would receive after his current Executive Board contract expires on June 30, 2014, based on the entitlements vested on December 31, 2012.
These are vested entitlements. To the extent that members continue to serve on the Executive Board and that therefore more contributions are made for them in the future, pensions actually payable at the age of 60 will be higher than the amounts shown in the table.
Postcontractual Non-Compete ProvisionsDuring the agreed 12-month postcontractual non-compete period, each Executive Board member receives abstention payments corresponding to 50% of his or her final average contractual compensation as agreed in the respective contract on an individual basis. Any other occupational income gener-ated by the Executive Board member will be deducted from his compensation in accordance with section 74c of the German Commercial Code.
39Compensation report
payments to executive Board Members Retiring in 2013Luisa Deplazes Delgado resigned from her position as Executive Board member with effect from June 30, 2013, with the approval of the Supervisory Board. Lars Dalgaard resigned from his position as Executive Board member with effect from May 31, 2013, with the approval of the Supervisory Board. The postcontractual non-compete provision in both contracts has been canceled without compensation.
payments to Former executive Board MembersIn 2013, we paid pension benefits of €1,387,000 to Executive Board members who had retired before January 1, 2013 (2012: €1,360,000). At the end of the year, the PBO for former Executive Board members was €29,181,000 (2012: €30,551,000). Plan assets of €26,015,000 are available to service these obligations (2012: €26,054,000).
exeCutIVe BoARD MeMBeRS’ lonG-teRM InCentIVeSMembers of the Executive Board hold or held throughout the year share-based payment rights under the RSU Milestone Plan 2015 and the SAP SOP 2010 (which were granted in previous years). For information about the terms and details of these programs, see the Notes to the Consolidated Financial Statements section, Note (27).
RSu Milestone plan 2015The table below shows Executive Board members’ holdings, on December 31, 2013, of restricted share units issued to them under the RSU Milestone Plan 2015. The plan is a cash-settled long-term incentive scheme with a payout subsequent to a performance period of one year and an additional holding period of three years. The RSU Milestone Plan 2015 consists of four plan tranches to be issued with respect to the calendar years 2012 through 2015.
with a change of control), SAP AG will pay to the member the outstanding part of the compensation target for the entire remainder of the term, appropriately discounted for early payment. A member has no claim to that payment if he or she has not served SAP as a member of its Executive Board for at least one year or if he or she leaves SAP AG for reasons for which he or she is responsible.
If an Executive Board member’s appointment to the Executive Board expires or ceases to exist because of, or as a consequence of, change or restructuring, or due to a change of control, SAP AG and each Executive Board member has the right to terminate the employment contract within eight weeks of the occurrence by giving six months’ notice. A change of control is deemed to occur when a third party is required to make a mandatory takeover offer to the shareholders of SAP AG under the German Securities Acquisition and Takeover Act, when SAP AG merges with another company and becomes the sub-sumed entity, or when a control or profit transfer agreement is concluded with SAP AG as the dependent company. An Executive Board member’s contract can also be terminated before full term if his or her appointment as an SAP AG Executive Board member is revoked in connection with a change of control.
Postcontractual Non-Compete ProvisionsAbstention compensation for the postcontractual non- compete period as described above is also payable on early contract termination.
Permanent DisabilityIn case of permanent disability, the contract will end at the end of the quarter in which the permanent inability to work was determined. The Executive Board member receives the monthly basic salary for a further 12 months starting from the date the permanent disability is determined.
40 To Our Stakeholders
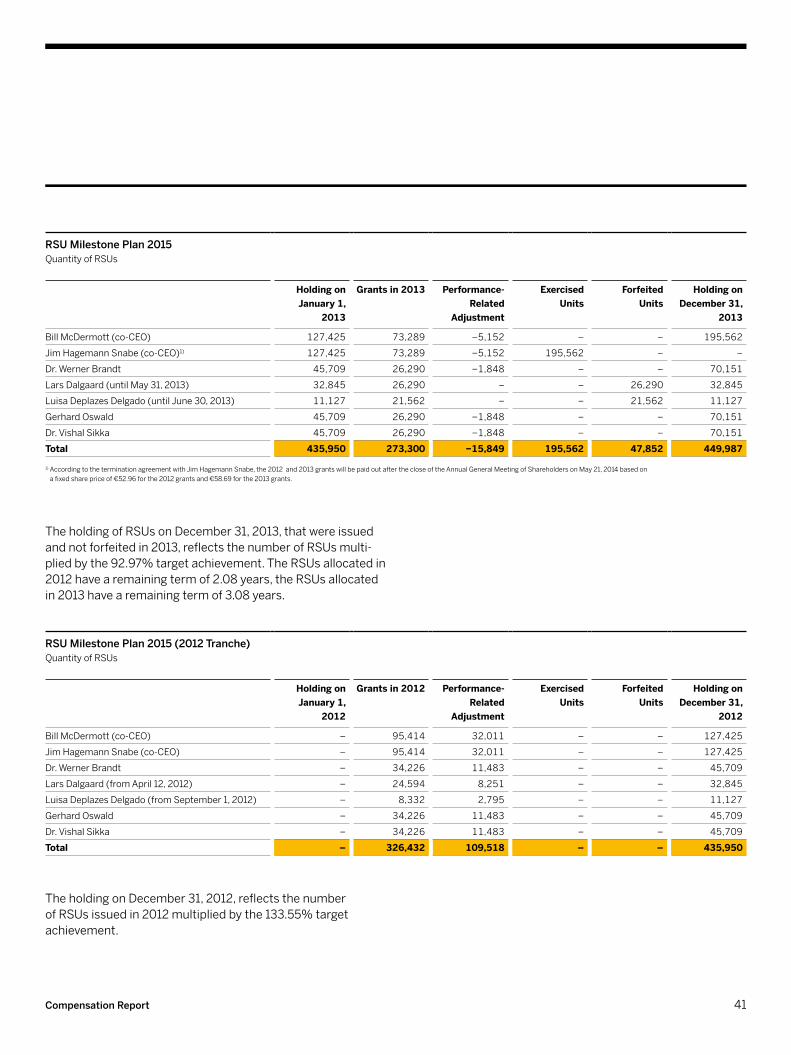
The holding of RSUs on December 31, 2013, that were issued and not forfeited in 2013, reflects the number of RSUs multi-plied by the 92.97% target achievement. The RSUs allocated in 2012 have a remaining term of 2.08 years, the RSUs allocated in 2013 have a remaining term of 3.08 years.
The holding on December 31, 2012, reflects the number of RSUs issued in 2012 multiplied by the 133.55% target achievement.
rsu Milestone plan 2015Quantity of RSUs
holding on January 1,
2013
Grants in 2013 performance- Related
Adjustment
exercised units
Forfeited units
holding on December 31,
2013
Bill McDermott (co-CEO) 127,425 73,289 −5,152 – – 195,562
Jim Hagemann Snabe (co-CEO)1) 127,425 73,289 −5,152 195,562 – –
Dr. Werner Brandt 45,709 26,290 −1,848 – – 70,151
Lars Dalgaard (until May 31, 2013) 32,845 26,290 – – 26,290 32,845
Luisa Deplazes Delgado (until June 30, 2013) 11,127 21,562 – – 21,562 11,127
Gerhard Oswald 45,709 26,290 −1,848 – – 70,151
Dr. Vishal Sikka 45,709 26,290 −1,848 – – 70,151
total 435,950 273,300 −15,849 195,562 47,852 449,987
1) According to the termination agreement with Jim Hagemann Snabe, the 2012 and 2013 grants will be paid out after the close of the Annual General Meeting of Shareholders on May 21, 2014 based on a fixed share price of €52.96 for the 2012 grants and €58.69 for the 2013 grants.
RSU Milestone Plan 2015 (2012 Tranche)Quantity of RSUs
holding on January 1,
2012
Grants in 2012 performance- Related
Adjustment
exercised units
Forfeited units
holding on December 31,
2012
Bill McDermott (co-CEO) – 95,414 32,011 – – 127,425
Jim Hagemann Snabe (co-CEO) – 95,414 32,011 – – 127,425
Dr. Werner Brandt – 34,226 11,483 – – 45,709
Lars Dalgaard (from April 12, 2012) – 24,594 8,251 – – 32,845
Luisa Deplazes Delgado (from September 1, 2012) – 8,332 2,795 – – 11,127
Gerhard Oswald – 34,226 11,483 – – 45,709
Dr. Vishal Sikka – 34,226 11,483 – – 45,709
total – 326,432 109,518 – – 435,950
41Compensation report
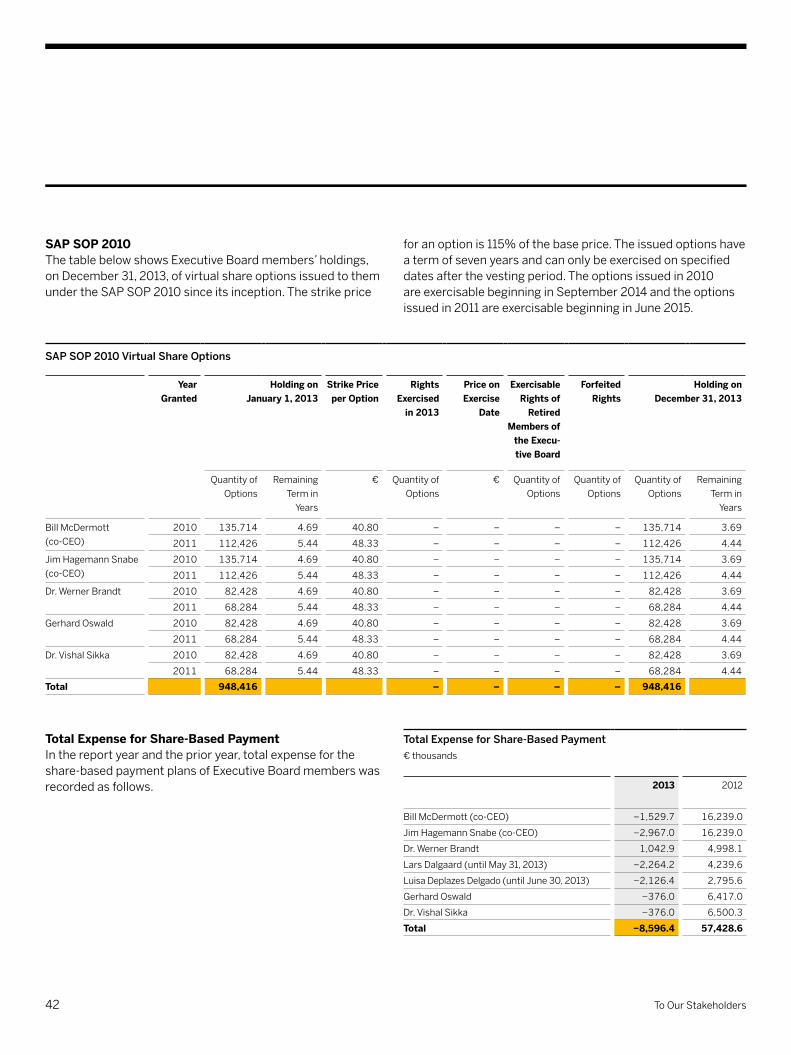
for an option is 115% of the base price. The issued options have a term of seven years and can only be exercised on specified dates after the vesting period. The options issued in 2010 are exercisable beginning in September 2014 and the options issued in 2011 are exercisable beginning in June 2015.
total expense for share-Based payment€ thousands
2013 2012
Bill McDermott (co-CEO) −1,529.7 16,239.0
Jim Hagemann Snabe (co-CEO) −2,967.0 16,239.0
Dr. Werner Brandt 1,042.9 4,998.1
Lars Dalgaard (until May 31, 2013) −2,264.2 4,239.6
Luisa Deplazes Delgado (until June 30, 2013) −2,126.4 2,795.6
Gerhard Oswald −376.0 6,417.0
Dr. Vishal Sikka −376.0 6,500.3
total −8,596.4 57,428.6
SAp Sop 2010 The table below shows Executive Board members’ holdings, on December 31, 2013, of virtual share options issued to them under the SAP SOP 2010 since its inception. The strike price
total expense for Share-Based paymentIn the report year and the prior year, total expense for the share-based payment plans of Executive Board members was recorded as follows.
sap sop 2010 Virtual share options
year Granted
holding on January 1, 2013
Strike price per option
Rights exercised
in 2013
price on exercise
Date
exercisable Rights of
Retired Members of
the execu-tive Board
Forfeited Rights
holding on December 31, 2013
Quantity of Options
Remaining Term in
Years
€ Quantity of Options
€ Quantity of Options
Quantity of Options
Quantity of Options
Remaining Term in
Years
Bill McDermott (co-CEO)
2010 135,714 4.69 40.80 – – – – 135,714 3.69
2011 112,426 5.44 48.33 – – – – 112,426 4.44
Jim Hagemann Snabe (co-CEO)
2010 135,714 4.69 40.80 – – – – 135,714 3.69
2011 112,426 5.44 48.33 – – – – 112,426 4.44
Dr. Werner Brandt 2010 82,428 4.69 40.80 – – – – 82,428 3.69
2011 68,284 5.44 48.33 – – – – 68,284 4.44
Gerhard Oswald 2010 82,428 4.69 40.80 – – – – 82,428 3.69
2011 68,284 5.44 48.33 – – – – 68,284 4.44
Dr. Vishal Sikka 2010 82,428 4.69 40.80 – – – – 82,428 3.69
2011 68,284 5.44 48.33 – – – – 68,284 4.44
total 948,416 – – – – 948,416
42 To Our Stakeholders
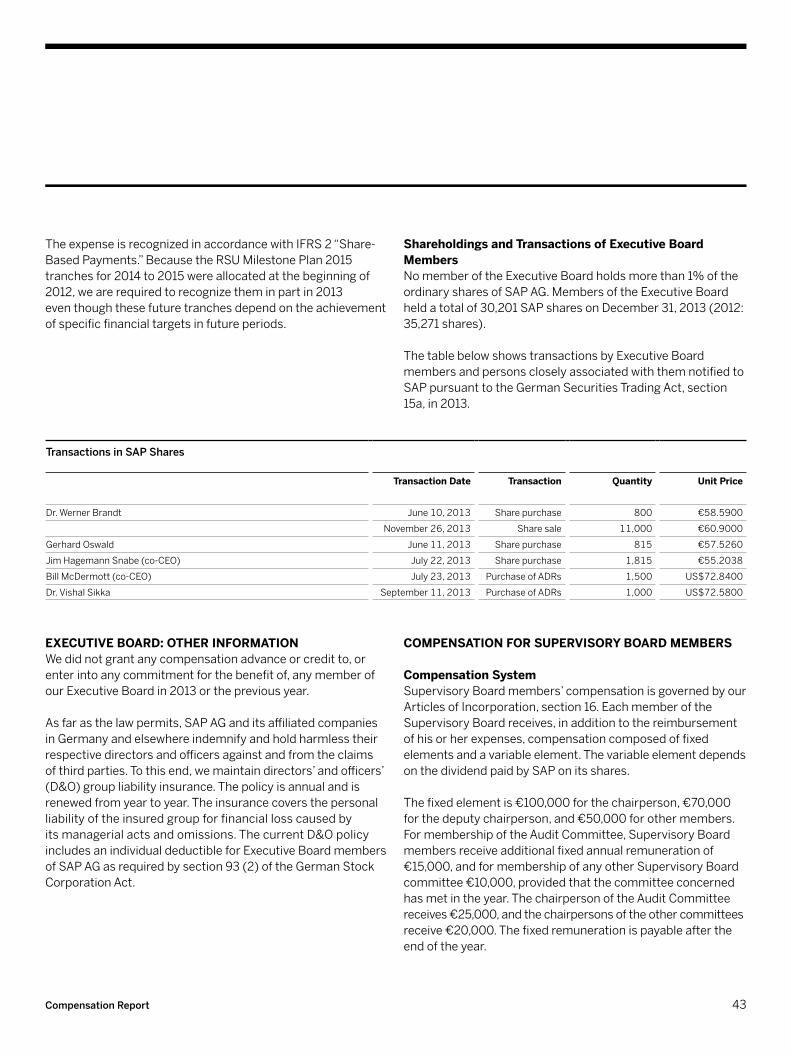
The expense is recognized in accordance with IFRS 2 “Share-Based Payments.” Because the RSU Milestone Plan 2015 tranches for 2014 to 2015 were allocated at the beginning of 2012, we are required to recognize them in part in 2013 even though these future tranches depend on the achievement of specific financial targets in future periods.
exeCutIVe BoARD: otheR InFoRMAtIonWe did not grant any compensation advance or credit to, or enter into any commitment for the benefit of, any member of our Executive Board in 2013 or the previous year.
As far as the law permits, SAP AG and its affiliated companies in Germany and elsewhere indemnify and hold harmless their respective directors and officers against and from the claims of third parties. To this end, we maintain directors’ and officers’ (D&O) group liability insurance. The policy is annual and is renewed from year to year. The insurance covers the personal liability of the insured group for financial loss caused by its managerial acts and omissions. The current D&O policy includes an individual deductible for Executive Board members of SAP AG as required by section 93 (2) of the German Stock Corporation Act.
Shareholdings and transactions of executive Board MembersNo member of the Executive Board holds more than 1% of the ordinary shares of SAP AG. Members of the Executive Board held a total of 30,201 SAP shares on December 31, 2013 (2012: 35,271 shares).
The table below shows transactions by Executive Board members and persons closely associated with them notified to SAP pursuant to the German Securities Trading Act, section 15a, in 2013.
transactions in sap shares
transaction Date
transaction Quantity unit price
Dr. Werner Brandt June 10, 2013 Share purchase 800 €58.5900
November 26, 2013 Share sale 11,000 €60.9000
Gerhard Oswald June 11, 2013 Share purchase 815 €57.5260
Jim Hagemann Snabe (co-CEO) July 22, 2013 Share purchase 1,815 €55.2038
Bill McDermott (co-CEO) July 23, 2013 Purchase of ADRs 1,500 US$72.8400
Dr. Vishal Sikka September 11, 2013 Purchase of ADRs 1,000 US$72.5800
CoMpenSAtIon FoR SupeRVISoRy BoARD MeMBeRS
Compensation SystemSupervisory Board members’ compensation is governed by our Articles of Incorporation, section 16. Each member of the Supervisory Board receives, in addition to the reimbursement of his or her expenses, compensation composed of fixed elements and a variable element. The variable element depends on the dividend paid by SAP on its shares.
The fixed element is €100,000 for the chairperson, €70,000 for the deputy chairperson, and €50,000 for other members. For membership of the Audit Committee, Supervisory Board members receive additional fixed annual remuneration of €15,000, and for membership of any other Supervisory Board committee €10,000, provided that the committee concerned has met in the year. The chairperson of the Audit Committee receives €25,000, and the chairpersons of the other committees receive €20,000. The fixed remuneration is payable after the end of the year.
43Compensation report

Any members of the Supervisory Board having served for less than the entire year receive one-twelfth of the annual remunera-tion for each month of service commenced. This also applies to the increased compensation of the chairperson and the deputy chairperson and to the remuneration for the chairperson and the members of a committee.
Amount of CompensationSubject to the resolution on the appropriation of retained earn-ings by the Annual General Meeting of Shareholders on May 21, 2014, the compensation paid to Supervisory Board members in respect of 2013 will be as set out in the table below.
The variable compensation element is €10,000 for the chair-person, €8,000 for the deputy chairperson, and €6,000 for the other members of the Supervisory Board for each €0.01 by which the dividend distributed per share exceeds €0.40. The variable remuneration is payable after the end of the Annual General Meeting of Shareholders that resolves on the dividend for the relevant year.
However, the aggregate compensation excluding compensation for committee memberships must not exceed €250,000 for the chairperson, €200,000 for the deputy chairperson, and €150,000 for other members of the Supervisory Board.
supervisory Board Members’ Compensation in 2013€ thousands
2013 2012
Fixed Com-
pensation
Compen-sation for
Committee Work
Variable Compen-
sation
Total Fixed Com-
pensation
Compen-sation for
Committee Work
Variable Compen-
sation
Total
Prof. Dr. h.c. mult. Hasso Plattner (chairperson)
100.0 81.7 150.0 331.7 100.0 60.0 150.0 310.0
Christiane Kuntz-Mayr (deputy chairperson)
70.0 10.8 130.0 210.8 67.5 10.0 128.3 205.8
Pekka Ala-Pietilä 50.0 30.0 100.0 180.0 50.0 20.0 100.0 170.0
Panagiotis Bissiritsas 50.0 20.0 100.0 170.0 50.0 24.2 100.0 174.2
Prof. Anja Feldmann 50.0 10.8 100.0 160.8 33.3 6.7 66.7 106.7
Prof. Dr. Wilhelm Haarmann 50.0 40.8 100.0 190.8 50.0 30.0 100.0 180.0
Margret Klein-Magar 50.0 20.0 100.0 170.0 33.3 6.7 66.7 106.7
Lars Lamadé 50.0 20.8 100.0 170.8 62.5 10.0 120.8 193.3
Bernard Liautaud 50.0 30.0 100.0 180.0 50.0 16.7 100.0 166.7
Dr. h. c. Hartmut Mehdorn 50.0 10.8 100.0 160.8 50.0 10.0 100.0 160.0
Dr. Kurt Reiner 50.0 20.0 100.0 170.0 33.3 13.3 66.7 113.3
Mario Rosa-Bian 50.0 9.2 100.0 159.2 33.3 6.7 66.7 106.7
Dr. Erhard Schipporeit 50.0 35.0 100.0 185.0 50.0 25.0 100.0 175.0
Stefan Schulz 50.0 25.8 100.0 175.8 50.0 24.2 100.0 174.2
Inga Wiele 50.0 25.0 100.0 175.0 33.3 16.7 66.7 116.7
Prof. Dr.-Ing. Dr.-Ing. E.h. Klaus Wucherer 50.0 25.0 100.0 175.0 50.0 20.0 100.0 170.0
Compensation for former Supervisory Board Members
NA NA NA NA 104.0 39.7 208.5 352.2
total 870.0 415.8 1,680.0 2,965.8 900.8 339.6 1,740.8 2,981.3
44 To Our Stakeholders

The table below shows transactions by Supervisory Board members and persons closely associated with them notified to SAP pursuant to the German Securities Trading Act, section 15a, in 2013:
transactions in sap shares
transaction Date
transaction Quan-tity
unit price in €
Christian Wiele August 23, 2013
Share sale 116 57.2600
Inga Wiele August 26, 2013
Share sale 92 57.3500
Margret Klein-Magar August 26, 2013
Share sale 132 57.0400
Mario Rosa-Bian August 27, 2013
Share sale 130 57.3500
Hasso Plattner October 24, 2013
Share sale 1) 1)
1) The notifying party (Hasso Plattner GmbH & Co. Beteiligungs-KG) concluded a contract with a bank acting as commission agent for the monthly sale of SAP shares with a fair value of €10,000,000 per month. The sale will be carried out at the bank’s own discretion in the stock market or over the counter, during December 2013 through November 2014. With this transaction a program running since November 2012 will be continued (see notification on November 30, 2012). Price: Targeted is the volume-weighted average (stock market) price of the SAP share on the relevant day of sale. Number of items: Total amount traded divided by the relevant sale price of the sold shares.
SupeRVISoRy BoARD: otheR InFoRMAtIonWe did not grant any compensation advance or credit to, or enter into any commitment for the benefit of, any member of our Supervisory Board in 2013 or the previous year.
Hasso Plattner, the chairperson of the Supervisory Board, entered into a consulting contract with SAP after he joined the Supervisory Board in May 2003. The contract does not provide for any compensation. The only cost we incurred under the contract was the reimbursement of expenses.
As far as the law permits, we indemnify Supervisory Board mem-bers against, and hold them harmless from, claims brought by third parties. To this end, we maintain directors’ and officers’ (D&O) group liability insurance. The current D&O policy does not include an individual deductible for Supervisory Board members as envisaged in the German Corporate Governance Code.
In addition, we reimburse members of the Supervisory Board for their expenses and the value-added tax payable on their compensation.
The total compensation of all Supervisory Board members in 2013 for work for SAP excluding compensation relating to the office of Supervisory Board member was €1,176,200 (2012: €1,083,500). Those amounts are composed entirely of remuneration received by employee representatives on the Supervisory Board relating to their position as SAP employees in 2013 and 2012, respectively.
Supervisory Board member Wilhelm Haarmann practiced as a partner in the law firm HAARMANN Partnerschaftsgesellschaft in Frankfurt am Main, Germany, until February 2013. In February 2013, he was elected a partner in Linklaters LLP in Frankfurt am Main, Germany. Wilhelm Haarmann occasionally advises SAP on particular projects, tax matters, and questions of law. Before Mr. Haarmann joined Linklaters LLP, SAP had already received consulting services from Linklaters and will continue to do so. In 2013, the fees for such services totaled €327,500 (2012: €9,400).
lonG-teRM InCentIVeS FoR the SupeRVISoRy BoARDWe do not offer members share options or other share-based payment for their Supervisory Board work. Any share options or other share-based payment received by employee-elected members relate to their position as SAP employees and not to their work on the Supervisory Board.
Shareholdings and transactions of Supervisory Board MembersSupervisory Board chairperson Hasso Plattner and the companies he controlled held 119,300,882 SAP shares on December 31, 2013 (December 31, 2012: 121,348,807 SAP shares), represent-ing 9.711% (2012: 9.878%) of SAP’s share capital. No other member of the Supervisory Board held more than 1% of the SAP AG share capital at the end of 2013 or of the previous year. Members of the Supervisory Board held a total of 119,316,444 SAP shares on December 31, 2013 (December 31, 2012: 121,363,858 SAP shares).
45Compensation report

Bill Mcdermott Jim Hagemann snabe
Werner Brandt Gerhard oswald
Vishal sikka
responsibility statement
To the best of our knowledge, and in accordance with the applicable reporting principles, the consolidated financial statements give a true and fair view of the assets, finances, and operating results of the Group, and the management report of the Group and SAP AG includes a fair review of the development and performance of the business and the position of the Group and SAP AG, together with a description of the material opportunities and risks associated with the expected development of the Group and SAP AG.
Walldorf, February 20, 2014
SAP AGWalldorf, BadenThe Executive Board
46 To Our Stakeholders

to SAp AG
Report on the Consolidated Financial StatementsWe have audited the accompanying consolidated financial statements of SAP AG, Walldorf (“SAP” or “the Company”), and its subsidiaries, which comprise the consolidated statement of financial position as of December 31, 2013, and the consolidated income statement, the consolidated statement of comprehensive income, the consolidated statement of changes in equity, the consolidated statement of cash flows, and the notes to the consolidated financial statements for the year then ended.
Management’s Responsibility for the Consolidated Financial StatementsManagement is responsible for the preparation of consolidated financial statements. This includes the responsibility that the consolidated financial statements give a true and fair view of the Company’s net assets, financial position, and results of operations in accordance with International Financial Reporting Standards (IFRSs) as adopted by the European Union (“EU”), the supplementary provisions of German law to be applied in accordance with the German Commercial Code (Handels- gesetzbuch, “HGB”), section 315a (1), and IFRSs as issued by the International Accounting Standards Board. Management’s responsibility includes maintaining such internal control as management determines necessary to enable the preparation of consolidated financial statements that are free from material misstatement, whether due to fraud or error.
Auditor’s ResponsibilityOur responsibility is to express an opinion on these consolidated financial statements based on our audit. We conducted our audit in accordance with HGB, section 317, and German generally accepted standards for the audit of consolidated financial statements, promulgated by the Institut der Wirtschaftsprüfer (“IDW”), and in supplementary compliance with International Standards on Auditing and standards of the Public Company Accounting Oversight Board (United States). Those standards require that we comply with ethical requirements and plan and perform the audit to obtain reasonable assurance about whether the consolidated financial statements are free from material misstatement.
An audit involves performing procedures to obtain audit evidence about the amounts and disclosures in the consolidated financial statements. The procedures selected depend on the auditor’s judgment, including the assessment of the risks of material misstatement in the consolidated financial statements, whether due to fraud or error. In making those risk assessments, the auditor considers internal control relevant to the entity’s preparation of the consolidated financial statements that give a true and fair view in order to design audit procedures that are appropriate in the circumstances. An audit also includes evaluating the appropriateness of accounting policies used and the reasonableness of accounting estimates made by management, as well as evaluating the overall presentation of the consolidated financial statements.
We believe that the audit evidence we have obtained is sufficient and appropriate to provide a basis for our audit opinion.
OpinionIn accordance with HGB, section 322 (3) sentence 1, we declare that our audit of the consolidated financial statements has not led to any reservations.
In our opinion, based on our audit, the consolidated financial statements give a true and fair view of the Company’s net assets and financial position as of December 31, 2013; and of its results of operations for the year then ended, in accordance with IFRSs as adopted by the EU, the supplementary provisions of German law to be applied in accordance with HGB, section 315a (1), and IFRSs as issued by the International Accounting Standards Board.
Independent auditor’s report
47Independent auditor's report

OpinionIn accordance with HGB, section 322 (3) sentence 1, we declare that our audit has not led to any reservations.
In our opinion, based on our audit of the consolidated financial statements and the management report, the management report is consistent with the consolidated financial statements and as a whole, provides a suitable view of the Company’s position and suitably presents the opportunities and risks of future development.
Report on the Effectiveness of Internal Control over Financial Reporting in the Consolidated Financial Statements in accordance with the standards of the public Company Accounting oversight Board (united States)We have audited SAP’s internal control over financial reporting in the consolidated financial statements as of December 31, 2013, based on criteria established in Internal Control – Integrated Framework issued by the Committee of Sponsoring Organizations of the Treadway Commission (COSO).
Management’s Responsibility for Internal ControlManagement is responsible for maintaining effective internal control over financial reporting in the consolidated financial statements, and for the assessment of its effectiveness, as included in the accompanying Management’s Annual Report on Internal Control over Financial Reporting in the Consolidated Financial Statements.
A company’s internal control over financial reporting in the consolidated financial statements is a process designed to provide reasonable assurance regarding the reliability of financial reporting and the preparation of financial statements
Report on the Management ReportWe have audited the accompanying combined management report for SAP Group and SAP AG (“management report”) for the business year ended December 31, 2013. Management’s Responsibility for the Management ReportManagement is responsible for the preparation of the management report in accordance with the provisions of German law to be applied in accordance with HGB, section 315a (1), the German Accounting Standards Nos. 17 and 20 (GAS 17, GAS 20) and the provisions of the IFRS Practice Statement Management Commentary.
Auditor’s ResponsibilityOur responsibility is to express an opinion on this management report based on our audit. We conducted our audit of the management report in accordance with HGB, section 317 (2), and German generally accepted standards for the audit of management reports promulgated by the IDW. Those standards require that we plan and perform the audit of the management report in such a way that we obtain reasonable assurance about whether the management report is consistent with the consolidated financial statements and the findings from our audit of the consolidated financial statements and as a whole provides a suitable understanding of the Company’s position and suitably presents the opportunities and risks of future development.
We believe that the audit evidence we have obtained is sufficient and appropriate to provide a basis for our audit opinion.
48 To Our Stakeholders
for external purposes in accordance with generally accepted accounting principles. A company’s internal control over financial reporting in the consolidated financial statements includes those policies and procedures that (1) pertain to the maintenance of records that, in reasonable detail, accurately and fairly reflect the transactions and dispositions of the assets of the company; (2) provide reasonable assurance that transactions are recorded as necessary to permit preparation of financial statements in accordance with generally accepted accounting principles; and (3) provide reasonable assurance regarding prevention or timely detection of unauthorized acquisition, use, or disposition of the company’s assets that could have a material effect on the financial statements.
Because of its inherent limitations, internal control over financial reporting in the consolidated financial statements may not prevent or detect misstatements. Also, projections of any evaluation of effectiveness to future periods are subject to the risk that controls may become inadequate because of changes in conditions, or that the degree of compliance with the policies or procedures may deteriorate.
Auditor’s ResponsibilityOur responsibility is to express an opinion on SAP’s internal control over financial reporting in the consolidated financial statements based on our audit. We conducted our audit in accordance with the standards of the Public Company Accounting Oversight Board (United States). Those standards require that we plan and perform the audit to obtain reasonable assurance
about whether effective internal control over financial reporting in the consolidated financial statements was maintained in all material respects. Our audit included obtaining an understanding of internal control over financial reporting in the consolidated financial statements, assessing the risk that a material weakness exists, and testing and evaluating the design and operating effectiveness of internal control based on the assessed risk. Our audit also included performing such other procedures as we considered necessary in the circumstances.
We believe that the audit evidence we have obtained is sufficient and appropriate to provide a basis for our audit opinion.
OpinionIn our opinion, SAP maintained, in all material respects, effective internal control over financial reporting in the consolidated financial statements as of December 31, 2013, based on criteria established in Internal Control – Integrated Framework issued by COSO.
Mannheim, February 20, 2014
KPMG AGWirtschaftsprüfungsgesellschaft
dr. Gutsche dr. BöttcherWirtschaftsprüfer Wirtschaftsprüfer
49Independent auditor's report

Vision, Mission,and Strategy
Our vision is to help the world run better and
improve people’s lives; our mission is to help
every customer become a best-run business.
To learn more about SAP’s vision, mission, and strategy visit www.sapintegratedreport.com

Combined Management ReportGeneral Information About This Management ReportOverview of the SAP GroupVision, Mission, and StrategyBusiness ModelPortfolio of Products, Solutions, and ServicesCustomersResearch and Development Partner EcosystemAcquisitionsEmployees and Social InvestmentsEnergy Consumption and Greenhouse Gas EmissionsInternal Management SystemEconomy and the MarketReport on Economic PositionReport on the Economic Position of SAP AGOverall Financial PositionCorporate GovernanceInformation Concerning TakeoversOpportunity ReportRisk ReportSupplementary ReportReport on Expected Developments
515253545759656871727379829092
110113114116119122152153
51

This report includes statistical data about the IT industry and global economic trends that comes from information published by sources including International Data Corporation (IDC), a provider of market information and advisory services for the information technology, telecommunications, and consumer technology markets; the European Central Bank (ECB); and the International Monetary Fund (IMF). This type of data repre-sents only the estimates of IDC, ECB, IMF, and other sources of industry data. SAP does not adopt or endorse any of the statistical information provided by sources such as IDC, ECB, IMF, or other similar sources that is contained in this report. In addition, although we believe that data from these sources is generally reliable, this type of data is imprecise. We caution readers not to place undue reliance on this data.
BASIS oF pReSentAtIonThis management report by SAP AG and its subsidiaries (collectively, “we,” “us,” “our,” “SAP,” “Group,” or “Company”) has been prepared in accordance with sections 315 and 315a of the German Commercial Code and German Accounting Standards No. 17 and 20. The management report is also a management commentary complying with the International Financial Reporting Standards (IFRS) Practice Statement Management Commentary.
All of the information in this report relates to the situation on December 31, 2013, or the fiscal year ended on that date, unless otherwise stated.
The report contains references to additional information in other parts of the SAP Integrated Report that is available online. This additional information is not part of the management report.
FoRWARD-lookInG StAteMentSThis management report contains forward-looking statements and information based on the beliefs of, and assumptions made by, our management using information currently available to them. Any statements contained in this report that are not historical facts are forward-looking statements as defined in the U.S. Private Securities Litigation Reform Act of 1995. We have based these forward-looking statements on our current expectations, assumptions, and projections about future conditions and events. As a result, our forward-looking statements and information are subject to uncertainties and risks, many of which are beyond our control. If one or more of these uncertainties or risks materializes, or if management’s underlying assumptions prove incorrect, our actual results could differ materially from those described in or inferred from our forward-looking statements and information. We describe these risks and uncertainties in the Risk Report section.
The words “aim,” “anticipate,” “assume,” “believe,” “continue,” “could,” “counting on,” “is confident,” “estimate,” “expect,” “forecast,” “guidance,” “intend,” “may,” “might,” “outlook,” “plan,” “project,” “predict,” “seek,” “should,” “strategy,” “want,” “will,” “would,” and similar expressions as they relate to us are intended to identify such forward-looking statements. Such statements include, for example, those made in the Operating Results section, our quantitative and qualitative disclosures about market risk pursuant to the International Financial Reporting Standards (IFRS), namely IFRS 7 and related statements in our Notes to the Consolidated Financial State-ments, the Opportunity Report, the Risk Report, our outlook guidance, and other forward-looking information appearing in other parts of this report. To fully consider the factors that could affect our future financial results, both this report and our Annual Report on Form 20-F should be considered, as well as all of our other filings with the Securities and Exchange Commission (SEC). Readers are cautioned not to place undue reliance on these forward-looking statements, which speak only as of the date specified or the date of this report. Except where legally required, we undertake no obligation to publicly update or revise any forward-looking statements as a result of new information that we receive about conditions that existed upon issuance of this report, future events, or otherwise unless we are required to do so by law.
General Information about this Management report
52 Combined Management Report

SAP markets and distributes our products, solutions, and services primarily through a worldwide network of local subsidiaries, which are licensed to distribute SAP offerings to customers in defined territories. Distributorship agreements are in place with independent resellers in some countries. For more information, see the Business Model section.
As of December 31, 2013, SAP AG controlled directly or indirectly 272 subsidiaries. Our subsidiaries perform various tasks such as sales and marketing, consulting, research and development, customer support, training, or administration. For a complete list of subsidiaries, associates, and other equity investments, see the Notes to the Consolidated Financial Statements section, Note (34).
For management reporting, our activities are broken down into two divisions, On-Premise and Cloud, which are further divided into operating segments. Our On-Premise division is composed of two operating segments, On-Premise Products and On-Premise Services. Our Cloud division is also composed of two operating segments, Cloud Applications and Ariba. For more information about our segments, see the Notes to the Consolidated Financial Statements section, Note (28).
Founded in 1972, SAP today is the world leader in enterprise applications in terms of software and software-related service revenue, and the world’s third-largest independent software manufacturer based on market capitalization. Our continued growth over four decades is attributable to relentless innovation, a diverse portfolio, and our ability to anticipate ever-changing customer requirements. With more than 253,500 customers in over 180 countries, the SAP Group includes subsidiaries in major countries and employs more than 66,500 people.
Our company’s culture puts our customers’ success at the center of everything we do, and is driven by our passions – which are:– success – We measure our success by our customers’
success.– accountability – We embrace accountability and strive to
always make good on our promises.– professionalism – We exhibit professionalism by consistently
delivering quality work.– Integrity – We are honest and fair and take responsibility for
all our actions.– teamwork – We value teamwork because it enables us to
exceed our individual limits and share greater success.– trust – We work for each other’s success and take personal
responsibility for all of our relationships.
For more information about our business conduct, see the Business Conduct section in the SAP Integrated Report 2013 online.
SAP is headquartered in Walldorf, Germany; our legal corporate name is SAP AG. The corporation is listed on the Frankfurt Stock Exchange as well as stock exchanges in Berlin and Stuttgart in Germany and the New York Stock Exchange in the United States. At the end of 2013, our market capitalization was €76.5 billion. SAP is a member of the German DAX and of the Dow Jones EURO STOXX 50 index.
We derive our revenue from fees charged to our customers for licensing of on-premise software products and solutions, and the use of our cloud solutions by subscription. We also derive revenue from support, consulting, development, training, and other services.
overview of the sap Group
53overview of the sap Group

MarginWe aim for 35% non-IFRS operating margin (2013: 32.6%). In order to capture growth opportunities in the cloud, we expect to reach this goal in 2017 instead of 2015, as previously stated. In 2014, we expect between €5.8 billion to €6.0 billion non-IFRS operating profit at constant currencies.
Customer loyaltyWe use the Net Promoter Score (NPS) to measure customer loyalty. In 2014, we are aiming for an increase in NPS by four percentage points (2013: 12.1%).
employee engagementWe use the employee engagement index to measure motivation and loyalty of our employees, how proud they are of our company, and how strongly they identify with SAP. We are committed to achieving a score of 82% in 2015 (2013: 77%). Despite the slight drop in employee engagement in 2013 compared to 2012, we expect to see an incremental increase in our industry-leading score in 2014.
These four goals affirm our commitment to innovation and sustainability, and will help us deliver on our vision and mission.
In addition to the primary KPIs, which directly measure our performance with regard to our four company objectives, SAP manages a large set of secondary performance indicators, which influence the primary KPIs in a variety of ways. Our integrated report seeks to clarify some of those relationships, for example the link between our energy consumption and our margin.
Our main indicators are presented with more detail throughout the report. For more information on strategic goals, see the Internal Management System; Report on Expected Developments; Customers; and Employees and Social Investment sections.
SAP’s continued growth over four decades is attributable to our focus on innovation, a broad portfolio, and our ability to stay close to our customers and understand their ever-changing needs.
ouR VISIon AnD MISSIonSAP’s vision is to help the world run better and improve people’s lives. Our mission is to help every customer become a best-run business. We do this by delivering technology innovations that address the challenges of today and tomorrow without disrupting our customers’ business operations. For example, enterprise mobility is transforming usage of IT; in-memory technology is simplifying the IT architecture in the enterprise and driving high-value applications; and cloud delivery of IT solutions is simplifying the consumption of technology. We offer solutions that drive business outcomes and enable our customers to run better. We help our customers derive value from their SAP solutions in a cost-effective and predictable way, with our professional services, support, and cloud delivery.
ouR GoAlS FoR SuStAIneD BuSIneSS SuCCeSSSAP has strong ambitions for sustainable business success, both for our company and for our customers. We believe the most important indicators to measure this success comprise both financial and non-financial indicators: revenue, margin, customer loyalty, and employee engagement.
RevenueWe aim to achieve at least €22 billion total revenue by 2017. SAP still aims to achieve at least €20 billion total revenue by 2015 (2013: €16.9 billion non-IFRS total revenue). An important part to achieving this is our continued focus on innovations, as we expect to become the cloud company with €3.0 to €3.5 billion total revenue from our cloud business by 2017. In 2014, we expect to increase non-IFRS software and software-related services (SSRS) growth by 6% to 8% at constant currencies.
Vision, Mission, and strategy
54 Combined Management Report
– simplify software consumption by moving our entire portfolio to the cloud: We are transitioning our consumption model to SAP Cloud powered by SAP HANA where we can deliver end-to-end solutions and drive business outcomes for the customers. We will offer our entire portfolio of solutions – applications, analytics, and platform through SAP Cloud powered by SAP HANA. We will move our core SAP Business Suite software to the cloud as a managed service, delivered by both SAP and our partners. We will also accelerate our investments in line-of-business public cloud solutions across SuccessFactors, Ariba, and our cloud portfolio, all running on SAP HANA. We will deliver a true, integrated cloud to our customers. As we are committed to offering flexibility and choice, we will continue to offer an on-premise deployment model to our customers.
– simplify our products with sap HaNa as the common platform: We will standardize every SAP product (including SuccessFactors and Ariba) on the common SAP HANA platform, and deliver integration across our portfolio. This will drive a simplified suite experience for our customers and partners. Our partners and ecosystem can either extend our solutions or build end-to-end applications based on the SAP HANA platform.
– simplify the user experience: We will simplify the user experience (UX) by offering a “mobile first” approach based on SAP Fiori applications, which offer a simple and easy-to-use experience for broadly used SAP software functions that work seamlessly across devices. We will build applications that show empathy with the user and dramatically improve the experience of our customer’s customers and our customers’ employees.
ouR StRAteGy: SIMplIFy eVeRythInG WIth SAp ClouD poWeReD By SAp hAnAOrganizations around the world are now entering a new era of business model innovation, made possible by the convergence of cloud, mobile, social, and in-memory technologies.
However, businesses often contend with layers of IT complexity that have been built up over the decades. This complexity is the result of several factors, including the proliferation of hardware and custom applications. In addition, investments in innovations often take a long time to implement or to realize business value. Due to the complexity of the current consumption model, cus-tomers are not able to respond fast enough to changing market conditions. We believe that simplicity is the key: By solving the challenge of business complexity, we can help unlock our customers’ innovation potential. We are committed to leading this simplification.
In today’s technology industry, the biggest winners have grown by offering simplicity and ease of consumption over a cloud model, which has translated to massive user adoption and market success.
In 2014, SAP will focus on helping its customers “simplify everything, so they can do anything.”
With the SAP HANA platform, we have an opportunity to simplify our product portfolio and IT landscape for our customers. SAP HANA can radically simplify enterprise applications as it collapses the entire IT stack. With SAP HANA Cloud Platform, we have the ability to take our core on-premise applications to the cloud and offer a choice of cloud deployments to our customers.
With SAP Cloud powered by SAP HANA, we will focus our simplification on three areas – simplifying our consumption model, simplifying our portfolio, and simplifying user experience.
55Vision, Mission, and strategy
Additionally, SAP will drive innovation and top-line growth across the following dimensions:– Drive the Big Data agenda for our customers with our
real-time in-memory SAP HANA platform and predictive analytics solutions
– Establish SAP HANA as a standard enterprise business platform and monetize through partners and ecosystem
– Focus on the customer’s customer by extending to business-to-business-to-consumer (B2B2C) through our portfolio of omnichannel and CRM solutions
– Drive accelerated growth in selected industries such as banking, insurance, retail, public sector, and healthcare
– Emerging markets will continue to be a growth driver, with high double-digit growth in software and cloud revenues expected through 2017. In addition to our investments in China, Russia, and the Middle East, we are expanding our investments in Africa.
We will stay committed to our customers’ success and evolve our execution to drive further value creation for our customers. We strive to provide our customers a significant competitive advantage and to help make their growth more sustainable – financially, ecologically, and socially.
For more information about SAP’s goals, see the Report on Expected Developments section.
In addition to simplifying our business model, we will focus on end-to-end delivery of industry-specific solutions that can drive business value and outcomes. We will continue to build an open ecosystem and our partner network to deliver SAP Cloud powered by SAP HANA on their cloud infrastructure. Our ecosystem will play a vital role in building new solutions on the SAP HANA platform and delivering value to our customers.
With our focus on simplification, we aim to better innovate and grow.
Today SAP only receives a small percentage of each customer’s overall IT spend. By investing in innovations and shifting our customers to a cloud business model, we will be able to help reduce their total cost of ownership (TCO) on IT. This enables customers to reinvest the TCO savings in new innovations and SAP could capture a higher share of customer IT spend.
56 Combined Management Report
Our sales model has been focused on charging a one-time, upfront fee for a perpetual license to our software that is typically installed at the customer site. In addition, the customer usually concludes a maintenance contract that covers support and software updates. As we see customers’ preferences evolve, we are expanding the delivery of our solutions in the cloud, which we believe is a simple and efficient software consumption model. Our cloud solutions are offered under a subscription-based licensing model. With this model, the customer periodi-cally pays a fee to use software for a limited amount of time. This software is installed at an SAP or an SAP partner location, and the customer accesses the software through the Internet.
To help companies invest in SAP solutions and the associated services and hardware, the SAP Financing service offers customers payment plans optimized for maximum economic benefit. It can help preserve liquidity, provide an alternative to credit from their existing banking relationships, and balance their budgetary priorities – while giving customers the flexibility to choose the best possible solution.
We measure the outcome of our activities through four performance indicators: revenue, margin, customer loyalty, and employee engagement. Each of these directly correlates with our ability to deliver financial returns to our providers of capital. Ultimately, it is our highly engaged employees who build our customers’ success and loyalty to SAP.
Creating economic, social, and environmental value over the long-term is central to our vision of helping the world run better and improving people’s lives. To realize our vision, SAP provides software and services to customers throughout the world, all based on our deep expertise in business processes spanning 25 industries.
To provide software and related services to our customers, we rely on financial capital provided by investors. We leverage our intellectual capital to continually increase our knowledge base and expertise. Engaged, highly skilled, and agile employees are central to innovating with and building relationships with our customers and partners, and ultimately to our business success.
Our direct sales organizations drive most business development. Sales go-to-market strategies are established at the global level, and adapted and executed by the regional subsidiaries. Our customer-facing employees, in close collaboration with sales support and marketing, drive demand, build pipeline, and enhance relationships with customers within our target indus-tries. Our marketing efforts cover large enterprises as well as small and midsize enterprises. We believe our broad portfolio of solutions and services enables us to meet the needs of customers of all sizes and across industries.
In addition, our extensive ecosystem provides scalability to meet the demand for SAP innovation and provide customers with a wide selection of third-party competencies. We have developed an independent sales and support force through independent value-added resellers. We have also established partnerships with hardware and software suppliers, system integrators, and third-party consultants. For more information, see the Partner Ecosystem section.
Business Model
57Business Model
We also leverage our expertise in business processes across industries to direct our innovations to the world’s greatest challenges, such as the social and environmental strains posed by a rapidly expanding global middle class. Our goal is to create long-term value by providing solutions not just for the current challenges faced by our customers, but also those of the future. In this way, we see our role moving beyond the creation of new efficient solutions: We want to help fundamentally change how people live, conduct business, and use software. This framework underscores how SAP can create its greatest impact through the use of our solutions by more than 253,500 customers worldwide.
SAP contributes to the creation of long-term value for society in a number of ways. At SAP and within our ecosystem, we support job creation and economic prosperity through demand for highly qualified workers to sell, implement, and enhance our software for customers. Our solutions support the learning and talent development of our customers’ employees. Other SAP solutions enhance health and safety, both on the manufacturing side and in the final consumer products, which impact millions of people worldwide.
Our greatest positive environmental impact stems from enabling improvements through the solutions we provide to customers. For example, our software plays a primary role in driving supply chain optimization, efficiency gains in production processes, and transparency regarding energy consumption and emissions.
58 Combined Management Report

SolutIonSSAP has built a deep expertise in more than 40 years of delivering market-leading software to distinct industries and lines of business. Our end-to-end solutions for industries and lines of business combine assets across our product, service, technology, and market categories to solve specific customer challenges.
Solutions for lines of BusinessOur line-of-business solutions are relevant across all industries, providing best-practice capabilities to key functional areas within an organization. As a result, they enable professionals to excel within their respective disciplines. Our portfolio of solutions currently covers 12 lines of business:– Asset management – Corporate strategy and sustainability– Finance – Human resources– Information technology– Manufacturing– Marketing– Procurement– R&D and engineering– Sales– Service – Supply chain management
ouR FoCuS on CuStoMeRS AnD InnoVAtIonSAP’s portfolio of products, solutions, services, and support is designed with customer centricity in mind. Our solutions help customers address the major trends and issues of our time – such as the unprecedented power of people to connect, the ubiquity of mobile technology, the pressures of population growth and rapid urbanization, and the increasing demand on natural resources. Our software enables companies of all sizes to better connect to their customers and suppliers, and to measure, track, and manage their sustainable operations. Our solutions also address our customers’ expectations for shorter innovation cycles, an attractive total cost of ownership (TCO), a superior user experience, and choice of consumption options – whether on premise or in the cloud.
SAP's portfolio offers solutions to customers of all sizes and across 25 industries, all around the globe. The platform for all our solutions is called SAP HANA. SAP was the first company to introduce an in-memory database not only for analytics, but also for running complete enterprise applications in main memory. SAP HANA is an in-memory data platform that is deployable as an on-premise appliance or in the cloud. It is a revolutionary platform best suited for performing real-time analytics, and developing and deploying real-time applications. Due to its hybrid structure for processing transactional work-loads and analytical workloads fully in-memory, SAP HANA combines the best of both worlds. It also offers a unique opportunity for business innovation, simplifying IT landscapes, reducing TCO, and boosting performance by a wide margin. All of our products will be enabled to run on the SAP HANA platform, and we continue to make SAP HANA a key differentiator in both technology and business applications across our entire portfolio.
portfolio of products, solutions, and services
59portfolio of products, solutions, and services
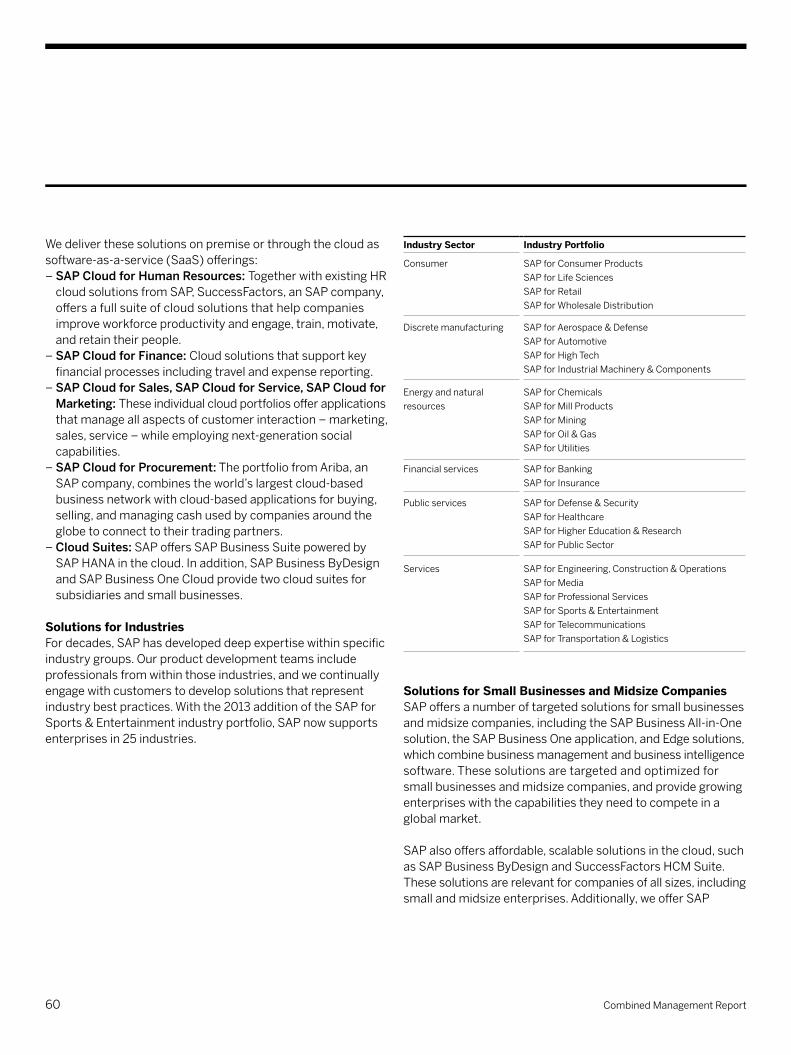
Industry Sector Industry portfolio
Consumer
SAP for Consumer Products SAP for Life SciencesSAP for RetailSAP for Wholesale Distribution
Discrete manufacturing
SAP for Aerospace & DefenseSAP for AutomotiveSAP for High TechSAP for Industrial Machinery & Components
Energy and natural resources
SAP for ChemicalsSAP for Mill Products SAP for MiningSAP for Oil & GasSAP for Utilities
Financial services SAP for BankingSAP for Insurance
Public services
SAP for Defense & SecuritySAP for HealthcareSAP for Higher Education & ResearchSAP for Public Sector
Services
SAP for Engineering, Construction & OperationsSAP for MediaSAP for Professional ServicesSAP for Sports & EntertainmentSAP for TelecommunicationsSAP for Transportation & Logistics
Solutions for Small Businesses and Midsize CompaniesSAP offers a number of targeted solutions for small businesses and midsize companies, including the SAP Business All-in-One solution, the SAP Business One application, and Edge solutions, which combine business management and business intelligence software. These solutions are targeted and optimized for small businesses and midsize companies, and provide growing enterprises with the capabilities they need to compete in a global market.
SAP also offers affordable, scalable solutions in the cloud, such as SAP Business ByDesign and SuccessFactors HCM Suite. These solutions are relevant for companies of all sizes, including small and midsize enterprises. Additionally, we offer SAP
We deliver these solutions on premise or through the cloud as software-as-a-service (SaaS) offerings:– sap Cloud for Human resources: Together with existing HR
cloud solutions from SAP, SuccessFactors, an SAP company, offers a full suite of cloud solutions that help companies improve workforce productivity and engage, train, motivate, and retain their people.
– sap Cloud for Finance: Cloud solutions that support key financial processes including travel and expense reporting.
– sap Cloud for sales, sap Cloud for service, sap Cloud for Marketing: These individual cloud portfolios offer applications that manage all aspects of customer interaction – marketing, sales, service – while employing next-generation social capabilities.
– sap Cloud for procurement: The portfolio from Ariba, an SAP company, combines the world’s largest cloud-based business network with cloud-based applications for buying, selling, and managing cash used by companies around the globe to connect to their trading partners.
– Cloud suites: SAP offers SAP Business Suite powered by SAP HANA in the cloud. In addition, SAP Business ByDesign and SAP Business One Cloud provide two cloud suites for subsidiaries and small businesses.
Solutions for IndustriesFor decades, SAP has developed deep expertise within specific industry groups. Our product development teams include professionals from within those industries, and we continually engage with customers to develop solutions that represent industry best practices. With the 2013 addition of the SAP for Sports & Entertainment industry portfolio, SAP now supports enterprises in 25 industries.
60 Combined Management Report
sap Business suite is also available “powered by sap HaNa” as our next-generation business suite that captures and analyzes data in real time on a single in-memory platform. In the past, companies would run separate disk-based systems; one to capture transactional data, and one to analyze data in a data warehouse. SAP Business Suite powered by SAP HANA allows customers to work with a single in-memory data management system, empowering customers to run their business in real time to transact, analyze, and predict instantly and proactively. This gives companies the ability to translate real-time insights into action immediately, while removing the complexity of redundant system data and systems. Customers can now manage mission-critical business processes, such as planning, execution, reporting, and analysis, in real time using the same relevant live data. This simplification lowers TCO.
AnalyticsOur analytics offerings enable users to unleash the power of collective insight by helping them collect massive amounts of Big Data and use it to drive better business outcomes. The solutions enable users to unlock the data they need empowering them with the right information at the right time to make insightful business decisions, anticipate change, and uncover new opportunities. When using software powered by SAP HANA, companies can gain insight by overcoming the classic trade-off between the speed and flexibility of data analysis. As a result, data analysis becomes much faster and more cost-effective.
Business One Cloud to small businesses and midsize companies. SAP Business One Cloud is a comprehensive and easy-to- consume cloud offering with predictable costs.
pRoDuCtSIn 2013, SAP offered innovative products in five market categories: Applications, Analytics, Mobile, Database and Technology, and Cloud, all powered by the SAP HANA platform.
We will continue to offer products in these market categories, along with innovations designed to meet customer needs now and in the future. As described in the Vision, Mission, and Strategy section of this management report, our strategy will focus even more on how our products deliver simplicity, better business outcomes, and sustainable business value.
In 2013, our product portfolio comprised the following:
ApplicationsSAP is the recognized leader in enterprise applications. Based on our leading technology and our unmatched business process know-how, we deliver innovations without disruptions.
sap Business suite software helps create a comprehensive business process platform for companies to run better and perform better every day.
The main applications in SAP Business Suite are:– SAP Customer Relationship Management (SAP CRM):
Provides a comprehensive set of functionality for marketing, sales, and service to engage with customers.
– sap erp: Supports critical business processes such as finance, HR, and other essential corporate functions.
– SAP Product Lifecycle Management (SAP PLM): Manages the product and asset lifecycle across the extended supply chain.
– SAP Supplier Relationship Management (SAP SRM): Supports key procurement activities.
– SAP Supply Chain Management (SAP SCM): Helps adapt supply chain processes to a rapidly changing competitive landscape.
61portfolio of products, solutions, and services
Our portfolio of mobile solutions includes:– enterprise mobility management: In many organizations,
employees use different types of mobile devices to access critical enterprise data, content, and applications. To address this demand, SAP offers the SAP Afaria mobile device management solution and the SAP Mobile Documents solution.
– Mobile apps: SAP has a variety of mobile apps that interface with our on-premise solutions and address line-of-business, industry, and consumer needs. In addition, SAP has opened our mobile development platform to our partner ecosystem to support the growing demand for mobile apps.
– sap Mobile platform: SAP Mobile Platform combines Sybase Unwired Platform, the former Sybase 365 Mobilizer Platform (for business-to-consumer applications), and Agentry from the acquired company Syclo into a single platform, thus supporting mobile development and deployment across the entire enterprise.
Database and technologyOur database and technology portfolio provides a solid and comprehensive foundation for business applications. SAP HANA, our ground-breaking in-memory platform, has redefined innovation in the database and technology market and has become the fastest-growing product in our history. We depend on our ecosystem to expand our reach, and accelerate growth and adoption of SAP database and technology products beyond our installed base customers.
In addition to SAP HANA, we offer a comprehensive family of database and technology solutions that includes:– application development and integration: SAP NetWeaver
provides a comprehensive technology platform, designed to efficiently develop, run, and extend business applications. SAP NetWeaver provides technology and enterprise software, such as the SAP NetWeaver Business Warehouse (SAP NetWeaver BW) application, and the SAP NetWeaver Application Server, SAP NetWeaver Portal, and SAP NetWeaver Process Orchestration components.
– database: We offer the technology to make up a real-time data platform, including SAP HANA, SAP IQ database software, SAP Adaptive Server Enterprise (SAP ASE), and the SAP SQL Anywhere suite.
Analytic solutions from SAP include:– Business intelligence (BI): Helps users to make fact-based
decisions with enterprise business intelligence solutions that enable users to engage with all their data, on any device, across any platform. Our BI solutions include the SAP BusinessObjects BI platform, SAP Crystal Reports, SAP BusinessObjects Dashboards, and SAP Lumira.
– Enterprise performance management (EPM): Helps companies improve performance, organizational agility, and decision making. SAP solutions for EPM include SAP Business Planning and Consolidation, SAP Profitability and Cost Management, SAP Financial Consolidation, and SAP Disclosure Management applications.
– Governance, risk, and compliance (GRC): Provides organizations with a real-time approach to manage GRC across heterogeneous business environments. SAP solutions for GRC include the SAP Risk Management, SAP Access Control, and SAP Global Trade Services applications as well as the SAP Sustainability Performance Management analytic application.
– predictive analytics: Brings advanced analytics capabilities to a broad spectrum of users – beyond data scientists to line-of-business users and analysts in the workplace – to help uncover new business opportunities, predict trends, and proactively respond to change. This is made possible by automating key modeling and analytical tasks and enabling faster deployment and adoption of predictive analytics tools.
MobileToday's businesses demand mobile access to critical business information. Mobile solutions from SAP offer the foundation for enterprise mobility and seamless integration with the core enterprise applications of our customers. SAP is recognized as a market leader in enterprise mobility.
62 Combined Management Report

SeRVICeS AnD SuppoRtSAP offers comprehensive services and support to help our customers maximize the value of their SAP investments by offering higher value realization, faster adoption of innovation, and higher efficiency in the implementation of our solutions. Our services and support portfolio covers the entire end- to-end application lifecycle, from a tight integration with our development organization, to accelerating innovation and continuous improvement of our software solutions, to complete risk and quality management.
Software-Related Services
Custom DevelopmentThe SAP Custom Development organization specializes in building individual software solutions that address the unique needs of our customers, and that fit seamlessly with existing SAP software. SAP Custom Development draws on our innovations, especially SAP HANA, to deliver unmatched impact and value for specific customer use cases.
Maintenance and SupportSAP offers a comprehensive and tiered maintenance and support model to customers of our on-premise solutions on a global basis. This support offering primarily includes SAP Enterprise Support and SAP Standard Support offerings.
– sap enterprise support: Our premier maintenance and support offering is designed as a strategic, long-term partnership with our customers.
– sap standard support: Our basic support offering delivers functions, knowledge, and tools that help customers implement, maintain, and enhance their SAP solutions.
CloudIn a world where customers need to respond quickly to changing market conditions, the cloud model offers an ideal combination of flexibility, affordability, and rapid time to value. With SAP Cloud powered by SAP HANA, we are helping customers enjoy the innovation potential of a cloud-based setup. At the same time, we are simplifying our consumption model, our product portfolio, and our customers’ user experience.
Today, SAP offers one of the most comprehensive cloud portfolios on the market. With the decision to offer all our products in the cloud, the cloud category will evolve from a product category to a deployment option for our customers to simplify the consumption of our solutions. Our offerings span cloud applications, business networks, and cloud platforms. In addition, we offer our customers a choice of different cloud deployments to fit their business needs, such as public or private cloud models.
In 2013, SAP began offering sap Cloud powered by sap HaNa, which includes infrastructure, platform, and software as services in the cloud, incorporating the former SAP HANA Enterprise Cloud managed cloud services offering. It allows entire enterprise systems to be run in the cloud and provides customers with a new deployment option to gain immediate value from the innovations of SAP HANA. This enables the operation of mission-critical business applications as well as new applications powered by SAP HANA. In providing such services, we aim to enable organizations to realize faster time to value coupled with lower total cost of ownership, and benefit from increased flexibility and reliability.
In addition, SAP HANA Cloud Platform is a development platform-as-a-service (PaaS) designed to help customers, independent software vendors, and partners rapidly create innovative enterprise software applications in the cloud leveraging our leading in-memory technology.
SAP supports a hybrid model, allowing customers to integrate new cloud services with their on-premise applications. This gives customers the opportunity to consume new innovations using the cloud while safeguarding their investments in their existing application landscape.
63portfolio of products, solutions, and services
professional Services
Consulting ServicesWe offer consulting services for the planning, implementation, and optimization phase of our business solutions. Our consultants engage in a wide range of services, including business transformation, IT transformation, performance and insight optimization, and business applications services. These services help customers optimize business performance and leverage the full power of SAP solutions.
SAP consultants also implement sap rapid deployment solutions, which combine preconfigured software and predefined services, such as SAP Best Practices, templates, tools, and user guides. By doing so, they help companies adopt innovations more quickly and at transparent cost.
Education ServicesThe SAP Education organization offers a complete portfolio of multimodal learning that covers the learning needs of single individuals, as well as organizations. We provide a consistent curriculum for learners around the world, including online e-learning, virtual live classroom sessions, learning on demand, and classroom training. Our educational programs help people become more proficient, efficient, and productive in their use of SAP solutions. Every year, more than 500,000 individuals are trained by SAP Education, making it one of the largest IT training organizations in the world.
For more information about services and support from SAP, see www.sap.com/services-support/svc.html. For more information about how SAP handles security and privacy in our products and services, see the Security and Privacy section of the SAP Integrated Report 2013 online. For more information about SAP products and solutions, see www.sap.com/pc/index.html.
Our support portfolio also contains two additional premium maintenance offerings:– sap Maxattention: These services provide the highest
possible level of support for our customers. The combination of SAP MaxAttention and SAP Enterprise Support offers customers comprehensive all-round support. This strategic offering is designed for continuous business and co-innovation with customers. Through the SAP Active Global Support (SAP AGS) organization, SAP MaxAttention offers support services tailored to the requirements of the customer, expertise acquisition by the customer, and continuous cooperation at senior management level based on an agreed-to balanced scorecard.
– sap activeembedded: These enhanced engagement services help optimize solutions and accelerate adoption of technologies without disrupting customer businesses.
For our cloud portfolio, support is included as part of our cloud subscriptions. Customers have the option of choosing standard, premium, and platinum support. In the premium and platinum offerings, customers have access to support offerings, such as access to a dedicated support account manager.
64 Combined Management Report
where we need to make improvements. We are also showing customers how we are addressing feedback. A prime example is the use of SAP Service Marketplace to describe improvement projects in a host of areas, from our licensing process to our digital experience. Customers can also provide input into these projects through idea place, an online platform from SAP, to capture, discuss, and rate ideas.
The NPS shows how likely our customers would be to recommend SAP to friends or colleagues on a scale of 0–10. To determine this metric, we start with the percentage of “promoters” of SAP – those who give us a score of 9 or 10. We then subtract the number of “detractors” – those who give us a score of 0–6. The method ignores “passives,” who give us a score of 7 or 8. The NPS can range from –100% to +100%. For more information on the NPS, see the Internal Management System section, and the Non-Financial Notes section of the SAP Integrated Report 2013 online.
StRonG CuStoMeR DeMAnDOur strategy focuses on offering solutions and services to help customers run better today and tomorrow. To do so we offer a spectrum of solutions from complete suites to applications that are simple, lean, focused, quick to implement, and highly mobile. In 2013, we saw customers embrace this strategy by licensing or subscribing to the full range of SAP applications – from comprehensive solutions for large enterprises to the latest mobile apps.
When SAP customers become best-run businesses, they can create more sustainable business models – which in turn helps us ensure our own long-term viability. That is why we strive to provide more than just software; we continually engage with our customers at every stage – not only during the sales and implementation phases, but also through the sharing of best practices and innovations.
One example of this strategy is our Customer Engagement Initiative. This program offers customers early insight into cer tain aspects of our product road map, so they can influence the development cycle. In addition, it offers customers the opportunity to network on topics of mutual interest. These networking opportunities take place at a variety of global events, including the SAPPHIRE NOW and SAP d-code (previously SAP TechEd) conferences, as well as virtual events.
CuStoMeR loyAltyWe gauge customer loyalty through an annual survey that measures our Net Promoter Score (NPS). Customer loyalty is one of our four companywide strategic goals, along with revenue, margin, and employee engagement. In 2013, our NPS increased by 3.2 percentage points to 12.1%, compared with 8.9% in 2012. The increase achieved in 2013 showed us that we are on the right track even though we had predicted an increase of eight percentage points at the beginning of the year. In addition, the results provided insights into different geographic regions and issues, and will help inform our future approach.
Our increased NPS reflects our commitment to listening to our customers and responding to their needs. Our goal is to best support their success and the success of SAP. For example, we are expanding on the insights provided by our surveys through in-person focus groups that explore customer feedback in more depth. These sessions have enabled us to identify the underlying reasons behind issues and focus more precisely on
Customers
65Customers
AMeRICAS ReGIon– ExxonMobil, an American multinational oil and gas corporation,
selected the SAP Cloud for Sales solution and the SAP Sales and Operations Planning solution (powered by SAP HANA) to support demand and supply balancing. Building on its on-premise SAP software deployment with cloud solutions from SAP, ExxonMobil expects to optimize logistics planning processes, increase planning accuracy, and shorten planning cycle time through the improved management of Big Data.
– Levi Strauss & Co, a well-known clothing brand, chose to run its analytics platform through SAP NetWeaver Business Warehouse powered by SAP HANA. With this, Levi Strauss expects to consolidate financial reporting globally, get real time insight into product performance, and help stock the right products in the right stores at the right time.
– Petrobras, Brazil’s largest energy company, is already live with the SAP Business Planning and Consolidation application. Petrobras expects this implementation to improve forecast accuracy and drive real-time financial planning based on latest oil prices and currency fluctuations.
– ProHealth Care, a community-based healthcare system located in the United States, selected the SuccessFactors Enterprise bundle. With SAP, ProHealth Care expects to align with its top HR initiatives, focusing on patient safety and satisfaction.
Some examples by region include the following customers:
euRope, MIDDle eASt, AnD AFRICA (eMeA) ReGIon– The Deutscher Fussball-Bund (DFB) is made up of the German
Association Football League at the professional level and five regional and 21 state associations at the semi-pro and amateur levels. The customer plans to tailor campaigns and promotions to fans through the SAP CRM powered by SAP HANA rapid-deployment solution and SAP Event Ticketing software.
– Eldorado, a large consumer electronics and domestic appliances retailer in Russia, selected the SAP CRM powered by SAP HANA application, as well as the SAP 360 Customer, SAP Planning for Retail, and hybris OmniCommerce for retail to help improve customer service and achieve faster results. With SAP and hybris software, Eldorado expects to track and combine consumer information across channels in real time, so they can run their business and achieve full intimacy with their consumers.
– Nestlé Nespresso is a world leader in coffee machines and coffee maker technology. With the SAP Cloud for Sales solu-tion, Nespresso aims to extend its premium experience by understanding and engaging customers at every step of the buying journey.
– The Royal Swaziland Sugar Corporation, a leading sugar producer in Africa, has chosen to adopt SAP Business Suite powered by SAP HANA. SAP Business Suite software will allow the company to consolidate multiple systems.
– Unilever, one of the largest multinational consumer goods companies in the world, partnered with SAP to develop the SAP Retail Execution mobile app on SAP Mobile Platform. With this SAP software, Unilever expects to empower its large sales force, merchandisers, and shopping assistants across multiple countries in Asia and Europe to accelerate opportu-nities at the point of sale and increase customer satisfaction.
66 Combined Management Report
ASIA pACIFIC JApAn (ApJ) ReGIon– Agricultural Bank of China (ABC), one of the four Tier 1 banks
in China, selected SAP ASE and SAP IQ software to support synergistic development in rural and urban areas. With SAP, ABC expects to capitalize on its comprehensive business portfolio and extensive distribution network through the use of an advanced IT platform.
– China Resources Enterprise (CRE), a large producer of consumer goods in China, selected the SAP 360 Customer solution and the SAP Trade Promotion Management application. With SAP software, CRE expects to gain the speed and flexibility it needs to execute its winning strategy from any device, anytime, anywhere.
– Net One Systems, a leading network integrator in Japan, selected the SAP ERP application to promote innovation in its operating processes, construct an efficient IT platform, and strengthen internal controls by linking information among its operations.
– Shanghai Huayi Group, one of China's largest chemical manufacturers, operates more than 20 wholly owned and shareholding subsidiaries. With SAP software, Shanghai Huayi Group expects to improve capital operations, resources sharing, and technological management to advance the company into the world’s top 50 chemical makers.
– Varun Beverages Limited, a food and beverages company based in India, selected SAP Business Suite powered by SAP HANA to support faster, smarter, and real-time decision making. With SAP software, Varun Beverages expects to provide real-time analytical reporting to key stakeholders, while achieving a 20% reduction in the MRP process and a 15% reduction in overall order processing time.
67Customers
SAp hAnAIn 2013, SAP made further investments in our next-generation in-memory platform, SAP HANA, as the foundation for all of our products, solutions, and services – so that our customers can run their businesses in real time. A rich and growing ecosystem of partners further drives the adoption of SAP HANA as an open platform, and a number of startup companies now deliver new and innovative applications built on the SAP HANA platform.
CloudTo further advance our leadership in the cloud, we continued to expand our portfolio of cloud-based applications. For example, customers that want to accelerate their transition to the real-time enterprise can now take advantage of our latest innovation in the cloud, SAP Cloud powered by SAP HANA, which includes infrastructure, platform, and software as services in the cloud, incorporating the former SAP HANA Enterprise Cloud managed cloud services offering. Core elements include an elastic infrastructure, the in-memory platform, and services for deploying SAP or custom applications in real time.
SAp Business Suite powered by SAp hAnAOur highly engaged and diverse research and development teams are also working to improve SAP Business Suite by simplifying the end-to-end experience of using the applications while also optimizing performance. Combining SAP Business Suite with SAP HANA was a major milestone in 2013, enabling customers to make decisions in real time and gain unmatched visibility into business processes In addition, the software helps customers unleash their full potential when it comes to meeting consumer and competitive demands through real-time access to data, real-time analytics, and unprecedented improvements in performance.
Adhering to our imperative of “SAP runs SAP,” SAP has led the way in the adoption of SAP Business Suite powered by SAP HANA by going live internally with SAP CRM and SAP ERP applications now running on SAP HANA in 2013.
Research and development is the source of the discoveries that will shape the future for SAP and its customers. At SAP, research and development is a global effort that is highly collaborative, focused on customer value, and involves co- innovation with customers, partners, and academia.
GloBAl DeVelopMent, loCAl FoCuSOur Products & Innovation organization is truly global, with the majority of development colleagues located in 14 SAP Labs locations in 12 countries (see graphic). SAP Labs are globally distributed, situated within major technology hubs where access to talent and the latest technology trends create an optimal setup for innovation.
SAP Labs locations in fast-growing markets strive to produce market-relevant solutions that complement SAP’s global product portfolio. In addition, they are structured in a manner that allows for close interaction with local stakeholders, including customers, partners, and universities. This strategy of distrib-uted development, focusing on locations with talent availability, fostering diversity and access to new ideas, while also ensuring local market relevance, has proven highly successful for SAP.
To every technology and engineering challenge, SAP brings the strength and experience of a global development team. This helps ensure the rapid impact of research and development activities on our solution portfolio, and contributes to an ever-increasing pace of innovation. ContInuouS InnoVAtIonResearch and development is only successful if it provides continuous improvement for existing products, while at the same time executing against promising new concepts that can help SAP enter new markets. And it must do so better and faster than our competition.
The following were among our 2013 R&D accomplishments:
research and development
68 Combined Management Report
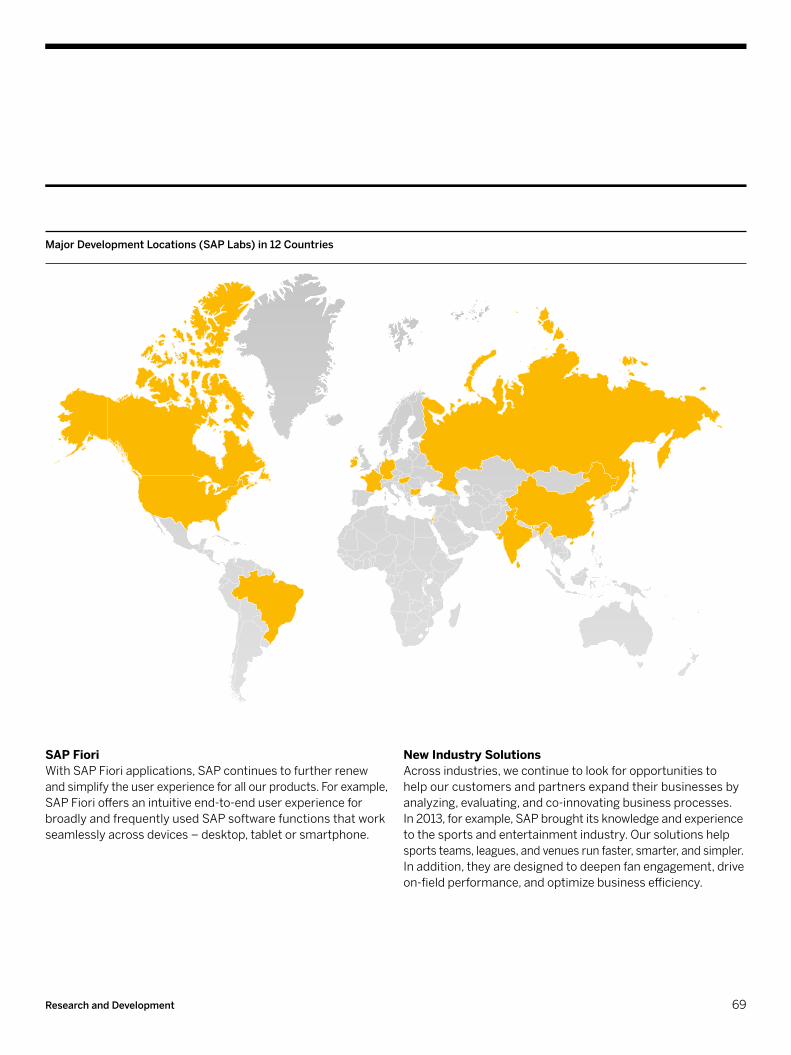
new Industry SolutionsAcross industries, we continue to look for opportunities to help our customers and partners expand their businesses by analyzing, evaluating, and co-innovating business processes. In 2013, for example, SAP brought its knowledge and experience to the sports and entertainment industry. Our solutions help sports teams, leagues, and venues run faster, smarter, and simpler. In addition, they are designed to deepen fan engagement, drive on-field performance, and optimize business efficiency.
SAp FioriWith SAP Fiori applications, SAP continues to further renew and simplify the user experience for all our products. For example, SAP Fiori offers an intuitive end-to-end user experience for broadly and frequently used SAP software functions that work seamlessly across devices – desktop, tablet or smartphone.
Major Development Locations (SAP Labs) in 12 Countries
69research and development
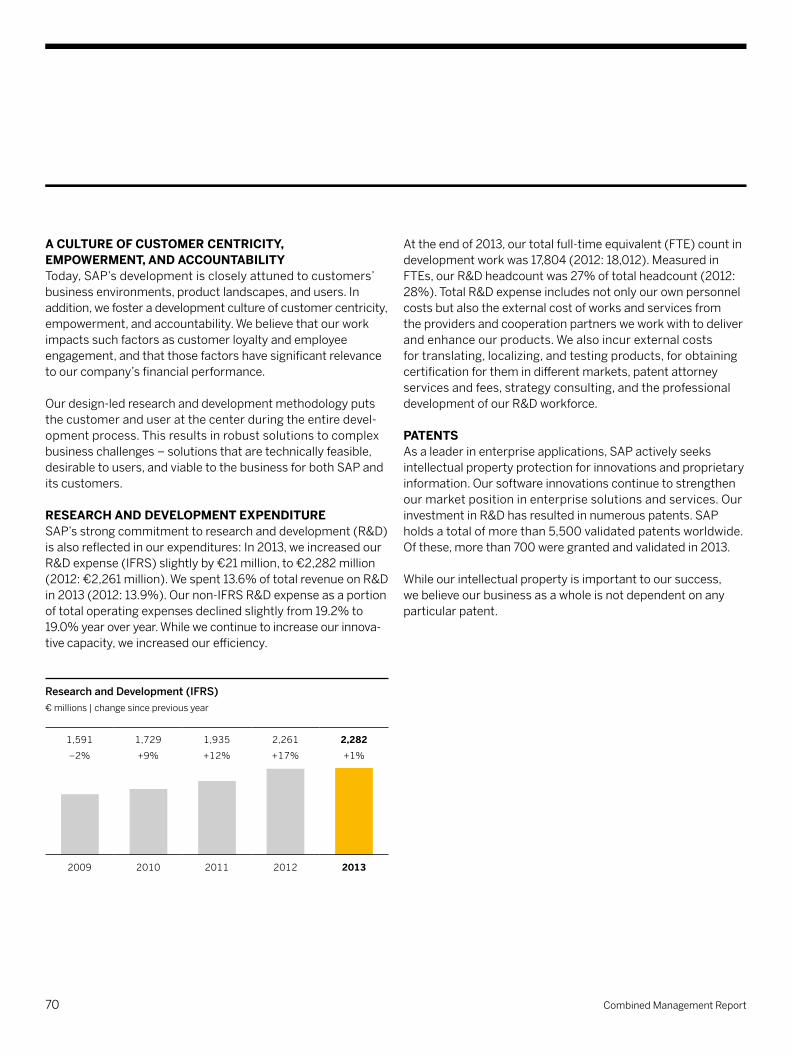
At the end of 2013, our total full-time equivalent (FTE) count in development work was 17,804 (2012: 18,012). Measured in FTEs, our R&D headcount was 27% of total headcount (2012: 28%). Total R&D expense includes not only our own personnel costs but also the external cost of works and services from the providers and cooperation partners we work with to deliver and enhance our products. We also incur external costs for translating, localizing, and testing products, for obtaining certification for them in different markets, patent attorney services and fees, strategy consulting, and the professional development of our R&D workforce.
pAtentSAs a leader in enterprise applications, SAP actively seeks intellectual property protection for innovations and proprietary information. Our software innovations continue to strengthen our market position in enterprise solutions and services. Our investment in R&D has resulted in numerous patents. SAP holds a total of more than 5,500 validated patents worldwide. Of these, more than 700 were granted and validated in 2013.
While our intellectual property is important to our success, we believe our business as a whole is not dependent on any particular patent.
A CultuRe oF CuStoMeR CentRICIty, eMpoWeRMent, AnD ACCountABIlItyToday, SAP’s development is closely attuned to customers’ business environments, product landscapes, and users. In addition, we foster a development culture of customer centricity, empowerment, and accountability. We believe that our work impacts such factors as customer loyalty and employee engagement, and that those factors have significant relevance to our company’s financial performance.
Our design-led research and development methodology puts the customer and user at the center during the entire devel-opment process. This results in robust solutions to complex business challenges – solutions that are technically feasible, desirable to users, and viable to the business for both SAP and its customers.
ReSeARCh AnD DeVelopMent expenDItuReSAP’s strong commitment to research and development (R&D) is also reflected in our expenditures: In 2013, we increased our R&D expense (IFRS) slightly by €21 million, to €2,282 million (2012: €2,261 million). We spent 13.6% of total revenue on R&D in 2013 (2012: 13.9%). Our non-IFRS R&D expense as a portion of total operating expenses declined slightly from 19.2% to 19.0% year over year. While we continue to increase our innova-tive capacity, we increased our efficiency.
Research and Development (IFRS)€ millions | change since previous year
1,591
–2%
1,729
+9%
1,935
+12%
2,261
+17%
2,282+1%
2009 2010 2011 2012 2013
70 Combined Management Report

– providing implementation and other services: SAP has strong partnerships with a broad network of IT professional services firms that provide consulting, system integration, hosting, education, and more. At the end of 2013, our partners collectively had more than 380,000 skilled resources in SAP solutions and technology. These companies are critical to the successful implementation and deployment of SAP solutions at customers we serve together. In response to growing cus-tomer demand for flexible deployment and purchase options, SAP is working closely with the partner ecosystem to offer innovative cloud-based offerings and business models, including OEM and managed cloud services, and by making SAP platforms and applications available through public cloud offerings.
To help the SAP partner ecosystem achieve its business goals, SAP provides an extensive array of business support offerings. SAP’s flagship partner program, SAP PartnerEdge, offers a tiered engagement model that provides marketing, sales, and technical enablement, as well as education, deal support, and a variety of other benefits and resources. We provide SAP global partners – a select group of leading global technology, software, and services companies – with dedicated teams that work closely with them to proactively engage in business development and technical initiatives addressing specific market needs. Many of our partners participate in SAP Community Network, an online community that facilitates networking and information sharing for technical professionals. In addition, many participate in the SAP Listens program, which surveys partners for feedback and provides insight into projects we have initiated to address partner issues.
A vibrant partner ecosystem is essential to SAP’s success, and is a key component in our ability to achieve our mission of helping businesses run better and improving the lives of people everywhere.
SAP engages with an extensive partner ecosystem to address the needs of customers around the world. With nearly 11,500 partners at the end of 2013, we continue to foster our partner ecosystem. Partners operate independently of SAP, and com-plement our business in one or more of the following ways:– selling sap software: SAP partners help companies of all
sizes identify, purchase, and deploy the ideal solutions to address their business needs. SAP value-added resellers (VARs) and multitier distribution channels offer local market and industry expertise that addresses specific market needs. SAP closely aligns its sales efforts with those of our partners through well-defined rules of engagement that outline each organization’s roles and responsibilities. In most markets, partners are the primary sales channel to address the needs of small and midsize enterprises (SMEs). Our company also sells select products through our own online channel, SAP Store, which includes complementary solutions developed by SAP partners. In addition, SAP resells applicable partner solutions as part of our solution extensions portfolio. These partner-developed solutions are tested, validated, and approved by SAP development organizations, and supported by SAP.
– developing solutions that complement sap software: SAP has a vibrant community of partners that develop on SAP platforms and create complementary products integrating with SAP applications. This community is vital to providing our customers with a broad portfolio of solutions that leverage the capabilities of SAP HANA, SAP Mobile Platform, our cloud offerings, and more. At the same time, we maintain strategic relationships with industry-leading technology, software, and services firms. SAP engages with the partner community in the development of new solutions, and works closely with partners on new product initiatives. Partners can embed SAP technology within their offerings under an original equipment manufacturer (OEM) licensing agreement. We also work actively with partners to enable new and innovative delivery and go-to-market approaches to support customer needs and preferences. Beyond these formal partnerships, companies can also certify their integration with SAP technology through the SAP Integration and Certification Center (SAP ICC).
partner ecosystem
71partner ecosystem
For more information about our acquisitions, see the Notes to the Consolidated Financial Statements section, Note (4).
VentuRe ACtIVItIeSThrough SAP Ventures, which comprises our consolidated investment funds, SAP has partnered with renowned entrepreneurs worldwide to build industry-leading businesses. SAP Ventures has supported more than 100 companies on five continents for more than 15 years. Many of these companies have been acquired or have become publicly listed companies.
In October, SAP announced its commitment to invest US$650 million through a new consolidated investment fund, named SAP Ventures Fund II.
In 2013, SAP made a total commitment of US$1 billion bringing SAP Ventures’ total available investment pool to more than US$1.4 billion for use over the lifetime of its respective funds. Investments through the funds are currently ongoing and depend on capital calls from the funds. SAP Ventures seeks companies with an established market presence that are growing very fast, and which they can help fuel their growth by adding expertise, relationships, geographic reach, and capital. It invests globally with a particular focus on emerging companies in Europe, India, and the United States, as well as in Brazil and China.
For more information about our consolidated investment funds, see the Notes to the Consolidated Financial Statements section, Note (34).
SAP views acquisitions as investments in people, technologies, and growth. In 2013, SAP made the following acquisitions:
ACQuISItIonS– In March, SAP acquired Ticket-Web GmbH & Co. KG, a provider
of ticketing solutions and niche customer relationship management (CRM) software for sports and entertainment promoters. The acquisition helped SAP enter the sports and entertainment industry, as we can now offer enhanced solutions that help promoters, venues, and teams market events over the Internet and better manage arenas.
– In April, SAP acquired certain assets from KMS Software Company LLC, a provider of Web-based human capital management software and solutions in the areas of electronic onboarding, off-boarding, forms management, and new-hire engagement.
– In April, SAP acquired Camilion, a provider of product development, product lifecycle, and underwriting solutions for the insurance market. These solutions allow SAP customers to streamline the management and creation of new insurance products, providing insurance brokers and underwriters with simple tools to help speed up transactions and reduce costs.
– In April, SAP acquired SmartOps, a provider of inventory and service-level optimization software solutions. This acquisition helps SAP develop real-time supply chain software solutions on the SAP HANA platform. The solutions help customers optimize inventory and service levels, freeing up working capital for innovation and growth.
– In August, SAP acquired hybris, one of the leading commerce technology companies. This is an investment in the future of commerce and customer engagement. We continue to combine the omnichannel commerce solutions of hybris with enterprise technology and industry leading in-memory, cloud, and mobile innovations from SAP. Together, these capabilities can help facilitate new levels of customer insight and engagement.
– In October, SAP acquired KXEN, a provider of predictive analytics technology for line-of-business users and analysts. The addition of KXEN solutions will provide easy-to-use predictive capabilities for the extensive SAP customer base.
acquisitions
72 Combined Management Report
ReCRuItInG tAlent to FulFIll ouR VISIonThroughout 2013, we continued to recruit employees through-out the world, with particular emphasis on emerging markets, including Brazil, China, India, Russia, and Turkey. We are also focused on countries in Africa – namely, Kenya, Nigeria, and South Africa. In addition to our regional emphasis, we laid the foundation to attract talent with different skills to support our cloud strategy. For example, we seek candidates with design expertise to help us create software for the next generation of customers. In addition, we must meet increasing demand for products that take a human-centered approach to design and are extremely easy to use.
To support these priorities, we undertook an end-to-end review of our talent management process in 2013, with particular focus on how to attract and acquire newer generations of talent (“early talent”). We recognize that to meet our business goals, we need a workforce that is agile and multigenerational, with strong cross-cultural awareness. We are highlighting opportunities for emerging talent to connect with a sense of purpose in their work at SAP. In addition, we are creating new ways to interact with prospective hires, such as inviting our employees to speak with college students, running design-thinking workshops on campus, and expanding our presence on social media.
Nothing has a greater impact on SAP’s long-term success than the creativity, talent, and commitment of our people. Their ability to understand the needs of our customers and to innovate delivers sustainable value to our company and society. Successful strategies to attract, retain, develop, and engage our employees, therefore, are critical to driving a culture of innovation, sustained growth, and profitability. We continually review and evolve these strategies in response to the markets we serve, demographic trends, and changes in our business model. As we move more of our business to the cloud, we are navigating profound shifts in how people consume and create software. This rapid change means that we innovate in much faster cycles than in the past. As a result, we must have the right mix of talent and capabilities to support our customers and deliver on our business strategy. Our people must be agile and able to connect quickly and seamlessly with the consumers of our solutions.
We are seeking to complement our established employee base by hiring newer generations of talent that bring a different perspective and skill set. We are also working to address shifting expectations. Many professionals today are seeking a stronger sense of purpose in their work, along with a creative, collaborative, and flexible job environment. Fostering this type of culture is also critical to our ability to innovate. To adapt to this evolving landscape, we are reviewing a wide range of areas, from how we attract diverse talent and develop our employer brand to how we define what it means for our leaders to develop and excel. In 2013, we took a number of steps to make our talent management strategies even more effective in supporting our future innovation and growth. Mobilizing the skills and passions of the people of SAP fuels not only our own success, but also the success of our customers, as well as our ability to fulfill our vision to help the world run better and improve people’s lives.
employees and social Investment
73employees and social Investment

We believe that to address the complex problems faced by business and society, our employees must understand and collaborate with people from a wide range of backgrounds and perspectives. Our Social Sabbatical program supports this goal, taking an innovative approach to developing talent while creating a positive impact in communities around the world. A group of 72 high-performing SAP employees from 30 countries are working in close collaboration with entrepreneurs, small and midsize enterprises, and nongovernmental organizations (NGOs) in emerging markets. Projects run for one month and focus on helping organizations grow, tackling business challenges, and expanding their impact. Programs are currently running in Brazil, China, India, and South Africa. Social Sabbaticals demonstrate how we can create value for SAP as well as others. Our employees return with an enhanced ability to lead, design innovative solutions, and work across functions, sectors, and cultures. Organizations benefit from fresh input and expertise that advances their mission to serve society.
enGAGInG eMployeeSIn our 2013 People Survey, a general survey of all employees conducted every two years, we achieved an overall employee engagement score of 77%. This is down from the engagement index of 79% reached the previous year during a pulse check of half of our employees, but equal to the score achieved during the last full People Survey in 2011. Our target for 2013 was a score of 82%. We are now committed to achieving this score in 2015. Despite the slight drop in employee engagement in 2013, we expect to see an incremental increase in our industry- leading score in 2014.
We attribute this to the fundamental transformation impacting the industry and to changes in top management that took place this year. In response to the market and customers, we are actively driving a growth and innovation strategy, with concerted efforts to be a leader in the cloud with SAP HANA as the platform for the industry. At the same time, the Executive
nuRtuRInG tAlent AnD leADeRShIpIn 2013, we worked toward accelerating employee career devel-opment in several ways. Specific projects included enhanced assessments of individual potential and development needs, career development sessions, greater transparency of internal opportunities, and expanded fellowships that allow people to work outside their regular roles. We encouraged employees to work closely with their managers on an ongoing development plan and introduced Success Map, a cloud-based solution developed by SuccessFactors, to enhance talent management and employee development. In addition, we offer a wide range of opportunities for our employees to develop their professional abilities, from e-learning courses to coaching. To ensure that our learning portfolio focuses on the capabilities we need most as an organization, we have been reviewing and refining these offerings. On average, our employees engaged in approximately nine days of training in 2013, compared to 11 days in 2012.
We also undertook a review of our leadership culture to identify and enhance the qualities that are critical as we shift our business model. As a result, we will increase our focus on hiring and developing leaders who drive simplification and develop outstanding talent to ensure our customers’ success. Two pilot programs have already provided our leaders with the opportunity to explore such critical topics in depth, exploring how to lead through change, inspire innovation, and take a holistic approach to leadership at SAP. In addition, we continue to offer a comprehensive suite of leadership programs to all levels of management, from coaching to specialized classroom learning. We are especially focused on deepening our general management capabilities.
74 Combined Management Report

on virtual shares in the Company’s performance, allocated at the beginning of the year, and on the performance of SAP stock. The 2013 tranche pays out in 2014.
The EPP is offered to employees in addition to our existing Share Matching Plan (SMP) and Stock Option Plan (SOP). Under the SMP, eligible employees are invited to purchase SAP shares at a discount of 40%. After a holding period of three years, employees receive one SAP share free of charge for every three shares held. Participants in the 2010 tranche received their free shares in 2013 after the holding period ended.
The SOP targets top executives and top performers with an allocation of stock options that vest after three years. Beneficiaries who were granted options in 2010 were entitled to exercise them in 2013 and benefited from the rise in the stock price.
For more information about share-based payments, see the Notes to the Consolidated Financial Statements section, Note (27).
Board has undergone significant changes in the past year, with a sole CEO model heralded for 2014. We continually focus on driving engagement through a range of activities, from career development to enhanced leadership. Finally, each board member has committed to following up on a key topic from the People Survey. Employee engagement remains one of SAP’s four company-wide strategic goals, along with revenue, margin, and customer loyalty.
RetAInInG tAlentIn 2013, the employee retention rate at SAP worldwide was 93.5% (2012: 94.0%). We define retention as the ratio of the average headcount (expressed in full-time equivalents) minus employee-initiated terminations (turnover) divided by the average headcount. In 2013, the average length of service at SAP worldwide was approximately 6.5 years (2012: 6.8 years).
In addition to measuring our retention rate, we also calculate its financial impact. We conducted an analysis showing that for each percentage point that our retention rate goes up or down, the impact on our operating profit is approximately €60 million.
We do not seek a general retention rate of 100%, as some turnover of talent supports our ability to innovate. However, we view a high retention rate as a priority and work to retain talent through our focus on employee engagement and career development. We are especially focused on retention in highly competitive job markets such as in Brazil and China.
expAnDInG eMployee oWneRShIpIn 2013, we continued our share-based compensation programs to give employees worldwide the opportunity to participate in the long-term success of SAP. Our Employee Participation Plan (EPP) is a global plan open to employees worldwide. The plan creates a common financial incentive and reward for achieving the yearly milestones of our 2015 goals. Its formula is based
75employees and social Investment
CReAtInG heAlthy CultuReAt SAP, we focus on the health of our employees as well as the health of our organizational culture. The two are interrelated, and we want to ensure that people have the ability to manage stress, balance their personal and professional lives, perform at their best, and thereby help drive our innovation. Our Business Health Culture Index (BHCI), based on our People Survey, assesses the degree to which our workplace culture supports people’s well-being and work/life balance. In 2013, we achieved a BHCI score of 67%, compared to 66% in 2012. Given the fast pace of change in the IT industry, we have set a goal of maintaining a score of 66% or higher.
We work toward our health goals through such global initiatives as our Health and Innovation Weeks, and workshops for man-agers on how to help their teams improve their resilience to stress. In 2013, we piloted a program that offered employees in Austria and Ireland the chance to create an in-depth personal health profile and identify opportunities to enhance their well-being. Utilizing tools such as biofeedback, the program assessed everything from diet to sleep habits to how the heart responds to stress. Highly popular with employees, the program provided us with aggregated, anonymous data that will help guide our health efforts in the future as we work to support creativity, resilience, and performance.
DRIVInG InnoVAtIon thRouGh DIVeRSIty AnD InCluSIonWe reframed our approach to diversity and inclusion in 2013 to focus on four key areas that are critical to innovation and sustainable long-term success: Gender Intelligence, Generational Intelligence, Culture and Identity, and Differently Abled People. Across all four areas, we seek to support the unique contributions of every individual. For example, to increase understanding and effectiveness among people of both genders, we conduct a workshop called Women and Men Leading Together. Exploring the subtleties of gender dynamics, this workshop is now mandatory for all senior executives.
We aim to help lead the tech industry in developing a better gender balance, and we continue to work toward our goal of increasing the number of women in management from 18% in 2010 to 25% in 2017. Our overall percentage of women in the workforce slightly increased in 2013 to 31% (2012: 30%), and the percentage of women in management increased to 21.2% in 2013 from 20.8% in 2012. To further support progress, we offer executive sponsorships for women and require that at least one diversity candidate is included on the short list for leadership and other positions. In addition, all members of our Executive Board have committed to dedicated action plans to support the recruitment, retention, and career advancement of candidates with diverse backgrounds.
One of our most significant developments in 2013 was the introduction of our Autism at Work initiative, which has drawn enormous support from the media, the public, and our employees. We ran pilots in Canada, Germany, India, Ireland, and the United States, hiring an initial group of people on the spectrum of autism disorders to work on specialized IT tasks such as software testing. Autism at Work enables us to tap a broader pool of talent and spark innovation by embracing differences in how people think, work, and tackle problems. We also see potential to make a positive impact on people’s lives and facilitate a broader conversation about autism that challenges assumptions and inspires change.
76 Combined Management Report
heADCount On December 31, 2013, we had 66,572 full-time equivalent (FTE) employees worldwide (December 31, 2012: 64,422). This represents an increase in headcount of 2,150 FTEs in comparison to 2012. Of the overall headcount increase in 2013, 1,111 resulted from acquisitions. The average number of employees in 2013 was 65,409 (2012: 61,134).
We define the FTE headcount as the number of people we would employ if we only employed people on full-time employment contracts. Students employed part-time and certain individuals who are employed by SAP but who, for various reasons, are not currently working are excluded from our figures. Also, temporary employees are not included in the above figures. The number of such temporary employees is not material.
On December 31, 2013, the largest number of SAP employees (47%) were employed in the EMEA region (including 26% in Germany and 21% in other countries in the region), while 29% were employed in the Americas region (including 20% in the United States and 9% in other countries in the region) and 24% in the APJ region.
Our worldwide headcount in the field of software and software-related services grew 7% to 11,261 FTEs (2012: 10,551). Cloud operations and support accounted for most of the increase. Professional services and other services counted 14,629 FTEs at the end of 2013 – an increase of 3% (2012: 14,259). Most
SoCIAl InVeStMentSOur social investment strategy leverages our talent, technology, and capital to create long-term, sustainable change. In 2013, we continued to focus on two areas that are critical to both SAP and society: Education and entrepreneurship. Fundamental to creating opportunity and enabling people to join the market economy, education also helps to create a pipeline of talent for SAP. Entrepreneurship plays an equally vital role in driving economic growth, creating jobs and spurring innovation. As we provide emerging entrepreneurs with technology and other support, we gain a deeper understanding of the market for small businesses and medium-size companies, positioning us to better serve customers in the future.
In 2013, SAP contributed about €20 million in cash donations to non-governmental and non-profit organizations. We donated software to more than 1,300 non-profit organizations and began a new program to provide the non-profit sector with analytics and cloud solutions. Our employees volunteered about 125,000 hours in communities in 45 countries. In addition, the SAP Solidarity Fund, a non-profit organization focused on helping those affected by catastrophic events, responded to such disasters as the typhoon Haiyan in the Philippines and the flood in Germany. SAP employees donated more than €240,000 to the fund in 2013, of which SAP matched €185,000.
To advance our global entrepreneurship program, we identified 25 entrepreneurs in Brazil who will receive a range of support from SAP, including technology and mentoring. We also introduced a new program, Skills for Africa, which provides free educational opportunities in information and communication technology (ICT) and helps people find employment. Our sister program in Brazil, Instituto Esperansap, is now in its fourth year. These programs herald a new way of thinking, where we play a direct role in preparing the next generation of talent and developing a skilled workforce that will help drive our future growth.
77employees and social Investment

of this increase was in consulting. A shift in the focus of our industry solutions led to some movement of employees from research and development to sales and marketing, resulting in a 1% headcount decrease to 17,804 FTEs (2012: 18,012) in research and development and a 6% headcount increase to 15,824 FTEs (2012: 14,899) in sales and marketing. Mainly as a result of our acquisition of hybris, general and administration headcount rose 7% to 4,566 FTEs at the end of the year (2012: 4,286). Our infrastructure employees, who provide IT and facility management services, numbered 2,488 FTEs – an increase of 3% (2012: 2,415) that mainly resulted from our acquisitions and investments in our company IT.
In the Americas region, headcount (FTEs) increased by 445, or 2%; in the EMEA region, the increase was 1,236, or 4%; and in the APJ region, it was 469, or 3%.
Our personnel expense per employee decreased to approxi-mately €114,000 in 2013 (2012: approximately €119,000). The decrease is primarily related to foreign exchange effects as the majority of our employees is located outside of the eurozone and paid in local currency. The personnel expense per employee is defined as the personnel expense divided by the average number of employees. For more information about employee compensation and a detailed overview of the number of people SAP employed, see the Notes to the Consolidated Financial Statements section, Note (7).
employees by Functional area Full-time equivalents
Infrastructure
2,488
General and administration
4,566
software and software- related services
11,261
research and development
17,804
professional services and other services
14,629
sales and marketing
15,824
27,700
15,473
12,592
55,765
26,989
14,783
11,741
53,513
29,757
19,123
15,542
64,422
EMEA region Americas region Asia Pacific Japan region
30,993
19,568
16,011
66,572
25,362
11,974
10,248
47,584
Number of employeesFull-time equivalents
2009 2010 2011 2012 2013
78 Combined Management Report
As our business grows, we maintain the efficiency gains we have made over the past several years. For example, our total corporate car fleet is not consuming more fuel despite the fact that a significant number of company cars has been added, since the average company car has become more fuel-efficient. So, while our car fleet grew by 6%, we had efficiency gains of 6% across the entire fleet. As a result, our total energy consumption remained steady at 13,900 kilowatt hours (kWh) per employee in 2013.
GReenhouSe GAS eMISSIonSOur goal is to reduce the greenhouse gas emissions from our operations to levels of the year 2000 by 2020. This target includes direct and indirect emissions from running our business (Scopes 1 and 2), as well as a limited subset of other indirect (Scope 3) emissions, such as those stemming from business travel. We do not include all of our Scope 3 emissions in our target because we chose to focus first on those emissions over which we have the most control. However, as detailed in the Energy and Emissions II section in the SAP Integrated Report 2013 online, we are increasingly addressing both our upstream and downstream emissions to drive a comprehensive carbon strategy for SAP.
In addition to our long-term goal for 2020, we have set annual targets. In 2013, our total emissions increased to 545 kilotons CO2 (2012: 485 kilotons). As a result, we missed our annual target to reduce our emissions to 460 kilotons. Just as with our increase in energy consumption, our increased emissions reflect the growth of our business. Due to our environmental efforts of the past, however, the overall absolute reduction achieved between the beginning of 2008 and today is 9%. At the same time, the average number of employees increased by almost 26%.
At the same time, we experienced some decrease in efficiency in 2013 as it relates to our emissions. While our overall energy efficiency remained steady, our greenhouse gas emissions increased from 30.0 grams CO2 per euro of total revenue in 2012 to 32.4 grams CO2 per euro in 2013. Our carbon emissions per employee also increased by about 5% in 2013, respectively.
Over the past several years, we have worked to better understand the connections between our energy consumption, its related cost, and the resulting environmental impact. Today we measure and address our energy usage throughout SAP, as well as our greenhouse gas emissions across our entire value chain. Since the beginning of 2008, we calculate that energy efficiency initiatives have contributed to a cumulative cost avoidance of €260 million, compared to a business-as-usual extrapolation.
Moreover, to credibly offer solutions that help our customers better manage their use of resources, we must do so ourselves. By addressing the financial and environmental impact of our energy consumption, we have gained valuable insights to create solutions for our customers.
totAl eneRGy ConSuMeDBecause our energy usage drives our emissions, one of the most important measures we look at is our total energy consumed. This includes all energy that SAP produces or purchases – in other words, the energy whose production causes emissions falling into Scopes 1 and 2 of the Greenhouse Gas Protocol. Our total energy consumption increased to 910 gigawatt hours (GWh) in 2013, compared to 860 GWh in 2012. This increase is due to significant growth in our business. In addition, as software usage shifts to the cloud, we are hosting more of our customers’ systems in our data centers, requiring additional servers and facilities that consume more energy. As we describe in more detail below, we believe that this shift has the opposite effect for our customers, who can save energy through our shared infrastructure.
energy Consumption and Greenhouse Gas emissions
79energy Consumption and Greenhouse Gas emissions

Efficiency, however, has its limits. The demands of growth, as we are discovering, often overtake efficiency gains. Extending the example of cars – we have many more cars on the road today, which more than cancels out the reduction in consumption per car. For this reason, and in addition to our green cloud strategy, we are increasingly focused on another path to sustainable growth – applying technology innovation to transformations in how business is conducted.
In the case of SAP, we are seeking to bring about transformations in a range of areas, from incentivizing behavioral change to supporting innovative approaches to conserving resources. TwoGo by SAP, for instance, is a ride-sharing application that turns the daily commute into an economic, social, and environmental opportunity. We began offering TwoGo by SAP to other companies in 2013, supporting their own efforts to reduce the cost of fuel, parking and business trips, enhance employee networks, change behavior, and reduce emissions. For more information on this innovation, see www.twogo.com.
net poSItIVe IMpACtAs the example of TwoGo by SAP shows, we ultimately aim to help other organizations with their journey toward change. While we are committed to improving our own environmental performance, we believe that we can make a far greater impact by helping our customers reduce their energy use and emissions. We are increasingly focused on facilitating and measuring this “enabler effect,” which our software supports in both direct and indirect ways. A prime example of the former is a transportation application that enables companies to better manage their freight and routes to reduce fuel consumption. Indirectly, our customers can use our analytics to assess their operations and make adjustments that will save energy, reduce emissions, and lower costs. For example, our software can help determine when equipment needs refurbishment or support manufacturers in negotiating better energy rates during peak times. Through the advanced computing power of SAP HANA, we can now help companies make these adjustments in real time, increasing their efficiency even further.
One root cause for this development is our change in business model. As our customers increasingly leverage SAP software in the cloud, our leadership in this market means that systems that previously ran at our customers' sites are increasingly running in SAP data centers. In other words, the emissions that used to be caused by our customers running our software have become SAP's emissions. As a result, our emissions per employee and per euro in revenue increased in 2013.
In 2014, we plan to address these emissions, as well as our overall footprint, by powering all of our data centers and facili-ties with 100% renewable electricity. This shift will effectively eliminate the emissions caused by our customers' systems that have moved into our green cloud. Given the large size of our customers’ footprints and our growth strategy in the cloud, we see significant potential to reduce both our own and our customers’ environmental impact. In 2013 alone, the emissions caused by SAP products in use at our more than 253,500 customers' sites were at least 10 times larger than SAP's own footprint, meaning they caused more than 5,800 ktons of CO2. By using 100% renewable energy, we will dramatically broaden the reach of our sustainability efforts and align them with our cloud strategy. We believe this move will not only help the world run better, but contribute to achieving our 2020 carbon target.
eFFICIenCy VeRSuS tRAnSFoRMAtIonOur results in 2013 point to an increasing challenge faced not only by SAP but also by our customers. Companies typically increase their resource consumption when they grow. Under traditional business models, they continuously create and sell more goods or services. For this reason, many companies have focused on increasing their efficiency – a prime example is the far better fuel efficiency of passenger cars today compared to decades ago.
80 Combined Management Report
Based on a study from Global e-Sustainability Initiative (GeSI SMARTer2020) assessing the potential effect for the information and communications technology (ICT) industry overall as well as our own estimates, we believe that our solutions contribute to an avoidance of emissions that eclipses the footprint of our entire value chain, including our down-stream emissions (use of our software at customers’ sites). Putting such estimates in tangible terms, the total emissions generated by ICT are expected to reach 1.3 gigatons (Gt) of carbon by 2020. By contrast, ICT has the potential to abate 9.1 Gt CO2 in that same time period. Similarly, we estimate that SAP’s downstream emissions will reach 0.0091 Gt CO2 by 2020. Global emissions, on the other hand, are expected to reach 55 Gt CO2 by that time – offering enormous potential for ICT as a whole and for SAP to enable reductions.
We will continue developing methodology to estimate this impact so that we can direct our strategy and resources to those areas where we can create the greatest long-term impact.
81energy Consumption and Greenhouse Gas emissions
Bookings/billings revenue: For our cloud activities we look at the recognized revenue as well as the contract value generated in a given period (bookings/billings). We measure bookings/billings as the amounts that we are contractually entitled to invoice the customers over the shorter of the contract term and the first 12 months following the contract execution date, anniversary of contract execution date, or contract renewal date (12 months’ bookings/billings). We evaluate bookings/ billings both at actual currency and at constant currency. In contrast to the cloud subscription and support revenue recognized over the period of providing the cloud service rather than in the period of contract closure, the bookings/billings numbers give insight into the future revenue potential. When evaluating 12 months’ bookings/billings numbers, we consider both the total bookings/billings and the subset of bookings/billings that results from new customers or additional sales to existing customers in the reporting period rather than from subsequent years or renewals of existing contracts. There is no comparable IFRS measure for this figure.
Non-IFRS operating profit/non-IFRS operating margin: In 2013, we used non-IFRS operating profit/non-IFRS operating margin and constant currency non-IFRS operating profit/ non-IFRS operating margin to measure our overall operational process efficiency and overall business performance. Non-IFRS operating margin is the ratio of our non-IFRS operating profit to total non-IFRS revenue, expressed as a percentage. See below for more information on the IFRS and non-IFRS measures we use.
We use various performance measures to help manage our performance with regard to our primary financial goals, which are revenue and margin, and our primary non-financial goals, which are customer loyalty and employee engagement. We view revenue and margin as indicators for our current performance, while customer loyalty and employee engagement are indicators for our future performance.
MeASuReS We uSe to MAnAGe ouR FInAnCIAl peRFoRMAnCe
Measures We use to Manage our operating Financial performanceIn 2013, we used the following key measures to manage our operating financial performance:
Non-IFrs software and cloud subscriptions: Our key revenue drivers, software and cloud subscriptions, include software plus cloud subscription and support revenue. The principal source of our software revenue is the fees customers pay for on-premise software licenses resulting in software being installed on the customer’s hardware. We generate cloud subscription and support revenue when we provide software and the respective support for delivery in the cloud. We evaluate software and cloud subscriptions both at actual currency and at constant currency. Non-IFRS software and software-related service (SSRS) revenue: We use non-IFRS SSRS revenue and constant currency non-IFRS SSRS revenue to measure our revenue growth. Our SSRS revenue includes software and related support revenue plus cloud subscription and support revenue. Software revenue and cloud subscription and support revenue are our key revenue drivers because they tend to affect our other revenue streams. Generally, customers who buy software licenses also enter into maintenance contracts, and these generate recurring software-related service revenue in the form of support revenue after the software sale. Maintenance contracts cover support services and software updates and enhancements. Software revenue as well as cloud subscription and support revenue also tend to stimulate service revenue from consulting and training sales.
Internal Management system
82 Combined Management Report
Operating, investing, and financing cash flows: Our consolidated statement of cash flows provides insight as to how we generated and used cash and cash equivalents. When used in conjunction with the other primary financial statements, it provides information that helps us evaluate the changes of our net assets, our financial structure (including our liquidity and solvency), and our ability to affect the amounts and timing of cash flows in order to adapt to changing circumstances and opportunities.
MeASuReS We uSe to MAnAGe ouR non-FInAnCIAl peRFoRMAnCeIn 2013, we used the following key measures to manage our non-financial performance in the areas of employee engagement and customer loyalty:
employee engagement Index: We use the employee engagement index to measure motivation and loyalty of our employees, how proud they are of our company, and how strongly they identify with SAP. The index is derived from surveys conducted among our employees. With this measure, we recognize that we can achieve our growth strategy with engaged employees only.
Measures We use to Manage our non-operating Financial performanceWe use the following measures to manage our non-operating financial performance:
Financial income, net: This measure provides insight especially into the return on liquid assets and capital investments and the cost of borrowed funds. To manage our financial income, net, we focus on cash flow, the composition of our liquid asset and capital investment portfolio, and the average rate of interest at which assets are invested. We also monitor average outstanding borrowings and the associated finance costs.
Days’ Sales Outstanding (DSO) and Days’ Payables Out-standing (DPO): We manage working capital by controlling the days’ sales outstanding for operating receivables, or DSO (defined as average number of days from the raised invoice to cash receipt from the customer), and the days’ payables outstanding for operating liabilities, or DPO (defined as average number of days from the received invoice to cash payment to the vendor).
Measures We use to Manage overall Financial performanceWe use the following measures to manage our overall financial performance:
Earnings per share (EPS): EPS measures our overall performance because it captures all operating and non-operating elements of profit as well as income tax expense. It repre-sents the portion of profit after tax allocable to each SAP share outstanding (using the weighted average number of shares outstanding over the reporting period). EPS is influenced not only by our operating and non-operating business, and income taxes but also by the number of shares outstanding. We are authorized by our shareholders to repurchase shares and believe that such repurchases, additional to dividend distributions, are a good means to return value to our shareholders.
Effective tax rate: We define our effective tax rate as the ratio of income tax expense to profit before tax, expressed as a percentage.
83Internal Management system

annual plans, we determine the budget for the respective year. We also have processes in place to forecast revenue and profit on a quarterly basis, to quantify whether we expect to realize our strategic goals, and to identify any deviations from plan. We continuously monitor the concerned units in the Group to analyze these developments and define any appropriate actions.
Our entire network of planning, control, and reporting pro-cesses is implemented in integrated planning and information systems, based on SAP software, across all organizational units so that we can conduct the evaluations and analyses needed to make informed decisions.
non-IFRS FInAnCIAl MeASuReS CIteD In thIS RepoRt As in previous years, we provided our 2013 financial outlook on the basis of certain non-IFRS measures. Therefore, this report contains a non-IFRS based comparison of our actual performance in 2013 against our outlook in the Report on Economic Position section.
Reconciliations of IFRS to non-IFRS Financial Measures for 2013 and 2012The following table reconciles our IFRS financial measures to the respective and most comparable non-IFRS financial measures of this report for each of 2013 and 2012. Due to rounding, the sum of the numbers presented in this table might not precisely equal the totals we provide.
Net Promoter Score (NPS): This score measures the willing-ness of our customers to recommend or promote SAP to others. It is derived from our customer survey. Conducted each year, this survey identifies whether a customer is loyal and likely to recommend SAP to friends or colleagues, is neutral, or is unhappy. We introduced this measure in 2012, as we are convinced that we can achieve our financial goals only when our customers are loyal to, and satisfied with, SAP and our solutions. To derive the NPS, we start with the percentage of “promoters” of SAP – those who give us a score of 9 or 10 on a scale of 0 to 10. We then subtract the percentage of “detractors” – those who give us a score of 0 to 6. The methodology calls for ignoring “passives,” who give us a score of 7 or 8.
VAlue-BASeD MAnAGeMentOur holistic view of the performance measures described above, together with our associated analyses, comprises the information we use for value-based management. We use planning and control processes to manage the compilation of these key measures and their availability to our decision makers across various management levels.
SAP’s long-term strategic plans are the point of reference for our other planning and controlling processes, including a multiyear plan through 2017. We identify future growth and profitability drivers at a highly aggregated level. This process is intended to identify the best areas in which to target sustained investment. Next, we evaluate our multiyear plans for our support and development functions and break down the customer-facing plans by sales region. Based on our detailed
84 Combined Management Report
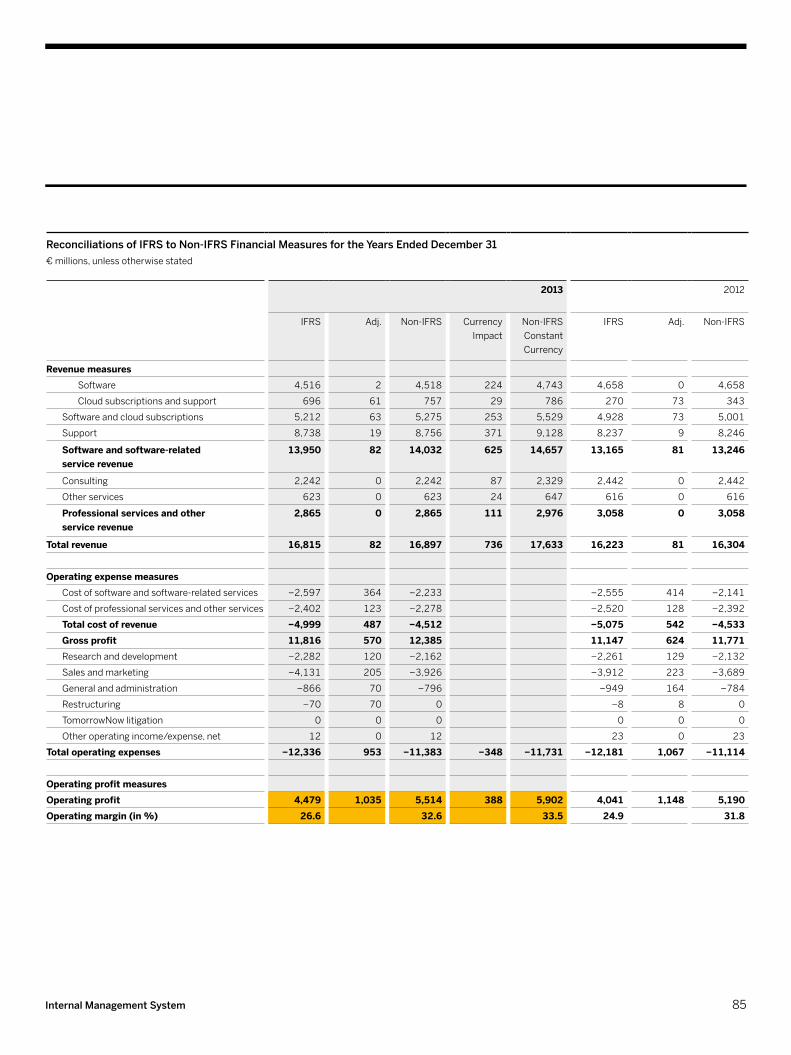
reconciliations of IFrs to Non-IFrs Financial Measures for the Years ended december 31€ millions, unless otherwise stated
2013 2012
IFRS Adj. Non-IFRS CurrencyImpact
Non-IFRSConstant Currency
IFRS Adj. Non-IFRS
Revenue measuresSoftware 4,516 2 4,518 224 4,743 4,658 0 4,658
Cloud subscriptions and support 696 61 757 29 786 270 73 343
Software and cloud subscriptions 5,212 63 5,275 253 5,529 4,928 73 5,001
Support 8,738 19 8,756 371 9,128 8,237 9 8,246
Software and software-related service revenue
13,950 82 14,032 625 14,657 13,165 81 13,246
Consulting 2,242 0 2,242 87 2,329 2,442 0 2,442
Other services 623 0 623 24 647 616 0 616
professional services and other service revenue
2,865 0 2,865 111 2,976 3,058 0 3,058
total revenue 16,815 82 16,897 736 17,633 16,223 81 16,304
operating expense measuresCost of software and software-related services −2,597 364 −2,233 −2,555 414 −2,141
Cost of professional services and other services −2,402 123 −2,278 −2,520 128 −2,392
total cost of revenue −4,999 487 −4,512 −5,075 542 −4,533Gross profit 11,816 570 12,385 11,147 624 11,771Research and development −2,282 120 −2,162 −2,261 129 −2,132
Sales and marketing −4,131 205 −3,926 −3,912 223 −3,689
General and administration −866 70 −796 −949 164 −784
Restructuring −70 70 0 −8 8 0
TomorrowNow litigation 0 0 0 0 0 0
Other operating income/expense, net 12 0 12 23 0 23
total operating expenses −12,336 953 −11,383 −348 −11,731 −12,181 1,067 −11,114
operating profit measuresoperating profit 4,479 1,035 5,514 388 5,902 4,041 1,148 5,190operating margin (in %) 26.6 32.6 33.5 24.9 31.8
85Internal Management system
Our non-IFRS financial measures reflect adjustments based on the items below, as well as adjustments for the related income tax effects.
Non-IFRS RevenueRevenue items identified as non-IFRS revenue have been adjusted from the respective IFRS financial measures by including the full amount of support revenue, cloud subscriptions revenue, and other similarly recurring revenues that we are not permitted to record as revenue under IFRS due to fair value accounting for the contracts in effect at the time of the respective acquisitions.
Under IFRS, we record at fair value the contracts in effect at the time entities were acquired. Consequently, our IFRS support revenue, our IFRS cloud subscriptions and support revenue, our IFRS software and cloud subscription revenue, our IFRS software and software-related service revenue, and our IFRS total revenue for periods subsequent to acquisitions do not reflect the full amount of revenue that would have been recorded by entities acquired by SAP had they remained stand-alone entities. Adjusting revenue numbers for this revenue impact provides additional insight into the comparability across periods of our ongoing performance.
We also report our non-IFRS deferred cloud subscription and support revenue to provide additional insight into amounts that are contracted for and invoiced and that are expected to be recognized in cloud subscription and support revenue in the future. To align the reporting of this non-IFRS deferred revenue number, we adjust this number, like our non-IFRS revenue numbers, for the effect of fair value accounting for the contracts in effect at the time of the respective acquisitions.
Non-IFRS Operating ExpenseOperating expense figures that are identified as non-IFRS operating expenses have been adjusted by excluding the following expenses: – Acquisition-related charges
Amortization expense/impairment charges of intangibles acquired in business combinations and certain stand-alone acquisitions of intellectual property (including purchased in-process research and development) Settlements of pre-existing business relationships in connection with a business combination
explanation of non-IFRS MeasuresWe disclose certain financial measures, such as non-IFRS revenue, non-IFRS operating expenses, non-IFRS operating profit, non-IFRS operating margin, non-IFRS earnings per share, constant currency revenue, and operating profit measures that are not prepared in accordance with IFRS and are therefore considered non-IFRS financial measures. Our non-IFRS financial measures may not correspond to non-IFRS financial measures that other companies report. The non-IFRS financial measures that we report should only be considered in addition to, and not as substitutes for or superior to, revenue, operating expenses, operating profit, operating margin, earnings per share, or other measures of financial performance prepared in accordance with IFRS.
We believe that the disclosed supplemental historical and prospective non-IFRS financial information provides useful information to investors because management uses this infor-mation, in addition to financial data prepared in accordance with IFRS, to attain a more transparent understanding of our past performance and our anticipated future results. In 2013, we used these non-IFRS measures consistently in our internal planning and forecasting, reporting and compensation, as well as in our external communications as follows:– Our management primarily uses these non-IFRS measures
rather than IFRS measures as the basis for making financial, strategic and operating decisions.
– The variable remuneration components of our Executive Board members and employees are based on non-IFRS revenue and non-IFRS operating profit measures rather than the respective IFRS measures.
– The annual budgeting process for all management units is based on non-IFRS revenue and non-IFRS operating profit numbers rather than the respective IFRS financial measures.
– All forecast and performance reviews with all senior managers globally are based on these non-IFRS measures, rather than the respective IFRS financial measures.
– Both our internal performance targets and the guidance we provided to the capital markets are based on non-IFRS revenues and non-IFRS profit measures rather than the respective IFRS financial measures.
86 Combined Management Report
Additionally, we believe that our adjustments to our IFRS finan-cial measures for the results of our discontinued TomorrowNow activities are useful to investors for the following reason:– TomorrowNow activities were discontinued and we will thus
continue to exclude potential future TomorrowNow results, which are expected to mainly comprise expenses in connection with the TomorrowNow litigation, from our internal management reporting, planning, forecasting, and compensation plans. Therefore, adjusting our non-IFRS measures for the results of the discontinued TomorrowNow activities provides insight into the financial measures that SAP uses internally.
We include the revenue adjustments outlined above and exclude the expense adjustments outlined above when making decisions to allocate resources, both on a company level and at lower levels of the organization. In addition, we use these non-IFRS measures to gain a better understanding of SAP’s operating performance from period to period.
We believe that our non-IFRS financial measures described above have limitations, including but not limited to, the following: – The eliminated amounts could be material to us.– Without being analyzed in conjunction with the corresponding
IFRS measures, the non-IFRS measures are not indicative of our present and future performance, foremost for the following reasons: While our non-IFRS profit numbers reflect the elimination of certain acquisition-related expenses, no eliminations are made for the additional revenue and other revenue that result from the acquisitions. While we adjust for the fair value accounting of the acquired entities’ recurring revenue contracts, we do not adjust for the fair value accounting of deferred compensation items that result from commissions paid to the acquired company’s salesforce and third parties for closing the respective customer contracts. The acquisition-related charges that we eliminate in deriving our non-IFRS profit numbers are likely to recur should SAP enter into material business combinations in the future.
Acquisition-related third-party expenses– Discontinued activities: Results of discontinued operations
that qualify as such under IFRS in all respects except that they do not represent a major line of business
– Expenses from our share-based payments– Restructuring expenses
Non-IFRS Operating Profit, Non-IFRS Operating Margin, and Non-IFRS Earnings per ShareOperating profit, operating margin, and earnings per share identified as non-IFRS operating profit, non-IFRS operating margin, and non-IFRS earnings per share have been adjusted from the respective IFRS measures by adjusting for the above-mentioned non-IFRS revenue and non-IFRS operating expenses.
We exclude certain acquisition-related expenses for the purpose of calculating non-IFRS operating profit, non-IFRS operating margin, and non-IFRS earnings per share when evaluating SAP’s continuing operational performance because these expenses generally cannot be changed or influenced by management after the relevant acquisition other than by disposing of the acquired assets. Since management at levels below the Executive Board does not influence these expenses, we generally do not consider these expenses for the purpose of evaluating the performance of management units. Additionally, these non-IFRS measures have been adjusted from the respective IFRS measures for the results of the discontinued activities, share-based payment expenses, and restructuring expenses.
Usefulness of Non-IFRS MeasuresWe believe that our non-IFRS measures are useful to investors for the following reasons:– The non-IFRS measures provide investors with insight into
management’s decision making because management uses these non-IFRS measures to run our business and make financial, strategic, and operating decisions.
– The non-IFRS measures provide investors with additional information that enables a comparison of year-over-year operating performance by eliminating certain direct effects of acquisitions and discontinued activities.
– Non-IFRS and non-GAAP measures are widely used in the software industry. In many cases, inclusion of our non-IFRS measures may facilitate comparison with our competitors’ corresponding non-IFRS and non-GAAP measures.
87Internal Management system
Despite these limitations, we believe that the presentation of the non-IFRS measures and the corresponding IFRS measures, together with the relevant reconciliations, provides useful information to management and investors regarding present and future business trends relating to our financial condition and results of operations. We do not evaluate our growth and performance without considering both non-IFRS measures and the comparable IFRS measures. We caution the readers of our financial reports to follow a similar approach by considering our non-IFRS measures only in addition to, and not as a substitute for or superior to, revenue or other measures of our financial performance prepared in accordance with IFRS.
Constant Currency Information We believe it is important for investors to have information that provides insight into our sales. Revenue measures deter-mined under IFRS provide information that is useful in this regard. However, both sales volume and currency effects impact period-over-period changes in sales revenue. We do not sell standardized units of products and services, so we cannot provide relevant information on sales volume by providing data on the changes in product and service units sold. To provide additional information that may be useful to investors in breaking down and evaluating changes in sales volume, we present information about our revenue and various values and components relating to operating profit that are adjusted for foreign currency effects. We calculate constant currency revenue and operating profit measures by translating foreign currencies using the average exchange rates from the previous year instead of the current year.
The acquisition-related amortization expense that we elimi-nate in deriving our non-IFRS profit numbers is a recurring expense that will impact our financial performance in future years. The revenue adjustment for the fair value accounting of the acquired entities’ contracts and the expense adjustment for acquisition-related charges do not arise from a common conceptual basis. This is because the revenue adjustment aims to improve the comparability of the initial post-acquisition period with future post-acquisition periods, while the expense adjustment aims to improve the comparability between post-acquisition periods and pre-acquisition periods. This should particularly be considered when evaluating our non-IFRS operating profit and non-IFRS operating margin numbers as these combine our non-IFRS revenue and non-IFRS expenses despite the absence of a common conceptual basis. Our discontinued activities and restructuring charges could result in significant cash outflows. The same applies to our share-based payment expense because most of our share-based payments are to be settled in cash rather than shares.
The valuation of our cash-settled, share-based payments could vary significantly from period to period due to the fluctuation of our share price and other parameters used in the valuation of these plans. In the past we have issued share-based payment awards to our employees every year and we intend to continue doing so in the future. Thus, our share-based payment expenses are recurring although the amounts usually change from period to period.
88 Combined Management Report
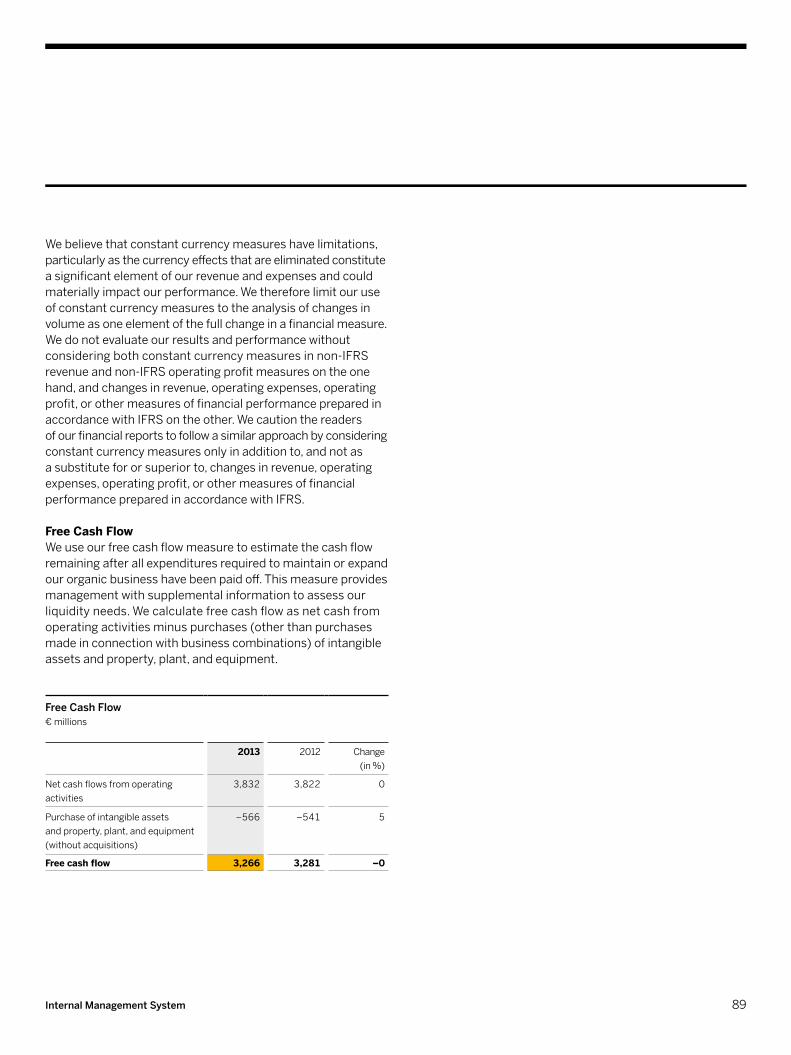
We believe that constant currency measures have limitations, particularly as the currency effects that are eliminated constitute a significant element of our revenue and expenses and could materially impact our performance. We therefore limit our use of constant currency measures to the analysis of changes in volume as one element of the full change in a financial measure. We do not evaluate our results and performance without considering both constant currency measures in non-IFRS revenue and non-IFRS operating profit measures on the one hand, and changes in revenue, operating expenses, operating profit, or other measures of financial performance prepared in accordance with IFRS on the other. We caution the readers of our financial reports to follow a similar approach by considering constant currency measures only in addition to, and not as a substitute for or superior to, changes in revenue, operating expenses, operating profit, or other measures of financial performance prepared in accordance with IFRS.
Free Cash FlowWe use our free cash flow measure to estimate the cash flow remaining after all expenditures required to maintain or expand our organic business have been paid off. This measure provides management with supplemental information to assess our liquidity needs. We calculate free cash flow as net cash from operating activities minus purchases (other than purchases made in connection with business combinations) of intangible assets and property, plant, and equipment.
Free Cash Flow€ millions
2013 2012 Change (in %)
Net cash flows from operating activities
3,832 3,822 0
Purchase of intangible assets and property, plant, and equipment (without acquisitions)
−566
–541
5
Free cash flow 3,266 3,281 –0
89Internal Management system
The contrary development of the industrialized and emerging economies was particularly noticeable in the Asia Pacific Japan (APJ) region, according to the ECB. Japan, with its expansive financial and monetary policy, turned to positive GDP growth rates and achieved growth of 2%. Only in the third quarter was there a slight dip, caused by weaker exports. Most emerging economies in Asia performed clearly more subdued than in recent years, the ECB reports. In China, for instance, only the third quarter saw a slight acceleration in growth (to 7.8% year over year) after a modest stimulus package.
the It MARketWorldwide IT investment growth was higher than overall global economic growth throughout 2013, U.S. market research firm International Data Corporation (IDC) reports. However, that growth slowed during the course of the year. For this reason IDC corrected its projections downward more than once. The main reason for this was slower growth in the emerging economies such as in China and Russia. For that reason the emerging economies did not grow as quickly as IDC had expected at the beginning of the year.
In 2013, the global IT market expanded by a percentage in the middle of the single-digit range, which was slightly less than in the prior year. Leading the way was the mobile devices seg-ment, with growth well into the double-digit range. In fact, IDC revised its forecast for the mobile device segment upward several times in the course of the year. The software segment also outperformed the overall IT market, IDC reports. The PC segment was sluggish the entire year, especially in the emerging economies, where economic growth flagged. Global spending on servers and data storage devices contracted. In contrast, IDC reports that the global market for IT services expanded by a percentage in the low single digits.
GloBAl eConoMIC tRenDSIn its most recent monthly report, the European Central Bank (ECB1)) concludes that the global economy has remained fairly weak in 2013, especially in the first half of the year. That is consistent with the view of the International Monetary Fund (IMF), stating that in 2013 gross domestic product (GDP) across the world grew 3% year over year.
The experts also note regional divergence: According to the ECB, growth shifted to the industrialized economies and became established there. In contrast, growth in most of the major emerging economies slowed. Weaker domestic demand, limited scope for government stimulus programs, and tougher financing conditions are the reasons cited by the ECB. Additionally, commodity-exporting countries suffered from the sluggish demand on the international commodity markets.
The economy of the Europe, Middle East, and Africa (EMEA) region was weak in 2013. Annual GDP in the euro area declined 0.4% year over year, according to the numbers published by the ECB. The ECB reports that weak domestic and export demand slowed down economic activity in the larger Central and Eastern European countries and Russia, although it perceived a more encouraging trend toward the end of the year. In comparison, the Middle East and Africa merely experienced a slight deceleration of growth. However, political instability severely hindered economic growth in some countries in the region, notably Iraq and Libya.
In the global context, the economy of the Americas region proved relatively robust, the ECB notes. Despite tax increases and government spending cuts that came into force in March, year-over-year annual growth in the United States was just short of 2% compared to 2012. Growth was faster in the second half of the year than in the first as conditions on the residential real estate and labor markets improved, consumer spending rose, and exports increased. The ECB reports continuing recovery in Latin America, at only a slightly reduced pace.
economy and the Market
1) Unless otherwise indicated, all economic information in this section is based on information from the European Central Bank (ECB).
90 Combined Management Report
SAP was highly successful in the EMEA region. With double-digit growth in revenue from software and cloud subscriptions, we again increased our market share. Alongside double-digit percentage growth in our home market, Germany, we performed remarkably well in France, Russia, the Middle East, and Africa, achieving high double-digit software revenue growth.
Likewise, our Americas region outperformed the overall economy and the IT market. The double-digit increase in revenue from software and cloud subscriptions in 2013 were mainly driven by a substantial – triple-digit – rise in cloud subscription revenue in North America and very strong core business in Latin America.
In the APJ region, the economic environment was very weak at the beginning of the year, and SAP's revenue suffered during this time as a result. However, the regional economy turned around toward the end of the year, reflected in double-digit growth for our software and cloud subscription revenue in the fourth quarter – a commendable result in the competitive context. This helped return SAP to modest single-digit revenue growth for the full year in the APJ region.
The emerging economies, with high double-digit growth, are important growth markets for SAP. Key among them are China as well as the Middle East, Russia, and Brazil, where we achieved strong double-digit software and cloud subscription revenue growth rates.
Overall, in 2013 we demonstrated an aptitude for global growth that few other companies in the IT industry can match.
In the EMEA region, the Western European market for IT recorded low but stable growth and has now, in IDC's view, survived the crisis. In Russia the economic development was completely different, according to the IDC. Over the year, it revised its forecast for growth in the Russian IT market downward by several percentage points in light of the weak Russian economy.
In the Americas region, the IT market followed the relatively robust expansion of the global economy. Although the economic policy situation was at times volatile in the United States, the U.S. IT market largely met expectations. IT investment grew by a percentage in the middle single-digit range year over year. The IT market also proved resilient in Latin America, including Brazil, and even recorded double- digit growth.
In the APJ region, the IT market reflected trends in the overall economy. Notably, the IT market in Japan performed better than IDC had originally expected. At the beginning of the year, IDC forecasted a contraction, but in fact over the full year IT investment increased slightly. On the other hand, IT spending in China grew more slowly than IDC had originally expected. Full-year growth was well below the double-digit percentages of recent years.
IMpACt on SApSAP business was only slightly affected by the relatively weak growth in 2013 – especially in the first half of the year – in the overall global economy and in the IT industry: Despite a slower than expected start to the year, in 2013 our growth surpassed that of the global economy and of the IT industry.
We owe this success first and foremost to our greater focus on innovation strategy and with it our investment in three new fields of business: mobile solutions, in-memory computing with SAP HANA, and cloud solutions. The heightened pace of innovation at SAP and the rapid and successful integration of the companies we acquired, have been the decisive factors in our achieving double-digit constant currency growth in non-IFRS software and software-related services revenue.
91economy and the Market

Actual performance in 2013 Compared to Guidance (non-IFRS)We achieved or exceeded the amended outlook guidance for revenue and operating profit we published in July.
Comparison of Forecast and results for 2013
Forecast for 2013 Results for 2013
Software and software-related service revenue (non-IFRS, at constant currencies)1)
at least +10%
+11%
Cloud subscription and support revenue (non-IFRS, at constant currencies)
around € 750 million
€786 million
Operating profit (non-IFRS, at constant currencies)
€5.85 billion to €5.95 billion
€5.90 billion
Effective tax rate (IFRS)1) 24.0% to 25.0% 24.4%
Effective tax rate (non-IFRS)1) 25.5% to 26.5% 25.9%
SAP HANA software revenue (non-IFRS)
€650 million to €700 million
€633 million (at actual
currencies) €664 million (at constant currencies)
1) Revised forecast (July 2013).
peRFoRMAnCe AGAInSt outlook FoR 2013 (non-IFRS)Our 2013 operating profit-related internal management goals and published outlook were based on our non-IFRS financial measures. For this reason, in this section we discuss performance against our outlook referring solely to these non-IFRS financial measures. All discussion in the Operating Results (IFRS) section, however, is in terms of measures in accordance with International Financial Reporting Standards as issued by the International Accounting Standards Board (IASB), and the numbers in that section are not explicitly identified as IFRS measures.
Guidance for 2013 (non-IFRS)At the beginning of 2013, we have given the guidance that our software and software-related service revenue (non-IFRS) for 2013 would increase by between 11% and 13% at constant currencies (2012: €13,246 million). For cloud subscription and support revenue (non-IFRS) we forecasted an increase to €750 million (2012: €342 million) at constant currencies. For SAP HANA, we estimated a software revenue of €650 million to €750 million. We expected our full-year operating profit (non-IFRS) for 2013 to be between €5.85 billion and €5.95 billion (2012: €5.21 billion) at constant currencies. We anticipated an effective tax rate (IFRS) of between 25.5% and 26.5% (2012: 26.2%) and an effective tax rate (non-IFRS) of between 27.0% and 28.0% (2012: 27.5%).
In April, we confirmed the guidance for 2013 that we had published in January 2013. In July 2013, we amended our forecast for revenue growth:
Although the difficult macroeconomic environment, in particular in the Asia Pacific Japan region, and the rapid transition to the cloud have resulted in lower software revenue expectations, we remained committed to double-digit growth with at least 10% growth in non-IFRS software and software-related service revenue at constant currencies in full year 2013 (2012: €13,246 million). We confirmed our predictions for cloud subscription and support revenue and for operating profit, while we adjusted the anticipated effective tax rate to between 24.0% and 25.0% (IFRS) and to between 25.5% and 26.5% (non-IFRS).
report on economic position
92 Combined Management Report

In 2013, we achieved operating profit (non-IFRS) of €5,902 million at constant currencies. Thus, operating profit (non-IFRS) at constant currencies was in the middle of the range that SAP had projected (€5.85 billion to €5.95 billion). Despite again investing significantly in innovation, we were able to increase our operating profit by successfully scaling our cloud business and maintaining operational discipline.
We achieved an effective tax rate (IFRS) of 24.4% and an effective tax rate (non-IFRS) of 25.9%, which is within the updated range of 24.0% to 25.0% (IFRS) and 25.5% to 26.5% (non-IFRS) we announced in July 2013.
opeRAtInG ReSultS (IFRS)This section on operating results (IFRS) discusses results only in terms of IFRS measures, so the IFRS numbers are not expressly identified as such.
We acquired hybris in August 2013, so hybris results are incorporated in our results only for the months August to December. We acquired SuccessFactors in February 2012, so SuccessFactors results are incorporated in our 2012 results only for the months February to December. Similarly, because we acquired Ariba in October 2012, Ariba results are incorporated in our 2012 results only for the months October to December.
Despite ongoing economic uncertainty throughout 2013, our new and existing customers continued to show a strong willingness to invest in our solutions.
At constant currencies, cloud subscription and support revenue (non-IFRS) grew from €343 million in 2012 to €786 million in 2013, an increase of 129% before elimination of effects relating to the fact that Ariba and SuccessFactors numbers are included only for part of 2012 because they were acquired in the course of that year. Of the 129% growth, those effects account for 97 percentage points. Our software and software-related services revenue grew 11% at constant currencies to €14,657 million (2012: €13,246 million).
The Europe, Middle East, and Africa (EMEA) region recorded strong single-digit growth in software and cloud subscription revenue at constant currencies. The Americas region, while rapidly shifting to the cloud, achieved very strong growth of 15% in software and cloud subscriptions at constant currencies. After ending the year with a strong fourth quarter, in 2013 the Asia Pacific Japan (APJ) region achieved a 3% constant- currency increase in full-year revenue from software and cloud subscriptions. As a result, in 2013 SAP’s full-year software and cloud subscription revenue increased 6% (11% at constant currencies) to €5,275 million. The acquisitions of Success-Factors, Ariba, and hybris contributed 2.8 percentage points to the growth in software and software-related service revenue at constant currencies.
At the beginning of 2013, we forecasted low single-digit percentage growth in professional services and other service revenue and significant increase in total revenue for the year. Although in the event our professional services and other service revenue (non-IFRS) actually decreased by 3% at constant currencies, the strong growth we achieved in software and software-related service revenue (non-IFRS) helped us attain the overall guidance: Total revenue (non-IFRS) increased 8% at constant currencies to €17,633 million (2012: €16,304 million). Our 2013 outlook guidance for SAP HANA software revenue was €650 million to €700 million (2012: €392 million). Because of adverse currency effects, the revenue we achieved was €633 million (€664 million at constant currencies).
93report on economic position

For more information about the breakdown of total revenue by region and industry, see the Revenue by Region and Industry section below.
Software and Software-Related Service RevenueSoftware revenue results from the fees earned from the sale or license of software to customers. Revenue from cloud subscriptions and support refers to the income earned from contracts that permit the customer to access specific software solutions hosted by SAP during the term of its contract with SAP. Support revenue represents fees earned from providing customers with technical support services and unspecified software upgrades, updates, and enhancements.
In 2013, software and software-related service revenue grew from €13,165 million in 2012 to €13,950 million, representing an increase of 6%. This software and software-related service revenue growth reflects an 11% increase from changes in volumes and prices and a 5% decrease from currency effects.
Revenue
Total RevenueTotal revenue increased from €16,223 million in 2012 to €16,815 million in 2013, representing an increase of €592 million, or 4%. This growth reflects an 8% increase from changes in volumes and prices and a 5% decrease from currency effects. The growing revenue result primarily from a €426 million increase in cloud subscription and support revenue and a €501 million rise in support revenue. Consulting revenue declined by €200 million and software revenue by €142 million. Software and software-related service revenue climbed to €13,950 million in 2013, an increase of 6%. Software and software-related service revenue represented 83% of total revenue in 2013 (2012: 81%). In 2013, consulting and other service revenue contributed €2,865 million to our total revenue, representing a drop of 6% compared to 2012.
EMEA region Americas region Asia Pacific Japan region
1,377
890
457
2,725
1,555
1,300
554
3,410
1,851
1,534
722
4,107
2,041
1,733
884
4,658
2,116
1,586
814
4,516
Software Revenue by Region (based on customer location)€ millions
2009 2010 2011 2012 2013
EMEA region Americas region Asia Pacific Japan region
5,643
3,620
1,409
10,672
6,263
4,435
1,766
12,464
6,991
5,091
2,151
14,233
7,486
6,100
2,637
16,223
7,885
6,366
2,563
16,815
Total Revenue by Region (based on customer location)€ millions
2009 2010 2011 2012 2013
94 Combined Management Report

Cloud subscription and support revenue increased from €270 million in 2012 to €696 million in 2013. This increase is largely due to the acquisition of Ariba on October 1, 2012, and to continuing strong growth at SuccessFactors and Ariba in 2013.
Our customer base continued to expand in 2013. Based on the number of contracts concluded, 16% of the orders we received for software in 2013 were from new customers (2012: 19%). The total value of software orders received fell 7% year over year. The total number of contracts signed for new software decreased 6% to 55,909 (2012: 59,289 contracts), while the average order value decreased by 1%.
Our stable customer base, continued investment in software by new and existing customers throughout 2013 and the previous year, and the continued success of our premium support offerings resulted in an increase in support revenue from €8,237 million in 2012 to €8,738 million in 2013. The SAP Enterprise Support services offering was the largest contributor to our
Revenue from software and cloud subscriptions rose from €4,928 million in 2012 to €5,212 million in 2013, representing an increase of €284 million, or 6%. This growth consists of an 11% increase from changes in volumes and prices and a 5% decrease from currency effects.
A combination of a challenging macroeconomic environment in key markets and the accelerating industry shift to the cloud resulted in a 2% increase from changes in volumes and prices. There was also a 5% decrease from currency effects. Overall, software revenue declined €142 million or 3% from €4,658 million in 2012 to €4,516 million in 2013. In 2013, SAP HANA contributed €633 million to total software revenue.
EMEA region Americas region Asia Pacific Japan region
1,383
893
459
2,735
1,565
1,304
555
3,424
1,864
1,540
722
4,125 4,928
2,107
1,920
901
5,212
2,233
2,130
849
software and Cloud subscription revenue by region (based on customer location)€ millions
2009 2010 2011 2012 2013
EMEA region Americas region Asia Pacific Japan region
4,336
2,718
1,144
8,198
4,883
3,427
1,484
9,794
5,529
3,958
1,832
11,319
6,106
4,820
2,239
13,165
6,549
5,196
2,204
13,950
software and software-related service revenue by region (based on customer location)€ millions
2009 2010 2011 2012 2013
95report on economic position
Revenue by Region and Industry
Revenue by RegionWe break our operations down into three regions: the Europe, Middle East, and Africa (EMEA) region, the Americas region, and the Asia Pacific Japan (APJ) region. We allocate revenue amounts to each region based on where the customer is located. For more information about revenue by geographic region, see the Notes to the Consolidated Financial Statements section, Note (28).
eMeA RegionIn 2013, the EMEA region generated €7,885 million in revenue, which was 47% of total revenue (2012: €7,486; 46%). This represents a year-over-year increase of 5%. Total revenue in Germany increased 5% to €2,505 million in 2013 (2012: €2,380 million). Germany contributed 32% (2012: 32%) of all EMEA region revenue. The remaining revenue in the EMEA region was primarily generated in the United Kingdom, France, Switzerland, the Netherlands, Russia, and Italy. Software and software-related service revenue generated in the EMEA region in 2013 totaled €6,549 million (2012: €6,106 million). Software and software-related service revenue represented 83% of total revenue in 2013 (2012: 82%). Software and cloud subscription revenue rose by 6% to €2,233 million in 2013 (2012: €2,107 million). This growth reflects an 8% increase from changes in volumes and prices and a 2% decrease from currency effects.
Americas RegionIn 2013, 38% of our total revenue was generated in the Americas region (2012: 38%). Total revenue in the Americas region increased 4% to €6,366 million; revenue generated in the United States increased 4% to €4,661 million. This growth reflects an 8% increase from changes in volumes and prices and a 4% decrease from currency effects. The United States contributed 73 % (2012: 73%) of all revenue generated in the Americas region. In the remaining countries of the Americas region, revenue climbed 4% to reach €1,705 million. This growth
support revenue. The €501 million, or 6%, growth in support revenue reflects an 11% increase from changes in volumes and prices and a 5% decrease from currency effects. This growth is primarily attributable to SAP Product Support for Large Enterprises, SAP Enterprise Support, and our premium offerings. Accordingly, the acceptance rate for SAP Enterprise Support among new customers rose from 96% in 2012 to 98% in 2013.
Professional Services and Other Service RevenueProfessional services and other service revenue consists primarily of consulting and other service revenue. We generate most of our consulting revenue from the implementation of our software products. Other service revenue consists mainly of revenue from the messaging services acquired from Sybase and of training revenue from educational services supplied to customers and partners on the use of our software products and related topics.
Professional services and other service revenue decreased from €3,058 million in 2012 to €2,865 million in 2013, representing a decline of €193 million, or 6%. This decline reflects a 3% decrease from changes in volumes and prices and a 4% decrease from currency effects.
Customers' cautious buying behavior toward large services projects led to a decline in consulting revenue from €2,442 million in 2012 to €2,242 million in 2013, representing a decrease of €200 million, or 8%. This decline reflects a 5% decrease from changes in volumes and prices and a 4% decrease from currency effects. Consulting revenue contributed 78% of the total consulting and other service revenue (2012: 80%). Consulting revenue contributed 13% of total revenue (2012: 15%).
Revenue from other services increased €7 million, or 1%, to €623 million in 2013 (2012: €616 million). This reflects a 5% increase from changes in volumes and prices and a 4% decrease from currency changes.
96 Combined Management Report
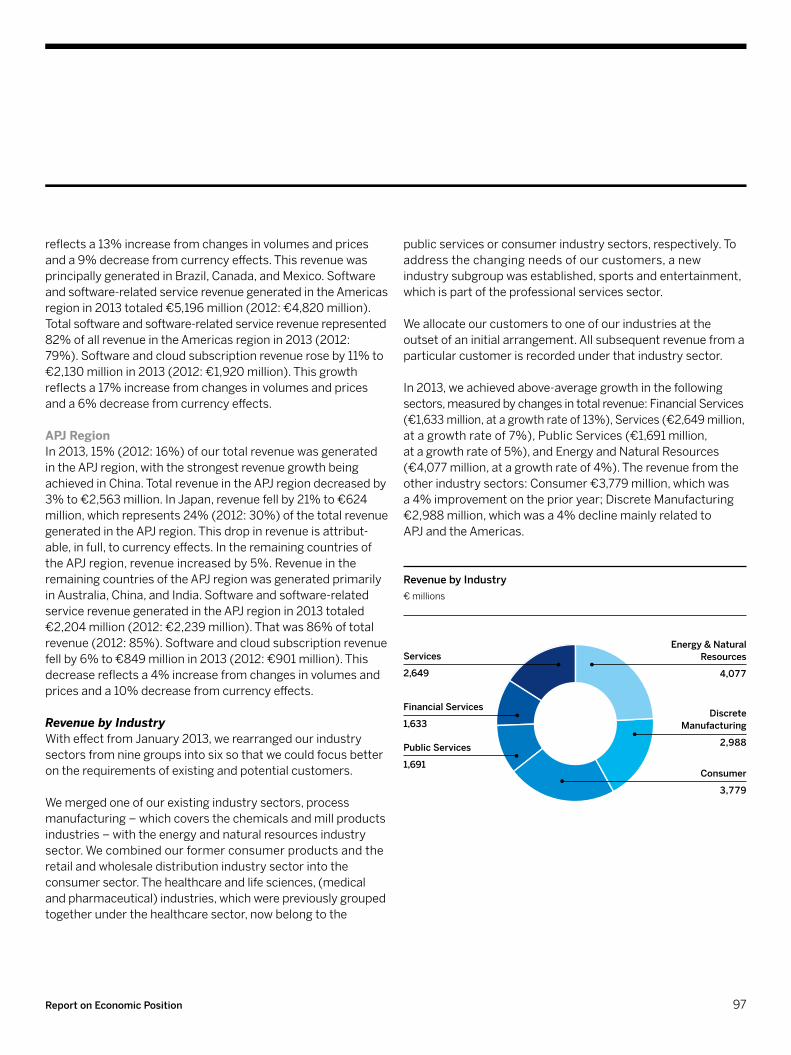
public services or consumer industry sectors, respectively. To address the changing needs of our customers, a new industry subgroup was established, sports and entertainment, which is part of the professional services sector.
We allocate our customers to one of our industries at the outset of an initial arrangement. All subsequent revenue from a particular customer is recorded under that industry sector.
In 2013, we achieved above-average growth in the following sectors, measured by changes in total revenue: Financial Services (€1,633 million, at a growth rate of 13%), Services (€2,649 million, at a growth rate of 7%), Public Services (€1,691 million, at a growth rate of 5%), and Energy and Natural Resources (€4,077 million, at a growth rate of 4%). The revenue from the other industry sectors: Consumer €3,779 million, which was a 4% improvement on the prior year; Discrete Manufacturing €2,988 million, which was a 4% decline mainly related to APJ and the Americas.
revenue by Industry € millions
public services
1,691Consumer
3,779
services
2,649
Financial services
1,633
energy & Natural resources
4,077
discrete Manufacturing
2,988
reflects a 13% increase from changes in volumes and prices and a 9% decrease from currency effects. This revenue was principally generated in Brazil, Canada, and Mexico. Software and software-related service revenue generated in the Americas region in 2013 totaled €5,196 million (2012: €4,820 million). Total software and software-related service revenue represented 82% of all revenue in the Americas region in 2013 (2012: 79%). Software and cloud subscription revenue rose by 11% to €2,130 million in 2013 (2012: €1,920 million). This growth reflects a 17% increase from changes in volumes and prices and a 6% decrease from currency effects.
ApJ RegionIn 2013, 15% (2012: 16%) of our total revenue was generated in the APJ region, with the strongest revenue growth being achieved in China. Total revenue in the APJ region decreased by 3% to €2,563 million. In Japan, revenue fell by 21% to €624 million, which represents 24% (2012: 30%) of the total revenue generated in the APJ region. This drop in revenue is attribut-able, in full, to currency effects. In the remaining countries of the APJ region, revenue increased by 5%. Revenue in the remaining countries of the APJ region was generated primarily in Australia, China, and India. Software and software-related service revenue generated in the APJ region in 2013 totaled €2,204 million (2012: €2,239 million). That was 86% of total revenue (2012: 85%). Software and cloud subscription revenue fell by 6% to €849 million in 2013 (2012: €901 million). This decrease reflects a 4% increase from changes in volumes and prices and a 10% decrease from currency effects.
Revenue by IndustryWith effect from January 2013, we rearranged our industry sectors from nine groups into six so that we could focus better on the requirements of existing and potential customers.
We merged one of our existing industry sectors, process manufacturing – which covers the chemicals and mill products industries – with the energy and natural resources industry sector. We combined our former consumer products and the retail and wholesale distribution industry sector into the consumer sector. The healthcare and life sciences, (medical and pharmaceutical) industries, which were previously grouped together under the healthcare sector, now belong to the
97report on economic position

Cost of Software and Software-Related ServicesCost of software and software-related services consists primarily of customer support costs, cost of developing custom solutions that address customers’ specific business requirements, costs for deploying and operating cloud solutions, amortization expenses relating to intangibles, and license fees and commissions paid to third parties for databases and the other complementary third-party products sublicensed by us to our customers.
In 2013, the cost of software and software-related services increased a modest 2% to €2,597 million (2012: €2,555 million). The main factors were a €95 million acquisition-related increase in the cost of providing and operating our cloud solutions and a €13 million increase in customer support costs.
Operating Profit and Operating Margin
In 2013, our operating profit totaled €4,479 million (2012: €4,041 million), a significant year-over-year increase despite adverse currency effects. We invested in innovations and made substantial advances in our cloud business in 2013.
In 2013, operating expenses increased €155 million or 1% to €12,336 million (2012: €12,181 million). The main contributors to that increase were our greater acquisition-related and restructuring expenses, continued investment in sales activities and the cloud, and higher personnel and infrastructure expenses related to acquisitions.
The effect of acquisition-related expenses, which were €555 million (2012: €537 million), and restructuring expenses, which were €70 million (2012: €8 million), on operating profit was greater than in the prior year. The operating profit for 2013 was also affected by continued investments in global sales activities and cloud computing. The number of SAP employees (expressed in full-time equivalents – FTEs) rose year over year by 2,150 persons, including more than 1,100 employees from acquired businesses.
Those negative effects on operating profit were in part offset by a reduced expense for share-based payment, which totaled €327 million in 2013 (2012: €522 million) owing to a less steep increase in the SAP stock price, and by a reduction in our general and administration expense.
As an overall result of these effects on operating profit, our operating margin widened 1.7 percentage points to 26.6% in 2013 (2012: 24.9%).
The sections that follow discuss our costs by line item.
Operating Profit€ millions | change since previous year
2,588
–4%
2,591
+0%
4,884
+89%
4,041
–17%
4,479+11%
2009 2010 2011 2012 2013
operating MarginPercent | change since previous year
24.3
+1.0 pp
20.8
–3.5 pp
34.3
+13.5 pp
24.9
–9.4 pp
26.6+1.7 pp
2009 2010 2011 2012 2013
98 Combined Management Report

than in 2012. Nonetheless, our total R&D expense increased only slightly, by 1% to €2,282 million (2012: €2,261 million). Therefore, while we continue to increase our innovative capacity our R&D expense as a percentage of total revenue was slightly less year over year at 13.6% (2012: 13.9%). For more information, see the Research and Development section.
Sales and Marketing ExpenseSales and marketing expense consists mainly of personnel costs and direct sales expense to support our sales and marketing teams in selling and marketing our products and services.
Our sales and marketing expense rose 6% from €3,912 million in 2012 to €4,131 million in 2013. The increase was mainly the result of greater personnel costs as we expanded our global sales force, notably for cloud business, and of the reallocation and re-tasking of employees to sales-related work. By increasing our sales force we accelerated our revenue growth. The ratio of sales and marketing expense to total revenue, expressed as a percentage, increased slightly to 24.6% (2012: 24.1%) because costs grew more rapidly than revenue.
General and Administration ExpenseOur general and administration expense consists mainly of personnel costs to support our finance and administration functions.
General and administration expense decreased 9% from €949 million in 2012 to €866 million in 2013. This resulted mainly from a reduced expense for share-based payment and efficient cost management. Consequently, the ratio of general and administration expense to total revenue decreased in 2013 to 5% (2012: 6%).
Results by SegmentWe had two divisions in 2013, On-Premise and Cloud, each further divided into operating segments. Our On-Premise division comprises two operating segments: On-Premise Products and On-Premise Services. Our Cloud division also comprises two operating segments: Cloud Applications and Ariba.
They both represent investments that contributed to revenue growth. At the same time, the license fees we pay to third parties decreased by €63 million. The gross margin on our software and software-related services, defined as software and software-related services profit as a percentage of software and software-related services revenue, remained constant year over year in 2013 at 81% (2012: 81%).
Cost of Professional Services and Other ServicesCost of professional services and other services consists primarily of the cost of consulting and training personnel and the cost of bought-in third-party consulting and training resources. This item also includes sales and marketing expenses for our professional services and other services resulting from sales and marketing efforts where those efforts cannot be clearly distinguished from providing the professional services and other services.
The growth of our cloud business and increased demand for pre-bundled offerings led to a reduction in our professional and other services revenue as well as in our professional and other services expense. We reduced costs for professional and other services 5% from €2,520 million in 2012 to €2,402 million in 2013. Our gross margin on professional and other services, defined as professional and other services profit as a percentage of professional and other services revenue, narrowed to 16% (2012: 18%).
Research and Development ExpenseOur research and development (R&D) expense consists primarily of the personnel cost of our R&D employees, costs incurred for independent contractors we retain to assist in our R&D activities, and depreciation of the computer hardware and software we use for our R&D activities.
We acquired Ariba and SuccessFactors in the course of 2012, so in 2012 our R&D expense did not include a full year's Ariba and SuccessFactors R&D. Moreover, the depreciation expense for R&D servers and computer systems was greater in 2013
99report on economic position
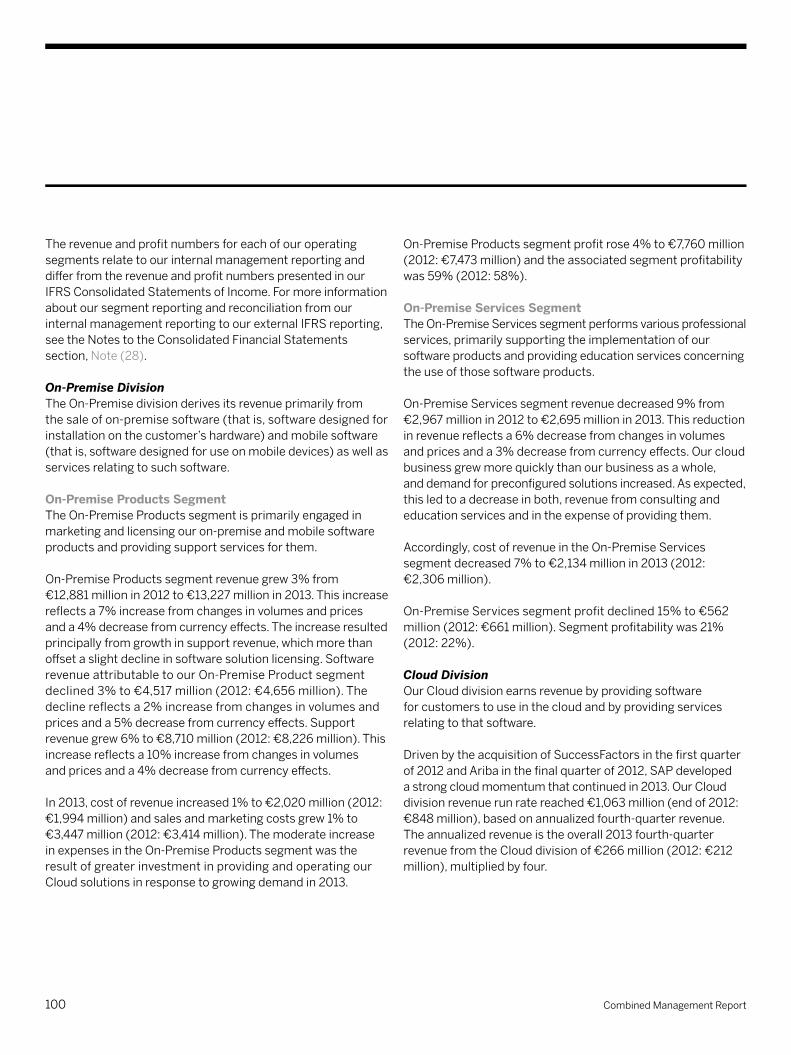
On-Premise Products segment profit rose 4% to €7,760 million (2012: €7,473 million) and the associated segment profitability was 59% (2012: 58%).
on-premise Services Segment The On-Premise Services segment performs various professional services, primarily supporting the implementation of our software products and providing education services concerning the use of those software products.
On-Premise Services segment revenue decreased 9% from €2,967 million in 2012 to €2,695 million in 2013. This reduction in revenue reflects a 6% decrease from changes in volumes and prices and a 3% decrease from currency effects. Our cloud business grew more quickly than our business as a whole, and demand for preconfigured solutions increased. As expected, this led to a decrease in both, revenue from consulting and education services and in the expense of providing them.
Accordingly, cost of revenue in the On-Premise Services segment decreased 7% to €2,134 million in 2013 (2012: €2,306 million).
On-Premise Services segment profit declined 15% to €562 million (2012: €661 million). Segment profitability was 21% (2012: 22%).
Cloud DivisionOur Cloud division earns revenue by providing software for customers to use in the cloud and by providing services relating to that software.
Driven by the acquisition of SuccessFactors in the first quarter of 2012 and Ariba in the final quarter of 2012, SAP developed a strong cloud momentum that continued in 2013. Our Cloud division revenue run rate reached €1,063 million (end of 2012: €848 million), based on annualized fourth-quarter revenue. The annualized revenue is the overall 2013 fourth-quarter revenue from the Cloud division of €266 million (2012: €212 million), multiplied by four.
The revenue and profit numbers for each of our operating segments relate to our internal management reporting and differ from the revenue and profit numbers presented in our IFRS Consolidated Statements of Income. For more information about our segment reporting and reconciliation from our internal management reporting to our external IFRS reporting, see the Notes to the Consolidated Financial Statements section, Note (28). On-Premise DivisionThe On-Premise division derives its revenue primarily from the sale of on-premise software (that is, software designed for installation on the customer’s hardware) and mobile software (that is, software designed for use on mobile devices) as well as services relating to such software.
on-premise products Segment The On-Premise Products segment is primarily engaged in marketing and licensing our on-premise and mobile software products and providing support services for them.
On-Premise Products segment revenue grew 3% from €12,881 million in 2012 to €13,227 million in 2013. This increase reflects a 7% increase from changes in volumes and prices and a 4% decrease from currency effects. The increase resulted principally from growth in support revenue, which more than offset a slight decline in software solution licensing. Software revenue attributable to our On-Premise Product segment declined 3% to €4,517 million (2012: €4,656 million). The decline reflects a 2% increase from changes in volumes and prices and a 5% decrease from currency effects. Support revenue grew 6% to €8,710 million (2012: €8,226 million). This increase reflects a 10% increase from changes in volumes and prices and a 4% decrease from currency effects.
In 2013, cost of revenue increased 1% to €2,020 million (2012: €1,994 million) and sales and marketing costs grew 1% to €3,447 million (2012: €3,414 million). The moderate increase in expenses in the On-Premise Products segment was the result of greater investment in providing and operating our Cloud solutions in response to growing demand in 2013.
100 Combined Management Report
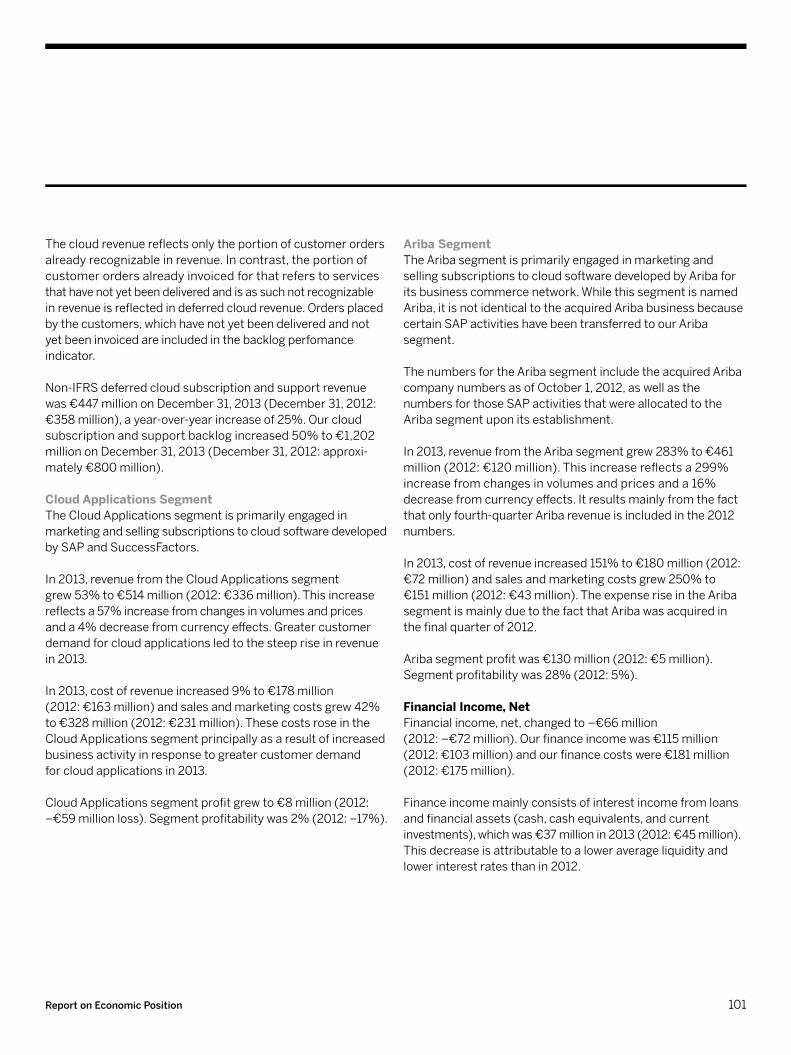
Ariba Segment The Ariba segment is primarily engaged in marketing and selling subscriptions to cloud software developed by Ariba for its business commerce network. While this segment is named Ariba, it is not identical to the acquired Ariba business because certain SAP activities have been transferred to our Ariba segment.
The numbers for the Ariba segment include the acquired Ariba company numbers as of October 1, 2012, as well as the numbers for those SAP activities that were allocated to the Ariba segment upon its establishment.
In 2013, revenue from the Ariba segment grew 283% to €461 million (2012: €120 million). This increase reflects a 299% increase from changes in volumes and prices and a 16% decrease from currency effects. It results mainly from the fact that only fourth-quarter Ariba revenue is included in the 2012 numbers.
In 2013, cost of revenue increased 151% to €180 million (2012: €72 million) and sales and marketing costs grew 250% to €151 million (2012: €43 million). The expense rise in the Ariba segment is mainly due to the fact that Ariba was acquired in the final quarter of 2012.
Ariba segment profit was €130 million (2012: €5 million). Segment profitability was 28% (2012: 5%). Financial Income, netFinancial income, net, changed to –€66 million (2012: –€72 million). Our finance income was €115 million (2012: €103 million) and our finance costs were €181 million (2012: €175 million).
Finance income mainly consists of interest income from loans and financial assets (cash, cash equivalents, and current investments), which was €37 million in 2013 (2012: €45 million). This decrease is attributable to a lower average liquidity and lower interest rates than in 2012.
The cloud revenue reflects only the portion of customer orders already recognizable in revenue. In contrast, the portion of customer orders already invoiced for that refers to services that have not yet been delivered and is as such not recognizable in revenue is reflected in deferred cloud revenue. Orders placed by the customers, which have not yet been delivered and not yet been invoiced are included in the backlog perfomance indicator.
Non-IFRS deferred cloud subscription and support revenue was €447 million on December 31, 2013 (December 31, 2012: €358 million), a year-over-year increase of 25%. Our cloud subscription and support backlog increased 50% to €1,202 million on December 31, 2013 (December 31, 2012: approxi-mately €800 million).
Cloud Applications SegmentThe Cloud Applications segment is primarily engaged in marketing and selling subscriptions to cloud software developed by SAP and SuccessFactors.
In 2013, revenue from the Cloud Applications segment grew 53% to €514 million (2012: €336 million). This increase reflects a 57% increase from changes in volumes and prices and a 4% decrease from currency effects. Greater customer demand for cloud applications led to the steep rise in revenue in 2013.
In 2013, cost of revenue increased 9% to €178 million (2012: €163 million) and sales and marketing costs grew 42% to €328 million (2012: €231 million). These costs rose in the Cloud Applications segment principally as a result of increased business activity in response to greater customer demand for cloud applications in 2013.
Cloud Applications segment profit grew to €8 million (2012: –€59 million loss). Segment profitability was 2% (2012: –17%).
101report on economic position
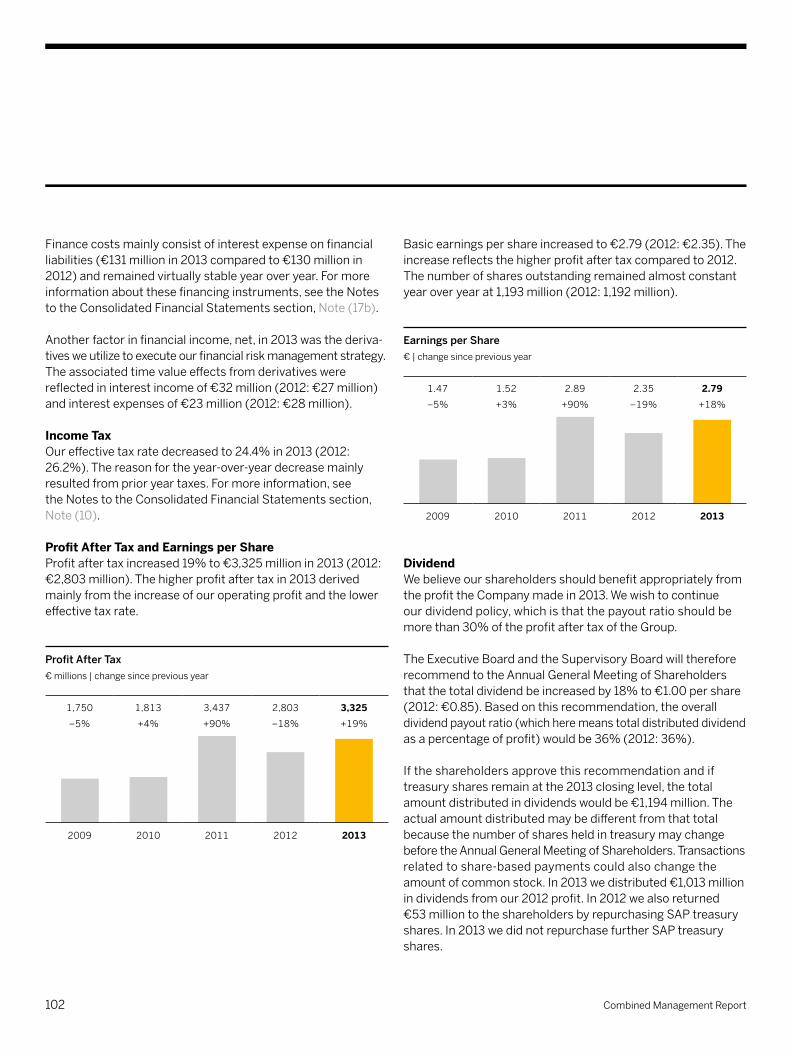
Basic earnings per share increased to €2.79 (2012: €2.35). The increase reflects the higher profit after tax compared to 2012. The number of shares outstanding remained almost constant year over year at 1,193 million (2012: 1,192 million).
DividendWe believe our shareholders should benefit appropriately from the profit the Company made in 2013. We wish to continue our dividend policy, which is that the payout ratio should be more than 30% of the profit after tax of the Group.
The Executive Board and the Supervisory Board will therefore recommend to the Annual General Meeting of Shareholders that the total dividend be increased by 18% to €1.00 per share (2012: €0.85). Based on this recommendation, the overall dividend payout ratio (which here means total distributed dividend as a percentage of profit) would be 36% (2012: 36%).
If the shareholders approve this recommendation and if treasury shares remain at the 2013 closing level, the total amount distributed in dividends would be €1,194 million. The actual amount distributed may be different from that total because the number of shares held in treasury may change before the Annual General Meeting of Shareholders. Transactions related to share-based payments could also change the amount of common stock. In 2013 we distributed €1,013 million in dividends from our 2012 profit. In 2012 we also returned €53 million to the shareholders by repurchasing SAP treasury shares. In 2013 we did not repurchase further SAP treasury shares.
earnings per share € | change since previous year
1.47
–5%
1.52
+3%
2.89
+90%
2.35
–19%
2.79+18%
2009 2010 2011 2012 2013
Finance costs mainly consist of interest expense on financial liabilities (€131 million in 2013 compared to €130 million in 2012) and remained virtually stable year over year. For more information about these financing instruments, see the Notes to the Consolidated Financial Statements section, Note (17b).
Another factor in financial income, net, in 2013 was the deriva-tives we utilize to execute our financial risk management strategy. The associated time value effects from derivatives were reflected in interest income of €32 million (2012: €27 million) and interest expenses of €23 million (2012: €28 million). Income taxOur effective tax rate decreased to 24.4% in 2013 (2012: 26.2%). The reason for the year-over-year decrease mainly resulted from prior year taxes. For more information, see the Notes to the Consolidated Financial Statements section, Note (10). Profit After Tax and Earnings per ShareProfit after tax increased 19% to €3,325 million in 2013 (2012: €2,803 million). The higher profit after tax in 2013 derived mainly from the increase of our operating profit and the lower effective tax rate.
Profit After Tax € millions | change since previous year
1,750
–5%
1,813
+4%
3,437
+90%
2,803
–18%
3,325+19%
2009 2010 2011 2012 2013
102 Combined Management Report
We manage credit, liquidity, interest rate, equity price, and foreign exchange rate risks on a Group-wide basis. We use selected derivatives exclusively for this purpose and not for speculation, which is defined as entering into a derivative instrument for which we do not have a corresponding under lying transaction. The rules for the use of derivatives and other rules and processes concerning the management of financial risks are collected in our treasury guideline document, which applies globally to all companies in the Group. For more information about the management of each financial risk and about our risk exposure, see the Notes to the Consolidated Financial Statements section, Notes (24) to (26).
Liquidity ManagementOur primary source of cash, cash equivalents, and current investments is funds generated from our business operations. Over the past several years, our principal use of cash has been to support operations and our capital expenditure requirements resulting from our growth, to acquire businesses, to pay dividends on our shares, and to buy back SAP shares on the open market. On December 31, 2013, our cash, cash equivalents, and current investments were primarily held in euros and U.S. dollars. We generally invest only in the financial assets of issuers or funds with a minimum credit rating of BBB, and pursue a policy of cautious investment characterized by wide portfolio diversification with a variety of counterparties, predominantly short-term investments, and standard investment instruments. We rarely invest in the financial assets of issuers with a credit rating lower than BBB, and such investments were not material in 2013.
In 2013, SAP signed a new revolving credit facility contract. The size of the facility was increased from €1.5 billion to €2.0 billion to support the company’s growth – for more information see the Credit Facilities section. We believe that our liquid assets combined with our undrawn credit facilities are sufficient to meet our present operating needs and, together with expected cash flows from operations, will support our currently planned capital expenditure requirements over the near term and medium term. It may also be necessary to enter into financing transactions when additional funds are required that cannot be wholly sourced from free cash flow (for example, to finance large acquisitions).
In 2011, in addition to the regular dividend of €0.75 per share, we rewarded our shareholders with a special dividend of €0.35 per share to celebrate our 40th anniversary. FInAnCeS (IFRS) overview
Global Financial ManagementWe use global centralized financial management to control liquid assets and monitor exposure to interest rates and currencies. The primary aim of our financial management is to maintain liquidity in the Group at a level that is adequate to meet our obligations. Most SAP companies have their liquidity managed centrally by the Group, so that liquid assets across the Group can be consolidated, monitored, and invested in accordance with Group policy. High levels of liquid assets help keep SAP flexible, sound, and independent. In addition, various credit facilities are currently available for additional liquidity, if required. For more information about these facilities, see the Credit Facilities section.
dividend per share€ | change since previous year
0.50
+0%
0.60
+20%
1.10
+83%
0.85
–23%
1.00+18%
2009 2010 2011 2012 2013
103report on economic position

customer confidence, and to support the growth of our business. We seek to maintain a capital structure that will allow us to cover our funding requirements through the capital markets at reasonable conditions, and in so doing, ensure a high level of independence, confidence, and financial flexibility.
Based on our strong corporate financial profile and our excel-lent capital market reputation, we have so far successfully executed external financing transactions without an external rating. However, we will continue to closely monitor our financing situation to determine whether not having an external rating continues to be appropriate.
Our general intention is to remain in a position to return excess liquidity to our shareholders by distributing annual dividends and repurchasing shares. The amount of future dividends and the extent of future repurchases of shares will be balanced with our effort to continue to maintain an adequate liquidity position.
Capital structure
2013 2012 % Change
€ millions % of Total equity and
liabilities
€ millions % of Total equity and
liabilities
Equity 16,048 59 14,133 54 14
Current liabilities 6,347 23 6,546 25 −3
Non-current liabilities 4,699 17 5,627 21 −16
Liabilities 11,046 41 12,173 46 −9
total equity and liabilities 27,094 100 26,306 100 3
The persistently strong free cash flow of recent years enabled us to pay back additional debts within a short period of time. Furthermore, a balanced maturity profile prevents repayment peaks from occurring in any particular year.
To expand our business, we have made acquisitions of businesses, products, and technologies. Depending on our future cash position and future market conditions, we might issue additional debt instruments to fund acquisitions, maintain financial flexibility, and limit repayment risk. Therefore, we continuously monitor funding options available in the capital markets and trends in the availability of funds, as well as the cost of such funding. For more information about the financial debt, see the Cash Flows and Liquidity section.
Capital Structure ManagementThe primary objective of our capital structure management is to maintain a strong financial profile for investor, creditor, and
104 Combined Management Report
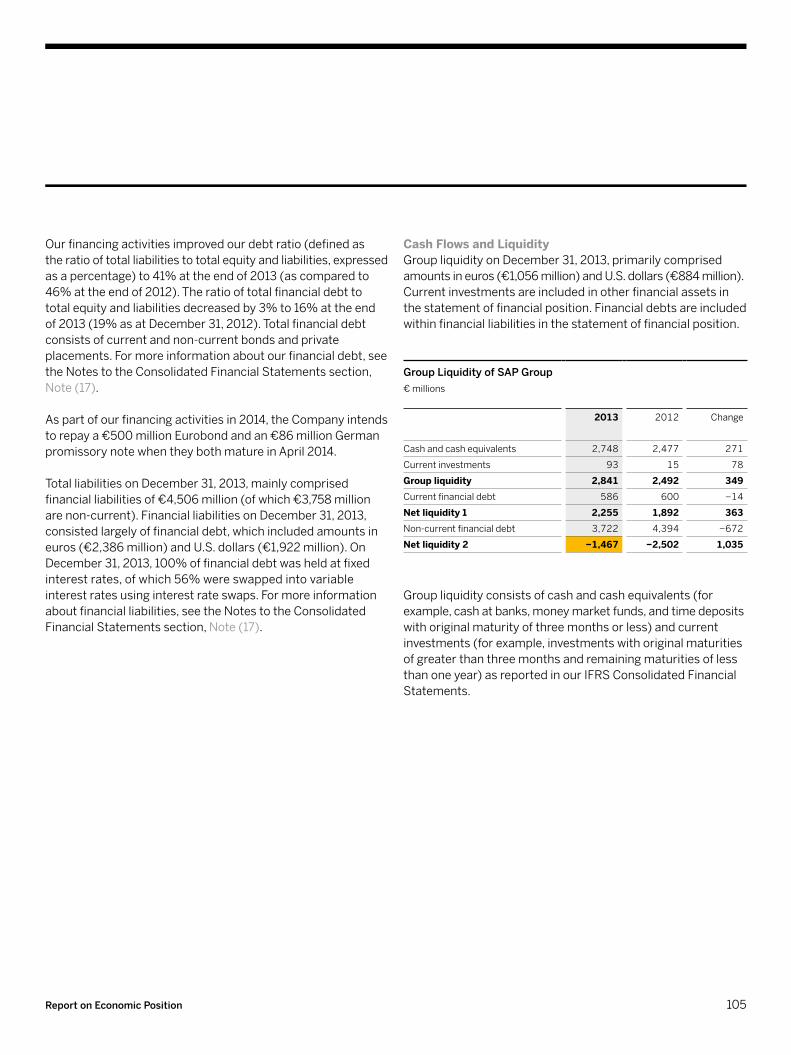
Cash Flows and liquidityGroup liquidity on December 31, 2013, primarily comprised amounts in euros (€1,056 million) and U.S. dollars (€884 million). Current investments are included in other financial assets in the statement of financial position. Financial debts are included within financial liabilities in the statement of financial position.
Group Liquidity of sap Group€ millions
2013 2012 Change
Cash and cash equivalents 2,748 2,477 271
Current investments 93 15 78
Group liquidity 2,841 2,492 349Current financial debt 586 600 −14
net liquidity 1 2,255 1,892 363Non-current financial debt 3,722 4,394 −672
net liquidity 2 −1,467 −2,502 1,035
Group liquidity consists of cash and cash equivalents (for example, cash at banks, money market funds, and time deposits with original maturity of three months or less) and current investments (for example, investments with original maturities of greater than three months and remaining maturities of less than one year) as reported in our IFRS Consolidated Financial Statements.
Our financing activities improved our debt ratio (defined as the ratio of total liabilities to total equity and liabilities, expressed as a percentage) to 41% at the end of 2013 (as compared to 46% at the end of 2012). The ratio of total financial debt to total equity and liabilities decreased by 3% to 16% at the end of 2013 (19% as at December 31, 2012). Total financial debt consists of current and non-current bonds and private placements. For more information about our financial debt, see the Notes to the Consolidated Financial Statements section, Note (17).
As part of our financing activities in 2014, the Company intends to repay a €500 million Eurobond and an €86 million German promissory note when they both mature in April 2014.
Total liabilities on December 31, 2013, mainly comprised financial liabilities of €4,506 million (of which €3,758 million are non-current). Financial liabilities on December 31, 2013, consisted largely of financial debt, which included amounts in euros (€2,386 million) and U.S. dollars (€1,922 million). On December 31, 2013, 100% of financial debt was held at fixed interest rates, of which 56% were swapped into variable interest rates using interest rate swaps. For more information about financial liabilities, see the Notes to the Consolidated Financial Statements section, Note (17).
105report on economic position

Net cash provided by operating activities remained stable in 2013 (€3,832 million) compared to the prior year (2012: €3,822 million). Increased income tax payments of €193 million to €1,295 million in 2013 burdened net cash flows from operating activities. In addition, days’ sales outstanding (DSO) for receivables, defined as average number of days from the raised invoice to cash receipt from the customer, was 62 days, a three-day increase compared to 2012 (59 days).
Cash outflows from investment activities totaled €1,781 million in 2013, much decreased from the 2012 figure of €5,964 million that were attributed mainly to business combinations of SuccessFactors and Ariba. In 2013, cash outflows were mainly driven by the acquisitions of consolidated companies (especially hybris) as well, for which we paid €1,160 million in total. For more information about current and planned capital expenditures, see the Assets and Investment Goals sections.
Cash outflows from financing activities totaled €1,589 million in 2013, compared to €194 million in 2012. In 2013, cash outflows were mainly driven by dividends paid and a repayment of an issued €600 million Eurobond. In addition, we took out a short-term bank loan in the amount of €1,000 million to finance the acquisition of hybris that were fully offset by repayments
Net liquidity is Group liquidity less total financial debt as defined above.
The increase in Group liquidity from 2012 was mainly due to positive cash inflows from our operations, which were partly offset by cash outflows for acquisitions (such as hybris), dividend payments and repayment of an issued Eurobond.
For information about the impact of cash, cash equivalents, current investments, and our financial liabilities on our income statements, see the analysis of our financial income, net, in the Operating Results (IFRS) section. Analysis of Consolidated Statements of Cash Flow
analysis of Consolidated statements of Cash Flow€ millions
2013 2012 Change (in %)
Net cash flows from operating activities
3,832 3,822 0
Net cash flows from investing activities
−1,781 −5,964 −70
Net cash flows from financing activities
−1,589 −194 >100
Group Liquidity
12/31/2012
2,492
Operating Cash Flow
Capital Expenditure
Acquisitions Dividends Paid
Proceeds from Borrowings
Repayments of Borrowings
Other Group Liquidity
12/31/2013
2,841
+3,832
–566
–1,160–1,013 +1,000
–1,625 –119
Group Liquidity development € millions
106 Combined Management Report

31, 2013, approximately €36 million was available through such arrangements. There were no borrowings outstanding under these credit facilities from any of our foreign subsidiaries as at December 31, 2013. ASSetS (IFRS)
Analysis of Consolidated Statements of Financial positionTotal assets increased by 3% year over year to €27,094 million.
Total current assets increased by 6% in 2013 from €6,928 million to €7,352 million. This was mainly due to an increase in cash and cash equivalents to €2,748 million (2012: €2,477 million) stemming from cash inflows from our operating activities.
Total non-current assets increased slightly in 2013 to €19,741 million compared to the previous year’s figure of €19,378 million. This 2% increase was mainly due to additions to goodwill, resulting from the acquisition of hybris.
Breakdown of Consolidated statements of Financial positionPercent
Assets Liabilities
26
74
2773
25
21
54
231859
2012 2013 2012 2013
Short term Long term Shareholders’ equity
in the same amount and year. In the previous year, cash outflows from financing activities were mainly driven by repayments of a Eurobond tranche (€600 million) and several tranches (€611 million) of the promissory notes we issued in 2009 and dividends paid. This was almost fully compensated by a successfully placed Eurobond transaction totaling €1.3 billion and a U.S. private placement transaction of US$1.4 billion.
The decrease of total dividends paid in 2013 to €1,013 million (2012: €1,310 million) was due to a decrease in dividend paid to €0.85 per share compared to €1.10 per share in the previous year, of which €0.35 per share was an extraordinary payout to celebrate our 40th anniversary in 2012.
Credit FacilitiesOther sources of capital are available to us through various credit facilities, if required.
By signing a new credit facility contract of €2.0 billion, SAP refinanced its existing credit facility of €1.5 billion that would have expired in December 2015. The revolving credit facility was early refinanced due to favorable market conditions with a tenor of five years plus two one year extension options. The credit line may be used for general corporate purposes. A possible future withdrawal is not bound to any financial covenants. Borrowings under the facility bear interest at the euro interbank offered rate (EURIBOR) or London interbank offered rate (LIBOR) for the respective optional currency plus a margin ranging from 0.3% to 0.525% (2012: 0.45% to 0.75%). We pay a commitment fee of 0.079% (2012: 0.1575%) per annum on unused amounts of the available credit facility. So far, we have not used and do not currently foresee any need to use this credit facility.
As at December 31, 2013, SAP AG had additional available credit facilities totaling €487million. As at December 31, 2013, there were no borrowings outstanding under these credit facilities. Several of our foreign subsidiaries have credit facilities available that allow them to borrow funds in their local currencies at prevailing interest rates, generally to the extent SAP AG has guaranteed such amounts. As at December
107report on economic position
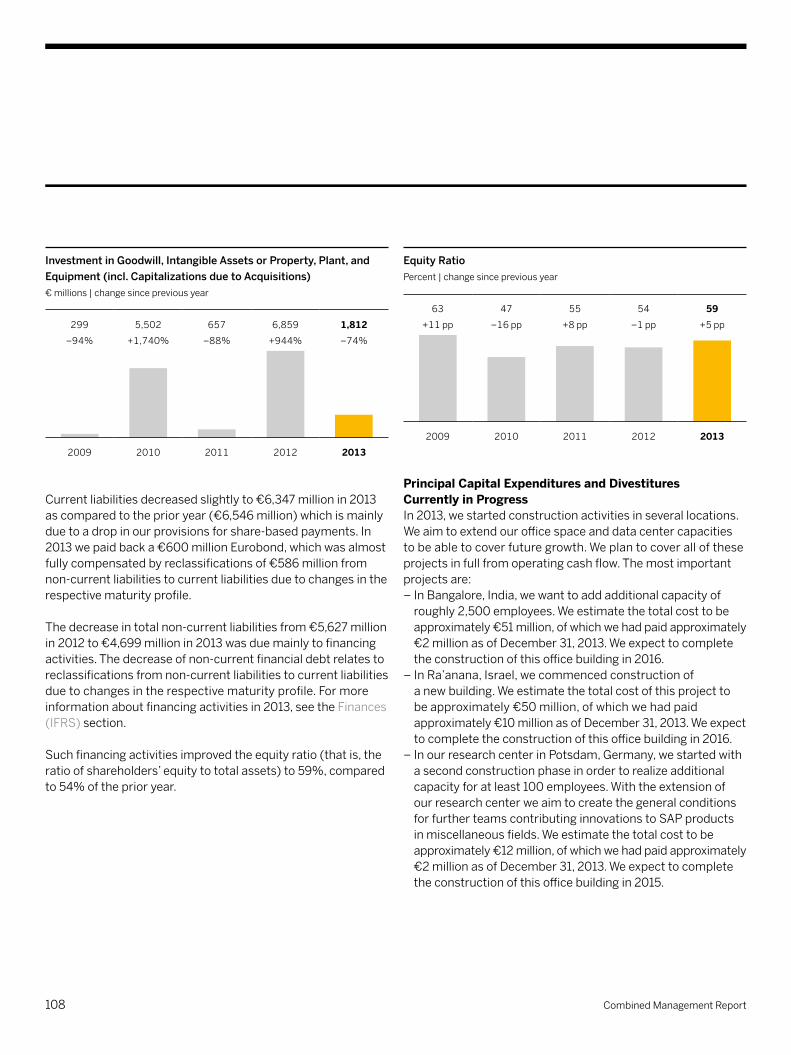
equity ratioPercent | change since previous year
63
+11 pp
47
–16 pp
55
+8 pp
54
–1 pp
59+5 pp
2009 2010 2011 2012 2013
principal Capital expenditures and Divestitures Currently in progress In 2013, we started construction activities in several locations. We aim to extend our office space and data center capacities to be able to cover future growth. We plan to cover all of these projects in full from operating cash flow. The most important projects are:– In Bangalore, India, we want to add additional capacity of
roughly 2,500 employees. We estimate the total cost to be approximately €51 million, of which we had paid approximately €2 million as of December 31, 2013. We expect to complete the construction of this office building in 2016.
– In Ra’anana, Israel, we commenced construction of a new building. We estimate the total cost of this project to be approximately €50 million, of which we had paid approximately €10 million as of December 31, 2013. We expect to complete the construction of this office building in 2016.
– In our research center in Potsdam, Germany, we started with a second construction phase in order to realize additional capacity for at least 100 employees. With the extension of our research center we aim to create the general conditions for further teams contributing innovations to SAP products in miscellaneous fields. We estimate the total cost to be approximately €12 million, of which we had paid approximately €2 million as of December 31, 2013. We expect to complete the construction of this office building in 2015.
Investment in Goodwill, Intangible assets or property, plant, and Equipment (incl. Capitalizations due to Acquisitions)€ millions | change since previous year
299
–94%
5,502
+1,740%
657
–88%
6,859
+944%
1,812–74%
2009 2010 2011 2012 2013
Current liabilities decreased slightly to €6,347 million in 2013 as compared to the prior year (€6,546 million) which is mainly due to a drop in our provisions for share-based payments. In 2013 we paid back a €600 million Eurobond, which was almost fully compensated by reclassifications of €586 million from non-current liabilities to current liabilities due to changes in the respective maturity profile.
The decrease in total non-current liabilities from €5,627 million in 2012 to €4,699 million in 2013 was due mainly to financing activities. The decrease of non-current financial debt relates to reclassifications from non-current liabilities to current liabilities due to changes in the respective maturity profile. For more information about financing activities in 2013, see the Finances (IFRS) section.
Such financing activities improved the equity ratio (that is, the ratio of shareholders’ equity to total assets) to 59%, compared to 54% of the prior year.
108 Combined Management Report
and customer relations), employees and their knowledge and skills, our ecosystem of partners, software we developed ourselves, our ability to innovate, the brands we have built up – in particular, the SAP brand itself – and our organization. On December 31, 2013, SAP ranked third of the most valuable companies in Germany in terms of market capitalization based on all outstanding shares. According to the Interbrand “Best Global Brands” annual survey, SAP ranked again the 25th most valued brand in the world (2012: 25th). Against other German brands, the SAP brand ranks third behind Mercedes-Benz and BMW, and 10th globally against other IT brands. Interbrand determined our value as US$16.7 billion, an increase of 7% compared to the previous year (2012: US$15.6 billion).
The results of our investment in research and development, including R&D investment made in the past, are also a significant element in our competitive intangibles.
Our customer capital continued to grow in 2013. We gained more than 21,500 new customers in various market segments and strengthened our existing customer relationships. To help us improve insight into our customers’ view of SAP, in 2012 we began measuring our Net Promoter Score (NPS), a metric that gives a more complete picture of customer loyalty as it answers the question of how likely our customers would be to recommend SAP. For more information about our new customers and NPS, see the Customers section.
Employee-related and R&D activities increased the value of our employee base and our own software. For more information, see the Employees and Social Investment section and the Research and Development section. We also increased the value of our partner ecosystem by continuing to develop sales and development partnerships.
– In New York City, New York, United States, we started planning the leasehold improvements for our new office space. The project includes the consolidation of our New York City offices for approximately 600 employees. We estimate the total capital expenditures for this project to be approximately €37 million. We expect to complete the leasehold improvements in 2016.
– In Paris, France, we started an office consolidation project. The project aims to consolidate three office spaces in Paris into one office space. We estimate the total cost of the leasehold improvements to be approximately €24 million. We expect to complete the leasehold improvements in 2014.
– In St. Leon-Rot, Germany, we started increasing the capacity of our data center. We estimate the total cost of this project to be approximately €30 million, of which we had paid approximately €14 million as of December 31, 2013. We expect to complete the construction for this project in 2014.
– In Newtown Square, Pennsylvania, United States, we also started to increase the capacity of our data center. We estimate the total cost of this project to be approximately €20 million, of which we had paid approximately €2 million as of December 31, 2013. We expect to complete the construction for this project in 2014.
For more information about planned capital expenditures, see the Investment Goals section. There were no material divestitures within the reporting period. Competitive IntangiblesThe assets that are the basis for our current as well as future success do not appear on the Consolidated Statements of Financial Position. This is apparent from a comparison of the market capitalization of SAP AG (based on all outstanding shares), which was €76.5 billion at the end of 2013 (2012: €74.7 billion), with the equity on the Consolidated Statements of Financial Position, which was €16.0 billion (2012: €14.1 billion). This means that the market capitalization of our equity is more than four times higher than the book value. The difference is mainly due to certain intangible assets that the applicable accounting standards do not allow to be recorded (at all or at fair value) on the Consolidated Statements of Financial Position. They include customer capital (our customer base
109report on economic position
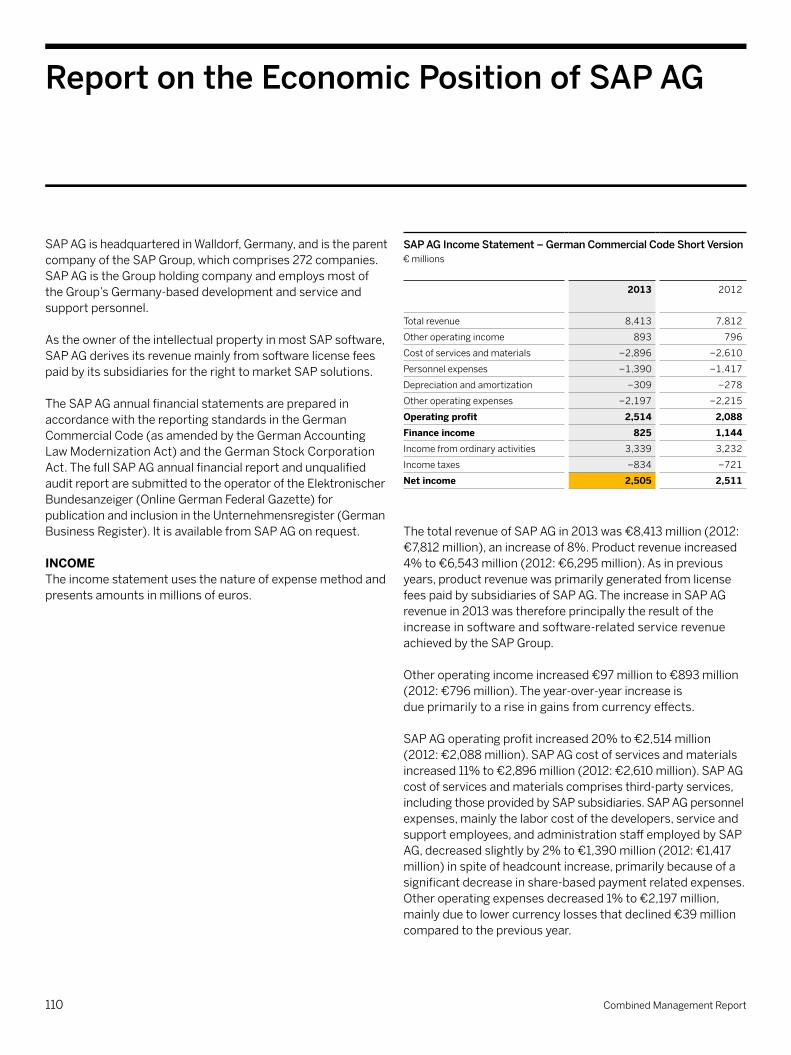
sap aG Income statement – German Commercial Code short Version € millions
2013 2012
Total revenue 8,413 7,812
Other operating income 893 796
Cost of services and materials −2,896 −2,610
Personnel expenses −1,390 −1,417
Depreciation and amortization −309 −278
Other operating expenses −2,197 −2,215
operating profit 2,514 2,088Finance income 825 1,144Income from ordinary activities 3,339 3,232
Income taxes −834 −721
net income 2,505 2,511
The total revenue of SAP AG in 2013 was €8,413 million (2012: €7,812 million), an increase of 8%. Product revenue increased 4% to €6,543 million (2012: €6,295 million). As in previous years, product revenue was primarily generated from license fees paid by subsidiaries of SAP AG. The increase in SAP AG revenue in 2013 was therefore principally the result of the increase in software and software-related service revenue achieved by the SAP Group.
Other operating income increased €97 million to €893 million (2012: €796 million). The year-over-year increase is due primarily to a rise in gains from currency effects.
SAP AG operating profit increased 20% to €2,514 million (2012: €2,088 million). SAP AG cost of services and materials increased 11% to €2,896 million (2012: €2,610 million). SAP AG cost of services and materials comprises third-party services, including those provided by SAP subsidiaries. SAP AG personnel expenses, mainly the labor cost of the developers, service and support employees, and administration staff employed by SAP AG, decreased slightly by 2% to €1,390 million (2012: €1,417 million) in spite of headcount increase, primarily because of a significant decrease in share-based payment related expenses. Other operating expenses decreased 1% to €2,197 million, mainly due to lower currency losses that declined €39 million compared to the previous year.
SAP AG is headquartered in Walldorf, Germany, and is the parent company of the SAP Group, which comprises 272 companies. SAP AG is the Group holding company and employs most of the Group’s Germany-based development and service and support personnel.
As the owner of the intellectual property in most SAP software, SAP AG derives its revenue mainly from software license fees paid by its subsidiaries for the right to market SAP solutions.
The SAP AG annual financial statements are prepared in accordance with the reporting standards in the German Commercial Code (as amended by the German Accounting Law Modernization Act) and the German Stock Corporation Act. The full SAP AG annual financial report and unqualified audit report are submitted to the operator of the Elektronischer Bundesanzeiger (Online German Federal Gazette) for publication and inclusion in the Unternehmensregister (German Business Register). It is available from SAP AG on request.
InCoMeThe income statement uses the nature of expense method and presents amounts in millions of euros.
report on the economic position of sap aG
110 Combined Management Report

sap aG Balance sheet – German Commercial Code short Version € millions
12/31/2013 12/31/2012
AssetsIntangible assets 289 406
Property, plant, and equipment 965 917
Financial assets 16,857 16,664
Fixed assets 18,111 17,987Inventories 2 4
Accounts receivable 2,857 2,541
Liquid assets 884 307
Short-term assets 3,743 2,852
prepaid expenses and deferred charges
113 115
Deferred taxes 63 74Surplus arising from offsetting 25 9 total assets 22,055 21,037
equity and liabilitiesShareholders' equity 11,295 9,717
Provisions 1,203 1,251
Other liabilities 9,549 10,063
Deferred income 8 6
total shareholders’ equity and liabilities
22,055 21,037
Financial assets increased 1% compared with the previous year to €16,857 million, primarily caused by the increase in contributions to subsidiaries. Short-term assets stood at €3,743 million (2012: €2,852 million), a year-over-year increase of €891 million. €316 million of the increase is attributable to accounts receivable and €577 million to liquid assets.
SAP AG shareholders’ equity rose 16% to €11,295 million (2012: €9,717 million). Against outflows of €1,013 million associated with the payment of the 2012 dividend, there was a €2,505 million increase in net income and an inflow of €86 million from the issuance of shares to service the share-based payments of employees and Executive Board members. The equity ratio (that is, the ratio of shareholders’ equity to total assets) increased from 46% in 2012 to 51% in 2013.
Finance income was €825 million (2012: €1,144 million), a decrease of €319 million compared with the previous year, mainly caused by a €322 million decrease in income from securities classified as financial assets and €108 million decrease in investment income. This decrease in finance income was offset by increases of €10 million in income from profit transfer agreements and €26 million in net interest income, as well as a decrease of €76 million in write-downs of financial assets.
SAP AG income from ordinary activities, which is the sum of operating profit and finance income, increased 3% to €3,339 million (2012: €3,232 million). Income tax increased 19% to €831 million (2012: €701 million). The primary cause was a large reduction in income from securities classified as financial assets, much of which is non-taxable. After deducting taxes, the resultant net income decreased €6 million year over year to €2,505 million (2012: €2,511 million).
ASSetS AnD FInAnCIAl poSItIonIn 2013, SAP AG total assets closed at €22,055 million (2012: €21,037 million).
111report on the economic position of sap aG

Mainly due to the mentioned cash contributions by subsidiaries through SAP AG's centralized management of finance and liquidity as well as to positive business performance, the cash flow from operating activities increased €653 million to €2,987 million in 2013 (2012: €2,334 million).
SAP AG used net cash flows from investing activities of €485 million in 2013 (2012: €4,598 million), a year-over-year decrease of €4,113 million. The outflows were €500 million for property, plant and equipment and financial assets and €50 million for long-term investments. They were in part offset by inflows of €66 million from sales of property, plant and equipment and financial assets. In the prior year, contributions to subsidiaries’ capital related to the acquisition of Success-Factors and Ariba occasioned outflows of €4,830 million.
Net cash flows from financing activities were €1,975 million in 2013 compared to €271 million in 2012. In 2013, SAP AG outflows included the dividend of €1,013 million (2012: €1,310 million and repayments of financial liabilities of €1,015 million. On the other hand, SAP AG generated inflows of €53 million from the reissuance of treasury shares and the issuance of new shares for share-based payments.
At the close of the year, SAP AG held €834 million in short-term liquid assets (2012: €307 million), a year-over-year decrease of €527 million.
oppoRtunItIeS AnD RISkSSAP AG is subject to materially the same opportunities and risks as the SAP Group. For more information, see the Opportunity Report and the Risk Report sections.
Provisions decreased €48 million to €1,203 million. While the other provisions decreased €107 million to €662 million, mainly due to lower share-based payment related provisions, the reserves for tax increased €58 million to €539 million.
Other liabilities decreased €514 million to €9,549 million (2012: €10,063 million). This decrease is mainly attributable to contrasting effects: On the one hand, SAP AG made a scheduled repayment of a bond in the amount of €600 million; on the other, SAP AG liabilities to affiliated companies decreased €95 million, mainly due to increased cash contribution by subsidiaries through SAP AG's centralized management of finance and liquidity.
sap aG Cash Flow statement – German Commercial Code short Version€ millions
2013 2012
Net cash flows from operating activities
2,987 2,334
Net cash flows from investing activities
−485 −4,598
Net cash flows from financing activities
−1,975 −271
Net decrease/increase in cash and cash equivalents
527 −2,535
Cash and cash equivalents at the beginning of the year
307
2,842
Cash and cash equivalents at the end of the year
834
307
112 Combined Management Report

InFluenCe oF ACCountInG polICIeS on ouR FInAnCIAl poSItIonFor more information about our accounting policies, see the Notes to the Consolidated Financial Statements section, Note (3).
There are no off-balance sheet financial instruments, such as sale-and-lease-back transactions, asset-backed securities, and liabilities related to structured entities, that are not disclosed in our Consolidated Financial Statements.
exeCutIVe BoARD’S ASSeSSMentSAP delivered strong revenue and profit growth in 2013. SAP HANA, our platform for real-time business applications, was a major growth engine in 2013. SAP Business Suite powered by SAP HANA is becoming a leading platform for high- performance applications.
Our stable, highly profitable core business and our fast-growing cloud business can together deliver continued growth and an expanding margin. We still aim to increase total revenue growth, both for the near term and for the medium term. At the same time, we want to build still greater profitability for our business. All in all, SAP remains in good financial shape.
overall Financial position
113overall Financial position

As invited by management, SAP employees and their representatives in the European Union (EU) and European Economic Area (EEA) countries elected their delegates to a Special Negotiating Body (SNB). Negotiations between SAP management and the SNB regarding the European employees’ involvement in the SE began in September 2013, are ongoing, and are expected to last six months. SAP intends to seek the required approval of the shareholders for the conversion of legal form at the 2014 Annual General Meeting of Shareholders. If approved, the change of legal form would take effect upon entry in the commercial register. With the conversion to an SE, its shareholders automatically become shareholders of SAP SE. Shareholders’ rights remain unchanged.
ChAnGeS In MAnAGeMentLars Dalgaard stepped down from the Executive Board and left the Company on June 1, 2013, to join a private equity firm. He continues to play an active role as an advisor to the SAP Cloud business in the Cloud Governance Board.
We have consolidated all responsibility for innovation and product development under Vishal Sikka, a member of the Executive Board. With effect from June 1, 2013, all on-premise delivery, network (Ariba), and Cloud unit development leaders report directly to Vishal Sikka. Additionally, the Executive Board nominated Bernd Leukert, executive vice president for application innovation, to the Global Managing Board with effect from July 1, 2013. In this capacity, Leukert reports directly to Vishal Sikka.
Luisa Deplazes Delgado, member of the Executive Board of SAP AG, Human Resources, and Labor Relations Director decided to leave SAP with effect from June 30, 2013, to become the CEO of another company.
CoRpoRAte GoVeRnAnCe StAteMentThe German Commercial Code, section 289a, requires that listed stock corporations publish a corporate governance statement either as part of their management report or on their Web site. The Executive Board filed SAP’s corporate governance statement on February 19, 2014, and published it on our public Web site at www.sap.com/corporate-en/ investors/governance.
For more information about the corporate governance of SAP, see the Corporate Governance Report section.
plAnneD ConVeRSIon to A euRopeAn CoMpAnyIn March 2013, the Executive Board and Supervisory Board of SAP AG agreed to convert SAP AG to a European Company (SE). SAP has begun working on the conversion process. The Executive Board and the Supervisory Board believe that the planned change of legal form reflects SAP’s position as a global company with European roots. The European Company legal form also reflects SAP’s European and international business activities. The European Company legal form will allow SAP to optimize its corporate governance structure and the work of its Supervisory Board and Executive Board.
Corporate Governance
114 Combined Management Report

In addition to his role as our chief financial officer, Werner Brandt took on Executive Board responsibility for human resources and became the labor relations director in Germany. In this context, Luka Mucic became the head of global finance to support Brandt in his expanded responsibilities. The Executive Board nominated Mucic to the Global Managing Board with effect from July 1, 2013. In October 2013, the Supervisory Board of SAP AG appointed Luka Mucic chief financial officer, effective July 1, 2014. Luka Mucic is the successor of Werner Brandt, who will, as planned, withdraw from the Executive Board by that time.
On July 21, 2013, the SAP Supervisory Board agreed to propose that co-CEO Jim Hagemann Snabe be elected to the SAP Supervisory Board at the SAP Annual General Meeting of Shareholders in May 2014. This proposal is subject to support by at least 25% of the shareholders. Jim Hagemann Snabe will conclude his current role as co-CEO and member of the SAP Executive Board upon the conclusion of the Annual General Meeting of Shareholders in May 2014.
Bob Calderoni, president of Ariba, an SAP company, and a member of our Global Managing Board, decided to leave SAP with effect from January 15, 2014.
115Corporate Governance
– Legal requirements and provisions in the articles of Incor-poration concerning the appointment and dismissal of members of the executive Board and amendment of the articles of Incorporation: Conditions for the appointment and dismissal of members of the Executive Board and amendment of the Articles of Incorporation reflect the relevant provisions in the German Stock Corporation Act. Under the Articles of Incorporation, the Executive Board consists of at least two members who are appointed for a period of not more than five years by the Supervisory Board in accordance with the German Stock Corporation Act, section 84. The number of members of the Executive Board is decided by the Supervisory Board. Executive Board members may be reappointed for, or their term of office extended by, a maximum of five years. The German Codetermination Act, section 31, provides that a two-thirds majority of the Supervisory Board membership is required for Executive Board appointments. If the Supervisory Board fails to make an appointment with a majority that meets this requirement, the Mediation Committee must propose an appointee within one month. Appointments to the Executive Board can then be made by a simple majority of the Super visory Board membership. If the Supervisory Board also fails to make an appointment with a majority that meets this requirement, the chairperson of the Supervisory Board has two votes in the subsequent ballot. The Supervisory Board can appoint a chairperson of the Executive Board and one or more deputy chairpersons from among the members of the Executive Board. The Supervisory Board can revoke appointments to the Executive Board in accordance with the German Stock Corporation Act, section 84, if compelling reasons exist, such as gross negligence on the part of the Executive Board member. If the Executive Board is short of a required member, one may be appointed in urgent cases by a court in accordance with the German Stock Corporation Act, section 85. In accordance with the German Stock Corporation Act, sections 179 and 133, an amendment of the Articles of Incorporation requires a resolution of the General Meeting of Shareholders with a majority of at least three-quarters of the share capital represented in the vote and the simple majority of the votes cast. Section 11 (2) of the Articles of Incorporation authorizes the Supervisory Board to amend the Articles of Incorporation where such amendments only concern the wording.
Information required under the German Commercial Code, sections 289 (4) and 315 (4), with explanatory report.
– Composition of share capital: For information about the composition of SAP AG share capital as of December 31, 2013, see the Notes to the Consolidated Financial Statements section, Note (20). Each share entitles the bearer to one vote. American depositary receipts (ADRs) representing our shares are listed on the New York Stock Exchange in the United States. ADRs are certificates representing non-U.S. shares and are traded on U.S. stock exchanges instead of the underlying shares. One SAP ADR corresponds to one SAP share.
– restrictions applying to share voting rights or transfers: SAP shares are not subject to transfer restrictions except the lock-in period under the SAP Share Matching Plan (SMP), described below. SAP held 34,795,554 treasury shares on December 31, 2013. Treasury shares did not entitle us to any rights, and hence to any voting rights or dividend. Shares issued in 2013 under the employee SMP are subject to contractual transfer restrictions for a three-year lock-in period unless the plan member’s employment with SAP is ended during that period. Until that lock-in period has expired, the participating employees are not ordinarily allowed to dispose of the shares they have acquired under the plan. We are not aware of any other restrictions applying to share voting rights or to share transfers.
– Shareholdings that exceed 10% of the voting rights: We are not aware of any direct or indirect SAP AG shareholdings that exceed 10% of the voting rights.
– shares with special rights conferring powers of control: No SAP shareholder has special rights conferring powers of control.
– type of control over voting rights applying to employee shareholders who do not directly exercise their control rights: As with other shareholders, employee holders of SAP shares exercise their control rights in accordance with the law and the Articles of Incorporation. In votes on the formal approval of their acts at the Annual General Meeting of Shareholders, employee representatives on the Supervisory Board – as all other members of the Supervisory Board – are prohibited from exercising the voting rights associated with their shares.
Information Concerning takeovers
116 Combined Management Report
– Material agreements with provisions that take effect in the event of a change of control following a takeover bid: SAP AG has concluded the following material agreements with provisions that take effect in the event of a change of control, whether following a takeover bid or otherwise: The terms of SAP’s syndicated €2 billion revolving credit facility include a change-of-control clause. For more infor-mation about this syndicated credit facility, see the Notes to the Consolidated Financial Statements section, Note (25). This clause obliges SAP AG to notify the banks in case of a change of control. If, on receiving the notification, banks that represent at least two-thirds of the credit volume so require, the banks have the right to cancel the credit facility and demand complete repayment of the outstanding debt. If no continuation agreement is reached, the credit facility would end and the obligation to repay would become effective at an ascertainable time. The terms of the German promissory notes totaling €86 million include a change-of-control clause. For more information about these German promissory notes, see the Notes to the Consolidated Financial Statements section, Note (17b). The clause gives the lenders special termination rights in case of a change of control. If no continuation agreement is reached within 30 days after a change of control, the lenders would be entitled to declare the loan due and demand repayment of the outstanding debt without delay. In agreements between SAP AG and various banks for bilateral credit facilities that totaled €487 million on December 31, 2013, we have agreed customary material adverse change clauses permitting the banks to terminate if events occur that are materially adverse to the economic standing of SAP AG, which may possibly also include a change of control. In the past, we have drawn on these bilateral credit facilities only infrequently and only for a few days. We believe that in view of our current liquidity situation, termination of these credit facilities would not have a material adverse effect, at least in the near term.
– powers of the executive Board to issue and repurchase shares: The Annual General Meeting of Shareholders on May 25, 2011, granted powers to the Executive Board, subject to the consent of the Supervisory Board, to issue convertible and warrant-linked bonds and to grant conversion and option rights in respect of SAP AG shares representing a total attributable portion of the share capital of not more than €100 million secured by a corresponding amount of contingent capital. These powers will expire on May 24, 2016. The Executive Board is also authorized until June 7, 2015, to increase the share capital by not more than €250 million by issuing new shares against contributions in cash and to increase the share capital by not more than €250 million by issuing new shares against contributions in cash or in kind. For more details about the different tranches of authorized capital and the aforementioned contingent capital, see the Articles of Incorporation, section 4. The Annual General Meeting of Shareholders on June 4, 2013, granted a power to the Executive Board in accordance with the German Stock Corporation Act, section 71 (1)(8), to buy back for treasury on or before June 3, 2018, SAP AG shares attributable in total to not more than €120 million of the share capital. The power is subject to the proviso that the shares repurchased, together with any shares that were previously acquired and are still held by SAP in treasury and any other shares controlled by SAP, must not in total exceed 10% of SAP’s share capital. Executive Board powers, such as those described to issue and repurchase stock and to grant rights of conversion and subscription to shares of SAP, are widely followed common practice among German companies like SAP. They give the Executive Board the flexibility it needs, in particular the options to use SAP shares as consideration in equity investments, raise funds on the financial markets at short notice on favorable terms, or return value to shareholders during the course of the year. To service the SMP, which is an employee stock plan we established in 2010, the Executive Board is authorized, subject to Supervisory Board consent, to issue to participants of the plan new shares until June 7, 2015. This authorized capital has been used for plan tranches in 2010, 2011, and 2012 (but not in 2013), and on December 31, 2013, it empowered the Company to issue new shares representing a total attributable portion of the share capital of not more than €29,609,256.
117Information Concerning takeovers

We have entered into relationships with other companies to jointly develop and market new software products. These relationships are governed by development and marketing agreements with the respective companies. Some of the agreements include provisions that, in the event of a change of control over one of the parties, give the other party a right to consent to the assignment of the agreement or to terminate it.
– agreements to compensate members of the executive Board or the employees in the event of a takeover bid: Agreements have been concluded with the members of the Executive Board concerning compensation in the event of a change of control. These agreements, which are customary in Germany and elsewhere, are described in the Compensation Report that is an integral part of this management report. We have no analogous compensation agreements with other employees.
SAP issued two bonds in 2010, each in two tranches of different tenures, totaling €2.2 billion. In 2012, SAP set up a Debt Issuance Program under which a first tranche of Eurobonds in the amount of €1.3 billion was issued. In 2013, a new €4 billion Debt Issuance Program was set up under which no bonds were issued until December 31, 2013. For more information about these bonds, see the Notes to the Consolidated Financial Statements section, Note (17b). Under the terms agreed with the buyers, we are required to notify the buyers of any change of control without delay. If there is a change of control and SAP is consequently assigned a lower credit rating within a defined period, buyers are entitled to demand repayment. We currently do not have a credit rating with any agency. In case that condition persists in a change of control event, an early redemption would only be triggered if no rating agency assigns a credit rating during the change of control period.
Under the terms of our U.S. private placements totaling US$2.65 billion, we are required to offer lenders repayment of outstanding debt if there is a change of control and SAP is consequently assigned a lower credit rating within a defined period. For more information about these private placements, see the Notes to the Consolidated Financial Statements section, Note (17b). Lenders would have at least 30 days to accept the offer. We currently do not have a credit rating with any agency. In case that condition persists in a change of control event, an early redemption would only be triggered if no rating agency assigns a credit rating during the change of control period.
118 Combined Management Report
SAP AG is the parent company of the Group and earns most of its revenue from software license fees and dividends paid by affiliates. Consequently, the opportunities described below also apply – directly or indirectly – to SAP AG. Insights and conclusions apply to segments and portfolio.
oppoRtunItIeS
opportunities from positive Development of economic ConditionsEconomic conditions have a clear influence on our business, financial position, profit, and cash flows. Our outlook for 2014 and medium-term prospects are based on future economic conditions and trends, aligned to our corporate growth strategies. Consequently, should the global economy experience a more sustained recovery than is reflected in our outlook, our revenue and profit may exceed our current outlook and medium-term prospects.
We expect strong growth in emerging markets (Brazil, China, the Middle East, and Africa). These markets are prime opportunities for both our established enterprise applications and new offerings. Africa, for example, is on its way to becoming one of the new global economic powerhouses. Stable GDP growth rates are fueled by the continent’s vast natural resources and increasing foreign and African investment in public infrastructure. Software demand is increasing and we expect double-digit growth rates. SAP Africa’s current business performance gives evidence of solid market opportunity and execution capabilities. In addition, customers and partners are actively targeting Africa and demand a stronger SAP presence in the region. As a result, the Board decided to build a targeted strategic growth plan for the continent to provide strategic answers to key opportunities and challenges. The expected impact of this strategy is reflected in our outlook. Additional revenue and profit opportunities may arise over the course of 2014.
Market dynamics are shifting rapidly as in-memory and cloud computing are being adopted in enterprise IT. Our customers rely on SAP as the trusted advisor to successfully lead this transition not only towards in-memory computing and the cloud, but also towards driving new business outcomes and enabling business model innovations. To meet these expectations we must grow consistently and accelerate the pace of our business transformation by leveraging the right innovation and exploiting new opportunities.
We have established a framework for opportunity management by evaluating and analyzing four key areas: current markets, competitive landscapes, external scenarios, and technological trends. Furthermore, we have delved into customer product segmentation, growth drivers and industry-specific success factors. These combined insights help the Executive Board define market strategies for future consideration.
Our shareholder value relies heavily upon a fine balance of awareness between risk mitigation and value-driven opportuni-ties. Therefore, our strong governance model ensures that decisions are based on return, investment required, and risk mitigation. More importantly, these decisions rely on the talent and resources within SAP’s entire ecosystem, extending even to our partner relationships. Without these core assets, it would not be possible to successfully deliver innovation to our customers in a consumable, inspiring, and sustainable way.
As far as opportunities are likely to occur, we have incorporated them into our business plans, our outlook for 2014, and our medium-term prospects outlined later in this report. The following section therefore focuses on future trends or events that might result in a departure from our outlook and medium-term prospects that are positive for SAP.
opportunity report
119opportunity report

Opportunities from Our Strategy for Profitable GrowthOur strategy influences our business, financial position, profit, and cash flows. Our mission is to deliver profitable growth across our portfolio of products, solutions, and services. We will continue to expand our addressable market to US$350 billion in 2020, compared to US$110 billion in 2010.
We see opportunities in new product and market areas, such as in-memory, cloud, mobile, digital marketing, social media, machine-to-machine, and predictive analytics. We are entering into these areas through organic development as well as acquisitions. We also seek to establish new business models and leverage our expanding ecosystem of partners to maximize these opportunities.
In addition, our core business applications continue to offer solid multi-year growth opportunities as we bring innovative technologies with simplified consumption to our installed base and continue to add net new customers.
Successful performance relies on our pace of innovation. SAP is now taking market share in our targeted market categories and creating new opportunities to increase the business value for our customers. This should allow SAP to add further business value and thus increase the share of our customers’ IT spending.
Unexpected portfolio growth may positively impact our revenue, profit, and cash flows and result in exceeding our stated out-look and medium-term prospects. Specifically, SAP HANA and our cloud offerings could create even more demand than is reflected in our stated outlook and medium-term prospects.
For more information about future opportunities for SAP, see the Vision, Mission, and Strategy and Report on Expected Developments sections of this management report.
In addition, we continue to acknowledge the growing demand for prudent management of resources and sustainable business models, both for our customers and for ourselves. In this context, SAP will progress to leverage the technological capabilities to solve more complex problems of humanity.
For more information about future trends in the global econ-omy, the IT market outlook, and the potential influence on SAP, see the Report on Expected Developments section of this management report.
opportunities from Research and Development tractionOur continued growth through innovation is based on our ability to leverage R&D resources effectively. We continue to improve our development processes through design thinking and lean methodologies. We are accelerating innovation cycles and engaging more closely with our customers to ensure accuracy and success.
While speed is a key strength, we also focus on ease of adoption and providing compelling returns. This allows our customers to easily consume technologies and software applications with immediate benefits for their businesses. If we make innovations available faster than currently anticipated, or if customers adopt the innovations faster than currently expected, this could positively impact our revenue, profit, and cash flows and result in exceeding our stated outlook and medium-term prospects.
For more information about future opportunities in research and development for SAP, see the Research and Development and Report on Expected Developments sections of this management report.
120 Combined Management Report
Our outlook and medium-term prospects are based on certain assumptions regarding employee productivity and engagement. If the actual employee productivity exceeds these assumptions, it would positively impact our revenue, profit, and cash flows and result in exceeding our stated medium-term prospects.
For more information about future opportunities from our employees, see the Employees section of this management report.
opportunities from our Customer engagementSAP goes to market by region, customer segments, line of business, and industry. We evolve and invest in our go-to- market coverage model to effectively sell industry-specific solutions while increasing our engagement with customers. We focus on the dynamic and fast-changing landscape each industry faces as technology evolves. We offer unique services that significantly drive a return on investment, and continue to actively look at new opportunities to increase the value we deliver to our customers. Our outlook and medium-term prospects are based on certain assumptions regarding the success of our go-to-market approaches. If the actual go-to-market success exceeds these assumptions, this would positively impact our revenue, profit, and cash flows, and result in exceeding our stated medium-term prospects.
opportunities from our partner ecosystemSAP continues to grow and develop a global partner ecosys-tem. In order to increase market coverage, we want to enhance our portfolio and spur innovation with the specified objective of increasing the partner revenue contribution to SAP’s overall revenue target. In addition to strengthening our core, we will leverage our entire ecosystem to drive adoption of SAP HANA and cloud solutions as well. As a result, we are creating an ever-stronger setup, where we, along with our customers and partners, co-innovate and develop new innovative solutions on top of SAP HANA. Our unrivaled partner ecosystem is essential for making SAP HANA the industry’s real-time in-memory platform of the future.
Should the business of our partners develop better than currently expected, our indirect sales (partner revenue) could grow stronger than reflected in our outlook and medium-term prospects. This may positively impact our revenue, profit, and cash flows and result in exceeding our stated medium-term prospects.
For more information about opportunities arising from our partner ecosystem, see the Partner Ecosystem and Report on Expected Developments sections of this management report.
opportunities from our employeesOur employees drive our innovation, are the value to our customers, and consistently promote our growth and profit-ability. In 2013, we increased the number of full-time employees, especially in sales roles to capture growth opportunities. We anticipate improvements in employee productivity as a result of our continued endeavors in design-thinking principles. As described in the Employees section, we also run programs that aim to increase engagement, collaboration, and social innovation.
To ensure continuous innovation and sustained business success, we need to continuously bring the best and brightest talent to SAP. To do so, we will further strengthen our brand perception in the market and optimize our recruiting experience to emphasize our focus on improving people’s lives. Furthermore, we will maximize mobile channels and innovative talent strategies to tap into new talent pools.
121opportunity report
Our risk management system is based on five pillars, comprising a dedicated risk management policy and a standardized risk management methodology followed by a global risk manage-ment organization. The internal control system comprises the internal control and risk management system for financial reporting (ICRMFR) that also covers the broader business environment. In 2013, we implemented continuous control monitoring and continuous auditing in selected areas. Using the Committee of Sponsoring Organizations of the Treadway Commission (COSO) framework, we define and cover internal controls all along the value chain on a process and subprocess level to assure that sound business objectives are set in line with the organization’s strategic, operational, financial, and compliance goals. In addition, we have a governance model in place across risk management and the internal control system to ensure both systems are effective, as well as a central software solution to store, maintain, and report all risk-relevant information.
RISk MAnAGeMent polICy AnD FRAMeWoRkThe risk management policy issued by the Executive Board governs how we handle risk in line with the Company’s risk appetite and defines a methodology that is applied uniformly across all parts of the Group. The policy stipulates who is responsible for conducting risk management activities and defines reporting and monitoring structures. We routinely review and update the policy as necessary. Our global corporate audit function conducts regular audits to assess the effectiveness of our risk management system. Every year, SAP’s external auditor assesses if the early risk identification system is adequate to identify risks that may endanger the Group’s ability to continue as a going concern. SAP’s enterprise risk management follows COSO II (integrated framework for enterprise risk management) and covers risks in the areas of strategy, operational business, financial reporting, and compliance. As of today, the risk management system analyzes risks and only assesses or analyzes opportunities where deemed appropriate.
InteRnAl ContRol AnD RISk MAnAGeMent SySteMAs a global company, SAP is exposed to a wide variety of risks across our range of business operations. As a consequence, the Executive Board has put comprehensive risk management and internal control structures into place that enable SAP to identify and analyze risks early on and take appropriate action. Our risk management and internal control system is designed to identify potential events that could negatively impact the Company and to provide reasonable assurance regarding the achievement of the Company objectives, specifically our ability to achieve our financial, operational, or strategic goals as planned.
This system comprises multiple control mechanisms and is an important element of the corporate decision-making process; it is therefore implemented as an integral part of SAP’s business processes across the entire Group. Ensuring that our global risk management efforts are effective and enable us to aggregate risks and report on them transparently, we have adopted an integrated risk management and internal control approach.
SAP AG is a stock corporation domiciled in Germany and issues securities that are listed on the stock exchanges in Frankfurt, Berlin, and Stuttgart, in Germany, as well as on the New York Stock Exchange, in the United States. We are therefore subject to both German and U.S. regulatory requirements that relate to risk management and internal controls over financial report-ing, such as provisions in the German Stock Corporation Act, section 91 (2), and the U.S. Sarbanes-Oxley Act (SOX) of 2002, section 404. The Executive Board has established an early warning system (risk management system) to ensure compliance with applicable regulations and for the effective management of risks.
risk report
122 Combined Management Report

probability/likelihood of occurrence Description1 to 19 % Remote
20 to 39 % Unlikely
40 to 59 % Likely
60 to 79 % Highly Likely
80 to 99 % Near Certainty
In this framework, we define a remote risk as one that will occur only under exceptional circumstances and a near certain risk as one that can be expected to occur within the specified time horizon. The period for analyzing our risks is at least the used forecast period. The period for analyzing our risks that could be possible threats to the Group’s ability to continue as a going concern, is eight rolling quarters.
Impact level Impact DefinitionInsignificant Negligible negative impact on business, financial position,
profit, and cash flows
Minor Limited negative impact on business, financial position, profit, and cash flows
Moderate Some potential negative impact on business, financial position, profit, and cash flows
Major Considerable negative impact on business, financial position, profit, and cash flows
Business- critical
Detrimental negative impact on business, financial position, profit, and cash flows
Based on the likelihood that a risk will occur as well as the impact the risk would have on SAP’s reputation, business, financial position, profit, and cash flow leads us to classify the risks as “high,” “medium,” or “low.”
RISk MAnAGeMent MethoDoloGy AnD RepoRtInGThe following sections describe the key content elements of the risk management process as part of SAP policy: risk planning, identification, analysis, response, and monitoring.Risk planning and risk identification for both internal and external risks are conducted in cooperation between risk managers and the business units or subsidiaries across the Group. We use various techniques to identify risks. For example, we have identified risk indicators and developed a comprehensive risk catalog that includes risk mitigation strategies for known product and project risks. Risk identification takes place at various levels of the Company to ensure that common risk trends are identified and end-to-end risk management across organizational borders is enabled. We apply both qualitative and quantitative risk analysis as well as other risk analysis methods such as sensitivity analyses and simulation techniques.
To determine which risks pose the highest threat to the viability of the Group, we classify them as “high,” “medium,” or “low” based on the likelihood that a risk will occur within the assessment horizon as well as the impact the risk would have on SAP’s business objectives if it were realized. The scales for measuring these two indicators are given in the following tables.
123risk report

All identified and relevant risks are reported at the local, regional, and global levels in accordance with our risk management policy. At local, regional, and global levels, we have established executive risk councils that regularly discuss risks and countermeasures and that monitor the success of risk mitigation. In addition, the Executive Board and Global Managing Board are informed quarterly about individual risks based on clearly defined reporting criteria. Newly identified or existing significant risks that are above a defined threshold or with a potential significant impact are also reported to the chairperson of the Supervisory Board and to the chairperson of the Audit Committee of the Supervisory Board. This includes any potential going concern risks.
We also have a process in place that analyzes those risks with respect to potential effects on liquidity, excessive indebtedness, and insolvency, which could be possible threats to the Group’s ability to continue as a going concern.
Risk analysis is followed by risk response and risk monitoring. Our risk managers work in close cooperation with the business owners, ensuring that effective strategies are implemented to address risks. Risks may be reduced by taking active steps based on risk approval. Business owners are responsible for continuously monitoring the risks and the effectiveness of mitigation strategies, with support from the respective risk managers. To provide greater risk transparency and enable appropriate decision making for business owners, we have established a risk delegation of authority (RDOA) for relevant parts of the organization as deemed appropriate. RDOA is a risk management decision-making hierarchy that helps busi-ness owners gain timely insight into SAP’s riskiest projects and processes, so they are better able to review the relevant information, understand the risk profile and associated mitigation strategies, and determine if their approval is warranted. Depending on the exposure, approval is required at different levels of the Company, up to and including the Executive Board.
probability
80–99% l M h h h
60–79% l M M h h
40–59% l l M M h
20–39% l l l M M
1–19% l l l l M
Insignificant Minor Moderate Major Business-Critical
Impacth = High riskM = Medium riskl = Low risk
124 Combined Management Report

For hybris, risk management activities are performed by the chief financial officer and the head of internal controls, internal audit, and risk management based on their particular area. GRC risk managers are responsible for supporting and monitoring the implementation of risk management across the Group that is both effective and compliant with regulatory requirements and SAP’s global risk management policy. Based on SAP’s risk management policy, all risks and risk-related matters have to be reported to the Global GRC organization, and from an organizational perspective, all risk managers (except for hybris) report to the Global GRC organization.
The head of Global GRC, together with the corresponding function within SAP’s acquired companies (such as hybris), is responsible for SAP’s internal control and risk management program, and provides regular updates to the Audit Committee of the Supervisory Board. The overall risk profile of the Group is consolidated by the head of Global GRC, who reports to the head of Global Finance, who is a member of the Global Managing Board and reports to the CFO.
InteRnAl ContRol AnD RISk MAnAGeMent SySteM FoR FInAnCIAl RepoRtInG By the GRoup The purpose of a company’s system of internal control over financial reporting is to ensure with sufficient certainty that its financial reporting is reliable and in compliance with applicable generally accepted accounting principles. Because of the inherent limitations of internal control over financial reporting, it may not prevent or bring to light all potential misstatements in our financial statements.
RISk MAnAGeMent oRGAnIzAtIonOur risk management organization ensures the coverage of the functions of risk management governance, strategic, operational, financial, and compliance risk management, with regard to SAP targets. The Global Governance, Risk & Compliance (GRC) organization comprises a group-wide governance function, which includes regular maintenance and implementation of our risk management policy. The uniform process model comprises all essential elements of risk management: risk planning, risk identification, risk analysis, risk response, and risk monitoring. This function is also responsible for standardized risk reporting to risk committees at different levels of the Company, including the Executive Board and Global Managing Board as well as the chairpersons of the Supervisory Board and the Audit Committee.
Our strategic risk management function is responsible for enabling early identification and mitigation of risks that could threaten the successful execution of SAP’s strategic objectives. It also supports the successful execution of our corporate strategy by creating transparency regarding risks that could threaten commercial interests or intangible assets such as corporate or product reputation and brand image.
Operational and financial risk management is uniformly implemented at SAP. GRC risk managers independent of the business are assigned to each of SAP’s important business units and business activities and to selected strategic initiatives. All GRC risk managers, together with assigned risk contacts in the business units, continuously identify and assess risks associated with material business operations using a uniform approach and monitor the implementation and effectiveness of the measures chosen to mitigate risks. Further financial risk management activities are performed by our Global Treasury function.
125risk report
The Corporate Financial Reporting department conducts all of SAP’s financial consolidation. We outsource some work, such as valuing projected benefit obligations and share-based payment obligations, as well as purchase price allocations in the context of asset acquisitions and business combinations. The employees who work on SAP’s financial reporting receive training in the policies and processes.
A committee chaired by the head of Global Finance and member of the Global Managing Board, proposes the assessment results on the effectiveness of the ICRMSFR each year as of December 31 to the Group CFO based on an analysis of the design and operating effectiveness of our internal controls over financial reporting. The committee meets regularly to set the annual scope for the test of effectiveness, to evaluate any possible weaknesses in the controls, and to determine measures to address them adequately. During its own meetings, the Audit Committee of the Supervisory Board regularly scrutinizes the resulting assessments of the effectiveness of the internal controls with respect to the IFRS Consolidated Financial Statements.
Its assessment of the effectiveness of SAP’s internal controls over financial reporting was that on December 31, 2013, the Group has an effective internal control system over financial reporting.
RISk MAnAGeMent AnD InteRnAl ContRol GoVeRnAnCeThe Executive Board is responsible for ensuring the effectiveness of the risk management and internal control system. The effectiveness of both systems and their implementation in the different Executive Board areas is monitored by each board member. Our Group CFO regularly provides a status on the risk management and the internal control system to the Audit Committee. Key risks are reported quarterly to the chairpersons of the Supervisory Board and the Audit Committee. The Audit Committee of the Supervisory Board regularly monitors the effectiveness of SAP’s risk management and internal control system. In this regard, they requested the Corporate Audit
SAP’s internal control and risk management system for financial reporting (ICRMSFR) is based on our Group-wide risk management methodology. The ICRMSFR includes organizational, control, and monitoring structures designed to ensure that data and information concerning our business is collected, compiled, and analyzed in accordance with applicable laws and properly reflected in the IFRS Consolidated Financial Statements as well as in the stand-alone financial statements of SAP subsidiaries according to local GAAP.
Our ICRMSFR also includes policies, procedures, and measures designed to ensure compliance of SAP’s financial reports with applicable law and standards. We analyze new statutes, standards, and other pronouncements, as failure to implement them would present a substantial risk to the compliance of our financial reporting. Finally, the ICRMSFR has both preventive and detective controls, including, for example, automated and non-automated reconciliations, segregated duties with two-person responsibility, authorization concepts in our software systems, and monitoring.
Our Corporate Financial Reporting department codifies all accounting policies in the Group Accounting and Global Revenue Recognition Guidelines. These policies and the corporate closing schedule together define the closing process. Under this closing process all affiliates prepare, partly supported by centralized and outsourced services, their financial statements for consolidation by our Corporate Financial Reporting office. The corporate financial reporting department and other corporate departments assist the local subsidiaries’ efforts to comply with Group accounting policies and monitor their work. Our corporate audit function and Corporate Financial Reporting department conduct financial statement audits of SAP subsidiaries.
126 Combined Management Report
economic, political, Social, and Regulatory Risk
Uncertainty in the global economy, financial markets, or political conditions could have a negative impact on our business, financial position, profit, and cash flows, and put pressure on our operating profit.
Our business is influenced by multiple risk factors that are both difficult to predict and beyond our influence and control. These factors include global economic and business conditions and fluctuations in national currencies. Other examples are political developments and general regulations, as well as budgetary constraints or shifts in spending priorities of national governments.
Macroeconomic developments, such as a global economic crisis, chronic fiscal imbalances and slowing economic conditions in emerging markets, might decrease the ability of our customers to invest in our solutions. In addition, changes in the euro rates for particular currencies might have an adverse effect on business activities with local customers and partners. All of this could have an adverse effect on our business results, financial condition, profitability or expected growth, and could have an adverse effect on our stock price. Furthermore, political instabilities in regions such as the Middle East and Africa, and natural disasters, contribute to economic and political uncertainty that could also have an adverse effect on our business results, financial condition, profitability, and expected growth.
This could have an adverse effect on our customers’ ability and willingness to make investments in our products and services. These events could reduce the demand for SAP software and services, and lead to:
department to regularly audit various aspects of the risk management system and its effectiveness. Additional reassurance will be obtained through the external audit of the effectiveness of our internal control system over financial reporting and the internal warning system. SoFtWARe SolutIonWe use our own risk management software (SAP solutions for GRC) to effectively support the governance process. Risk managers record and address identified risks using our risk management software to create transparency across all known risks that exist in the Group, as well as to facilitate risk management and the associated risk reporting. This information is available to managers through a mobile app as well as regularly issued reports, and is consolidated and aggregated for the quarterly report to the Executive Board and the Global Managing Board. The solution also supports the risk-based approach of SAP’s internal control and risk management system for financial reporting (ICRMSFR).
RISk FACtoRSThe following sections outline risk factors that we identify and track using our risk management software (SAP solutions for GRC). They are presented below at a more aggregated level as compared to their use in internal controlling, but are broken down by the same risk categories we also use in our internal risk management system reporting structure. All described risks are applicable to different extent to all of our segments (On-Premise Products, On-Premise Services, Cloud Applications, and Ariba) unless otherwise noted.
SAP AG is the parent company of the SAP Group. Consequently, the risks described below also apply – directly or indirectly – to SAP AG.
127risk report
our international business activities expose us to numerous and sometimes even conflicting regulatory requirements, and to risks that could harm our business, financial position, profit, and cash flows.
We are a global company and currently market our products and services in more than 180 countries and territories in the Americas (including Latin America and North America), APJ, and EMEA regions. Our business in these countries is subject to numerous risks inherent in international business operations. Among others, these risks include:– Conflict and overlap among tax regimes– Possible tax constraints impeding business operations in
certain countries– Expenses associated with the localization of our products
and compliance with local regulatory requirements– Discriminatory or conflicting fiscal policies– Operational difficulties in countries with a high corruption
perception index– Protectionist trade policies and regulations for import and
export– Works councils, labor unions, and immigration laws in
different countries– Data protection and privacy in regard to access by govern-
ment authorities to customer, partner, or employee data– Difficulties enforcing intellectual property and contractual
rights in certain jurisdictions– Country-specific software certification requirements
As we expand further into new countries and markets, these risks could intensify. The compliance with applicable laws and regulations to our business is sometimes unclear, subject to change over time, and sometimes may conflict between different jurisdictions. Additionally these laws and governments’ approach to enforcement, as well as our products and services, are continuing to change and evolve. Compliance with these types of regulation may involve significant costs or require changes in products or business practices. Non-compliance could result in penalties being imposed on us or orders that we stop the alleged noncompliant activity. One or more of these factors could have an adverse effect on our operations globally or in one or more countries or regions, which could have an adverse effect on our business, financial position, profit, and cash flows.
– Delays in purchases, decreased deal size, or cancelations of proposed investments
– Higher credit barriers for customers, reducing their ability to finance software purchases
– Increased number of bankruptcies among customers, business partners, and key suppliers
– Increased default risk, which may lead to significant impairment charges in the future
– Market disruption from aggressive competitive behavior, acquisitions, or business practices
– Increased price competition and demand for cheaper product and services
This could have an adverse effect on our business, financial position, profit, and cash flows.
SAP has established measures and dedicated task forces to address and mitigate the described risks and adverse effects to the extent possible. We offer our customers standard software and product packages that are fast and easy to install, as well as attractive financing models. Furthermore, we continue to apply cost discipline internally and have a conservative financial planning policy. Additionally, SAP is continuously reshaping our organizational structure and processes to increase efficiency.
We estimate the probability of occurrence of this risk to be likely. Therefore, we cannot completely exclude the possibility of it having a business-critical impact on our business, financial position, profit, and cash flows. This could exacerbate the other risks we describe in this report or cause a negative deviation from our revenue and operating profit target. We classify this risk as a high risk.
128 Combined Management Report
To protect our key IT infrastructure, critical business systems, and processes from material adverse effects in crisis situations, disaster recovery and business continuity plans have been developed that include implementation of data redundancies and daily data backup strategies. To verify and improve our approach, our Global IT organization has been certified to the internationally recognized ISO 22301:2013 (Business Continuity Management) standard. In addition, our corporate head-quarters, which includes certain critical business functions, is located in the German state of Baden-Wuerttemberg. This area has historically been free of natural disasters.
We believe that the likelihood of this risk materializing is remote; however, we cannot exclude the possibility of such a risk occurring and having a business-critical impact on our reputation, business, financial position, profit, and cash flows, or causing a negative deviation from our revenue and operating profit target. We classify this risk as a medium risk. Market Risks
our established customers might not buy additional software solutions, renew maintenance agreements, purchase additional professional services, or they might switch to other products or service offerings (including competitive products).
In 2013, we offered a wide range of support services including SAP MaxAttention, SAP Enterprise Support, and SAP Product Support for Large Enterprises. We continue to depend materially on the success of our support portfolio and on our ability to deliver high-quality services. Traditionally, our large installed customer base generates additional new software, maintenance, consulting, and training revenue. Existing customers might cancel or not renew their maintenance contracts, decide not to
We address these risks with various measures depending on the circumstances, including, for example, a strong legal and compliance office presence in the main countries, maintaining an effective Data Protection and Privacy Office and associated policy, receiving guidance from external economics consultants, law firms, tax advisors, and authorities in the concerned countries, and taking legal actions.
Although we estimate the probability of occurrence of this risk to be unlikely, we cannot completely exclude the possibility that this risk could have a major impact on our business, financial position, profit, and cash flows, or cause a negative deviation from our revenue and operating profit target. We classify this risk as a medium risk. social and political instability caused by state-based conflicts, terrorist attacks, civil unrest, war, or international hostilities, as well as pandemic disease outbreaks or natural disasters, may disrupt sap’s business operations.
Terrorist attacks and other acts of violence or war, civil and political unrest (such as in the Middle East and parts of Africa), or natural disasters (such as hurricanes, flooding, or similar events) could have a significant adverse effect on the related economy or beyond. Such an event could lead, for example, to the loss of a significant number of our employees, or to the disruption or disablement of operations at our locations, and could affect our ability to provide business services and maintain effective business operations. Furthermore, this could have a significant adverse effect on our partners as well as our customers and their investment decisions, which could have an adverse effect on our reputation, business, financial position, profit, and cash flows. Our mitigation measures have been designed and imple-mented to minimize such adverse effects. To ensure continuous operations of all critical business processes, we have been implementing and operating a worldwide business continuity management and crisis management system. To enable effective response and minimize possible losses in case of crisis situations, we have installed local crisis management teams at our main locations, supplemented by regional crisis man-agement teams for the Americas (including Latin America and North America), APJ, and EMEA regions, and a global crisis management team.
129risk report

Other factors that could affect the market acceptance of cloud solutions include:– Concerns with entrusting a third party to store and manage
critical employee or company confidential data– Customer concerns about security capabilities and reliability– Customer concerns about the ability to scale operations for
large enterprise customers– The level of configurability or customizability of the software– Missing integration scenarios between on-premise products
and cloud-to-cloud solutions
If organizations do not perceive the benefits of cloud computing, the market for cloud business might not develop further, or it may develop more slowly than we expect, either of which could have an adverse effect on our business, financial position, profit, reputation and cash flows.
Among measures to communicate and demonstrate the value and the benefits of our cloud solutions to the market, we significantly invest in infrastructure and processes that ensure secure operations of our cloud solutions including compliance with all local legal regulations regarding data protection and privacy as well as data security. Although we estimate the probability of occurrence of this risk to be unlikely, we cannot completely exclude the possibility that this risk could have a business-critical impact on our reputation, business, financial position, profit, and cash flows, or cause a negative deviation from our revenue and operating profit target. We classify the risk as a medium risk. This risk factor relates only to the Cloud Applications and Ariba segments.
buy additional products and services, switch to subscription models, or accept alternative offerings from other vendors, which could have an adverse effect on our maintenance business, financial position, profit, and cash flows. Working closely with SAP user groups, we continuously monitor the performance and the perceived value of our support and the satisfaction of our customers. We implement mitigating steps where required.
We estimate the probability of this risk materializing to be remote, but we cannot completely exclude the possibility that it could have a business-critical impact on our business, financial position, profit, and cash flows, or cause a negative deviation from our revenue and operating profit target. Overall, we classify this risk as medium risk. This risk factor relates only to our On-Premise Product and On-Premise Services segments. the success of our cloud computing strategy depends on an increasing market adoption of the cloud solutions and managed cloud services. Insufficient adoption of our solutions and services could lead to a loss of sap’s position as a leading cloud company.
The market for cloud computing is increasing and shows strong growth relative to the market for our on-premise solutions. To offer a broad cloud service portfolio and generate the associ-ated business value for our customers, we have acquired cloud computing companies such as SuccessFactors and Ariba. Due to ongoing contracts and previous substantial investments to integrate traditional on-premise enterprise software into their businesses, customers and partners might be reluctant or unwilling to migrate to the cloud.
130 Combined Management Report
Business Strategy Risks
demand for our new solutions may not develop as planned and our strategy on new business models and flexible consumption models may not be successful.
Our software business consists of new software licenses, software license updates, and support and maintenance fees, as well as of cloud software subscriptions. Our customers are looking to take advantage of technological breakthroughs from SAP without compromising their previous IT investments. However, the introduction of new SAP solutions, technologies, and business models are subject to uncertainties as to whether customers will be able to realize the expected benefits. Uncertainty may lead customers to wait for reference customers first, which might result in a lower level of adoption of our new solutions, technologies, business models and flexible consumption models, or no adoption at all. This could have an adverse effect on our business, financial position, profit, and cash flows. To mitigate this risk, SAP is balancing the distribution of its strategic investments by evolving and protecting its core businesses and simultaneously developing new solutions, technologies, and business models for markets, such as mobile, cloud, database and technology, and social media. Furthermore, we focus on the design and provision of attractive solution offers to our customers as well as the provision of support excellence to ensure customer satisfaction with and after the implementation of our solution.
Our market share and profit could decline due to increased competition, market consolidation and technological innovation, and new business models in the software industry.
The software industry continues to evolve rapidly and is currently undergoing a significant shift due to innovations in the areas of mobile, Big Data, cloud computing, and social media. While smaller innovative companies tend to create new markets continuously, large traditional IT vendors tend to enter such markets mostly through acquisitions.
SAP faces increased competition in its business environment from traditional as well as new competitors. This could result in increased price pressure, cost increases, and loss of market share, which could have an adverse effect on our business, financial position, profit, and cash flows. Additionally customers could change their buying behavior by accelerating their acceptance of cloud solutions to reduce their investments. Furthermore, the trend in the market to invest more in cloud solutions might lead to a risk related to the potential loss of existing on-premise customers. It may also have a temporary adverse effect on our revenue due to conversions from on-premise licenses to cloud subscriptions from existing SAP customers in our installed base. We believe we will be able to protect our leadership in the market if we continue to execute successfully on our customer-centric innovation strategy, which is driven by a mix of organic growth, targeted acquisitions, and attractive cloud solution offerings. To compete successfully in the market, we continuously enhance our global processes and adjust our organizational structures.
Although we estimate the probability of occurrence of this risk to be unlikely, we cannot completely exclude the possibility that this risk could have a moderate impact on our business, financial position, profit, and cash flows, or cause a negative deviation from our revenue and operating profit target. We classify this risk as a low risk.
131risk report

Our customers’ renewal rates may decline or fluctuate as a result of a number of factors, including their satisfaction or dissatisfaction with our cloud product portfolio, our customer support, concerns on efficient and secure cloud operations and in compliance with legal and regulatory requirements, our pricing, the prices of competing products or services, mergers and acquisitions affecting our customer base, the effects of global economic conditions, or reductions in our customers’ spending levels. If our customers do not renew their subscriptions, renew on less favorable terms, or fail to purchase additional modules or users, our revenue and billings may decline, and we may not realize significantly improved operating results from our customer base. This could have an adverse effect on our business, financial position, profit, and cash flows.
In order to continuously improve our services we closely monitor any issue and work together with customers to perform a root cause analysis and provide a solution. Furthermore, we are adapting cloud service delivery to local and/or specific market requirements such as local or regional data centers.
Although we estimate the probability of occurrence of this risk to be remote, we cannot completely exclude the possibility that this risk could have a major impact on our business, financial position, profit, and cash flows, or cause a negative deviation from our revenue and operating profit target. We classify this risk as a low risk. This risk factor relates only to our Cloud Applications and Ariba segments.
If we are unable to scale and enhance an effective partner ecosystem, increased revenue already included in our forecast might be endangered.
An open and vibrant partner ecosystem is a fundamental pillar of our success and growth strategy. We have entered into partnership agreements that drive co-innovation on our platforms, profitably expand all our routes-to-market to optimize market coverage, and provide high-quality services capacity in all market segments. Partners play a key role in driving market adoption of our entire solutions portfolio, by co-innovating on our platforms, embedding our technology, and reselling and/or implementing our software.
We estimate the probability of occurrence of this risk to be remote, but cannot completely exclude the possibility that this risk could have a major impact on our business, financial position, profit, and cash flows, or cause a negative deviation from our revenue and operating profit target. We classify this risk as a low risk. our Cloud organization recognizes subscription and support revenue from our customers over the term of their agreements, and our business depends substantially on customers renewing their agreements and purchasing additional modules or user licenses from sap as a cloud provider. also, any downturns or upturns in cloud sales may not be immediately reflected in our operating results, and any decline in our customer renewals would harm the future operating results of the cloud business.
We recognize cloud subscription and support revenue over the duration of our cloud business customer agreements, which typically range from one to three years with some up to five years. As a result, most of the respective revenue recognized in a given period originates from agreements entered into in earlier periods. Consequently, a shortfall in demand for our cloud portfolio in any period may not significantly impact our cloud subscription and support revenue for that quarter, but could have an adverse effect on targeted cloud subscription and support revenue in future periods.
To maintain or improve our operating results in the cloud business, it is important that our customers renew their agreements with us when the initial contract term expires and purchase additional modules or additional users. Our customers have no obligation to renew their subscriptions after the initial subscription period, and we cannot assure that customers will renew subscriptions at the same or at a higher level of service, or at all.
132 Combined Management Report

Although we consider this risk to be unlikely in view of our partner strategy, we cannot exclude the possibility that this risk could have a major impact on our reputation, business, financial position, profit, and cash flows, or cause a negative deviation from our revenue and operating profit target if it were to materialize. We classify this risk as a medium risk. human Capital Risks
If we do not effectively manage our geographically dispersed workforce, we may not be able to run our business efficiently and successfully.
Our success is dependent on appropriate alignment of our internal and external workforce planning processes and our location strategy with our general strategy. It is critical that we manage our internationally dispersed workforce effectively, taking short and long-term workforce and skill requirements into consideration. This applies to the management of our internal as well as our external workforce. Changes in headcount and infrastructure needs could result in a mismatch between our expenses and revenue. Failure to manage our geographically dispersed workforce effectively could hinder our ability to run our business efficiently and successfully and could have an adverse effect on our business, financial position, profit, and cash flows.
If partners consider our products less strategic and/or financially less attractive or if SAP fails to establish a network of qualified partners that meet our quality requirements and the requirements of our customers, then, among other things, partners might not:– Develop a sufficient number of new solutions and content on
our platforms– Provide high-quality products and services to our customers– Drive growth of references by creating customer use cases
and demo systems – Sufficiently embed our solutions to profitably drive product
adoption, especially with new innovations like SAP HANA– Enable and train sufficient resources to promote sell and
support to scale into targeted markets– Comply with applicable laws and regulations, resulting in
delayed, disrupted, or terminated sales and services – Renew their existing agreements with us or enter into new
agreements on terms acceptable to us or at all.
If one or more of these risks materialize, this may have an adverse effect on the demand for our products and services. As a result we may not be able to scale our business to compete successfully with other software vendors, which could have an adverse effect on our reputation, business, financial position, profit, and cash flows.
SAP continues to invest in long-term, mutually beneficial relationships and agreements with partners. We continue to develop and enhance a wide range of partner programs to retain existing and attract new partners of all types. We offer training opportunities to a wide range of resources for our partners. A thorough certification process for third-party solutions has been designed and established to ensure consistent high-quality and seamless integration.
133risk report
we continue to introduce new and innovative technology offerings and expand our business in emerging markets. Missing or inadequately executed benefit and compensation programs could limit SAP’s ability to attract or retain qualified employees and lead to financial losses. In addition, we might not be able to achieve our internal gender diversity objectives to increase the number of women in management from 18% in 2010 to 25% by 2017. Finally, hiring such personnel could expose us to claims by other companies seeking to prevent their employees from working for a competitor. These risks notwithstanding, we continue to believe our leading market position, employer brand, and extended benefit pro-grams will enable us to hire top talent internationally with the potential to contribute to SAP’s growing business success in the future. We address the risk of an adverse effect on our business operations from a failure to recruit the employees we need or from the loss of leaders and employees by seeking to build employee and leadership strengths through a range of targeted professional development, mentoring, and coaching programs, a gender diversity program, and a special focus on accelerated high-potential employee development that aims to develop talent as well as leadership talent, in particular. A strong focus on succession planning for leadership and key positions seeks for sustainable leadership and to safeguard the business from disruption caused by staff turnover.
Although the risks related to failure to attract, develop, and retain talent could materialize, we believe that this is unlikely and that the impact on our reputation, business, financial position, profit, and cash flows, or potential negative deviation from our revenue and operating profit target would be moderate. We classify this risk as a low risk.
We are focusing on mitigating this risk through a range of activities including succession management; workforce planning (which aims to achieve diversity and the right mix of talent and to take account of demographic changes); outsourcing; external short-term staffing; employer branding; career management (such as offering opportunities for short-term assignments and opportunities to improve skills, competencies, and qualifications); and extended benefit programs – for example, a performance-oriented remuneration system, an employer-financed pension plan in certain countries, and long-term incentive plans.
We estimate this risk to be a remote possibility, but we cannot underestimate its potential to have a major impact on our business, financial position, profit, and cash flows, or cause a negative deviation from our revenue and operating profit target. We classify this risk as a low risk.
If we are unable to attract, develop, and retain leaders and employees with specialized knowledge and technology skills, or are unable to achieve internal diversity and inclusion objectives, we might not be able to manage our operations effectively and successfully, or develop successful new solutions and services.
Our highly qualified workforce is the foundation for our continued success. Competition in our industry for highly skilled and specialized personnel and leaders, both male and female, is intense. In certain regions and specific technology and solution areas, we have set ambitious growth targets, specifically in countries such as Brazil, China, and Russia. If we are unable to identify, attract, develop, motivate, adequately compensate, and retain well-qualified personnel, both male and female, or if existing highly skilled and specialized personnel leave SAP and ready successors or adequate replacements are not available, we may not be able to manage our operations effectively, which could have an adverse effect on our reputation and our business, financial position, profit, and cash flows. Furthermore, we may not be able to develop, sell, or implement successful new solutions and services as planned. This is particularly true as
134 Combined Management Report

tasked with managing our policy-related compliance measures. Our chief compliance officer coordinates policy implementation, training, and enforcement efforts throughout SAP. Those efforts are monitored and tracked to allow trending and risk analysis and to ensure consistent policy application throughout the Group. Despite our comprehensive compliance programs and established internal controls, intentional efforts of individuals to circumvent controls or engage in fraud for personal gains cannot always be prevented.
Although we estimate the likelihood of this risk to be remote, we cannot completely exclude the possibility that this risk could have a major impact on our reputation, business, financial position, profit, and cash flows, or cause a negative deviation from our revenue and operating profit target. We classify this risk as a low risk. Non-compliance with applicable data protection and privacy laws or failure to adequately meet the requirements of sap’s customers with respect to our products and services could lead to civil liabilities and fines, as well as loss of customers and damage to sap’s reputation.
As a global software and service provider, SAP is required to comply with the laws in the locations where SAP does business. SAP and its subsidiaries are facing a surge of data protection and privacy laws and regulations around the world, with further changes to be expected in the future, for example, by the European Data Protection Regulation proposed by the European Commission. These laws and regulations amend and supplement existing requirements regarding the processing of personal data that SAP and SAP customers must fulfill and which we must consequently address with our products and services.
organizational and Governance-Related Risks
Laws and regulatory requirements in Germany, the united states, and elsewhere have become much more stringent.
As a stock corporation domiciled in Germany with securities listed in Germany and the United States, we are subject to German, U.S., and other governance-related regulatory requirements. Changes in laws and regulations and related interpretations, including changes in accounting standards and taxation requirements and increased enforcement actions and penalties may alter the business environment in which we operate. Regulatory requirements have become significantly more stringent in recent years, and some legislation, such as the anticorruption legislation in Germany, the U.S. Foreign Corrupt Practices Act, the UK Bribery Act, and other local laws prohibiting corrupt payments by employees, vendors, distributors, or agents, is being applied more rigorously. Emerging markets are a significant focus of our international growth strategy. The nature of these markets presents a number of inherent risks. A failure by us to comply with applicable laws and regulations, or any related allegations of wrongdoing against us, whether merited or not, could have an adverse effect on our business, financial position, profit, cash flows and reputation. It is difficult to assess the precise potential risk, because there is a wide variety of complex legal and regulatory requirements that apply, and therefore an equally wide variety of potential non-compliance scenarios exist.
However, we continuously monitor new regulatory requirements, updated or new enforcement trends, and publicly available information on compliance issues in the computer software industry, the emerging markets where we invest our resources, and in the business environment in general. Based on this information and any other available sources, we continuously update and refresh our compliance programs to achieve the most effective approach possible and to ensure that our employees understand and comply with the SAP Code of Business Conduct. This process is coordinated by our Global Compliance Office, a team of dedicated resources that are
135risk report
Failure to respond to meet customer, partner, or other stakeholder expectations or generally accepted standards on climate change, energy constraints, and our social investment strategy could negatively impact sap’s business, results of operations, and reputation. Energy and emissions management are an integral component of our holistic management of social, environmental, and economic risks and opportunities. We have identified risks in these major areas:– Our solutions and green IT– Our own operations – energy management and other
environmental issues such as carbon management, water use, and waste
Because our customers, employees, and investors expect a reliable energy and carbon strategy, we have reemphasized our previously communicated targets, especially our 2020 target for greenhouse gas emissions. In addition, our customers might no longer recognize SAP for its environmental leadership and might buy other vendors’ products and services. Consequently, we could fail to achieve our revenue target. If we do not meet stakeholder expectations in the areas identified, our rating in sustainable investment indices might decrease, which could have an adverse effect on our reputation, business, financial position, profit, and cash flows. In recent years, SAP has shown that it is possible to take a proactive position on social and environmental issues while delivering robust financial growth. As a result, we received great recognition for our sustainability efforts. As a proof point for SAP’s sustainability performance, we continue to be listed in the most prominent and recognized sustainability indices, such as the Dow Jones Sustainability Indexes and the Sustainability Leadership Report by Brandlogic. As we did not meet our greenhouse gas emissions target of 460 kilotons for 2013, we might fail to meet expectations regarding our energy and emission performance.
Failure to comply with applicable laws or to adequately address privacy concerns of customers, even if unfounded, could lead to investigations by supervisory authorities, civil liability, fines, (in the future, potentially calculated based on the Company’s annual turnover), loss of customers, damage to our reputation, and could have an adverse effect on our business, financial position, profit, and cash flows.
To mitigate these risks, SAP actively monitors changes to laws and regulations so we can take adequate measures and certify our existing standards and policies on an ongoing basis. We have implemented a wide range of measures to protect data controlled by SAP and our customers from unauthorized access and processing, as well as from accidental loss or destruction. We have implemented a certified Data Protection Management System in data protection critical areas including support, HR, global services, marketing, application innovation, and custom development, whereby implementation is audited internally and externally by the British Standard Institutions on an annual basis. Furthermore, customers are provided with security certifications (such as ISO 27001), security white papers, and reports from our independent auditors and certification bodies.
We estimate this risk to be unlikely, but cannot rule out the possibility of it having a business-critical impact on our business, financial position, profit, and cash flows, causing damage to our reputation, or causing a negative deviation from our revenue and operating profit target. We classify this risk as a medium risk.
136 Combined Management Report
to every employee. It provides legal compliance guidance on how to avoid unethical behavior and solve dilemma situations. On a yearly basis, the SAP Code of Business Conduct is re-confirmed by SAP’s workforce (except where disallowed by local legal regulations). We also rolled out and enforce various additional compliance policies aimed at managing third parties and preventing misuse of third-party payments for illegal purposes; ensuring controls around travel, entertainment, gift, and expense policies; and pushing out a commitment to business with integrity through our partner and vendor ecosystems. These efforts are flanked by continuous education including e-learning and classroom training to target audiences as identified by compliance risk assessment. The overall CMS approach by SAP is continuously monitored internally and externally, and adapted accordingly, if needed.
Although we estimate the probability of occurrence of intentional or negligent major unethical conduct to be remote, we cannot exclude the possibility that this risk could materialize. In that event, this risk could have a major impact on our reputation, business, financial position, profit, and cash flows and could cause a negative deviation from our operating profit target. We classify this risk as a low risk. Communication and Information Risks
Our controls and efforts to prevent the unauthorized disclosure of confidential information might not always be effective.
Confidential or strictly confidential information that is related to topics such as our strategy, new technologies, mergers and acquisitions, unpublished financial results, or personal data, could be prematurely or inadvertently disclosed. This could require us to notify multiple regulatory agencies and, where
However, we believe that the risk of failing to meet expectations regarding our energy and emission strategy is unlikely to occur and that if the risk were to occur, it would only have a moderate impact on our reputation, business, financial position, profit, and cash flows, as well as on the achievement of our revenue and operating profit target. We classify this risk as a low risk. unethical behavior and non-compliance with our integrity standards due to intentional and fraudulent behavior of employees could harm our business, financial position, profit, and reputation.
SAP's leadership position in the global market is founded on the long-term and sustainable trust of our stakeholders worldwide. Our heritage is one of corporate transparency, open communication with financial markets, and adherence to recognized standards of business integrity. The SAP Code of Business Conduct, adopted by the Executive Board on January 29, 2003, put into words the already existing guidelines and expectations for the business behavior practiced at SAP.However, we may encounter unethical behavior and non- compliance with our integrity standards due to intentional and fraudulent behavior of individual employees, possibly in collusion with external third parties. In addition to intentional behavior, problems could also arise due to negligence in the adherence to rules and regulations. Unethical behavior and misconduct attributable to SAP could not only lead to criminal charges, fines and claims by injured parties, but also to financial loss, and severe reputational damage. This could have an adverse effect on our business, financial position, profit, and cash flows. To help prevent this, we instituted a comprehensive compliance management system (CMS), which is based on the three pillars of prevention, detection, and reaction. Our CMS program comprises several educational, counseling, control, and investi-gative instruments. The objective is to minimize and mitigate the risk of unethical behavior, whether intentional or negligent. The SAP Code of Business Conduct is mandatory and applies
137risk report
– The timing of the introduction of new products or product enhancements by SAP or our competitors
– Changes in customer budgets– Decreased software sales that could have an adverse effect
on related maintenance and services revenue– The timing, size, and length of a customer’s services projects– Deployment models that require the recognition of revenue
over an extended period of time– Seasonality of a customer’s technology purchases– Limited visibility into the ability of acquired companies to
accurately predict their sales pipelines and the likelihood that the projected pipeline will convert favorably into sales
– Other general economic, social, environmental, and market conditions, such as the global economic crisis and the current difficulties for countries with large debt
Since many of our customers make their IT purchasing decisions near the end of calendar quarters, and with a significant percentage of those decisions being made during our fourth quarter, even a small delay in purchasing decisions for our on-premise software could have an adverse effect on our revenue results for a given year. Our dependence on large transactions has decreased in recent years with a trend towards an increased number of transactions coupled with a decrease in deal size. However, the loss or delay of one or a few large opportunities, which are still characteristic of the large enterprise segment, could have an adverse effect on our business, financial position, profit, and cash flows. We use a “pipeline” system to forecast sales and trends in our business. Pipeline analysis informs and guides our business planning, budgeting, and forecasting, but pipeline estimates do not necessarily consistently correlate to revenue in a particular quarter, potentially due to one or more of the reasons outlined above. The reliability of our plans, budgets, and forecasts may therefore be compromised. Because our operating expenses are based upon anticipated revenue levels and a high percent-age of our expenses are relatively fixed in the near term, any
appropriate, the data owner, which could result in a loss of reputation for SAP. For example, leaked information during a merger or acquisition deal could cause the loss of our deal target, or our share price could decline in case of prematurely published financial results. This could have an adverse effect on our market position and lead to fines and penalties. In addition, this could have an adverse effect on our business, financial position, profit, and cash flows. We take a wide range of actions to prevent classified confidential information from unauthorized disclosure, including procedural and organizational measures. These measures include mandatory security awareness training for all employees, standards for safe internal and external communication, and technical security features in our IT hardware and communication channels, such as mandatory encryption of sensitive data.
Although we estimate the likelihood of occurrence of this risk to be remote, we cannot completely exclude the possibility that this risk could have a business-critical impact on our reputation, business, financial position, profit, and cash flows, or cause a negative deviation from our operating profit target. We classify this risk as a medium risk. Financial Risks
Our sales are subject to quarterly fluctuations and our sales forecasts may not be accurate.
Our revenue and operating results can vary and have varied in the past, sometimes substantially, from quarter to quarter. Our revenue in general, and in particular our software revenue, is difficult to forecast for a number of reasons, including:– The relatively long sales cycles for our products– The large size, complexity, and extended timing of individual
license transactions– The introduction of new licensing and deployment models
such as cloud subscription models
138 Combined Management Report
SAP’s investment policy with regard to total group liquidity is set out in our internal treasury guideline document, which is a collection of uniform rules that apply globally to all companies in the Group. Among its stipulations, it requires that with limited exceptions we invest only in assets and funds rated BBB flat or better. The weighted average rating of the investments of our total group liquidity is in the range A to A–. We continue to pursue a policy of cautious investment characterized by wide portfolio diversification with a variety of counter parties, predominantly short-term investments, and standard invest-ment instruments. Although we estimate the probability of occurrence of this risk to be remote, there can be no assurance that the prescribed measures will be successful or that uncertainty in global economic conditions could not have a business-critical impact on our business, financial position, profit, cash flows or operating profit target. We classify this risk as a medium risk.
Management’s use of estimates could negatively affect our business, financial position, profit, and cash flows.
To comply with IFRS, management is required to make many judgments, estimates, and assumptions that affect the reported financial figures. The facts and circumstances as well as assumptions on which management bases these estimates and judgments, and management’s judgment regarding the facts and circumstances may change from time to time and this could result in significant changes in the estimates and judgments and consequently in the reported financials. Such changes could have an adverse effect on our business, financial position, profit and cash flows.
We have a number of control procedures in place to make sure that our estimates and judgments are appropriate. For example, we apply two-person verification to significant estimating.
shortfall in anticipated revenue or delay in revenue recognition could result in significant variations in our operating results from quarter to quarter or year to year. Continued deterioration in global economic conditions would make it increasingly difficult for us to accurately forecast demand for our products and services, and could cause our revenue, operating results, and cash flows to fall short of our expectations and public forecasts. This could have an adverse effect on our stock price. To the extent any future expenditure fails to generate the anticipated increase in revenue, our quarterly or annual operating results may be subject to an adverse effect and may vary significantly compared to preceding or subsequent periods.
Although we estimate the probability of occurrence of this risk to be unlikely, we cannot completely exclude the possibility that this risk could have a moderate impact on our business, financial position, profit, and cash flows, or cause a negative deviation from our revenue and operating profit target. We classify this risk as a low risk. external factors could impact our liquidity and increase the default risk associated with, and the valuation of, our financial assets.
Macroeconomic factors such as an economic downturn could have an adverse effect on our future liquidity. We use a globally centralized financial management to control financial risk, such as liquidity, exchange rate, interest rate, counterparty, and equity price risks. The primary aim is to maintain liquidity in the Group at a level that is adequate to meet our obligations at any time. Our total group liquidity was €2,841 million on December 31, 2013. This position is supported by our strong operating cash flows, of which a large part is recurring, and by credit facilities on which we can draw if necessary. However, adverse macroeconomic factors could increase the default risk associated with our total group liquidity. This could have an impact on the valuation of our financial assets, which could have an adverse effect on our business, financial position, profit, and cash flows.
139risk report

a positive effect. Variable interest balance-sheet items are also subject to changes in interest rates. Such changes may have an adverse effect on our business, financial position, profit and cash flows or cause an adverse deviation from our revenue and operating profit target.
For more information about our currency and interest rate risks and our related hedging activity, see the Notes to the Consolidated Financial Statements section, Notes (24) and (25). We continuously monitor our exposure to currency fluctuation risks based on balance-sheet items and expected cash flows, and pursue a Group-wide foreign exchange risk management strategy using, for example, derivative financial instruments as appropriate. With regard to our financial debt, we have a very balanced maturity profile and mixture of fixed and floating interest rate arrangements in place.
We believe that the likelihood of this risk of significant currency and interest rate fluctuations materializing is remote and that if the risk were to occur, its impact on our business, financial position, profit, and cash flows could be major, or cause a negative deviation from our revenue and operating profit target. We classify this risk as a low risk.
For more information about risks arising from financial instruments, including our currency and interest-rate risks and our related hedging activity, see the Notes to the Consolidated Financial Statements section, Notes (24) to (25). the cost of using derivative instruments to hedge share-based payments may exceed the benefits of hedging them.
We use derivative instruments to reduce the impact of our share-based payments on our income statement and to limit future expense associated with those plans. We decide case- by-case whether and to what extent we should hedge this risk. The expense of hedging the share-based payments could exceed the benefit achieved by hedging them. On the other hand, a decision to leave the plans materially unhedged could
Although we estimate the probability of occurrence of the risk to be unlikely, we cannot completely exclude the possibility of a major impact on our business, financial position, profit, and cash flows, or a negative deviation from our revenue and operating profit target. We classify this risk as a medium risk.
Current and future accounting pronouncements and other financial reporting standards, especially but not only concerning revenue recognition, may negatively impact the financial results we present.
We regularly monitor our compliance with applicable financial reporting standards and review new pronouncements and drafts thereof that are relevant to us. As a result of new standards, changes to existing standards, and changes in their interpretation, we might be required to change our accounting policies, particularly concerning revenue recognition, to alter our operational policies so that they reflect new or amended financial reporting standards, or to restate our published financial statements. Such changes may have an adverse effect on our reputation, business, financial position, and profit, or cause an adverse deviation from our revenue and operating profit target. Although we estimate the probability of occurrence of the risk to be unlikely, we cannot completely exclude the possibility of a major impact. We classify this risk as a medium risk. Because we conduct operations throughout the world, our business, financial position, profit, and cash flows may be affected by currency and interest rate fluctuations.
Our Group-wide management reporting and our external financial reporting are both in euros. Nevertheless, a significant portion of our business is conducted in currencies other than the euro. Approximately 71% of our revenue in 2013 was attributable to operations outside the euro area and was translated into euros. Consequently, period-over-period changes in the euro rates for particular currencies can significantly affect our reported revenue and income. In general, appreciation of the euro relative to another currency has an adverse effect while depreciation of the euro relative to another currency has
140 Combined Management Report

projects could result in claims from customers, harm SAP’s reputation, and could have an adverse effect on our business, financial position, profit, and cash flows. Our customers continue to follow project approaches to optimize their IT solutions in a non-disruptive manner. Our projects also include risk management processes that are integrated into SAP project management methods intended to safeguard implementations with coordinated risk and quality management programs. In our opinion, we make adequate financial planning provisions for the remaining individual risks.
We estimate the probability of occurrence of this risk to be unlikely, but we cannot completely exclude the possibility that this risk could have a major negative impact on our reputation, business, financial position, profit, and cash flows, or cause a negative deviation from our revenue and operating profit target. We classify this risk as a medium risk. This risk factor relates only to our On-Premise Services, Ariba, and Cloud Applications segments. product and technology Risks
there is a risk that undetected security vulnerabilities shipped and deployed within our software products might cause damage to sap and our customers.
Customer systems or systems operated by SAP itself to provide services could potentially be compromised by vulnerabilities if they are exploited by hackers. This could lead to theft, destruction, or abuse of data, or systems could be rendered unusable (such as denial of service attack). The detection of security vulnerabilities in our software, our customers’ systems, or SAP systems used in the provision of services, especially in case of exploitation, could prevent us from meeting our contractual obligations and subsequently might lead to customer claims and reputational damage, which might have an adverse effect on our business, financial position, profit, and cash flows.
prove disadvantageous. This could have an adverse effect on our business, financial position, profit and cash flows or cause an adverse deviation from our revenue and operating profit target. We believe that the likelihood of this risk materializing is remote and that if the risk were to occur, its potential impact on our business, financial position, profit, cash flows, and operating profit target would be minor. We classify this risk as a low risk. project Risks
Implementation of SAP software often involves a significant commitment of resources by our customers and is subject to a number of significant risks over which we often have no control.
A core element of our business is the successful implementation of software solutions to enable our customers to make their business a best-run business. The implementation of SAP software is led by SAP, by partners, by customers, or by a combination thereof. Depending on various factors, such as the complexity of solutions, the customer’s implementation and integration needs or the resources required, SAP faces a number of different risks. For example, functional requirement changes, delays in timeline, or deviation from recommended best practices may occur during the course of a project. These scenarios have a direct impact on the project resource model and on securing adequate internal personnel or consultants in a timely manner and could therefore prove challenging.
As a result of these and other risks, SAP and/or some of our customers have incurred significant implementation costs in connection with the purchase and installation of SAP software products. Some customers’ implementations have taken longer than planned. We cannot guarantee that we can reduce or eliminate protracted installation or significant third-party consulting costs, that trained consultants will be readily available, that our costs will not exceed the fees agreed in fixed-price contracts, or that customers will be satisfied with the implementation of our software and solutions. Unsuccessful, lengthy, or costly customer implementation and integration
141risk report

undetected defects in the introduction of new products and product enhancements could increase our costs, and reduce customer demand.
To achieve market acceptance and high customer satisfaction, our new products and product enhancements often require long development and testing periods. Development work and market introduction are subject to risks. For example, products might not completely meet our stringent high-quality standards, including security standards, might not fulfill market needs or customer expectations, or might not comply with local standards and requirements. Furthermore, this risk also exists with respect to acquired companies’ technologies and products where we might not be able to manage these as quickly and successfully as expected. Therefore, market launches, entering new markets, or the introduction of new innovations could be delayed or not be successful.
Also, new products could contain undetected defects or they might not be mature enough from the customer’s point of view for business-critical solutions. The detection and correction of any defects after shipment could be expensive and time consuming and we might not be able to meet the expectations of customers regarding time and quality in the defect resolution process. In some circumstances, we might not be in a position to rectify such defects or entirely meet the expectations of customers, specifically as we are expanding our product portfolio into additional markets. As a result, we might be faced with customer claims for cash refunds, damages, replacement software, or other concessions. The risk of defects and their adverse consequences could increase as we seek to introduce a variety of new software products simultaneously at a higher innovation rate. Significant undetected defects or delays in introducing new products or product enhancements could affect market acceptance of SAP software products and could have an adverse effect on our reputation, business, financial position, profit, and cash flows.
SAP has implemented a software security development lifecycle as a mandatory integral part of our software development process. We systematically use methods to develop secure software in all development phases starting early in the design phase. This includes industry best practices such as automated security source code scans, mandatory security training for all developers, and solid testing and validation of our products, patches, and services before shipment.
SAP has a software security response process in place to rapidly react to detected vulnerabilities and provide fixes. We have also improved the roll-out procedures for security- relevant notes, patches, and service packs to ensure easy and fast consumption on the customer side.
We cannot completely exclude the possibility of a negative impact on our customers’ or our own operations globally or in one or more countries or regions. We estimate the probability of occurrence of the risk of severe customer and SAP damages to be unlikely. If such an occurrence happens, it could have a business-critical impact on our reputation, business, financial position, profit, and cash flows as well as on the achievement of our revenue and operating profit target. We classify this risk as a medium risk.
142 Combined Management Report

We believe that the likelihood that this risk will materialize is remote but we cannot completely exclude the possibility that this risk, if it were to occur, could have a business-critical impact on our reputation, business, financial position, profit, and cash flows, or cause a negative deviation from our revenue and operating profit target. We classify this risk as a medium risk. Changes in our rights to use software and technologies we license from third parties, which are an integral part of SAP’s products, could slow down time to market and influence our license pricing and therefore the competitiveness with other software vendors. Furthermore, it could diminish our software’s functional capabilities and therefore could jeopardize the stability of our solution portfolio offering.
The numerous third-party technologies we have licensed and certain open source software components we use have become an integral part of our product portfolio. We depend on those technologies for the functionality of our software or cloud services. Changes to, or the loss of, third-party licenses as well as open source licenses being construed could significantly increase the cost of these licenses and significantly reduce software functionality and/or usability of SAP’s software products. As a result, we might incur additional development or license costs to ensure the continued functionality of our products, which could have an adverse effect on our business, financial position, profit, and cash flows. This risk increases with each acquisition of a company or a company’s intellectual property assets that had been subject to third-party technology licensing, open source software, and product standards less rigorous than our own. We strive to execute appropriate due diligence and contract management processes and to continuously monitor development projects through our product implementation lifecycle process.
The use of existing SAP software products by customers in business-critical solutions and processes and the relative complexity and technical interdependency of our software products create a risk that customers or third parties may pursue warranty, performance, or other claims against us for actual or alleged defects in SAP software products, in our provision of services, or in our application hosting services. We have in the past been, and may in the future be, subject to warranty, performance, or other similar claims.
Although our contracts generally contain provisions designed to limit our exposure due to actual or alleged defects in SAP software products or in our provision of services, these provisions may not cover every eventuality or be effective under the applicable law. Regardless of its merits, any claim could entail substantial expense and require the devotion of significant time and attention by key management personnel. Publicity surrounding such claims could affect our reputation and the demand for our software. We counter these risks using a broad range of techniques, including project management, project monitoring, product standards and governance, rigid and regular quality assurance measures certified to ISO 9001:2008, and program risk assessments during product development as well as market introduction phases. In addition, direct customer feedback is considered in the market release decision process. Delivering high-quality software products is a priority and part of our core business. Our strong investment and permanent efforts lead to a generally high level of quality of our products, which is made transparent in the defined quality perception and support index and confirmed by our constantly high customer satisfaction ratings as measured by customer quality perception reporting.
143risk report

We will continue to align our organization, processes, products, delivery model, and services to changing markets and customer and partner demands. We invent new technology or adopt the latest technology if there is a clear business opportunity for SAP and if it provides value to our customers. To ensure that we remain competitive in the future, we still conduct wide-ranging market and technology analyses and research projects, often in close cooperation with our customers and partners. We strive for strategic acquisitions with the potential to drive innovation and contribute to achieving our growth target.
We believe that the likelihood of this risk materializing is remote; however, we cannot exclude the business-critical impact this risk would have on our reputation, business, financial position, profit, and cash flows, or the potential negative deviation from our revenue and operating profit target if it were to materialize. We classify this risk as a medium risk. our technology and/or product strategy may not be successful or our customers and partners might not adopt our technology platforms and other innovations accordingly.
We offer customers a broad portfolio of products, solutions, and services. Our technology strategy centers on SAP HANA as the real-time in-memory computing platform for analytics and applications. The success of our technology strategy depends on the convergence of SAP HANA with our mobile, cloud, and SAP NetWeaver technology platform. It also depends on the delivery of SAP solutions based on the SAP HANA platform as well as the success of our new framework to meet changing customer expectations regarding end-to-end user experience. Our technology strategy also relies on our ability to maintain a dynamic network of partner organizations developing their own business applications using our technology platforms.
We believe that the probability of occurrence of this risk is likely and we cannot exclude the possibility of a major impact on our business, financial position, profit, and cash flows, or the possibility of a negative deviation from our revenue and operating profit target. We classify this risk as a medium risk. If we are unable to keep up with rapid technological innovations, new business models, and changing market expectations, we might not be able to compete effectively.
Our future success depends upon our ability to keep pace with technological and process innovations and new business models, as well as our ability to develop new products and services, enhance and expand our existing products and services portfolio, and integrate products and services we obtain through acquisitions. To be successful, we are required to shift our products and our go-to-market approach to a cloud- based delivery model to satisfy changing customer demand.
We might not be successful in bringing new solutions, solution enhancements, and/or services to market before our competitors. We may also face increasing competition from open source software initiatives in which competitors may provide software and intellectual property free and/or under terms and conditions unfavorable for SAP. In addition, we might not be able to generate enough revenue to offset the significant research and development costs we incur to deliver technological innovations. Moreover, we might not anticipate and develop technological improvements or succeed in adapting our products and processes to technological change, changing regulatory requirements, emerging industry standards, and changing requirements of our customers and partners. Finally, we might not succeed in producing high- quality products, enhancements, and releases in a timely and cost-effective manner to compete with products, solutions, and other technologies offered by our competitors, which could have an adverse effect on our reputation, business, financial position, profit, and cash flows.
144 Combined Management Report
Our cloud offerings might be subject to a security attack, become unavailable, or fail to perform properly.
The software used in our cloud portfolio is inherently complex and any defects in product functionality, system stability, or data center operations that cause interruptions in the availability of our application suite could result in the following:
– Lost or delayed market acceptance and sales– Breach of warranty or other contract breach or
misrepresentation claims– Sales credits or refunds to our customers or partners– Loss of customers and/or partners– Diversion of development and customer service resources– Breach of data protection and privacy laws and regulations– Customers considering competitive cloud offerings
The costs incurred in correcting any defects or errors might be substantial and could have an adverse effect on our reputation, business, financial position, profit, and cash flows. Because of the large amount of data that we collect and manage, it is possible that hardware failures, defects in our software, or errors in our systems could result in data loss or corruption, or cause the information that we collect to be incomplete or contain inaccuracies that our customers regard as significant. Furthermore, the availability of our application suite could be interrupted by a number of factors, including customers’ inability to access the Internet, the failure of our network or software systems due to human or other error, and security breaches, or variability in user traffic for our application suite. Additionally, any loss of the right to use hardware purchased or leased from third parties could result in delays in our ability to provide our application suite until equivalent technology is either developed by us or, if available, identified.
We have administrative, technical, and physical security measures in place as well as contracts that require third-party data centers to have appropriate security and data protection and privacy measures in place. In this context, customers might demand to only use specific and/or local data centers. However, if these security measures are breached as a result of third-party action, employee error and malfeasance, or otherwise, and if as a result someone obtains unauthorized
We might not be successful in integrating our platforms, enabling the complete product portfolio, harmonizing our user interface design and technology, or bringing new solutions based on the SAP HANA platform to the market as fast as expected. In addition, we may not be able to compete effectively in the area of managed cloud services. As a result, our partner organizations and customers might not adopt the SAP HANA platform and our managed cloud services quickly enough or they might consider competitive solutions. As a result, this could have an adverse effect on our reputation, business, financial position, profit, and cash flows. We believe that we will be able to deliver additional business value with minimum disruption to our customers if we can successfully drive the integration and convergence of our technology platform offerings, enable our current product portfolio for SAP HANA, develop new solutions based on SAP HANA, and offer comprehensive cloud-based services. We enable and encourage partners to leverage SAP technology by providing guidance about business opportunities, architecture, and technology, as well as a comprehensive certification program designed to ensure that third-party solutions are of consistently high quality.
We believe that the likelihood of this risk materializing is remote and that if this risk were to occur, its impact on our reputation, business, financial position, profit, cash flows, and revenue and operating profit target would be business-critical. We classify this risk as a medium risk.
145risk report
increased use of third-party code including open source code, as we expand into new industry segments with our products, resulting in greater overlap in the functional scope of products, and as non-practicing entities that do not design, manufacture, or distribute products increasingly assert intellectual property infringement claims.
Any claims, with or without merit, and negotiations or litigation relating to such claims, could preclude us from utilizing certain technologies in our products, be time-consuming, result in costly litigation, and require us to pay damages to third parties, stop selling or reconfigure our products and, under certain circumstances, pay fines and indemnify our customers, which could have an adverse effect on our business, financial profile, profit, cash flows, and reputation. They could also require us to enter into royalty and licensing arrangements on terms that are not favorable to us, cause product shipment delays, subject our products to injunctions, require a complete or partial redesign of products, result in delays to our customers’ investment decisions, and damage our reputation.
Software includes many components or modules that provide different features and perform different functions. Some of these features or functions may be subject to third-party intellectual property rights. The rights of another party could encompass technical aspects that are similar to one or more technologies in one or more of our products. Intellectual property rights of third parties could preclude us from using certain technologies in our products or require us to enter into royalty and licensing arrangements on unfavorable or expensive terms.
access to our customers' data, which may include personally identifiable information regarding users, our reputation could be damaged, our business may suffer, local data protection and privacy laws or regulations might be breached, and we could incur significant liability.
In addition, our insurance coverage might not cover claims against us for loss or security breach of data or other indirect or consequential damages. Moreover, defending a suit, regardless of its merit, could be costly and time-consuming. In addition to potential liability, if we experience interruptions in the availability of our application suite, our reputation could be harmed and we could lose customers.
Our mitigation measures have been designed and implemented to minimize such adverse effects. We continuously invest in protecting the integrity and security of our products and services as well as internal and external data that is managed within our data centers. We are consolidating and harmonizing our data centers including data protection measures to run a homogeneous landscape that supports the complex infrastructure, application, and security requirements to deliver the required service level for cloud solutions.
Although we estimate the probability of occurrence of this risk to be unlikely, we cannot completely exclude the possibility that any disruption of our cloud operations could result in a business-critical impact on our reputation, business, financial position, profit, cash flows, and revenue and operating profit target. We classify this risk as a medium risk. This risk factor relates only to our Cloud Applications and Ariba segments. operational Risks
third parties have claimed, and might claim in the future, that we infringe their intellectual property rights, which could lead to damages being awarded against us and limit our ability to use certain technologies in the future.
We believe that we will increasingly be subject to intellectual property infringement claims as the number of products in our industry segment grows, as we acquire companies with
146 Combined Management Report
We are named as a defendant in various legal proceedings for alleged intellectual property infringements. For more information and a more detailed discussion relating to certain of these legal proceedings, see the Notes to the Consolidated Financial Statements, Note (23). Claims and lawsuits against us could have an adverse effect on our business, financial position, profit, cash flows, and reputation.
Claims and lawsuits are brought against us, including claims and lawsuits involving businesses we have acquired. Adverse outcomes to some or all of the claims and lawsuits pending against us might result in the award of significant damages or injunctive relief against us that could hinder our ability to conduct our business and could have an adverse effect on our reputation, business, financial position, profit, and cash flows.
The outcome of litigation and other claims or lawsuits is intrinsically uncertain. Management’s view of the litigation may also change in the future. Actual outcomes of litigation and other claims or lawsuits could differ from the assessments made by management in prior periods. We consider the probability of occurrence of this risk to be likely, and cannot exclude its business-critical impact on our reputation, business, financial position, profit, cash flows, and revenue and operating profit target if it were to materialize. We classify this risk as a high risk.
For more information and more detailed discussion relating to certain of these legal proceedings, see the Notes to the Consolidated Financial Statements, Note (23).
The software industry is making increasing use of open source software in its development work on solutions. We also integrate certain open source software components from third parties into our software. Open source licenses may require that the software code in those components or the software into which they are integrated be freely accessible under open source terms. Third-party claims may require us to make freely accessible under open source terms one of our products or non-SAP software upon which we depend. SAP continues to expand its participation in standards organizations and increase the use of such standards in its products. Participation in standards organizations might require the licensing of SAP’s intellectual property to contributors to the standard and to all standards implementers, including competitors, on a non-discriminatory basis in accordance with licensing terms defined by standards organizations. Within the software-related standards field, there is a trend toward expanding the scope of licensing obligations and narrowing an intellectual property owner’s right to revoke a license if sued by a licensee. In certain situations, limitations on SAP’s rights to revoke a license could reduce SAP’s ability to assert a patent infringement claim against a third party. Assertion of patents inadvertently licensed through standards could expose SAP to third-party claims.
Our Global Compliance Office is responsible for constantly assessing and managing risks associated with third-party intellectual property. It works closely with our Global GRC organization. The Global Compliance Office investigates the way we handle intellectual property, sets internal policies, and monitors compliance with these policies.
We consider the probability of this risk materializing to be likely, and that any claims concerning intellectual property rights of third parties, open source requirements, or certain standards could have a business-critical impact on our business, financial position, profit, cash flows and reputation, as well as on the achievement of our revenue and operating profit target, and could also exacerbate the other risks we describe in this report. We classify this risk as a high risk.
147risk report
incompatible with our compliance requirements– An adverse effect on relationships with existing customers,
partners, or third-party providers of technology or products– Difficulties in integrating the acquired company’s accounting,
HR, and other administrative systems and coordination of the acquired company’s research and development (R&D), sales, and marketing functions
– Debt incurrence or significant cash expenditures
In addition, acquired businesses might not perform as anticipated, resulting in charges for the impairment of goodwill and other intangible assets on our statements of financial position. Such charges may have an adverse effect on our business, financial position, profit, and cash flows. We have entered into, and expect to continue to enter into, alliance arrangements for a variety of purposes, including the development of new products and services. There can be no assurance that any such products or services will be successfully developed or that we will not incur significant unanticipated liabilities in connection with such arrangements. We may not be successful in overcoming these risks and we may therefore not benefit as anticipated from acquisitions or alliances. We counter these acquisition-related risks with many different methodological and organizational measures. These include technical, operational, financial, and legal due diligence on the company or assets to be acquired and a holistic evaluation of material transaction and integration risks. The methods we use depend on the integration scenario. Our integration planning is detailed and standardized, and carried out by a dedicated integration team. We therefore believe we have minimized this risk.
Although we estimate this risk to be unlikely, we cannot completely exclude the possibility that this risk could have a major impact on our business, financial position, profit, cash flows, and revenue and operating profit target. We classify this risk as a medium risk.
We might not acquire and integrate companies effectively or successfully and our strategic alliances might not be successful.
To expand our business, we have in the past made acquisitions of businesses, products, and technologies. We expect to continue to make such acquisitions in the future. Management’s negotiation of potential acquisitions and alliances and integration of acquired businesses, products, or technologies demands time, focus, and resources of management and of the workforce. Acquisitions of companies, businesses, and technology expose us to unpredictable operational difficulties, expenditures, and risks. These risks include, among others:– The selection of the wrong integration model for the acquired
company– The failure to integrate the acquired business and its different
business and licensing models– The failure to integrate the acquired technologies or products
with our current products and technologies– The failure to integrate the acquired company’s operations
across SAP’s different cultures, languages, and local protocols, all within the constraints of applicable local laws
– The failure to meet the needs of the acquired company’s customers and partners in the combined company
– The diversion of management’s time and attention from daily operations
– The loss of key personnel of the acquired business– Material unknown liabilities and contingent liabilities of
acquired companies, including legal, tax, accounting intellectual property, or other significant liabilities that may not be detected through the due diligence process
– Legal and regulatory constraints (such as contract obligations, privacy frameworks and agreements, and so on)
– Difficulties in implementing, restoring, or maintaining internal controls, procedures, and policies
– Practices or policies of the acquired company that may be
148 Combined Management Report
We rely on a combination of the protections provided by applicable statutory and common law rights, including trade secret, copyright, patent, and trademark laws, license and non-disclosure agreements, and technical measures to establish and protect our proprietary rights in our products. We have established various internal programs, such as internal policies, processes, and monitoring, to assess and manage the risks associated with standards organizations, open source, and third-party intellectual property.
We may be dependent in the aggregate on technology that we license from third parties that is embedded in our products or that we resell to our customers. We have licensed and will continue to license numerous third-party software products that we incorporate into and/or distribute with our existing products. We endeavor to protect ourselves in the respective agreements by obtaining certain rights in case such agreements are terminated.
We are party to certain patent cross-license agreements with third parties.
We estimate the probability of this risk occurring as likely, and that it could have a business-critical impact on our reputation, business, financial position, profit, cash flows, and revenue and operating profit target. We classify this risk as a high risk. sap’s business strategy focuses on certain business models that are highly dependent on a working cyberspace. A cybersecurity breach could have an adverse effect on our customers, our reputation, and our business.
The key cybersecurity risks currently applicable to SAP include state-driven economic espionage as well as competitor-driven industrial espionage, and criminal activities including, but not limited to cyber-attacks against on-premise software, hosted, and cloud services. This might result in, for example, leakage of
We may not be able to obtain adequate title to, or licenses in, or to enforce, intellectual property.
Protecting and defending our intellectual property is crucial to our success. We use a variety of means to identify and monitor potential risks and to protect our intellectual property. These include applying for patents, registering trademarks and other marks and copyrights, implementing measures to stop copyright and trademark infringement, entering into licensing, confidentiality, and non-disclosure agreements, and deploying protection technology. Despite our efforts, we might not be able to prevent third parties from obtaining, using, or selling without authorization what we regard as our proprietary technology and information. All of these measures afford only limited protection, and our proprietary rights could be challenged, invalidated, held unenforceable, or otherwise affected. Some intellectual property might be vulnerable to disclosure or misappropriation by employees, partners, or other third parties. Third parties might independently develop technologies that are substantially equivalent or superior to our technology. Finally, third parties might reverse-engineer or otherwise obtain and use technology and information that we regard as proprietary. Accordingly, we might not be able to protect our proprietary rights against unauthorized third-party copying or utilization, which could have an adverse effect on our competitive position and our financial position, and result in reduced sales. Any legal action we bring to enforce our proprietary rights could also involve enforcement against a partner or other third party, which may have an adverse effect on our ability, and our customers’ ability, to use that partner’s or other third parties’ products. In addition, the laws and courts of certain countries may not offer effective means to enforce our intellectual property rights. This could have an adverse effect on our reputation, business, financial position, profit, and cash flows.
149risk report

damage to assets by trespassers in our facilities or by people who have gained unauthorized physical access to our facilities, systems, or information, which could have an adverse effect on our business, financial profile, profit, and cash flows. To minimize these risks, we have implemented several technical and organizational measures designed to safeguard our information, IT and facility infrastructure, and other assets. These measures include, for example, physical access control systems at facilities, multilevel access controls, closed-circuit television surveillance, and security personnel in all critical areas. Access to information and information systems is controlled using authorization concepts. Managers and employees are regularly sensitized to the issues and given mandatory security and compliance trainings. We keep these measures under continuous review to meet current threats.
Although we estimate the probability of occurrence of this risk to be unlikely, we cannot completely exclude the possibility that any misuse, theft, or breach of security could have a moderate impact on our business, financial position, profit, and cash flows as well as on our revenue and operating profit target. We classify this risk as a low risk.
Our insurance coverage might not be sufficient and uninsured losses may occur.
We maintain insurance coverage to protect us against a broad range of risks, at levels we believe are appropriate and consistent with current industry practice. Our objective is to exclude or minimize risk of financial loss at reasonable cost. However, we may incur losses that are beyond the limits, or outside the scope, of coverage of our insurance and that may limit or prevent indemnification under our insurance policies. In addition, we might not be able to maintain adequate insurance coverage on commercially reasonable terms in the future. Further, certain categories of risks are currently not insurable at reasonable cost, which could have an adverse effect on our
confidential information and intellectual property, defective products, production downtimes, supply shortages, and compromised data (including personal data). A failure of our cybersecurity measures could expose our business operations and service delivery to the described risks, for example, virtual attack, disruption, damage, and/or unauthorized access. Additionally, we could be subject to recovery costs, for example, as well as significant contractual and legal claims by customers, partners, authorities, and third-party service providers for damages against us, which could have an adverse effect on our reputation, business, financial position, profit, and cash flows. To address the increasing cybersecurity threats, SAP is continuously adapting and modifying its security procedures. We have multiple security measures in place, such as technical IT security measures, identity and access management, and mandatory security and compliance trainings. In addition, our security governance model clearly defines security management accountabilities for all security areas regarding product security and corporate security that enables us to respond quickly to identified cybersecurity risks.
Although we still consider the occurrence of this risk to be unlikely, we cannot completely exclude the possibility that this risk could have a business-critical impact on our business, financial position, profit, cash flows, and reputation as well as revenue and operating profit target. We classify this risk as a medium risk. We may not be able to protect our critical information and assets or to safeguard our business operations against disruption.
SAP is dependent on the exchange of a wide range of information across our global operations and on the availability of our infrastructure. With regard to our physical environment, we face several key security risks such as industrial and/or economic espionage, serious and organized crime, and other illegal activities, as well as violent extremism and terrorism. We might be endangered by threats including, but not limited, to social engineering, misuse, or theft of information or assets, or
150 Combined Management Report
Consolidated Risk Profile
Management assessment of overall risks and opportunities
SAP consolidates and aggregates all risks reported by the different business units and functions following our risk management policy, monitored by a Group-wide risk management governance function.
Compared to previous years, in 2013 we recognized only minor changes in the percentages of all risks categorized as “high” or “medium” in our risk level matrix. At the end of the year, the number of risks categorized as “high” accounted for 12% (2012: 9%) of all identified risks, while the risks categorized as “medium” accounted for 39% (2012: 34%) of all identified risks.
In our view, considering their likelihood of occurrence and impact level, the risks described in our aggregated risk report do not individually or cumulatively threaten our ability to continue as a going concern. Management remains confident that the Group’s earnings strength forms a solid basis for our future business development and provides the necessary resource to pursue the opportunities available to the Group. Because of our strong position in the market, our technological leadership, our highly motivated employees, and our structured processes for early risk identification, we are confident that we can continue to successfully counter the challenges arising from the risks in our risk profile in 2014.
business, financial position, profit, and cash flows. Finally, there can be no assurance of the financial ability of the insurance companies to meet their claim payment obligations. In view of the scope of our insurance coverage and our selection of insurers, and because we keep our insurance programs under constant review, we believe that the likelihood of this risk materializing is remote.
We cannot exclude the possibility of a business-critical impact on our business, financial position, profit, cash flows, and operating profit target if the risk were to occur. We classify this risk as a medium risk. We could incur losses in connection with venture capital investments.
Through our partnership with SAP Ventures, we plan to continue investing in new and promising technology businesses. Many such investments generate net losses and require additional expenditures from their investors. Changes to planned business operations have in the past, and may in the future, affect the performance of companies in which SAP Ventures holds investments, and that could have an adverse effect on the value of our investments in SAP Ventures, which could have an adverse effect on our business, financial position, profit, and cash flows. Furthermore, tax deductibility of capital losses and impairment in connection with equity securities are often restricted and could therefore have an adverse effect on our effective tax rate. To address this risk, SAP Ventures diversifies its portfolio and manages our investments actively. In addition, our venture capital activities have a limited scope.
We believe that the likelihood of this risk materializing is remote and that if the risk were to occur, its potential impact on our business, financial position, profit, cash flows, and operating profit target would be minor. We classify this risk as a low risk.
151risk report

Bob Calderoni, president of Ariba, an SAP company, and a member of our Global Managing Board, decided to leave SAP with effect from January 15, 2014.
supplementary report
152 Combined Management Report

economic trends – Year-over-Year Gdp GrowthPercent
2012e 2013p 2014p
World 3.1 3.0 3.7Advanced economies 1.4 1.3 2.2
Developing and emerging economies 4.9 4.7 5.1
europe, the Middle east, and Africa (eMeA)
Euro area – 0.7 – 0.4 1.0
Germany 0.9 0.5 1.6
Central and Eastern Europe 1.4 2.5 2.8
Middle East and North Africa 4.1 2.4 3.3
Sub Saharan Africa 4.8 5.1 6.1
AmericasUnited States 2.8 1.9 2.8
Canada 1.7 1.7 2.2
Central and South America, Caribbean 3.0 2.6 3.0
Asia pacific Japan (ApJ)Japan 1.4 1.7 1.7
Asian developing economies 6.4 6.5 6.7
China 7.7 7.7 7.5
e = estimate; p = projection Source: International Monetary Fund (IMF), World Economic Outlook Update January 2014, “Is the Tide Rising?“ As of January 21, 2014, p. 2.
It MARket: the outlook FoR 2014According to International Data Corporation (IDC), a market research firm based in the United States, economic recovery in 2014 will lead to a greater increase in spending on IT than occurred in 2013. That increase is expected to continue to be higher than the growth in the overall economy. IDC expects businesses will revert to normal IT upgrade cycles in 2014 as liquidity bottlenecks are resolved by the return of economic stability, so companies in particular will increase investment in IT. In the emerging economies, IDC expects IT markets to recover from the setbacks of the previous year, because basically demand for IT products is high and conditions are stable.
FutuRe tRenDS In the GloBAl eConoMyThe experts at the European Central Bank (ECB1)) expect the global economy to expand gradually in response to factors such as more stable credit conditions around the world. The ECB bases this expectation on the assumption that, as in 2013, prospects will improve in the industrialized economies but will remain subdued in some of the emerging economies compared to past years.
According to these expectations, the outlook in the Europe, Middle East, and Africa (EMEA) region has improved: The ECB expects a slow recovery in the euro area in 2014 and 2015, supported by a slight recovery of domestic and export demand. Companies in particular will increase their investments in 2014, encouraged by the very low interest rates and by a high demand for modernization after several years of restrained investments. The ECB currently expects GDP in the euro area to grow about 1% in 2014 and 1.5% in 2015. That would bring GDP back to first-quarter 2008 “pre-crisis” levels by the end of 2015. The ECB also expects the economies of Central and Eastern Europe to gain traction beginning in 2014. The ECB is also optimistic about the Americas region. It believes the economic upturn in the United States will gradually gain momentum as the residential real-estate and labor markets continue to brighten up. However, it believes uncertainty regarding financial policy will continue, with new legislation on debt capping and public finance under continued discussion.
Future trends in the Asia Pacific Japan (APJ) region are difficult to estimate, according to the ECB. In Japan, a consumption tax rise is due in April 2014. That could cause the economy to pick up in the first quarter, as consumers bring forward spending. As a result, subsequent quarters may see an economic slowdown. It remains to be seen what effect the wide-ranging agenda for reform announced by the Communist Party of China in November 2013 will have. The goal is to set China on a more sustainable path to economic growth. The ECB believes the reforms will strengthen the market and the economy outside the public sector.
report on expected developments
1) Unless otherwise indicated, all economic information in this section is based on information from the European Central Bank (ECB).
153report on expected developments
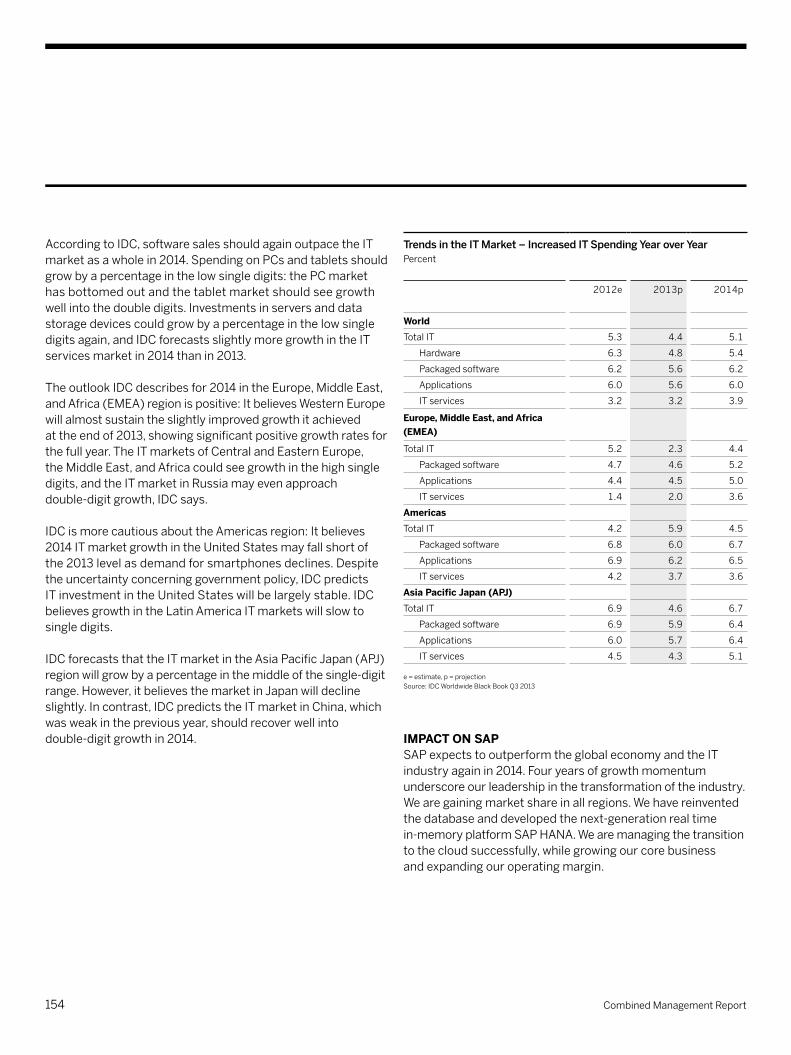
trends in the It Market – Increased It spending Year over YearPercent
2012e 2013p 2014p
WorldTotal IT 5.3 4.4 5.1
Hardware 6.3 4.8 5.4
Packaged software 6.2 5.6 6.2
Applications 6.0 5.6 6.0
IT services 3.2 3.2 3.9
europe, Middle east, and Africa (eMeA)
Total IT 5.2 2.3 4.4
Packaged software 4.7 4.6 5.2
Applications 4.4 4.5 5.0
IT services 1.4 2.0 3.6
AmericasTotal IT 4.2 5.9 4.5
Packaged software 6.8 6.0 6.7
Applications 6.9 6.2 6.5
IT services 4.2 3.7 3.6
Asia pacific Japan (ApJ)Total IT 6.9 4.6 6.7
Packaged software 6.9 5.9 6.4
Applications 6.0 5.7 6.4
IT services 4.5 4.3 5.1
e = estimate, p = projection Source: IDC Worldwide Black Book Q3 2013
IMpACt on SApSAP expects to outperform the global economy and the IT industry again in 2014. Four years of growth momentum underscore our leadership in the transformation of the industry. We are gaining market share in all regions. We have reinvented the database and developed the next-generation real time in-memory platform SAP HANA. We are managing the transition to the cloud successfully, while growing our core business and expanding our operating margin.
According to IDC, software sales should again outpace the IT market as a whole in 2014. Spending on PCs and tablets should grow by a percentage in the low single digits: the PC market has bottomed out and the tablet market should see growth well into the double digits. Investments in servers and data storage devices could grow by a percentage in the low single digits again, and IDC forecasts slightly more growth in the IT services market in 2014 than in 2013.
The outlook IDC describes for 2014 in the Europe, Middle East, and Africa (EMEA) region is positive: It believes Western Europe will almost sustain the slightly improved growth it achieved at the end of 2013, showing significant positive growth rates for the full year. The IT markets of Central and Eastern Europe, the Middle East, and Africa could see growth in the high single digits, and the IT market in Russia may even approach double-digit growth, IDC says.
IDC is more cautious about the Americas region: It believes 2014 IT market growth in the United States may fall short of the 2013 level as demand for smartphones declines. Despite the uncertainty concerning government policy, IDC predicts IT investment in the United States will be largely stable. IDC believes growth in the Latin America IT markets will slow to single digits.
IDC forecasts that the IT market in the Asia Pacific Japan (APJ) region will grow by a percentage in the middle of the single-digit range. However, it believes the market in Japan will decline slightly. In contrast, IDC predicts the IT market in China, which was weak in the previous year, should recover well into double-digit growth in 2014.
154 Combined Management Report
development effectiveness, creating efficiencies and accelerating innovation cycles to engage more closely with our customers. We are also investing in our go-to-market channels to expand capacity and drive greater volume sales. At the same time, we are expanding our technology partner ecosystem to foster co-innovation as a force multiplier for creating additional business value for our customers.
The success of SAP and our customers depends on our people – whom we consider our most important asset. Our employees spark our innovation, deliver value to our customers, and drive our sustainable growth and profitability. The correlation between our continued business success and our ability to attract, retain, and engage top talent is stronger than ever. We will continue to execute our people strategy to set us apart in vital areas such as workforce diversity and talent management. Our ambitious growth strategy and our ability to innovate depends on creating an environment for our employees that drives them to unleash their full potential.
Go-to-Market Investment Delivers Customer ValueSAP goes to market by region, customer segment, line of business and industry. In each region, we seek to concentrate our sales efforts on the fastest-growing markets with the greatest business and revenue potential. We evolve and invest in our go-to-market coverage model to effectively sell industry-specific solutions while increasing our engagement with customers in line-of-business functions. We continue to provide companies of any size – small, midsize, and large – with tailored offerings that align to their specific budgetary, resource, and deployment requirements.
Thanks to our great progress in strategy and technology since 2010, we have increased the importance of SAP to our customers. We are well-positioned to expand our core business and to accelerate our cloud businesses. We are therefore confident we can achieve our medium-term targets for 2015 and 2017, assuming that the economic environment and IT industry develop as currently forecast. Balanced in terms of regions as well as industries, we are well-positioned to offset smaller individual fluctuations in the global economy and IT market.
A comparison of our business outlook with forecasts for the global economy and IT industry shows that, with our customer-centered innovation strategy, we can be successful even in a tough economic environment. Our market and the demands of our customers are changing rapidly. We anticipated these changes early.
We plan to continue to invest in countries in which we expect significant growth, and we aim to expand our market share in those countries. Such countries include Brazil, China, India, Russia, as well as countries in the Middle East and Africa. We therefore expect to see further future growth potential helping us reach our ambitious 2014 outlook targets and medium-term aspirations for 2015 and 2017. For more information, see the Operational Targets for 2014 (Non-IFRS) section. FoReCASt FoR SAp
Strategy for Profitable GrowthSAP seeks to maintain profitable growth across its portfolio of products and services. Our goal is to expand our addressable market to US$350 billion in 2020, compared to US$110 billion in 2010. Our ability to deliver software-based innovation and value in target growth areas positions us favorably in the enterprise software market.
SAP’s continued growth depends on our ability to deliver innovative solutions and provide significant value to our customers. We continue to improve our research and
155report on expected developments
– SAP expects full-year 2014 non-IFRS software and software-related service revenue to increase by 6% to 8% at constant currencies (2013: €14,032 million).
– SAP expects full-year 2014 non-IFRS operating profit to be in a range of €5.8 billion to €6.0 billion at constant currencies (2013: €5,514 million).
We expect that total revenue growth (non-IFRS) will continue to depend largely on the revenue from the On-Premise Products segment. However, the revenue growth we expect from this segment is below the outlook provided for cloud subscription revenue (non-IFRS). In light of the rate at which professional services and other service revenue is growing, we do not expect strong growth in the On-Premise Services segment.
We expect an increase in segment profit in our On-Premise division, with On-Premise Products segment profit growing faster than On-Premise Services segment profit. We expect only a slight improvement in On-Premise Services segment profit. The Cloud division is expected to continue with increasingly positive segment profit in 2014.
In light of the rate at which cloud subscriptions are growing in our cloud segments, we expect strong revenue growth in those segments.
We present the following reconciliation from our 2013 IFRS software and cloud subscription revenue, IFRS software and software-related service revenue, IFRS total revenue, and IFRS operating profit to the non-IFRS equivalents to facilitate comparison between IFRS financial measures and the non-IFRS financial measures in our 2014 outlook:
Greater Volume and Co-Innovation through an open ecosystemSAP continues to engage an expanding partner ecosystem to increase market coverage, enhance our solutions portfolio, and spur innovation. SAP and its vibrant partner ecosystem offer greater choice and business value through the power of co-innovation, appealing to customers that want to avoid being “locked in” to a single vendor. SAP partners offer customers knowledgeable local delivery of solutions across industries and lines of business. SAP technology partners continue to drive our research agenda, enhance the SAP portfolio, and monetize new technology breakthroughs.
organic Growth and targeted AcquisitionsOrganic growth remains the primary driver of SAP’s strategy. We will continue to invest in our own product development and technology innovation, improving the speed, number of projects, and innovations brought to market. Our ecosystem strategy enables us to better leverage our innovation by extending it to our partners to drive additional customer value, based on their own domain expertise. We will also continue to acquire targeted, strategic, and “fill-in” technology to add to our broad solution offerings and improve our coverage in key strategic markets to best support our customers’ needs.
opeRAtIonAl tARGetS FoR 2014 (non-IFRS)
Revenue and Operating Profit OutlookThe Executive Board is providing the following outlook for the full year 2014:– SAP expects full-year 2014 non-IFRS cloud subscription and
support revenue to be in a range of €950 to €1,000 million at constant currencies (2013: €757 million). The upper end of this range represents a growth rate of 32% that is similar to the respective 2013 growth rate after adjusting for acquisitions.
156 Combined Management Report
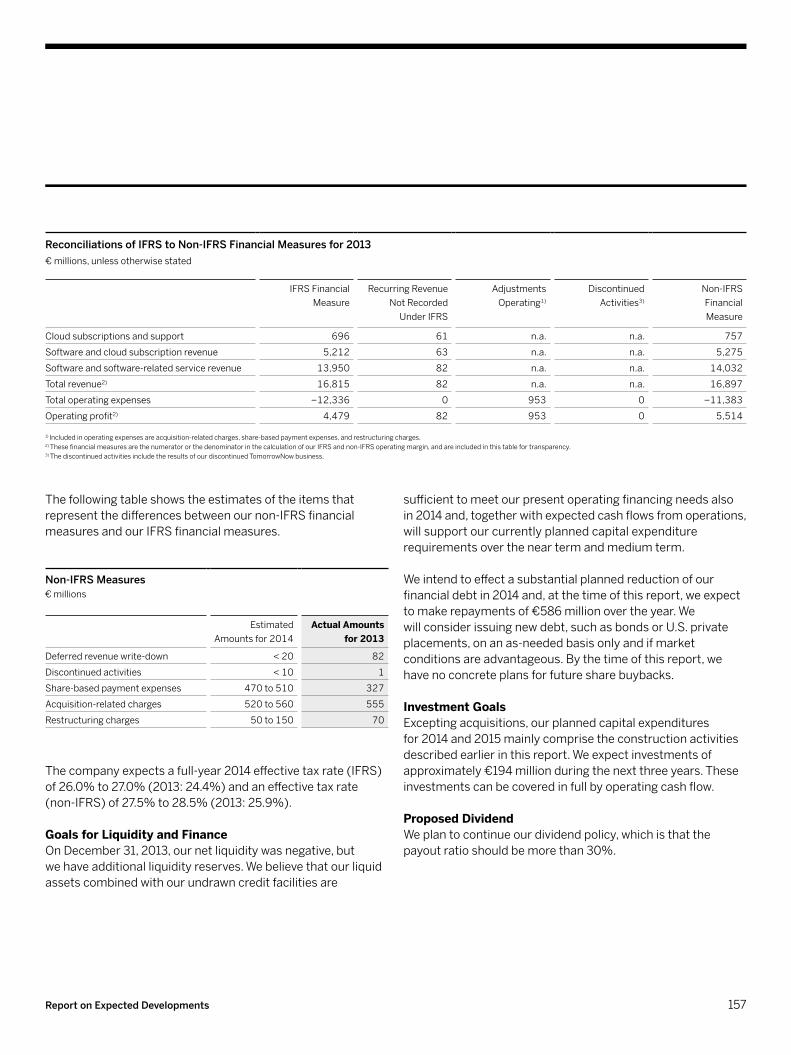
sufficient to meet our present operating financing needs also in 2014 and, together with expected cash flows from operations, will support our currently planned capital expenditure requirements over the near term and medium term.
We intend to effect a substantial planned reduction of our financial debt in 2014 and, at the time of this report, we expect to make repayments of €586 million over the year. We will consider issuing new debt, such as bonds or U.S. private placements, on an as-needed basis only and if market conditions are advantageous. By the time of this report, we have no concrete plans for future share buybacks.
Investment GoalsExcepting acquisitions, our planned capital expenditures for 2014 and 2015 mainly comprise the construction activities described earlier in this report. We expect investments of approximately €194 million during the next three years. These investments can be covered in full by operating cash flow.
proposed DividendWe plan to continue our dividend policy, which is that the payout ratio should be more than 30%.
reconciliations of IFrs to Non-IFrs Financial Measures for 2013€ millions, unless otherwise stated
IFRS Financial Measure
Recurring Revenue Not Recorded
Under IFRS
Adjustments Operating1)
Discontinued Activities3)
Non-IFRS Financial Measure
Cloud subscriptions and support 696 61 n.a. n.a. 757
Software and cloud subscription revenue 5,212 63 n.a. n.a. 5,275
Software and software-related service revenue 13,950 82 n.a. n.a. 14,032
Total revenue2) 16,815 82 n.a. n.a. 16,897
Total operating expenses −12,336 0 953 0 −11,383
Operating profit2) 4,479 82 953 0 5,514
1) Included in operating expenses are acquisition-related charges, share-based payment expenses, and restructuring charges. 2) These financial measures are the numerator or the denominator in the calculation of our IFRS and non-IFRS operating margin, and are included in this table for transparency. 3) The discontinued activities include the results of our discontinued TomorrowNow business.
The following table shows the estimates of the items that represent the differences between our non-IFRS financial measures and our IFRS financial measures.
Non-IFrs Measures€ millions
Estimated Amounts for 2014
Actual Amounts for 2013
Deferred revenue write-down < 20 82
Discontinued activities < 10 1
Share-based payment expenses 470 to 510 327
Acquisition-related charges 520 to 560 555
Restructuring charges 50 to 150 70
The company expects a full-year 2014 effective tax rate (IFRS) of 26.0% to 27.0% (2013: 24.4%) and an effective tax rate (non-IFRS) of 27.5% to 28.5% (2013: 25.9%).
Goals for liquidity and FinanceOn December 31, 2013, our net liquidity was negative, but we have additional liquidity reserves. We believe that our liquid assets combined with our undrawn credit facilities are
157report on expected developments

The outlook projections for the SAP Group in respect of liquidity, finance, investment, and dividend are equally applicable to SAP AG.
Among the assumptions underlying this outlook are those presented above concerning the economy and our expectations for the performance of the SAP Group.
MeDIuM-teRM pRoSpeCtSWith SAP HANA as the single platform for our entire solution portfolio, delivered on-premise or in the cloud, SAP will drive simplicity and business outcomes for our customers.
We expect our business, our revenue, and our profit to grow, assuming there is a sustained recovery in the global economy. Our strategic objectives are focused on the following financial and non-financial indicators: revenue, margin, customer loyalty, and employee engagement.
We expect the combination of a stable, highly-profitable core and fast-growing cloud business to deliver continued growth and margin expansion. We continue to strive to increase our total revenue to more than €20 billion by 2015 and revenue from our cloud business, including cloud-related professional services, to approximately €2 billion by 2015.
Looking beyond 2015, we introduced new 2017 targets. We now aim to increase total revenue to at least €22 billion and revenue from our cloud business to €3.0 to €3.5 billion by 2017. We have retained our non-IFRS operating margin goal of 35%. To capture the growth opportunities in the cloud, we now expect this target to be reached by 2017 rather than in 2015 as previously stated. We anticipate the fast-growing cloud business along with growth in support revenue will drive a higher proportion of more predictable, recurring revenue in the future.
premises on Which our outlook Is BasedIn preparing our outlook, we have taken into account all events known to us at the time we prepared this report that could influence SAP’s business going forward.
Among the premises on which this outlook is based are those presented concerning the economy and on the assumption that there will be no effects from a major acquisition. outlook FoR SAp AGThe primary source of revenue for SAP AG is the license fees it charges subsidiaries for the right to market and maintain SAP software solutions. Consequently, the performance of SAP AG in operating terms is closely tied to the software and software-related service revenue of the SAP Group.
We expect SAP AG product revenue to increase generally in line with the rise in software and software-related service revenue anticipated for the SAP Group in 2014. Assuming there are no special effects relating to acquisitions or internal corporate restructuring measures in 2014, we also expect SAP AG operating profit to grow. Provided the SAP Group continues to hit its revenue and profit targets, we expect SAP AG to sustain revenue and operating profit growth into the medium term.
We believe SAP AG, the parent company of the SAP Group, will receive investment income in the form of profit transfers and dividends again in the future. The growth we expect from the SAP Group should have a positive effect on SAP AG investment income.
158 Combined Management Report

In addition to our financial goals, we also focus on two non- financial targets: Customer loyalty and employee engagement. We believe it is essential that our employees are engaged, drive our success, and support our strategy. Therefore, we plan to increase our employee engagement index score to 82% by 2015 (2013: 77%). Further, our customers’ satisfaction with the solutions we offer is very important to us. We want our customers to not only be satisfied, but also see us as a trusted partner for innovation. We measure this customer loyalty metric using the Net Promoter Score (NPS). For 2014, we have set a target for increasing the NPS by four percentage points (2013: 12.1%).
SAP’s vision to help the world run better and improve people’s lives comes to life in product innovation that drives business value for our customers. By delivering on our product roadmap, SAP is powering a market-wide transformation in how people and organizations work together and run better. Building on a track record of innovation, SAP is again at the forefront of a major shift in the IT sector, away from commoditized hardware and lower value services, toward renewed investment in differentiating IT through business software and services that drive simplicity, efficiency, and a more sustainable business transformation.
159report on expected developments
Internal Management System
We measure our performance through four companywide indicators: revenue, margin,
employee engagement, and customer loyalty.
To learn more about SAP’s performance please visit www.sapintegratedreport.com

Consolidated Financial Statements IFRS161162 ConsolidatedIncomeStatements163 ConsolidatedStatementsofComprehensiveIncome164 ConsolidatedStatementsofFinancialPosition166 ConsolidatedStatementsofChangesinEquity168 ConsolidatedStatementsofCashFlows
169 NotestotheConsolidatedFinancialStatements
169 (1)GeneralInformationAboutConsolidatedFinancialStatements169 (2)ScopeofConsolidation170 (3)SummaryofSignificantAccountingPolicies191 (4)BusinessCombinations193 (5)Revenue194 (6)OtherOperatingIncome/Expense,Net194 (7)EmployeeBenefitsExpenseandHeadcount196 (8)OtherNon-OperatingIncome/Expense,Net197 (9)FinancialIncome,Net198 (10)IncomeTax201 (11)EarningsperShare202 (12)OtherFinancialAssets203 (13)TradeandOtherReceivables204 (14)OtherNon-FinancialAssets205 (15)GoodwillandIntangibleAssets209 (16)Property,Plant,andEquipment210 (17)TradeandOtherPayables,FinancialLiabilities,andOtherNon-FinancialLiabilities213 (18)Provisions223 (19)DeferredIncome223 (20)TotalEquity225 (21)AdditionalCapitalDisclosures227 (22)OtherFinancialCommitmentsandContingentLiabilities228 (23)LitigationandClaims232 (24)FinancialRiskFactors236 (25)FinancialRiskManagement242 (26)AdditionalFairValueDisclosuresonFinancialInstruments249 (27)Share-BasedPayments258 (28)SegmentandGeographicInformation263 (29)BoardofDirectors268 (30)RelatedPartyTransactions268 (31)PrincipalAccountantFeesandServices269 (32)GermanCodeofCorporateGovernance269 (33)SubsequentEvents270 (34)Subsidiaries,Associates,andOtherEquityInvestments
281 Management’sAnnualReportonInternalControlover FinancialReportingintheConsolidatedFinancialStatements
161

Consolidated Financial Statements IFRS
Consolidated Income Statements of SAP Group for the Years Ended December 31, €millions,unlessotherwisestated
Notes 2013 2012 2011
Software 4,516 4,658 4,107
Cloudsubscriptionsandsupport 696 270 18
Software and cloud subscriptions 5,212 4,928 4,125
Support 8,738 8,237 7,194
Software and software-related service revenue 13,950 13,165 11,319Consulting 2,242 2,442 2,341
Otherservices 623 616 573
Professional services and other service revenue 2,865 3,058 2,914Total revenue (5) 16,815 16,223 14,233
Costofsoftwareandsoftware-relatedservices −2,597 −2,555 −2,107
Costofprofessionalservicesandotherservices −2,402 −2,520 −2,247
Total cost of revenue −4,999 −5,075 −4,354Gross profit 11,816 11,147 9,879Researchanddevelopment −2,282 −2,261 −1,935
Sales and marketing −4,131 −3,912 −3,083
General and administration −866 −949 −715
Restructuring (18) −70 −8 −4
TomorrowNowlitigation (23) 0 0 717
Otheroperatingincome/expense,net (6) 12 23 25
Total operating expenses −12,336 −12,181 −9,348Operating profit 4,479 4,041 4,884
Other non-operating income/expense, net (8) −17 −173 −75Financeincome 115 103 119
Financecosts −181 −175 −161
Financial income, net (9) −66 −72 −42Profit before tax 4,396 3,796 4,767
IncometaxTomorrowNowlitigation 0 0 −281
Otherincometaxexpense −1,071 −993 −1,049
Incometaxexpense (10) −1,071 −993 −1,331
Profit after tax 3,325 2,803 3,437Profitattributabletonon-controllinginterests −1 0 1
Profit attributable to owners of parent 3,326 2,803 3,435
Earnings per share, basic (in €) (11) 2.79 2.35 2.89Earnings per share, diluted (in €) (11) 2.78 2.35 2.89
TheaccompanyingNotesareanintegralpartoftheseConsolidatedFinancialStatements.
162 Consolidated Financial Statements IFRS
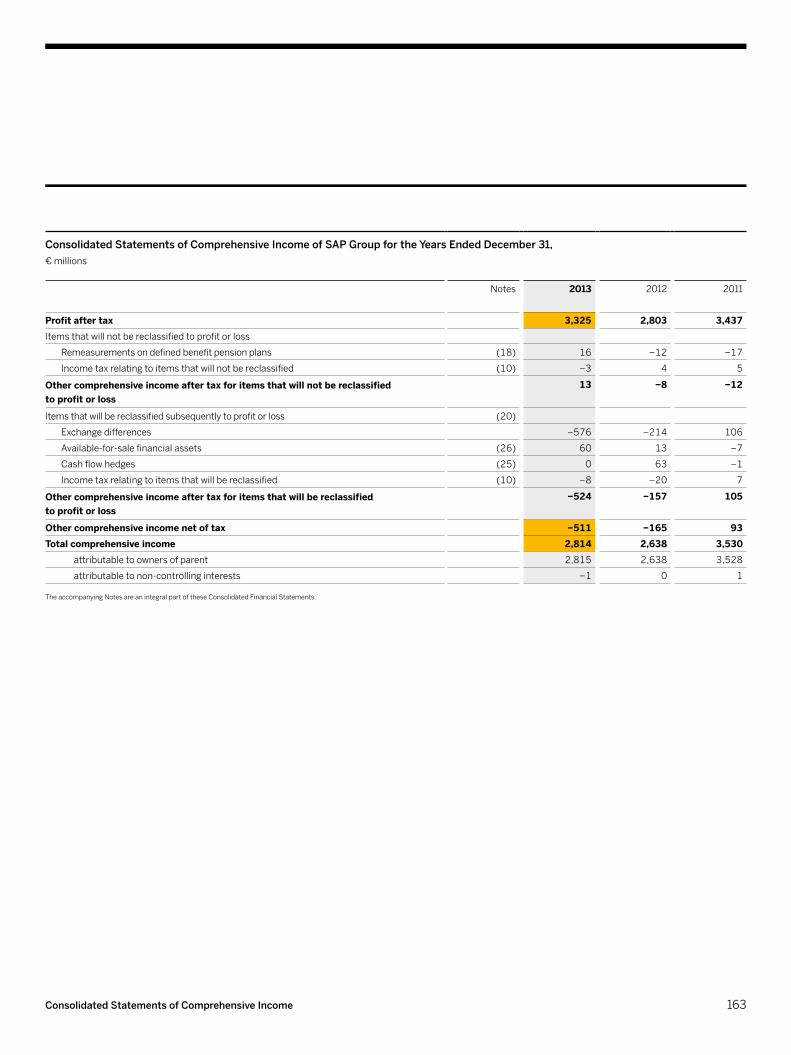
Consolidated Statements of Comprehensive Income of SAP Group for the Years Ended December 31,€ millions
Notes 2013 2012 2011
Profit after tax 3,325 2,803 3,437Itemsthatwillnotbereclassifiedtoprofitorloss
Remeasurementsondefinedbenefitpensionplans (18) 16 −12 −17
Incometaxrelatingtoitemsthatwillnotbereclassified (10) −3 4 5
Other comprehensive income after tax for items that will not be reclassified to profit or loss
13 −8 −12
Itemsthatwillbereclassifiedsubsequentlytoprofitorloss (20)
Exchangedifferences −576 −214 106
Available-for-salefinancialassets (26) 60 13 −7
Cashflowhedges (25) 0 63 −1
Incometaxrelatingtoitemsthatwillbereclassified (10) −8 −20 7
Other comprehensive income after tax for items that will be reclassified to profit or loss
−524 −157 105
Other comprehensive income net of tax −511 −165 93Total comprehensive income 2,814 2,638 3,530
attributable to owners of parent 2,815 2,638 3,528
attributabletonon-controllinginterests −1 0 1
TheaccompanyingNotesareanintegralpartoftheseConsolidatedFinancialStatements.
163Consolidated Statements of Comprehensive Income
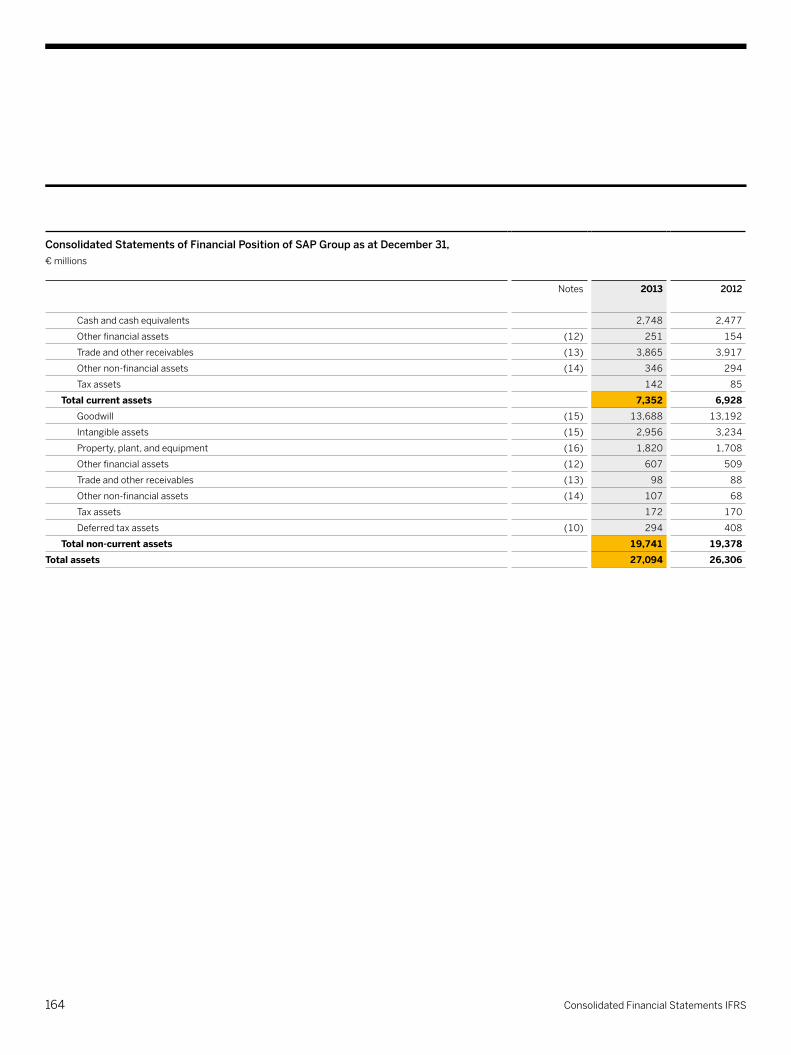
Consolidated Statements of Financial Position of SAP Group as at December 31, € millions
Notes 2013 2012
Cashandcashequivalents 2,748 2,477
Otherfinancialassets (12) 251 154
Tradeandotherreceivables (13) 3,865 3,917
Othernon-financialassets (14) 346 294
Taxassets 142 85
Total current assets 7,352 6,928Goodwill (15) 13,688 13,192
Intangibleassets (15) 2,956 3,234
Property,plant,andequipment (16) 1,820 1,708
Otherfinancialassets (12) 607 509
Tradeandotherreceivables (13) 98 88
Othernon-financialassets (14) 107 68
Taxassets 172 170
Deferredtaxassets (10) 294 408
Total non-current assets 19,741 19,378Total assets 27,094 26,306
164 Consolidated Financial Statements IFRS
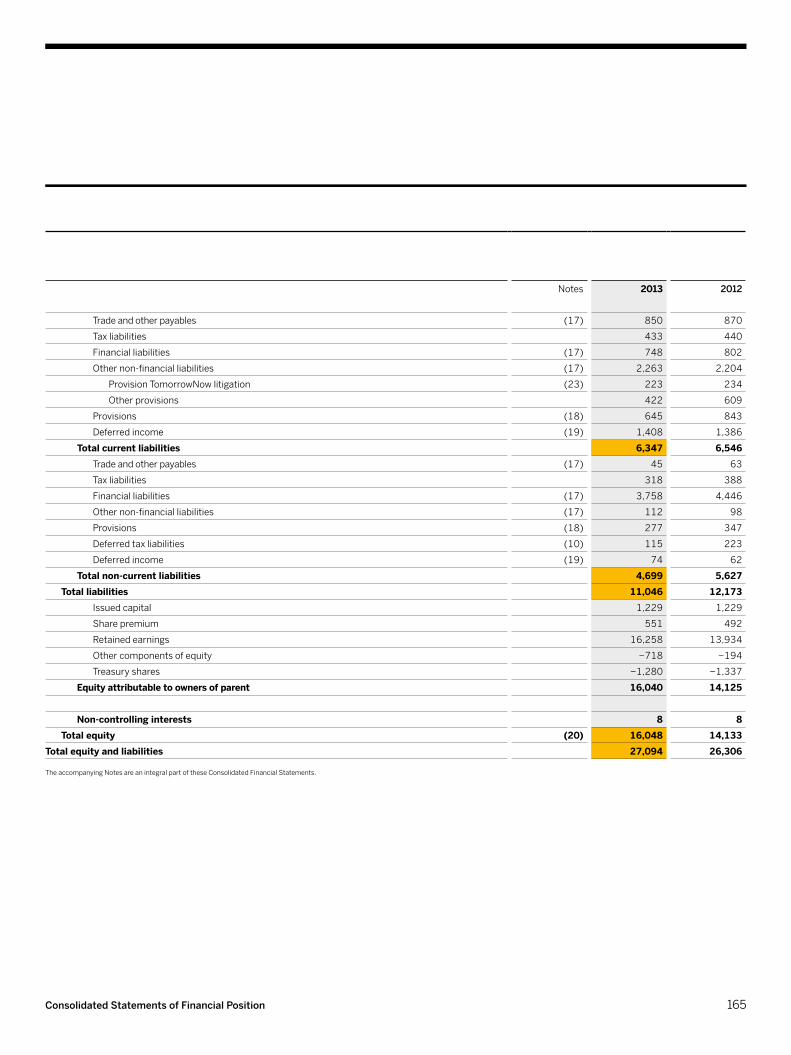
Notes 2013 2012
Tradeandotherpayables (17) 850 870
Taxliabilities 433 440
Financialliabilities (17) 748 802
Othernon-financialliabilities (17) 2,263 2,204
ProvisionTomorrowNowlitigation (23) 223 234
Otherprovisions 422 609
Provisions (18) 645 843
Deferred income (19) 1,408 1,386
Total current liabilities 6,347 6,546Tradeandotherpayables (17) 45 63
Taxliabilities 318 388
Financialliabilities (17) 3,758 4,446
Othernon-financialliabilities (17) 112 98
Provisions (18) 277 347
Deferredtaxliabilities (10) 115 223
Deferred income (19) 74 62
Total non-current liabilities 4,699 5,627Total liabilities 11,046 12,173
Issuedcapital 1,229 1,229
Sharepremium 551 492
Retainedearnings 16,258 13,934
Othercomponentsofequity −718 −194
Treasuryshares −1,280 −1,337
Equity attributable to owners of parent 16,040 14,125
Non-controlling interests 8 8Total equity (20) 16,048 14,133
Total equity and liabilities 27,094 26,306
TheaccompanyingNotesareanintegralpartoftheseConsolidatedFinancialStatements.
165Consolidated Statements of Financial Position
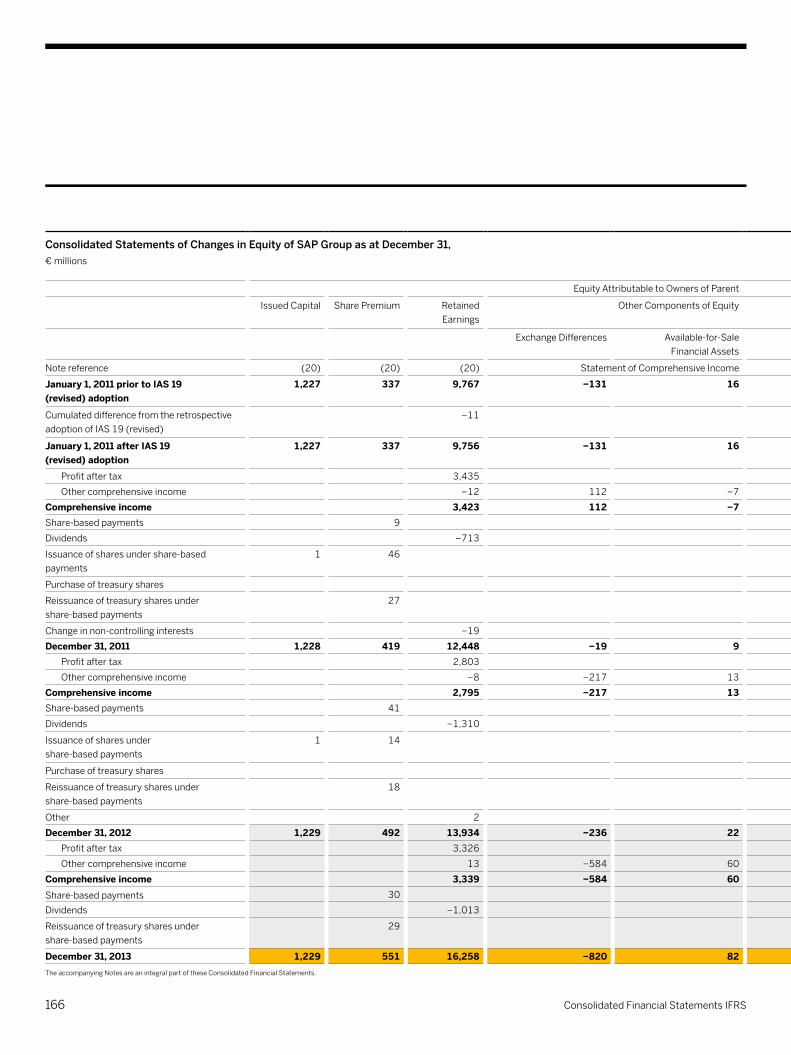
Consolidated Statements of Changes in Equity of SAP Group as at December 31, € millions
EquityAttributabletoOwnersofParent EquityAttributabletoOwnersofParent Non-ControllingInterests TotalEquity
IssuedCapital SharePremium Retained Earnings
OtherComponentsofEquity OtherComponentsofEquity TreasuryShares Total
ExchangeDifferences
Available-for-Sale FinancialAssets
CashFlowHedges
Notereference (20) (20) (20) StatementofComprehensiveIncome StatementofComprehensiveIncome (20)
January 1, 2011 prior to IAS 19 (revised) adoption
1,227 337 9,767 −131 16 −27 −1,382 9,807 17 9,824
CumulateddifferencefromtheretrospectiveadoptionofIAS19(revised)
−11 −11 −11
January 1, 2011 after IAS 19 (revised) adoption
1,227 337 9,756 −131 16 −27 −1,382 9,796 17 9,813
Profitaftertax 3,435 3,435 1 3,437Othercomprehensiveincome −12 112 −7 0 93 93
Comprehensive income 3,423 112 −7 0 3,528 1 3,530Share-basedpayments 9 9 9Dividends −713 −713 −713Issuanceofsharesundershare-based payments
1 46 47 47
Purchaseoftreasuryshares −246 −246 −246Reissuanceoftreasurysharesunder share-basedpayments
27 251 278 278
Changeinnon-controllinginterests −19 −19 −10 −29December 31, 2011 1,228 419 12,448 −19 9 −27 −1,377 12,681 8 12,689
Profitaftertax 2,803 2,803 2,803Othercomprehensiveincome −8 −217 13 47 −165 −165
Comprehensive income 2,795 −217 13 47 2,638 2,638Share-basedpayments 41 41 41Dividends −1,310 −1,310 −1,310
Issuanceofsharesunder share-basedpayments
1 14 15 15
Purchaseoftreasuryshares −53 −53 −53
Reissuanceoftreasurysharesunder share-basedpayments
18 93 111 111
Other 2 2 2December 31, 2012 1,229 492 13,934 −236 22 20 −1,337 14,125 8 14,133
Profitaftertax 3,326 3,326 −1 3,325Othercomprehensiveincome 13 −584 60 0 −511 −511
Comprehensive income 3,339 −584 60 0 2,815 −1 2,814Share-basedpayments 30 30 30Dividends −1,013 −1,013 −1,013Reissuanceoftreasurysharesunder share-basedpayments
29 57 86 86
December 31, 2013 1,229 551 16,258 −820 82 20 −1,280 16,040 8 16,048TheaccompanyingNotesareanintegralpartoftheseConsolidatedFinancialStatements.
166 Consolidated Financial Statements IFRS
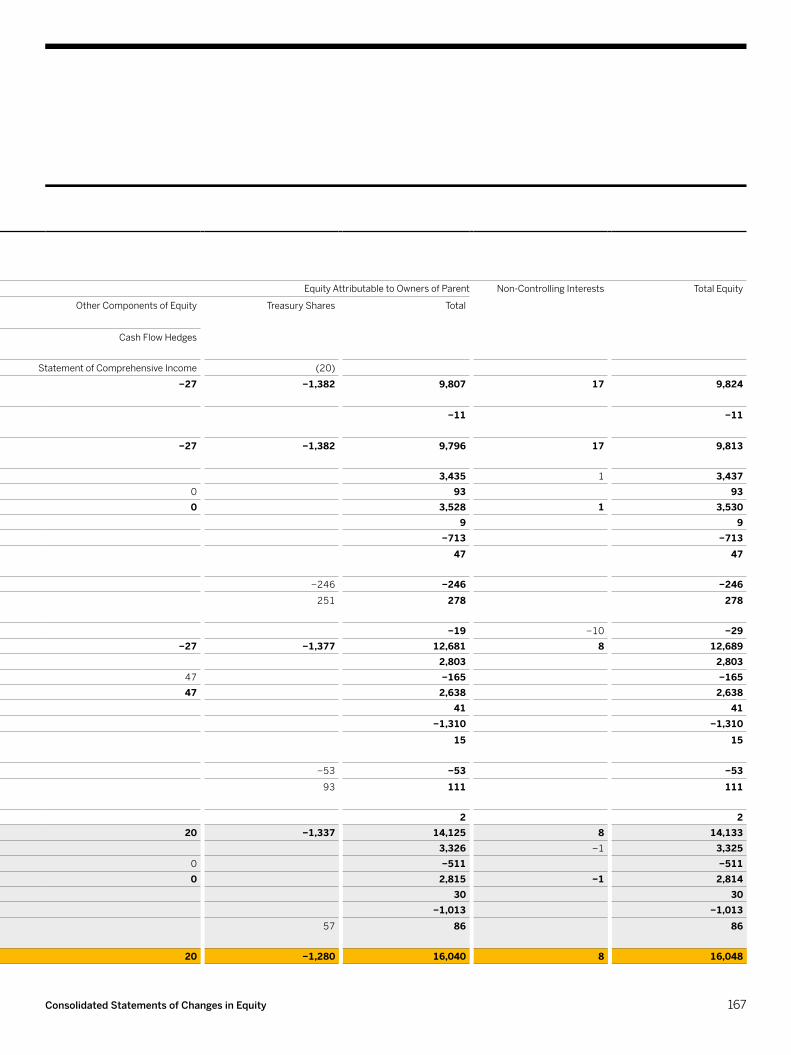
Consolidated Statements of Changes in Equity of SAP Group as at December 31, € millions
EquityAttributabletoOwnersofParent EquityAttributabletoOwnersofParent Non-ControllingInterests TotalEquity
IssuedCapital SharePremium Retained Earnings
OtherComponentsofEquity OtherComponentsofEquity TreasuryShares Total
ExchangeDifferences
Available-for-Sale FinancialAssets
CashFlowHedges
Notereference (20) (20) (20) StatementofComprehensiveIncome StatementofComprehensiveIncome (20)
January 1, 2011 prior to IAS 19 (revised) adoption
1,227 337 9,767 −131 16 −27 −1,382 9,807 17 9,824
CumulateddifferencefromtheretrospectiveadoptionofIAS19(revised)
−11 −11 −11
January 1, 2011 after IAS 19 (revised) adoption
1,227 337 9,756 −131 16 −27 −1,382 9,796 17 9,813
Profitaftertax 3,435 3,435 1 3,437Othercomprehensiveincome −12 112 −7 0 93 93
Comprehensive income 3,423 112 −7 0 3,528 1 3,530Share-basedpayments 9 9 9Dividends −713 −713 −713Issuanceofsharesundershare-based payments
1 46 47 47
Purchaseoftreasuryshares −246 −246 −246Reissuanceoftreasurysharesunder share-basedpayments
27 251 278 278
Changeinnon-controllinginterests −19 −19 −10 −29December 31, 2011 1,228 419 12,448 −19 9 −27 −1,377 12,681 8 12,689
Profitaftertax 2,803 2,803 2,803Othercomprehensiveincome −8 −217 13 47 −165 −165
Comprehensive income 2,795 −217 13 47 2,638 2,638Share-basedpayments 41 41 41Dividends −1,310 −1,310 −1,310
Issuanceofsharesunder share-basedpayments
1 14 15 15
Purchaseoftreasuryshares −53 −53 −53
Reissuanceoftreasurysharesunder share-basedpayments
18 93 111 111
Other 2 2 2December 31, 2012 1,229 492 13,934 −236 22 20 −1,337 14,125 8 14,133
Profitaftertax 3,326 3,326 −1 3,325Othercomprehensiveincome 13 −584 60 0 −511 −511
Comprehensive income 3,339 −584 60 0 2,815 −1 2,814Share-basedpayments 30 30 30Dividends −1,013 −1,013 −1,013Reissuanceoftreasurysharesunder share-basedpayments
29 57 86 86
December 31, 2013 1,229 551 16,258 −820 82 20 −1,280 16,040 8 16,048TheaccompanyingNotesareanintegralpartoftheseConsolidatedFinancialStatements.
167Consolidated Statements of Changes in Equity
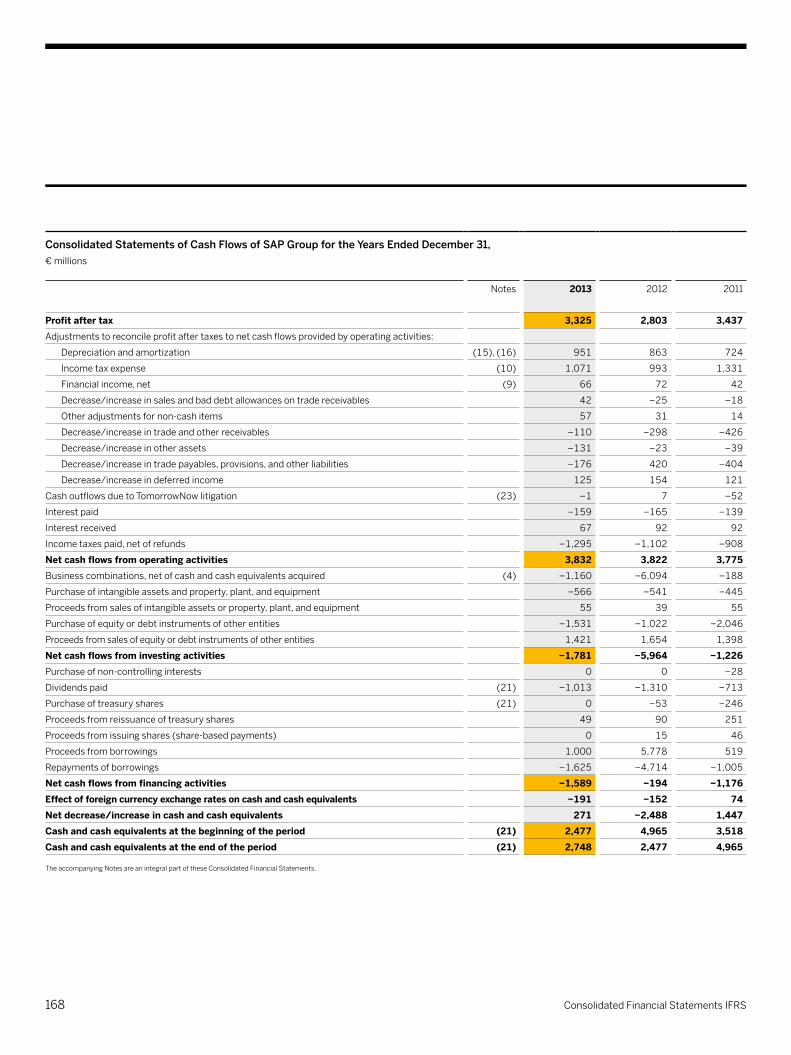
Consolidated Statements of Cash Flows of SAP Group for the Years Ended December 31, € millions
Notes 2013 2012 2011
Profit after tax 3,325 2,803 3,437Adjustmentstoreconcileprofitaftertaxestonetcashflowsprovidedbyoperatingactivities:
Depreciation and amortization (15),(16) 951 863 724
Incometaxexpense (10) 1,071 993 1,331
Financialincome,net (9) 66 72 42
Decrease/increaseinsalesandbaddebtallowancesontradereceivables 42 −25 −18
Otheradjustmentsfornon-cashitems 57 31 14
Decrease/increaseintradeandotherreceivables −110 −298 −426
Decrease/increaseinotherassets −131 −23 −39
Decrease/increaseintradepayables,provisions,andotherliabilities −176 420 −404
Decrease/increaseindeferredincome 125 154 121
CashoutflowsduetoTomorrowNowlitigation (23) −1 7 −52
Interestpaid −159 −165 −139
Interestreceived 67 92 92
Incometaxespaid,netofrefunds −1,295 −1,102 −908
Net cash flows from operating activities 3,832 3,822 3,775Businesscombinations,netofcashandcashequivalentsacquired (4) −1,160 −6,094 −188
Purchaseofintangibleassetsandproperty,plant,andequipment −566 −541 −445
Proceedsfromsalesofintangibleassetsorproperty,plant,andequipment 55 39 55
Purchaseofequityordebtinstrumentsofotherentities −1,531 −1,022 −2,046
Proceedsfromsalesofequityordebtinstrumentsofotherentities 1,421 1,654 1,398
Net cash flows from investing activities −1,781 −5,964 −1,226Purchaseofnon-controllinginterests 0 0 −28
Dividends paid (21) −1,013 −1,310 −713
Purchaseoftreasuryshares (21) 0 −53 −246
Proceedsfromreissuanceoftreasuryshares 49 90 251
Proceedsfromissuingshares(share-basedpayments) 0 15 46
Proceeds from borrowings 1,000 5,778 519
Repaymentsofborrowings −1,625 −4,714 −1,005
Net cash flows from financing activities −1,589 −194 −1,176Effect of foreign currency exchange rates on cash and cash equivalents −191 −152 74Net decrease/increase in cash and cash equivalents 271 −2,488 1,447Cash and cash equivalents at the beginning of the period (21) 2,477 4,965 3,518Cash and cash equivalents at the end of the period (21) 2,748 2,477 4,965
TheaccompanyingNotesareanintegralpartoftheseConsolidatedFinancialStatements.
168 Consolidated Financial Statements IFRS
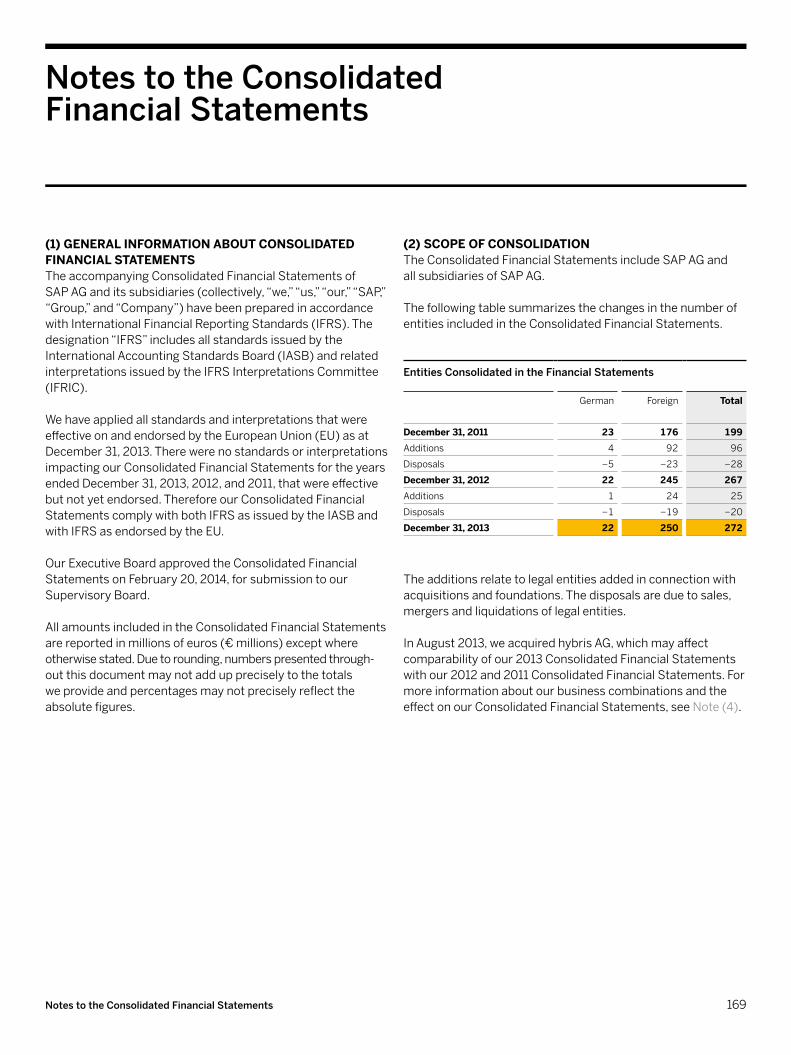
(1) GEnErAl InFOrmAtIOn AbOut COnSOlIDAtED FInAnCIAl StAtEmEntSTheaccompanyingConsolidatedFinancialStatementsof SAPAGanditssubsidiaries(collectively,“we,”“us,”“our,”“SAP,”“Group,”and“Company”)havebeenpreparedinaccordancewithInternationalFinancialReportingStandards(IFRS).Thedesignation“IFRS”includesallstandardsissuedbytheInternationalAccountingStandardsBoard(IASB)andrelatedinterpretationsissuedbytheIFRSInterpretationsCommittee(IFRIC).
WehaveappliedallstandardsandinterpretationsthatwereeffectiveonandendorsedbytheEuropeanUnion(EU)asatDecember31,2013.TherewerenostandardsorinterpretationsimpactingourConsolidatedFinancialStatementsfortheyearsendedDecember31,2013,2012,and2011,thatwereeffectivebutnotyetendorsed.ThereforeourConsolidatedFinancialStatementscomplywithbothIFRSasissuedbytheIASBandwithIFRSasendorsedbytheEU.
OurExecutiveBoardapprovedtheConsolidatedFinancialStatementsonFebruary20,2014,forsubmissiontoourSupervisoryBoard.
AllamountsincludedintheConsolidatedFinancialStatementsarereportedinmillionsofeuros(€millions)exceptwhere otherwisestated.Duetorounding,numberspresentedthrough- outthisdocumentmaynotadduppreciselytothetotals weprovideandpercentagesmaynotpreciselyreflecttheabsolutefigures.
(2) SCOpE OF COnSOlIDAtIOnTheConsolidatedFinancialStatementsincludeSAPAGand all subsidiaries of SAP AG.
ThefollowingtablesummarizesthechangesinthenumberofentitiesincludedintheConsolidatedFinancialStatements.
Entities Consolidated in the Financial Statements
German Foreign Total
December 31, 2011 23 176 199Additions 4 92 96
Disposals −5 −23 −28
December 31, 2012 22 245 267Additions 1 24 25
Disposals −1 −19 −20
December 31, 2013 22 250 272
Theadditionsrelatetolegalentitiesaddedinconnectionwithacquisitionsandfoundations.Thedisposalsareduetosales,mergersandliquidationsoflegalentities.
InAugust2013,weacquiredhybrisAG,whichmayaffectcomparabilityofour2013ConsolidatedFinancialStatementswithour2012and2011ConsolidatedFinancialStatements.FormoreinformationaboutourbusinesscombinationsandtheeffectonourConsolidatedFinancialStatements,seeNote(4).
Notes to the Consolidated Financial Statements
169Notes to the Consolidated Financial Statements
asexpenseintheperiodsinwhichthecostsareincurred andtheservicesarereceived,withtheexpensebeingclassifiedasgeneralandadministrationexpense.
Theexcessoftheconsiderationtransferredinabusinesscombinationoverthefairvalueoftheidentifiablenetassetsacquiredisrecordedasgoodwill.
Withrespecttoat-equityinvestments,thecarryingamountofgoodwillisincludedinthecarryingamountoftheinvestment.
Foreign CurrenciesAssetsandliabilitiesofourforeignsubsidiariesthatuse afunctionalcurrencyotherthantheeuroaretranslatedattheclosingrateatthedateoftheStatementofFinancialPosition.Incomeandexpensesaretranslatedataverageratesofexchangecomputedonamonthlybasis.Allresultingexchangedifferencesarerecognizedinothercomprehensiveincome.Exchangedifferencesfrommonetaryitemsdenominatedinforeigncurrencytransactionsthatarepartofalong-terminvestment(thatis,settlementisneitherplannednorlikelytooccurintheforeseeablefuture)arealsoincludedinothercomprehensiveincome.Whenaforeignoperationisdisposedof,liquidated,orabandoned,theforeigncurrencytranslationadjustmentsapplicabletothatentityarereclassifiedfromothercomprehensiveincometoprofitorloss.
(3) SummAry OF SIGnIFICAnt ACCOuntInG pOlICIES
(3a) bases of measurementTheConsolidatedFinancialStatementshavebeenpreparedonthehistoricalcostbasisexceptforthefollowing:–Derivativefinancialinstruments,available-for-salefinancialassets,andliabilitiesforcash-settledshare-basedpaymentsare measured at fair value.
–Monetaryassetsandliabilitiesdenominatedinforeigncurrenciesaretranslatedatperiod-endexchangerates.
–Post-employmentbenefitsaremeasuredaccordingtoIAS19(EmployeeBenefits)asdescribedinNote(18a).
Whereapplicable,informationaboutthemethodsandassump- tionsusedindeterminingtherespectivemeasurementbasesisdisclosedintheNotesspecifictothatassetorliability. (3b) relevant Accounting policies
Business Combinations and GoodwillBusinesscombinationsareaccountedforusingtheacquisitionmethodasattheclosingdate,whichisthedateonwhichweobtaincontroloftheacquiree.Theconsiderationtransferredinanacquisitionismeasuredatthefairvalueoftheassetstrans- ferredandliabilitiesincurredatthedateoftransferofcontrol.Settlementsofpre-existingrelationshipsarenotincludedintheconsiderationtransferred.Suchamountsarerecognizedinprofitandloss.Identifiableassetsacquiredandliabilitiesassumed in a business combination (including contingent consideration)aremeasuredattheiracquisitiondatefairvalues. Changesincontingentconsiderationclassifiedasaliabilityattheacquisitiondatearerecognizedinprofitandlossunlesstheyrelatedtofactsthatexistedatthemeasurementdatethatwebecomeawareofduringthemeasurementperiod.Wedecideonatransaction-by-transactionbasiswhethertomeasurethenon-controllinginterestintheacquireeeitheratfairvalueorattheproportionateshareoftheacquiree’sidentifiablenetassets.Acquisition-relatedcostsareaccounted
170 Consolidated Financial Statements IFRS

aretranslatedintoeurosusingtheexchangeratesineffect atthetimeoftherespectivetransaction.TheeffectofexchangeratechangesoncashisreportedinaseparatelineitemintheConsolidatedStatementsofCashFlows.
Anygoodwillarisingfromtheacquisitionofaforeignoperationandanyfairvalueadjustmentstothecarryingamountsofassetsandliabilitiesarisingfromtheacquisitionaretreatedasassetsandliabilitiesoftheforeignoperationandtranslated attherespectiveclosingrates.
TheexchangeratesofkeycurrenciesaffectingtheCompanywereasfollows:
Exchange RatesEquivalentto€1
ClosingRateasatDecember31, AnnualAverageExchangeRate
2013 2012 2013 2012 2011
U.S.dollar USD 1.3791 1.3194 1.3301 1.2862 1.3863
Pound sterling GBP 0.8337 0.8161 0.8482 0.8104 0.8656
Japaneseyen JPY 144.72 113.61 130.21 103.05 110.17
Swiss franc CHF 1.2276 1.2072 1.2302 1.2055 1.2299
Canadiandollar CAD 1.4671 1.3137 1.3710 1.2843 1.3739
Australian dollar AUD 1.5423 1.2712 1.3944 1.2419 1.3436
Oninitialrecognition,foreigncurrencytransactionsarerecordedintherespectivefunctionalcurrenciesofGroupentitiesbyapplyingtotheforeigncurrencyamounttheexchangerateatthedateofthetransaction.Monetaryassetsandliabilitiesthataredenominatedinforeigncurrencies areremeasuredattheperiod-endclosingrate.Resultingexchangedifferencesarerecognized,intheperiodinwhichtheyarise,inothernon-operatingexpense.
Operatingcashflowsofforeignsubsidiariesaretranslatedintoeurosusingaverageratesofexchangecomputedonamonthlybasis.Investingandfinancingcashflowsofforeignsubsidiaries
Revenue RecognitionWederiveourrevenuefromfeeschargedtoourcustomersfor(a)licensestoouron-premisesoftwareproducts,(b)theuse ofourhostedcloudsubscriptionsoftwareofferingsand(c)support,consulting,development,training,andotherservices.Themajorityofoursoftwarearrangementsincludesupportservices,andmanyalsoincludeprofessionalservicesandotherelements.
Softwareandsoftware-relatedservicerevenue,asshowninourConsolidatedIncomeStatements,isthesumofoursoftwarerevenue, our support revenue and our cloud subscriptions and supportrevenue.ProfessionalservicesandotherservicerevenueasshowninourConsolidatedIncomeStatementsisthesumofourconsultingrevenueandotherservicerevenue.OtherservicerevenueasshowninourConsolidatedIncomeStatementsmainlyconsistsofrevenuefromtrainingservices,messagingservices,andSAPmarketingevents.RevenueinformationbysegmentandgeographicregionisdisclosedinNote(28).
171Notes to the Consolidated Financial Statements

Weusuallysellorlicenseon-premisesoftwareonaperpetualbasis.Occasionally,welicenseon-premisesoftwareforaspecifiedperiodoftime.Revenuefromshort-termtime-basedlicenses,whichusuallyincludesupportservicesduringthelicenseperiod,isrecognizedratablyoverthelicenseterm.Revenuefrommulti-yeartime-basedlicensesthatincludesupportservices,whetherseparatelypricedornot,is recognizedratablyoverthelicensetermunlessasubstantivesupportservicerenewalrateexists;ifthisisthecase,theamount allocatedtothedeliveredsoftwareisrecognizedassoftwarerevenuebasedontheresidualmethodoncethebasiccriteriadescribedabovehavebeenmet.
Ingeneral,oursoftwarelicenseagreementsdonotincludeacceptance-testingprovisions.Ifanarrangementallows forcustomeracceptance-testingofthesoftware,wedeferrevenueuntiltheearlierofcustomeracceptanceorwhen theacceptancerightlapses.
Weusuallyrecognizerevenuefromon-premisesoftwarearrangementsinvolvingresellersonevidenceofsell-throughbytheresellertotheend-customer,becausetheinflowoftheeconomicbenefitsassociatedwiththearrangementstousisnotprobablebeforesell-throughhasoccurred.
Sometimesweenterintocustomer-specificon-premisesoftware development agreements. We recognize software revenue in connectionwiththesearrangementsusingthepercentage-of-completionmethodbasedoncontractcostsincurredtodateasapercentageoftotalestimatedcontractcostsrequired tocompletethedevelopmentwork.Ifwedonothaveasuffic- ientbasistoreasonablymeasuretheprogressofcompletionortoestimatethetotalcontractrevenueandcosts,revenueisrecognizedonlytotheextentofthecontractcostsincurredforwhichwebelieverecoverabilitytobeprobable.Whenitbecomes probablethattotalcontractcostsexceedtotalcontractrevenueinanarrangement,theexpectedlossesarerecognizedimmediatelyasanexpensebasedonthecostsattributable tothecontract.
If,foranyofourproductorserviceofferings,wedetermineattheoutsetofanarrangementthattheamountofrevenuecannotbemeasuredreliably,weconcludethattheinflowofeconomicbenefitsassociatedwiththetransactionisnotprobable,andwedeferrevenuerecognitionuntilthearrangement feebecomesdueandpayablebythecustomer.If,attheoutsetofanarrangement,wedeterminethatcollectabilityisnotprobable,weconcludethattheinflowofeconomicbenefitsassociatedwiththetransactionisnotprobable,andwe defer revenuerecognitionuntiltheearlierofwhencollectabilitybecomesprobableorpaymentisreceived.Ifcollectabilitybecomes not probable before all revenue from an arrangement isrecognized,werecognizerevenueonlytotheextentofthefeesthataresuccessfullycollectedunlesscollectabilitybecomesprobableagain.Ifacustomerisspecificallyidentifiedasabaddebtor,westoprecognizingrevenuefromthecustomerexcepttotheextentofthefeesthathavealreadybeen collected.
Weaccountforout-of-pocketexpensesinvoicedbySAPandreimbursedbycustomersassupport,cloudsubscriptionandsupport,consulting,orotherservicerevenue,dependingonthenatureoftheserviceforwhichtheout-of-pocketexpenseswere incurred.
Softwarerevenuerepresentsfeesearnedfromthesale orlicenseofsoftwaretocustomersforuseonthecustomer’spremises,inotherwords,wherethecustomerhastherighttotakepossessionofthesoftwareforinstallationonthecustomer’spremises(on-premisesoftware).Revenuefrom thesaleofperpetuallicensesofourstandardsoftwareproductsisrecognizedinlinewiththerequirementsforsellinggoods statedinIAS18(Revenue)whenevidenceofan arrangementexists,deliveryhasoccurred,therisksandrewardsofownershiphavebeentransferredtothecustomer,theamountofrevenueandassociatedcostscanbemeasuredreliably,andcollectionoftherelatedreceivableisprobable. Thefeeofthesaleisrecognizednetofreturnsandallowances,trade discounts, and volume rebates.
172 Consolidated Financial Statements IFRS
Revenuefromcloudsubscriptionsandsupportrepresents feesearnedfromprovidingcustomerswith:–Therighttousesoftwareinacloud-based-infrastructure(hosting)providedbySAP,wherethecustomerdoes nothavetherighttoterminatethehostingcontractandtakepossessionofthesoftwaretorunitonthecustomer’sown ITinfrastructureorbyathirdpartyhostingproviderwithoutsignificantpenalty,or
–AdditionalpremiumsupportbeyondthestandardsupportwhichisincludedinSAP’sbasiccloudsubscriptionfees,or
–HostingservicesandrelatedapplicationmanagementservicesforsoftwarehostedbySAP,wherethecustomer hastherighttoterminatethehostingcontractandtakepossessionofthesoftwarewithoutsignificantpenalty.
Cloudsubscriptionandsupportrevenueisrecognizedastheservicesareperformed.Whereafixedfeeisagreedfor therighttocontinuouslyaccessanduseacloudofferingfor acertainterm,thefeeisrecognizedratablyoverthetermcoveredbythefixedfee.Feesthatarebasedonactualtrans- actionvolumesarerecognizedasthetransactionsoccur.
Revenuefromconsultingprimarilyrepresentsfeesearnedfromprovidingcustomerswithconsultingserviceswhichprimarilyrelatetotheinstallationandconfigurationofoursoftwareproductsandcloudofferings.Usually,ourconsultingcontractsdonotinvolvesignificantproduction,modification,orcustomizationofsoftwareandtherelatedrevenueisrecognizedastheservicesareprovidedusingthepercentage-of-completionmethodofaccountingasoutlinedabove.
On-premisesoftwaresubscriptioncontractscombinesoftwareandsupportserviceelements,asunderthesecontractsthecustomerisprovidedwithcurrentsoftwareproducts,rightstoreceiveunspecifiedfuturesoftwareproducts,andrightstoproductsupportduringtheon-premisesoftwaresubscriptionterm.Customerspayaperiodicfeeforadefinedsubscriptionterm,andwerecognizesuchfeesratablyoverthetermof thearrangementbeginningwiththedeliveryofthefirstproduct.Revenuefromon-premisesoftwaresubscriptioncontracts isallocatedtothesoftwarerevenueandsupportrevenuelineitemsinourConsolidatedIncomeStatements.
On-premisesoftwarerentalcontractsalsocombinesoftwareandsupportserviceelements.Undersuchcontractsthecustomerisprovidedwithcurrentsoftwareproductsandproductsupport,butnotwiththerighttoreceiveunspecifiedfuturesoftwareproducts.Customerspayaperiodicfeeovertherentalterm.Werecognizefeesfromsoftwarerentalcontractsratablyoverthetermofthearrangement.Revenuefromrentalcontractsisallocatedtothesoftwarerevenue andsupportrevenuelineitemsinourConsolidatedIncomeStatements.
Support revenue represents fees earned from providing customerswithunspecifiedfuturesoftwareupdates,upgrades,andenhancements,andtechnicalproductsupportservices foron-premisesoftwareproducts.Werecognizesupportrevenue basedonourperformanceunderthesupportarrangements.Underourmajorsupportservicesourperformanceobligationistostandreadytoprovidetechnicalproductsupportand toprovideunspecifiedupdatesandenhancementsonawhen-and-if-availablebasis.Forthesesupportserviceswerecognizerevenueratablyoverthetermofthesupportarrangement. Wedonotsellseparatelytechnicalproductsupportorunspeci- fiedsoftwareupgrades,updates,andenhancements.Accordingly, wedonotdistinguishwithinsoftwareandsoftware-relatedservicerevenueorwithincostofsoftwareandsoftware-relatedservicestheamountsattributabletotechnicalsupportservicesandunspecifiedsoftwareupgrades,updates,andenhancements.
173Notes to the Consolidated Financial Statements

Wederivethecompany-specificobjectiveevidenceoffairvalueforoursupportservicesfromtherateschargedtorenewthesupportservicesannuallyafteraninitialperiod.Suchrenewalratesgenerallyrepresentafixedpercentageofthediscountedsoftwarelicensefeechargedtothecustomer.Themajorityofourcustomersrenewtheirannualsupportservicecontracts attheserates.
Wherecompany-specificobjectiveevidenceoffairvalueorthird-partyevidenceofsellingpricecannotbeestablished fordeliverables,wedeterminethefairvalueoftherespectiveelementbyestimatingitsstand-alonesellingprice.Thisisgenerallythecaseforourcloudsubscriptionofferings.
Estimatedstand-alonesellingprice(ESP)forourcloudsubscriptionofferingsisdeterminedbasedontheratesagreedwiththeindividualcustomerstoapplyifandwhenthesub- scriptionarrangementrenews.WedetermineESPbyconsid- eringmultiplefactorswhichinclude,butarenotlimitedto, thefollowing:i)substantiverenewalratescontainedwithinanarrangementforcloudsubscriptiondeliverables;ii)grossmarginobjectivesandinternalcostsforservices;and iii)pricingpractices,marketconditions,andcompetitivelandscape.
Weapplytheresidualmethodofrevenuerecognitionwhencompany-specificobjectiveevidenceoffairvalueorestimatedstand-alonesellingpriceexistsforalloftheundeliveredelementsinthearrangement,butdoesnotexistforoneormoredeliveredelements.Thisisgenerallythecaseinmultipleelementarrangementsinvolvingon-premisesoftwareandservicesrelatedtoon-premisesoftwarewherecompany-specificobjectiveevidenceoffairvalueorestimatedstand-alonesellingpriceexistsforalltheservicesinthearrangement(forexample,supportservices,consultingservices,cloudsubscriptionservices),butdoesnotexistfortheon-premisesoftware.Undertheresidualmethod,revenueisallocatedtoallundeliveredelementsintheamountoftheirrespectivefairvaluesandtheremainingamountofthearrangementfeeisallocatedtothedeliveredelement.WiththispolicywehaveconsideredtheguidanceprovidedbyFASBASCSubtopic985-605,SoftwareRevenueRecognition(FASBASC985-605),whereapplicable,asauthorizedbyIAS8AccountingPolicies,ChangesinAccountingEstimatesandErrors(IAS8).
Revenuefromotherservicesrepresentsfeesearned fromprovidingcustomerswithtrainingservices,applicationmanagementservicesforsoftwarenothostedbySAP,messaging services, SAP marketing events, and referral services. – Training services provide educational services to customers andpartnersregardingtheuseofoursoftwareproducts. We recognize training revenue and application management servicesastheservicesarerendered.
–Messagingservicesprimarilycomprisethetransmissionofelectronictextmessagesfromonemobilephoneprovider toanother.Werecognizerevenuefrommessageservicesbaseduponthenumberofmessagessuccessfullyprocessedanddelivered.Revenuefromfixed-pricemessagingarrangementsisrecognizedratablyoverthecontractualtermofthearrangement.
–RevenuefrommarketingeventshostedbySAP,forwhichSAPsellsticketstoitscustomers,isrecognizedwhen themarketingeventiscompleted.
–Referralservicescomprisereferringcustomerstopartners.We recognize revenue from referral services upon providing thereferral.
Themajorityofourarrangementscontainmultipleelements.We account for software, support, cloud subscription, consultingandotherservicedeliverablesasseparateunitsofaccountandallocaterevenuebasedonfairvalue.Fairvalue isdeterminedbyestablishingeithercompany-specificobjectiveevidence,oranestimatedstand-alonesellingprice.
Therevenueamountsallocatedtotheindividualelements arerecognizedwhentherevenuerecognitioncriteriadescribedabovehavebeenmetfortherespectiveelement.
Wegenerallydeterminethefairvalueofeachelementbased onitscompany-specificobjectiveevidenceoffairvalue,whichisthepricechargedwhenthatelementissoldseparatelyor, forelementsnotyetsoldseparately,thepriceestablishedbyourmanagementifitisprobablethatthepricewillnotchangebeforetheelementissoldseparately.
174 Consolidated Financial Statements IFRS
Cost of Software and Software-Related ServicesCostofsoftwareandsoftware-relatedservicesincludesthecostincurredinproducingthegoodsandprovidingtheservicesthatgeneratesoftwareandsoftware-relatedservicerevenue.Consequently,thislineitemincludesprimarilyemployeeexpensesrelatingtotheseservices,amortizationofacquiredintangibles,feesforthird-partylicenses,shipping andramp-upcost.
Cost of Professional Services and Other ServicesCostofprofessionalservicesandotherservicesincludes thecostincurredinprovidingtheservicesthatgenerateprofessionalserviceandotherservicerevenueincludingmessagingrevenues.Theitemalsoincludessalesandmarketingexpensesrelatedtoourprofessionalservicesandotherservicesthatresultfromsalesandmarketingefforts thatcannotbeclearlyseparatedfromprovidingtheservices.
Inmultipleelementarrangementswherecompany-specificobjectiveevidenceoffairvalueoranestimatedstand-alonesellingpriceexistsforallelements,revenueisallocatedto theelementsbasedontheirrelativefairvalues(relativefairvaluemethod).
Ourconsiderationofwhetheron-premisesoftware,cloudsubscriptions,consultingorotherservicesaretobeaccountedforseparatelyorasonecombinedelementofthearrangementdependson:–Whetherthearrangementinvolvessignificantproduction,modification,orcustomizationofthesoftwareorcloudsubscription, and
–Whethertheservicesarenotavailablefromthird-partyvendorsandarethereforedeemedessentialtothesoftware.
Ifneitheroftheaboveisthecase,revenuefortheon-premisesoftwareorcloudsubscriptionelement,andtheotherelements,arerecognizedseparately.Incontrast,ifoneorbothoftheaboveapplies,therespectiveelementsofthearrange- ment are combined and accounted for as a single unit of account,andtheportionofthearrangementfeeallocatedtothissingleunitofaccountisrecognizedusingthepercentage-of-completionmethod,asoutlinedabove,oroverthecloudsubscriptionterm,ifapplicable,dependingonwhichserviceterm is longer.
WeconsiderFASBASC985-605inouraccountingforoptionsthatentitlethecustomertopurchase,inthefuture,additionalon-premisesoftware.Weallocaterevenuetofutureincrementaldiscountswhenevercustomersaregrantedtherighttolicenseadditionalon-premisesoftwareatahigherdiscountthantheonegivenwithintheinitialsoftwarelicensearrangement,ortopurchaseorrenewservicesatratesbelowthefairvaluesestablishedfortheseservices.
Ourcontributionstoresellersthatallowourresellerstoexecutequalifiedandapprovedmarketingactivitiesarerecog- nizedasanoffsettorevenue,unlessweobtainaseparateidentifiablebenefitforthecontribution,andthefairvalueofthebenefitisreasonablyestimable.
175Notes to the Consolidated Financial Statements

LeasesWearealesseeofproperty,plant,andequipment,mainlybuildings,hardware,andvehicles,underoperatingleasesthatdonottransfertousthesubstantiverisksandrewardsofownership.Rentexpenseonoperatingleasesisrecognizedonastraight-linebasisoverthelifeoftheleaseincludingrenewaltermsif,atinceptionofthelease,renewalisreasonablyassured.
Someofouroperatingleasescontainlesseeincentives,suchasup-frontpaymentsofcostsorfreeorreducedperiodsofrent.Theincentivesareamortizedoverthelifeoftheleaseandtherentexpenseisrecognizedonastraight-linebasisover thelifeofthelease.Thesameappliestocontractually-agreedfuture increases of rents.
Income TaxDeferredtaxesareaccountedforundertheliabilitymethod.WerecognizedeferredtaxassetsandliabilitiesforthefuturetaxconsequencesattributabletodifferencesbetweenthecarryingamountsofexistingassetsandliabilitiesintheConsolidatedStatementsofFinancialPositionandtheirrespectivetaxbasesandonthecarryforwardsofunusedtaxlossesandunusedtaxcredits.Deferredtaxassetsarerecognizedtotheextentthatitisprobablethattaxableprofitwillbeavailableagainstwhichthedeductibletemporarydifferences,unusedtaxlosses,andunusedtaxcreditscanbeutilized.
Deferredtaxassetsandliabilitiesaremeasuredatthetax ratesthatareexpectedtoapplytotheperiodwhentheassetisrealizedortheliabilityissettled,basedontaxratesandtaxlawsthathavebeenenactedorsubstantivelyenactedbytheendofthereportingperiod.Theeffectondeferredtaxassetsandliabilitiesofachangeintaxratesisrecognizedinprofitorloss,unlessrelatedtoitemsrecognizedinothercomprehen- siveincomeordirectlyinequity,intheperiodof(substantive)enactment.
Research and DevelopmentResearchanddevelopmentincludesthecostsincurredbyactivitiesrelatedtothedevelopmentofsoftwaresolutions(newproducts,updates,andenhancements)includingresourceandhardwarecostsforthedevelopmentsystems.
Developmentactivitiesinvolvetheapplicationofresearchfindingsorotherknowledgetoaplanordesignofneworsubstantiallyimprovedsoftwareproductsbeforethestartofcommercialuse.Developmentexpendituresarecapitalizedonlyifallofthefollowingcriteriaaremet:–Thedevelopmentcostcanbemeasuredreliably.–Theproductistechnicallyandcommerciallyfeasible.–Futureeconomicbenefitsareprobable.–Weintendtocompletedevelopmentandmarkettheproduct.
Wehavedeterminedthattheconditionsforrecognizinginternallygeneratedintangibleassetsfromoursoftwaredevelopmentactivitiesarenotmetuntilshortlybefore theproductsareavailableforsale.Developmentcostsincurredaftertherecognitioncriteriaaremethavenotbeenmaterial.Consequently,allresearchanddevelopmentcostsareexpensedasincurred.
Sales and Marketing Salesandmarketingincludescostsincurredforthesellingandmarketingactivitiesrelatedtooursoftwaresolutions,software-related service portfolio, and cloud business.
General and AdministrationGeneralandadministrationincludescostsrelatedtofinanceandadministrativefunctions,humanresources,andgeneralmanagementaslongastheyarenotdirectlyattributabletooneoftheotheroperatingexpenselineitems.
176 Consolidated Financial Statements IFRS
Fortheshare-basedpaymentsthataresettledbypayingcashratherthanbyissuingequityinstruments,aprovisionisrecordedfortherightsgrantedreflectingthevestedportionofthefairvalueoftherightsattheendofeachreportingperiod.Personnelexpenseisrecognizedovertheperiodthebenefici- ariesareexpectedtoperformtherelatedservice(vestingperiod),withacorrespondingincreaseinprovisions.Cash-settledawardsareremeasuredtofairvalueattheendofeachreportingdateuntiltheawardissettled.Anychangesinthe fairvalueoftheprovisionarerecognizedaspersonnelexpenseinprofitorloss.Theamountofunrecognizedcompensationexpenseisdependentonthefuturepriceofourordinaryshareswhichwecannotreasonablypredict.
Wherewehedgeourexposuretocash-settledawards,changesinthefairvalueoftherespectivehedginginstrumentsare alsorecognizedaspersonnelexpenseinprofitorloss.Thefairvaluesforhedgedprogramsarebasedonmarketdatareflectingcurrentmarketexpectations.
Formoreinformationaboutourshare-basedpayments, see Note(27).
Other Components of EquityOthercomponentsofequityinclude:–Exchangedifferencesarisingfromthetranslationofthefinancialstatementsofourforeignoperationsaswellastheexchangedifferencesfromintercompanylong-termmonetaryitemsforwhichsettlementisneitherplanned norlikelytooccurintheforeseeablefuture
–Unrealizedgainsandlossesonavailable-for-salefinancialassets
–Gainsandlossesoncashflowhedgescomprisingthenetchangeinfairvalueoftheeffectiveportionoftherespectivecashflowhedgesthathavenotyetimpactedprofitorloss
Thecarryingamountofadeferredtaxassetisreviewedattheendofeachreportingperiodandisreducedtotheextent thatitisnolongerprobablethatsufficienttaxableprofitwillbeavailabletoallowthebenefitofpartorallofthedeferredtaxassets to be utilized.
Wehavealignedthepresentationofpriorperiodcomparativeamountsfortaxassetsandtaxliabilitieswiththecurrentperiodpresentationbyoffsettingcertaincurrenttaxassetsagainstcertaincurrenttaxliabilitiesandcertaindeferred taxassetsagainstcertaindeferredtaxliabilitieswhichwerenotoffsetpreviously.Theimpactofthisoffsettingonthecompara- tiveamountswastodecreaseboth,currenttaxassetsandcurrenttaxliabilitiesasofDecember31,2012,by€70millionandtodecreaseboth,deferredtaxassetsanddeferredtaxliabilitiesasofDecember31,2012,by€353million.Managementconcludedthattheseadjustmentswereimmaterialtotheconsolidatedfinancialstatements.
Share-Based PaymentsShare-basedpaymentscovercash-settledandequity-settledawardsissuedtoouremployees.Thefairvaluesofbothequity-settledandcash-settledawardsareinitiallymeasuredatgrantdateusinganoption-pricingmodel.
Thefairvalueofequity-settledawardsisnotsubsequentlyremeasured.Thegrantdatefairvalueofequity-settledawardsisrecognizedaspersonnelexpenseinprofitorlossovertheperiodinwhichtheemployeesbecomeunconditionallyentitledtotherights,withacorrespondingincreaseinsharepremium.Theamountrecognizedasanexpenseisadjustedtoreflecttheactualnumberofequity-settledawardsthatultimatelyvest. Wegrantouremployeesdiscountsoncertainshare-basedpayments.Sincethosediscountsarenotdependentonfutureservicestobeprovidedbyouremployees,thediscountisrecognizedasanexpensewhentherightsaregranted.
177Notes to the Consolidated Financial Statements
valueoftheexpectedfuturecashflows.ThesubsequentmeasurementdependsontheclassificationofourfinancialassetstothefollowingcategoriesaccordingtoIAS39:–Loansandreceivables:Loansandreceivablesarenon-derivativefinancialassetswithfixedordeterminablepayments thatareneitherquotedinanactivemarketnorintendedtobesoldinthenearterm.Thiscategorycomprisestradereceivables,receivablesandloansincludedinotherfinancialassets,andcashandcashequivalents.Wecarryloansandreceivablesatamortizedcostlessimpairmentlosses.Forfurtherinformationontradereceivables,seetheTrade and OtherReceivablessection.
–Available-for-salefinancialassets:Available-for-salefinancialassetsarenon-derivativefinancialassetsthatarenotassigned toeitherofthetwoothercategoriesandmainlyincludeequityinvestmentsanddebtinvestments.Available-for-salefinancialassetsaremeasuredatfairvalue,withchanges infairvaluebeingreportednetoftaxinothercomprehensiveincome.Fairvaluechangesarenotrecognizedinprofitorlossuntiltheassetsaresoldorimpaired.
–Financialassetsatfairvaluethroughprofitorloss:Financialassetsatfairvaluethroughprofitorlosscompriseonly thosefinancialassetsthatareheldfortrading,aswedonotdesignatefinancialassetsatfairvaluethroughprofit orlossoninitialrecognition.Thiscategorysolelycontainsembeddedandfreestandingderivativeswithpositivefairvalues.Exceptwherehedgeaccountingisapplied,allchangesinthefairvalueoffinancialassetsinthiscategoryareimmediatelyrecognizedinprofitorloss.Formoreinformationaboutderivatives,seetheDerivatives section.
Allfinancialassetsnotaccountedforatfairvaluethroughprofitorlossareassessedforimpairmentateachreportingdateorifwebecomeawareofobjectiveevidenceofimpair- mentasaresultofoneormoreeventsthatindicatethatthecarryingamountoftheassetmaynotberecoverable.Objectiveevidenceincludesbutisnotlimitedtoasignificantorprolongeddeclineofthefairvaluebelowitscarryingamount, ahighprobabilityofinsolvency,oramaterialbreachofcontractbytheissuersuchasasignificantdelayorashortfall
Treasury SharesTreasurysharesarerecordedatacquisitioncostandarepresentedasadeductionfromtotalequity.Gainsandlossesonthesubsequentreissuanceoftreasurysharesarecreditedorchargedtosharepremiumonanafter-taxbasis.Oncancellationoftreasuryshares,anyexcessoftheircarryingamountoverthecalculatedparvalueischargedtoretainedearnings.
Earnings per ShareWepresentbasicanddilutedearningspershare(EPS).Basicearningspershareisdeterminedbydividingprofitafter taxattributabletoequityholdersofSAPAGbytheweightedaveragenumberofordinarysharesoutstandingduringtherespectiveyear.Dilutedearningspersharereflectthepotentialdilutionassumingtheconversionofalldilutivepotentialordinaryshares.
Financial AssetsOurfinancialassetscomprisecashandcashequivalents(highlyliquidinvestmentswithoriginalmaturitiesofthreemonthsorless),loansandreceivables,acquiredequity anddebtinvestments,andderivativefinancialinstruments(derivatives)withpositivefairvalues.
TheseassetsarerecognizedandmeasuredinaccordancewithIAS39(FinancialInstruments:RecognitionandMeasurement).Accordingly,financialassetsarerecognizedintheConsolidatedStatementsofFinancialPositionifwehaveacontractualrighttoreceivecashorotherfinancialassetsfromanotherentity.Regularwaypurchasesorsalesoffinancialassetsarerecordedatthetradedate.Financialassetsareinitiallyrecognizedatfairvalueplus,inthecaseoffinancialassetsnotatfairvaluethroughprofitorloss,directlyattributabletransactioncosts.Interest-freeorbelow-market-rateloansandreceivablesareinitiallymeasuredatthepresent
178 Consolidated Financial Statements IFRS

DerivativesWeaccountforderivativesandhedgingactivitiesinaccordancewithIAS39atfairvalue.
Derivatives Without Designated Hedge RelationshipManytransactionsconstituteeconomichedges,andthereforecontributeeffectivelytothesecuringoffinancialrisksbutdonotqualifyforhedgeaccountingunderIAS39.Forthehedgingofcurrencyrisksinherentinforeigncurrencydenominated andrecognizedmonetaryassetsandliabilities,wedonotdesignateourheld-for-tradingderivativefinancialinstrumentsasaccountinghedges,astheprofitsandlossesfromtheunderlyingtransactionsarerecognizedinprofitorlossinthesameperiodsastheprofitsorlossesfromthederivatives.
Embedded DerivativesWeoccasionallyhavecontractsthatrequirepaymentstreamsincurrenciesotherthanthefunctionalcurrencyofeitherparty tothecontract.Suchembeddedforeigncurrencyderivativesareseparatedfromthehostcontractandaccountedforseparatelyifthefollowingaremet:–Theeconomiccharacteristicsandrisksofthehostcontractandtheembeddedderivativearenotcloselyrelated.
–Aseparateinstrumentwiththesametermsastheembeddedderivativewouldmeetthedefinitionofaderivative.
–Thecombinedinstrumentisnotmeasuredatfairvaluethroughprofitorloss.
Derivatives with Designated Hedge Relationship WedesignatederivativesinrespectofforeigncurrencyriskorinterestrateriskascashfloworfairvaluehedgesinahedgingrelationshipthatqualifiesforhedgeaccountingunderIAS39andcarrythemattheirfairvalue.Atinception,wedesignateanddocumentthehedgerelationship,includingthenatureoftherisk,theidentificationofthehedgeditem,thehedginginstrument,andhowwewillassessthehedgeeffectiveness.Furthermore,atinceptionandonanongoingbasiswemeasureanddocumentwhetherthederivativesarehighlyeffectivein
inpaymentsdue.Impairmentlossesintheamountofthedifferencebetweenanasset’scarryingamountandthepresentvalueoftheexpectedfuturecashflowsorcurrentfairvalue,respectively,arerecognizedinfinancialincome,net.Foravailable-for-salefinancialassetssuchimpairmentlossesdirectlyreduceanasset’scarryingamount,whileimpairmentson loans and receivables are recorded using allowance accounts. Accountbalancesarechargedoffagainsttherespectiveallowanceafterallcollectioneffortshavebeenexhaustedandthelikelihoodofrecoveryisconsideredremote.Impairmentlossesarereversedifthereasonfortheoriginalimpairmentlossnolongerexists.Nosuchreversalsaremadeforavailable-for-saleequityinvestments.
Income/expensesandgains/lossesonfinancialassetsconsistof impairment losses and reversals, interest income and expenses,dividends,andgainsandlossesfromthedisposalofsuchassets.Dividendincomeisrecognizedwhenearned.Interestincomeisrecognizedbasedontheeffectiveinterestmethod.Neitherdividendnorinterestincomeisincludedinnetgains/lossesatthetimeofdisposalofanasset.Financialassetsarederecognizedwhencontractualrightstoreceivecash flowsfromthefinancialassetsexpireorthefinancialassetsaretransferredtogetherwithallmaterialrisksandbenefits.
179Notes to the Consolidated Financial Statements

b)FairValueHedgeWeapplyfairvaluehedgeaccountingforhedgingcertain ofourfixedratefinancialliabilities.
Changesinthefairvalueofderivativesthataredesignatedandqualifyasfairvaluehedgesarerecordedinprofitorloss,togetherwithanychangesinthefairvalueofthehedgedassetorliabilitythatareattributabletothehedgedrisk(basisadjustment).Thechangeinthefairvalueofthederivativesandthechangeinthehedgeditemattributabletothehedged riskarerecognizedinprofitorlossinthelineitemrelatingtothehedgeditem.
Ifthehedgenolongermeetsthecriteriaforhedgeaccounting,thebasisadjustmenttothecarryingamountofahedged itemforwhichtheeffectiveinterestmethodisusedisamortized overtheperiodtomaturity.
Valuation and testing of EffectivenessTheeffectivenessofthehedgingrelationshipistestedprospectivelyandretrospectively.Prospectively,weapplythecriticaltermsmatchforourforeigncurrencyhedgesascurrencies,maturities,andtheamountsareidenticalfortheforecastedtransactionsandthespotelementoftheforwardexchangeratecontractorintrinsicvalueofthecurrencyoptions,respectively.Forinterestrateswaps,wealsoapplythecriticaltermsmatchasthenotionalamounts,currencies,maturities,basisofthevariablelegsorfixedlegs,respectively,resetdates,andthedatesoftheinterestandprincipalpaymentsareidenticalforthedebtinstrumentandthecorrespondinginterestrateswaps.Therefore,overthelifeofthehedginginstrument,thechangesinthedesignatedcomponentsofthehedginginstrumentwilloffsettheimpact offluctuationsoftheunderlyinghedgeditems.
Themethodofretrospectivelytestingeffectivenessdependsonthetypeofthehedgeasdescribedfurtherbelow:
offsettingthechangesinthefairvaluesorcashflowsofthehedgeditemattributabletothehedgedrisk.Theaccountingforchangesinfairvalueofthehedginginstrumentdepends onthetypeofthehedgeandtheeffectivenessofthehedgingrelationship.Formoreinformationaboutourhedges,see Note(25).
a)CashFlowHedgeIngeneral,weapplycashflowhedgeaccountingtotheforeigncurrencyriskofhighlyprobableforecastedtransactionsandinterestrateriskonvariableratefinancialliabilities.
Theeffectiveportionofchangesinthefairvalueofthederi- vativeinstrumentdeterminedtobeaneffectivehedgeisrecognizedinothercomprehensiveincomeandpresentedwithinothercomponentsofequityfromcashflowhedges. Withregardtoforeigncurrencyrisk,thisrelatestothespotpriceandtheintrinsicvaluesofthederivativesdesignatedandqualifyingascashflowhedges,whilegainsandlosseson theinterestelementandonthosetimevaluesexcludedfromthehedgingrelationshipaswellastheineffectiveportionofgainsorlossesarerecognizedinprofitorloss.Wesubsequentlyreclassifytheeffectiveportionofgainsorlossesfromothercomprehensiveincometoprofitorlosswhenthehedgedtransactionaffectsprofitorloss.
Ifthehedgenolongermeetsthecriteriaforhedgeaccounting,anycumulativegainorlossrecognizedinothercomprehensiveincomeatthattimeremainsinothercomprehensiveincomeuntiltheforecastedtransactionisultimatelyrecognizedinprofitorloss.Whenaforecastedtransactionisnolongerexpected tooccur,thecumulativegainorlossexistinginothercompre- hensiveincomeatthattimeisimmediatelytransferredtoprofitor loss.
180 Consolidated Financial Statements IFRS
Accountbalancesarewrittenoff,thatis,chargedoffagainsttheallowanceafterallcollectioneffortshavebeenexhaustedandthelikelihoodofrecoveryisconsideredremote.
InourConsolidatedIncomeStatements,expensesfromrecordingbaddebtallowancesforaportfoliooftradereceiva- blesareclassifiedasotheroperatingincome,net,whereasexpensesfromrecordingbaddebtallowancesforspecificcustomerbalancesareclassifiedascostofsoftwareandsoftware-relatedservicesorcostofprofessionalservicesandotherservices,dependingonthetransactionfromwhich therespectivetradereceivableresults.Salesallowancesarerecordedasanoffsettotherespectiverevenueitem.
Includedintradereceivablesareunbilledreceivablesrelated tofixed-feeandtime-and-materialconsultingarrangementsfor contract work performed to date.
Other Non-Financial AssetsOthernon-financialassetsarerecordedatamortizedcost,whichapproximatesfairvalueduetotheirshort-termnature.
Intangible AssetsWeclassifyintangibleassetsaccordingtotheirnatureand use in our operation. Software and database licenses consist primarilyoftechnologyforinternaluse,whereasacquiredtechnologyconsistsprimarilyofpurchasedsoftwaretobeincorporatedintoourproductofferingsandin-processresearchanddevelopment.Customerrelationshipandotherintangiblesconsistprimarilyofcustomercontractsandacquiredtrademarklicenses.
a)CashFlowHedgeRetrospectively,effectivenessistestedonacumulativebasisapplyingthedollaroffsetmethodbyusingthehypotheticalderivativemethod.Underthisapproach,thechangeinfairvalueofaconstructedhypotheticalderivativewithtermsreflectingtherelevanttermsofthehedgeditemiscomparedtothechangeinthefairvalueofthehedginginstrumentemployingitsrelevantterms.Thehedgeisdeemedhighlyeffectiveif theresultsarewithintherange80%to125%.
b)FairValueHedgeRetrospectively,effectivenessistestedusingstatisticalmethods intheformofaregressionanalysisbywhichthevalidityandextentoftherelationshipbetweenthechangeinvalueofthehedgeditemsastheindependentandthefairvaluechange ofthederivativesasthedependentvariableisdetermined.Thehedgeisdeemedhighlyeffectiveifthedeterminationcoefficientbetweenthehedgeditemsandthehedginginstrumentsexceeds0.8andtheslopecoefficientlieswithinarangeof–0.8to –1.25.
Trade and Other ReceivablesTrade receivables are recorded at invoiced amounts less sales allowances and allowances for doubtful accounts. We record theseallowancesbasedonaspecificreviewofallsignificantoutstandinginvoices.Whenanalyzingtherecoverabilityof ourtradereceivables,weconsiderthefollowingfactors:–First,weconsiderthefinancialsolvencyofspecificcustomersandrecordanallowanceforspecificcustomerbalanceswhenwebelieveitisprobablethatwewillnotcollecttheamountdueaccordingtothecontractualterms ofthearrangement.
–Second,weevaluatehomogenousportfoliosoftradereceiva- blesaccordingtotheirdefaultriskprimarilybasedonthe ageofthereceivableandhistoricallossexperience,butalsotakingintoconsiderationgeneralmarketfactorsthatmightimpact our trade receivable portfolio. We record a general bad debt allowance to record impairment losses for a portfoliooftradereceivableswhenwebelievethattheageofthereceivablesindicatesthatitisprobablethatalosshasoccurredandwewillnotcollectsomeoralloftheamountsdue.
181Notes to the Consolidated Financial Statements

Useful Lives of Property, Plant, and Equipment
Buildings 25to50years
Leaseholdimprovements Basedontheleasecontract
Informationtechnologyequipment 3to5years
Office furniture 4to20years
Automobiles 4to5years
Leaseholdimprovementsaredepreciatedusingthestraight-linemethodovertheshorterofthetermoftheleaseortheusefullifeoftheasset.Ifarenewaloptionexists,thetermusedreflectstheadditionaltimecoveredbytheoptionifexercise isreasonablyassuredwhentheleaseholdimprovementisfirstput into operation.
Impairment of Goodwill and Non-Current AssetsWetestgoodwillforimpairmentatleastannuallyandwheneventsoccurorchangesincircumstancesindicatethattherecoverableamountofacash-generatingunittowhichgoodwillhasbeenallocatedislessthanitscarryingvalue.
Therecoverableamountofgoodwillisestimatedeachyearatthesametime.Thegoodwillimpairmenttestisperformed atthelevelofouroperatingsegmentssincetherearenolowerlevelsinSAPatwhichgoodwillismonitoredforinternalmanagement purposes.
Forthepurposeofimpairmenttesting,goodwillacquiredin abusinesscombinationisallocatedtotheoperatingsegmentsthatareexpectedtobenefitfromthesynergiesofthecom- bination.Ifthecarryingamountoftheoperatingsegmenttowhichthegoodwillisallocatedexceedstherecoverableamount,animpairmentlossongoodwillallocatedtothisoperatingsegmentisrecognized.Therecoverableamountisthehigheroftheoperatingsegment’sfairvaluelesscostsofdisposalanditsvalueinuse.Fairvaluelesscostsofdisposalistheprice thatwouldbereceivedtosellanassetorcashgeneratingunitorpaidtotransferaliabilityinanorderlytransactionbetweenmarketparticipantsatthemeasurementdate,lessthecostof
Allourpurchasedintangibleassetsotherthangoodwillhavefiniteusefullives.Theyareinitiallymeasuredatacquisition costandsubsequentlyamortizedeitherbasedonexpectedusageoronastraight-linebasisovertheirestimateduseful livesrangingfromtwoto16years.
Werecognizeacquiredin-processresearchanddevelopmentprojects as an intangible asset separate from goodwill if a projectmeetsthedefinitionofanasset.Amortizationfortheseintangibleassetsstartswhentheprojectsarecomplete andthedevelopedsoftwareistakentothemarket.Wetypicallyamortizetheseintangiblesoverfivetosevenyears.
Amortizationexpensesofintangibleassetsareclassified ascostofsoftwareandsoftware-relatedservices,costofprofessionalservicesandotherservices,researchanddevelopment,salesandmarketing,andgeneralandadminis- trationdependingontheiruse.
Property, Plant, and EquipmentProperty,plant,andequipmentarecarriedatacquisitioncostplusthefairvalueofrelatedassetretirementcosts,ifanyandifreasonablyestimable,andlessaccumulateddepreciation.Interestincurredduringtheconstructionofqualifyingassetsiscapitalizedandamortizedovertherelatedassets’estimateduseful lives.
Property,plant,andequipmentaredepreciatedovertheirexpectedusefullives,generallyusingthestraight-linemethod.
182 Consolidated Financial Statements IFRS
Contingent AssetsWecarryinsurancepoliciesto,amongotherthings,offset theexpensesassociatedwithdefendingagainstlitigationmattersaswellasotherrisks.Werecognizetherespectivereimbursementsinprofitorlosswhenitisvirtuallycertain thatthereimbursementwillbereceivedandretainedbyus.
Liabilities
Financial liabilitiesFinancialliabilitiesincludetradeandotherpayables,bankloans,issuedbonds,privateplacementsandotherfinancialliabilitieswhichcomprisederivativeandnon-derivativefinancialliabilities.
FinancialliabilitiesarerecognizedandmeasuredinaccordancewithIAS39.Accordingly,theyarerecognizedintheConsolidated FinancialStatementsifwehaveacontractualobligationtotransfercashoranotherfinancialassettoanotherparty.Finan- cialliabilitiesareinitiallyrecognizedatfairvalue.Inthecase offinancialliabilitiesnotmeasuredatfairvaluethroughprofitorloss,theinitialmeasurementincludesdirectlyattributabletransactioncosts.Ifmaterial,financialliabilitiesarediscountedto present value based on prevailing market rates adjusted for creditrisk,withthediscountbeingrecognizedovertimeasinterestexpense.ThesubsequentmeasurementdependsontheallocationoffinancialliabilitiestothefollowingcategoriesaccordingtoIAS39:–Financialliabilitiesatfairvaluethroughprofitorlossonlycomprisethosefinancialliabilitiesthatareheldfortrading,aswedonotdesignatefinancialliabilitiesatfairvaluethroughprofitorlossoninitialrecognition.Thiscategorysolelycontainsembeddedandotherderivativeswithnegativefairvalues,exceptwherehedgeaccountingisapplied.Allchangesinthefairvalueoffinancialliabilities inthiscategoryareimmediatelyrecognizedinprofit orloss.Formoreinformationaboutderivatives,seetheDerivatives section.
–Financialliabilitiesatamortizedcostincludeallnon-derivativefinancialliabilitieswhicharemeasured atamortizedcostusingtheeffectiveinterestmethod.
disposal.Valueinuseisthepresentvalueofthefuturecashflowsexpectedtobederivedfromanassetorcash-generatingunit.Impairmentlossesongoodwillarenotreversedinfutureperiods.
Wereviewnon-currentassets,suchasproperty,plant,equip- ment,andintangibleassetsforimpairmentwhenevereventsorchangesincircumstancesindicatethatthecarryingamount ofanassetorgroupofassetsmaynotberecoverable.Intangible assetsnotyetavailableforusearetestedforimpairmentannually.
Forthepurposeofimpairmenttesting,assetsthatcannotbetestedindividuallyaregroupedtogetherintothesmallestgroupofassetsthatgeneratescashinflowsfromcontinuingusethatarelargelyindependentofthecashinflowsofotherassetsorgroupsofassets.Ifassetsdonotgeneratecashinflowsthatarelargelyindependentofthosefromotherassetsorgroupsofassets,theimpairmenttestisnotperformedat anindividualassetlevel;instead,itisperformedatthelevelofthecash-generatingunit(CGU)towhichtheassetbelongs.
Animpairmentlossisrecognizedifthecarryingamountof anassetoritsCGUexceedsitsestimatedrecoverableamount.TherecoverableamountofanassetoritsCGUisthegreater ofitsvalueinuseanditsfairvaluelesscostsofdisposal.Inassessingvalueinuse,theestimatedfuturecashflowsarediscountedtotheirpresentvalueusingapre-taxdiscountratethatreflectscurrentmarketassessmentsofthetimevalue ofmoneyandtherisksspecifictotheasset.
Impairmentlossesarepresentedinotheroperatingincome,netinprofitorloss.
183Notes to the Consolidated Financial Statements
Post-Employment BenefitsWemeasureourpension-benefitliabilitiesandotherpost-employmentbenefitsbasedonactuarialcomputationsusingtheprojected-unit-creditmethodinaccordancewithIAS19.Theassumptionsusedtocalculatepensionliabilitiesand costs are disclosed in Note(18a).Asaresultoftheactuarialcalculationforeachplan,werecognizeanassetorliabilityfortheoverfundedorunderfundedstatusoftherespectivedefinedbenefitplan.Weclassifyaportionoftheliabilityascurrent(determinedonaplan-by-planbasis)iftheamountbywhichtheactuarialpresentvalueofbenefitsincludedinthebenefitobligationpayablewithinthenext12monthsexceedsthefairvalueofplanassets.Remeasurementsofthedefinedbenefitobligation(DBO)orplanassetsresultingfromdemographicandfinancialdatadifferentthanoriginallyassumedandfromchangesinassumptionscanresultinactuarialgainsandlosses.Werecognizeallsuchremeasurementsimmediatelyinretainedearningsthroughothercomprehensiveincome.Theywillnotbereclassifiedtoprofitorlossinsubsequentperiods.Netinterestexpenseandotherexpensesrelatedtodefinedbenefitplansarerecognizedinemployeeexpenses.
SAP’spensionbenefitsareclassifiedasdefinedcontributionplansifthepaymenttoaseparatefundrelievesSAPofallobligationsfromthepensionplan.Obligationsforcontributionstodefinedcontributionpensionplansarerecognizedasanexpenseinprofitorlosswhenpaidordue.
Certainofourforeignsubsidiariesarerequiredtoprovideterminationindemnitybenefitstotheiremployeesregardlessofthereasonfortermination(retirement,voluntary,orinvoluntary).Wetreattheseplansasdefinedbenefitpensionplansifthesubstanceofthepost-employmentplanisapension-typearrangement.Mostofthesearrangementsprovide theemployeewithaone-timepayoutbasedoncompensationlevels,age,andyearsofserviceonterminationindependentofthereason(retirement,voluntary,orinvoluntary).
Expensesandgains/lossesonfinancialliabilitiesconsistofinterestexpense,andgainsandlossesfromthedisposal ofsuchliabilities.Interestexpenseisrecognizedbasedontheeffectiveinterestmethod.
Financialliabilitiesarederecognizedwhenthecontractualobligationisdischarged,canceled,orhasexpired.
non-Financial liabilitiesOthernon-financialliabilitieswithfixedordeterminablepaymentsthatarenotquotedinanactivemarketaremainlytheresultofobligationstoemployeesandfiscalauthorities andaregenerallymeasuredatamortizedcost.
ProvisionsProvisionsarerecordedwhenallofthefollowingconditions aremet:–Itismorelikelythannotthatwehavealegalorconstructiveobligationtothirdpartiesasaresultofapastevent.
–Theamountcanbereasonablyestimated.–Itisprobablethattherewillbeanoutflowoffutureeconomicbenefitstosettletheobligation,whiletheremaybeuncertaintyaboutthetimingoramountofthefutureexpenditurerequiredinthesettlement.
Weregularlyadjustprovisionsasfurtherinformationbecomesavailableorcircumstanceschange.Non-currentprovisions arereportedatthepresentvalueoftheirexpectedsettlementamountsasatthereportingdate.Discountratesareregularlyadjusted to current market interest rates.
Aprovisionforrestructuringisrecognizedwhenwehaveapproved a detailed and formal restructuring plan and therestructuringhascommencedorhasbeenannounced.
184 Consolidated Financial Statements IFRS
OurmanagementperiodicallydiscussesthesecriticalaccountingpolicieswiththeAuditCommitteeoftheSupervisoryBoard.
Revenue RecognitionAsdescribedintheRevenueRecognitionsectionofNote(3b), we do not recognize revenue before persuasive evidence ofanarrangementexists,deliveryhasoccurred,therisksandrewardsofownershiphavebeentransferredtothecustomer,theamountofrevenuecanbemeasuredreliably,andcollectionoftherelatedreceivableisprobable.Thedeterminationofwhethertheamountofrevenuecanbemeasuredreliablyorwhetherthefeesarecollectibleisinherentlyjudgmentalasitrequiresestimatesastowhetherandtowhatextentsubse- quentconcessionsmaybegrantedtocustomersandwhetherthecustomerisexpectedtopaythecontractualfees.Thetimingandamountofrevenuerecognitioncanvarydependingonwhatassessmentshavebeenmade.
Inmostofourrevenue-generatingarrangementswesellto thecustomermorethanoneproductsolutionorservice.Additionally,wehaveongoingrelationshipswithmanyofourcustomersandoftenenterintoseveraltransactionswiththesamecustomerwithincloseproximityintime.Wethereforehavetodeterminethefollowing:–Whicharrangementswiththesamecustomerare
to be accounted for as one arrangement–Whichdeliverablesunderonearrangementare tobeaccountedforseparately
–Howtoallocatethetotalarrangementfeetotheindividualelements of one arrangement
Deferred IncomeDeferred income is recognized as software revenue, support revenue, cloud subscription and support revenue, consulting revenue,orotherservicerevenue,dependingonthereasonsforthedeferral,oncethebasicapplicablerevenuerecognitioncriteriahavebeenmet,forexample,whentherelatedservicesareperformedorwhenthediscountsareused.
(3c) management Judgments and Sources of Estimation uncertaintyThepreparationoftheConsolidatedFinancialStatementsinconformitywithIFRSrequiresmanagementtomakejudgments, estimates,andassumptionsthataffecttheapplicationofaccountingpoliciesandthereportedamountsofassets,liabili- ties,revenues,andexpenses,aswellasdisclosureofcontingent assets and liabilities.
Webaseourjudgments,estimates,andassumptionsonhistori- calandforecastinformation,aswellasregionalandindustryeconomicconditionsinwhichweorourcustomersoperate,changestowhichcouldadverselyaffectourestimates.Althoughwebelievewehavemadereasonableestimatesabouttheultimateresolutionoftheunderlyinguncertainties,noassurancecanbegiventhatthefinaloutcomeofthesematterswillbeconsistentwithwhatisreflectedinourassets,liabilities,revenues,andexpenses.Actualresultscoulddifferfromoriginal estimates.
Theaccountingpoliciesthatmostfrequentlyrequireustomakejudgments,estimates,andassumptions,andthereforeare critical to understanding our results of operations, includethefollowing:–Revenuerecognition–Valuationoftradereceivables–Accountingforshare-basedpayments–Accountingforincometax– Accounting for business combinations–Subsequentaccountingforgoodwillandotherintangibles– Accounting for legal contingencies–Recognitionofinternallygeneratedintangibleassets
from development
185Notes to the Consolidated Financial Statements
Additionally,ourrevenueforon-premisesoftwarecontractswouldbesignificantlydifferentifweappliedarevenuealloca- tionpolicyotherthantheresidualmethod.
Revenuefromconsulting,otherservices,andcustomer-specificon-premisesoftwaredevelopmentprojectsisdeter- minedbyapplyingthepercentage-of-completionmethod. Thepercentage-of-completionmethodrequiresustomakeestimates about total revenue, total cost to complete theproject,andthestageofcompletion.Theassumptions,estimates,anduncertaintiesinherentindeterminingthe stageofcompletionaffectthetimingandamountsofrevenuerecognizedandexpensesreported.Ifwedonothaveasufficientbasistomeasuretheprogressofcompletionortoestimatethetotalcontractrevenueandcosts,revenuerecognitionislimitedtotheamountofcontractcostsincurred.Thedeterminationofwhetherasufficientbasistomeasuretheprogressofcompletionexistsisjudgmental.Changesinestimates of progress towards completion and of contract revenue and contract costs are accounted for as cumulative catch-upadjustmentstothereportedrevenuefortheapplicable contract.
Valuation of Trade ReceivablesAsdescribedintheTradeandOtherReceivablessectioninNote(3b), we account for impairments of trade receivables byrecordingsalesallowancesandallowancesfordoubtfulaccounts on an individual receivable basis and on a portfolio basis.Theassessmentofwhetherareceivableiscollectible isinherentlyjudgmentalandrequirestheuseofassumptionsaboutcustomerdefaultsthatcouldchangesignificantly.Judgmentisrequiredwhenweevaluateavailableinformationaboutaparticularcustomer’sfinancialsituationtodeterminewhetheritisprobablethatacreditlosswilloccurandtheamountofsuchlossisreasonablyestimableandthusanallowanceforthatspecificaccountisnecessary.Basingthegeneralallowancefortheremainingreceivablesonourhistoricallossexperience,too,ishighlyjudgmental,ashistorymaynotbeindicativeoffuturedevelopment,particularly
Thedeterminationofwhetherdifferentarrangementswiththesame customer are to be accounted for as one arrangement ishighlyjudgmental,asitrequiresustoevaluatewhetherthearrangementsarenegotiatedtogetherorlinkedinanyotherway.Thetimingandamountofrevenuerecognitioncanvarydependingonwhethertwoarrangementsareaccountedforseparatelyorasonearrangement.
Underanarrangementincludingon-premisesoftware,oracloudsubscription,andotherdeliverables,wedonotaccountfortheon-premisesoftware,orcloudsubscription,andtheotherdeliverablesseparatelyifoneoftheotherdeliverables(suchasconsultingservices)isdeemedtobeessentialto thefunctionalityoftheon-premisesoftware,orcloudsubscrip- tion.Thedeterminationwhetheranundeliveredelementisessentialtothefunctionalityofthedeliveredelementrequirestheuseofjudgment.Thetimingandamountofrevenuerecog- nitioncanvarydependingonhowthatjudgmentisexercised,becauserevenuemayberecognizedoveralongerserviceterm.
Wealsodonotaccountseparatelyfordifferentdeliverablesunderanarrangementifwehavenobasisforallocating theoverallarrangementfeetothedifferentelementsofthearrangement.However,webelievethatsuchallocationbasisexistsifwecaneitherdemonstrateforeachundeliveredelementofthearrangementacompany-specificfairvalue,or,wheresuchcompany-specificfairvaluecannotbeestablished,ifwecanreasonablyestimatestand-alonesellingprices, asfurtherdefinedintheRevenueRecognitionsectionofNote(3b).Judgmentisrequiredinthedeterminationofanappropriatefairvaluemeasurementwhichmayimpactthetiming and amount of revenue recognized depending on thefollowing:–Whetheranappropriatemeasurementoffairvaluecan
be demonstrated for undelivered elements.–Theapproachesusedtoestablishfairvalue.
186 Consolidated Financial Statements IFRS

(SOPPP),webelievethatfuturepayoutwillbesignificantlyimpactednotonlybyoursharepricebutalsobytherequire- menttooutperformtheTechPGI.Changesinthesefactorscouldsignificantlyaffecttheestimatedfairvaluesascalculatedbytheoption-pricingmodel,andthefuturepayout.Formoreinformationabouttheseplans,seeNote(27).
Accounting for Income TaxWe conduct operations and earn income in numerous foreign countriesandaresubjecttochangingtaxlawsinmultiplejurisdictionswithinthecountriesinwhichweoperate.Ourordinarybusinessactivitiesalsoincludetransactionswhere theultimatetaxoutcomeisuncertain,suchasthoseinvolvingrevenuesharingandcostreimbursementarrangementsbetweenSAPGroupentities.Inaddition,theamountofincometaxwepayisgenerallysubjecttoongoingauditsbydomesticandforeigntaxauthorities.Asaresult,judgmentisnecessaryindeterminingourworldwideincometaxprovisions.Wehavemadereasonableestimatesabouttheultimateresolutionofourtaxuncertaintiesbasedoncurrenttaxlawsandourinter- pretationthereof.Suchjudgmentcanhaveamaterialeffect onourincometaxexpense,incometaxprovision,andprofitaftertax.
Thecarryingamountofadeferredtaxassetisreviewedattheendofeachreportingperiodandisreducedtotheextent thatitisnolongerprobablethatsufficienttaxableprofitwillbeavailabletoallowthebenefitofpartorallofthedeferredtaxassetstobeutilized.Thisassessmentrequiresmanagementjudgment,estimates,andassumptions.Inevaluatingourabilitytoutilizeourdeferredtaxassets,weconsiderallavailablepositiveandnegativeevidence,includingthelevelofhistoricaltaxableincomeandprojectionsforfuturetaxableincome overtheperiodsinwhichthedeferredtaxassetsarerecover- able.Ourjudgmentregardingfuturetaxableincomeisbasedonexpectationsofmarketconditionsandotherfactsandcircumstances.Anyadversechangetotheunderlyingfactsorourestimatesandassumptionscouldrequirethatwereducethecarryingamountofournetdeferredtaxassets.
Formoreinformationaboutourincometax,seeNote(10).
intheglobaleconomiccircumstancesresultingfromtherecentglobalfinancialcrisis.Changesinourestimatesabouttheallowancefordoubtfulaccountscouldmateriallyimpactthereportedassetsandexpensesinourfinancialstatements, andourprofitcouldbeadverselyaffectedifactualcreditlossesexceedourestimates.
Accounting for Share-Based PaymentsWeusecertainassumptionsinestimatingthefairvaluesforourshare-basedpayments,includingexpectedfuturesharepricevolatilityandexpectedoptionlife(whichrepresentsourestimateoftheaverageamountoftimeremaininguntiltheoptionsareexercisedorexpireunexercised).Inaddition,thefinalpayoutfortheseplansalsodependsonoursharepriceattherespectiveexercisedates.Alltheseassumptionsmaysignificantlyimpactthefairvaluedeterminationandthustheamountandtimingofourshare-basedpaymentexpense.Furthermore,thefairvaluesoftheoptionsgrantedunderour2009Plan(SOPPP)aredependentonourperformanceagainsttheTechnologyPeerGroupIndex(TechPGI)sincetherespectivegrantdate,thevolatilityandtheexpectedcorrelationbetweenthemarketpriceofthisindex,andourshareprice.
Forthepurposeofdeterminingtheestimatedfairvalueofourstockoptions,webelieveexpectedvolatilityisthemostsen- sitiveassumption.Regardingfuturepayoutundertheplans,thepriceofSAP’sshareswillbethemostrelevantfactor.ThefairvaluesoftheRestrictedShareUnits(RSUs)grantedunderourEmployeeParticipationPlan(EPP)andLong-TermIncen- tivePlan(LTI)2015dependonSAP’ssharepricedirectlyaftertheannouncementofthepreliminaryfourthquarterandfull-yearresultsforthelastfinancialyearoftherespectiveperfor- manceperiodundertheEPP(three-yearholdingperiodundertheLTI2015),andthusmaybesignificantlyaboveorbelow thebudgetedamounts.Withrespecttoourplangrantedin2009
187Notes to the Consolidated Financial Statements
Boththeamortizationperiodandtheamortizationmethodhaveanimpactontheamortizationexpensethatisrecordedineachperiod.
Inmakingimpairmentassessmentsforourintangibleassetsandgoodwill,theoutcomeofthesetestsishighlydependent on management’s latest estimates and assumptions regarding futurecashflowprojectionsandeconomicrisks,whicharecomplexandrequiresignificantjudgmentandassumptionsaboutfuturedevelopments.Theycanbeaffectedbyavarietyoffactors,includingchangesinourbusinessstrategy,ourinternalforecasts,andanestimateofourweighted-averagecostofcapital.Duetothesefactors,actualcashflowsandvaluescouldvarysignificantlyfromtheforecastedfuturecashflowsandrelatedvaluesderivedusingthediscountedcashflowmethod.Althoughwebelievetheassumptionsandestimateswehavemadeinthepasthavebeenreasonableandappropriate,differentassumptionsandestimatescouldmateriallyaffectourfinancialpositionandprofit.
Theresultsofgoodwillimpairmenttestsmaydependon theallocationofgoodwilltoouroperatingsegments.Thisallocation is judgmental as it is based on our estimates regardingwhichoperatingsegmentsareexpectedtobenefitfromthesynergiesofthebusinesscombination.
We recognized no impairment losses on our goodwill and no significantimpairmentlossesonourintangibleassetsduring2013.Althoughwedonotcurrentlyhaveanindicationof anysignificantimpairment,therecanbenoassurancethatimpairmentlosseswillnotoccurinthefuture.Formoreinformation, see Note(15).
Accounting for Business CombinationsInouraccountingforbusinesscombinations,judgmentisrequiredindeterminingwhetheranintangibleassetisidentifiable,andshouldberecordedseparatelyfromgoodwill.Additionally,estimatingtheacquisitiondatefairvaluesof theidentifiableassetsacquiredandliabilitiesassumedinvolvesconsiderablemanagementjudgment.Thenecessarymeasure- mentsarebasedoninformationavailableattheacquisitiondateandarebasedonexpectationsandassumptionsthathavebeendeemedreasonablebymanagement.Thesejudgments,estimates,andassumptionscanmateriallyaffectourfinancialpositionandprofitforseveralreasons,amongwhicharethefollowing:–Fairvaluesassignedtoassetssubjecttodepreciationandamortizationaffecttheamountsofdepreciationandamortizationtoberecordedinoperatingprofitintheperiodsfollowingtheacquisition.
–Subsequentnegativechangesintheestimatedfairvaluesofassetsmayresultinadditionalexpensefromimpairmentcharges.
–Subsequentchangesintheestimatedfairvaluesofliabilitiesandprovisionsmayresultinadditionalexpense(ifincreasingtheestimatedfairvalue)oradditionalincome(ifdecreasingtheestimatedfairvalue).
Subsequent Accounting for Goodwill and Other IntangiblesAsdescribedintheIntangibleAssetssectioninNote(3b), all ourintangibleassetsotherthangoodwillhavefiniteusefullives.Consequently,thedepreciableamountoftheintangibleassetsisallocatedonasystematicbasisovertheirusefullives.Judgmentisrequiredindeterminingthefollowing:–Theusefullifeofanintangibleasset,asthisdetermination isbasedonourestimatesregardingtheperiodoverwhich theintangibleassetisexpectedtoproduceeconomicbenefitstous.
–Theamortizationmethod,asIFRSrequiresthestraight-linemethodtobeusedunlesswecanreliablydeterminethepatterninwhichtheasset’sfutureeconomicbenefitsareexpectedtobeconsumedbyus.
188 Consolidated Financial Statements IFRS
ofbeingusedasintendedbymanagement.Incontrast,allexpendituresarisingfromtheresearchphaseareexpensedasincurred.
Webelievethatdeterminingwhetherinternallygeneratedintangible assets from development are to be recognized asintangibleassetsrequiressignificantjudgment,particularlyinthefollowingareas:–Determiningwhetheractivitiesshouldbeconsideredresearchactivitiesordevelopmentactivities.
–Determiningwhethertheconditionsforrecognizinganintangibleassetaremetrequiresassumptionsabout futuremarketconditions,customerdemandandotherdevelopments.
–Theterm“technicalfeasibility”isnotdefinedinIFRS,andthereforedeterminingwhetherthecompletionofanasset istechnicallyfeasiblerequiresjudgmentandacompany-specificapproach.
–Determiningthefutureabilitytouseorselltheintangibleassetarisingfromthedevelopmentandthedetermination oftheprobabilityoffuturebenefitsfromsaleoruse.
–Determiningwhetheracostisdirectlyorindirectlyattributabletoanintangibleassetandwhetheracost isnecessaryforcompletingadevelopment.
Wehavedeterminedthattheconditionsforrecognizinginternallygeneratedintangibleassetsfromoursoftwaredevelopmentactivitiesarenotmetuntilshortlybefore thedevelopedproductsareavailableforsale.Thisassess- mentismonitoredbyusonaregularbasis.
Accounting for Legal ContingenciesAs described in Note(23),wearecurrentlyinvolvedinvariousclaimsandlegalproceedings.Wereviewthestatusofeachsignificantmatternotlessfrequentlythaneachquarterandassessourpotentialfinancialandbusinessexposuresrelatedtosuchmatters.Significantjudgmentisrequiredinthedeterminationofwhetheraprovisionistoberecordedandwhattheappropriateamountforsuchprovisionshouldbe.Notably,judgmentisrequiredinthefollowing:–Determiningwhetheranobligationexists–Determiningtheprobabilityofoutflowofeconomicbenefits–Determiningwhethertheamountofanobligationisreliably
estimable–Estimatingtheamountoftheexpenditurerequiredtosettlethepresentobligation
Duetouncertaintiesrelatingtothesematters,provisions arebasedonthebestinformationavailableatthetime.
Attheendofeachreportingperiod,wereassessthepotentialobligations related to our pending claims and litigation and adjustourrespectiveprovisionstoreflectthecurrentbestestimate.Inaddition,wemonitorandevaluatenewinformationthatwereceiveaftertheendoftherespectivereporting periodbutbeforetheConsolidatedFinancialStatementsareauthorizedforissuetodeterminewhetherthisprovidesadditionalinformationregardingconditionsthatexistedattheendofthereportingperiod.Suchrevisionstoourestimates ofthepotentialobligationscouldhaveamaterialimpactonourfinancialpositionandprofit.Forfurtherinformationabout thiscase,seeNotes(18b)and(23).
Recognition of Internally Generated Intangible Assets from DevelopmentUnderIAS38,internallygeneratedintangibleassetsfrom thedevelopmentphasearerecognizedifcertainconditions aremet.Theseconditionsincludethetechnicalfeasibility,intentiontocomplete,theabilitytouseorselltheassetunderdevelopment,andthedemonstrationofhowtheassetwillgenerateprobablefutureeconomicbenefits.Thecostofarecognizedinternallygeneratedintangibleassetcomprisesalldirectlyattributablecostnecessarytomaketheassetcapable
189Notes to the Consolidated Financial Statements
additionaldisclosures,forexample,relatingtorisksasso- ciatedwithfinancialinstrumentsandtothevaluationtechniquesusedforthevaluationofthefinancialinstruments.
–AmendmentstoIAS1(PresentationofFinancialStatements),whichaimtoimproveandalignthepresentationofitems ofothercomprehensiveincomeinfinancialstatementspreparedinaccordancewithIFRSandU.S.GAAP.SinceSAPhadalreadymadeappropriatechangesintheConsolidatedStatementsofComprehensiveIncomeinprioryears,theadoptionofthestandarddidnotresultinanychangestotheConsolidatedFinancialStatements.
–AmendmentstoIAS19,whichaimtoimprovetheunder- standingofhowdefinedbenefitplansaffectanentity’sfinancialposition,financialperformance,andcashflows.TheretrospectiveapplicationoftherevisedIAS19inaccordancewiththetransitionalprovisionssetoutinIAS19.173(asrevisedin2011)resultedinthenettingofitemsintheConsolidatedStatementsofFinancialPosition(mandatorynettingofplanassetswithtimecreditsandsemiretirementobligationsnowclassifiedasotherlong-termemployeebenefits),reclassificationsofcertainemployeebenefitliabilitiesfromshort-termbenefitstolong-termbenefitsandconsequentialremeasurementoftheseliabilities.Thesechanges,whichareimmaterialbothindividuallyandintheaggregate,resultedinamountsofadjustmentsforthefollowingbalancesheetlineitemsasofDecember31,2012:decreaseofnon-currentotherfinancialassetsby€124million,increaseofdeferredtaxassetsby€18million(thusreducingtotalassetsby€106million),increaseofcurrentothernon-financialliabilitiesby€68million,decreaseofcurrentandnon-currentotherprovisionsby€93millionand€45millionrespectively,increaseofdeferredtaxliabilities by€3million(thusreducingtotalliabilitiesby€67million)andareductionofretainedearningsby€39million.Theimpactsonourincomestatementswereinconsequentialinallperiodspresented.Thestandardalsoresultedinadditional
(3d) new Accounting Standards Adopted in the Current PeriodThefollowingnewaccountingstandardsandamendmentstostandardshavebeenadoptedinfiscalyear2013:–AmendmentstoIFRS7(FinancialInstruments:Disclosures)–Offsettingfinancialassetsandfinancialliabilities,whichrequireentitiestodisclosegrossamountssubjecttorightsofset-off,amountssetoffinaccordancewiththeaccountingstandardsfollowed,andtherelatednetcreditexposure.TheamendmentsdidnotresultinanimpactontheCompany’sConsolidatedFinancialStatements.
–IFRS10(ConsolidatedFinancialStatements),IFRS11(JointArrangements),andIFRS12(DisclosureofInterestsinOtherEntities)includingamendmentstothetransitionguidanceforIFRS10-12issuedinJune2012,whichprovideasingleconsolidationmodelthatidentifiescontrolasthebasisforconsolidationforalltypesofentities,establishprinciples forthefinancialreportingbypartiestoajointarrangement,andcombine,enhanceandreplacethedisclosurerequire- ments for subsidiaries, joint arrangements, associates and structuredentities.Theadoptionofthisnewsetofstandards(weadoptedthenewstandardsearlierthanrequiredby theEuropeanUnion)didnotresultinachangeinthefinancialpositionoftheGroup.However,additionalqualitativeandquantitativedisclosurehasbeenadded,forexample,withrespect to consolidated structured entities.
–IFRS13(FairValueMeasurement),whichdefinesfairvalue,setsoutinasingleIFRSaframeworkformeasuringfairvalue,andrequiresdisclosuresaboutfairvaluemeasure- ments.Theadoptionofthestandardhasresultedin
190 Consolidated Financial Statements IFRS
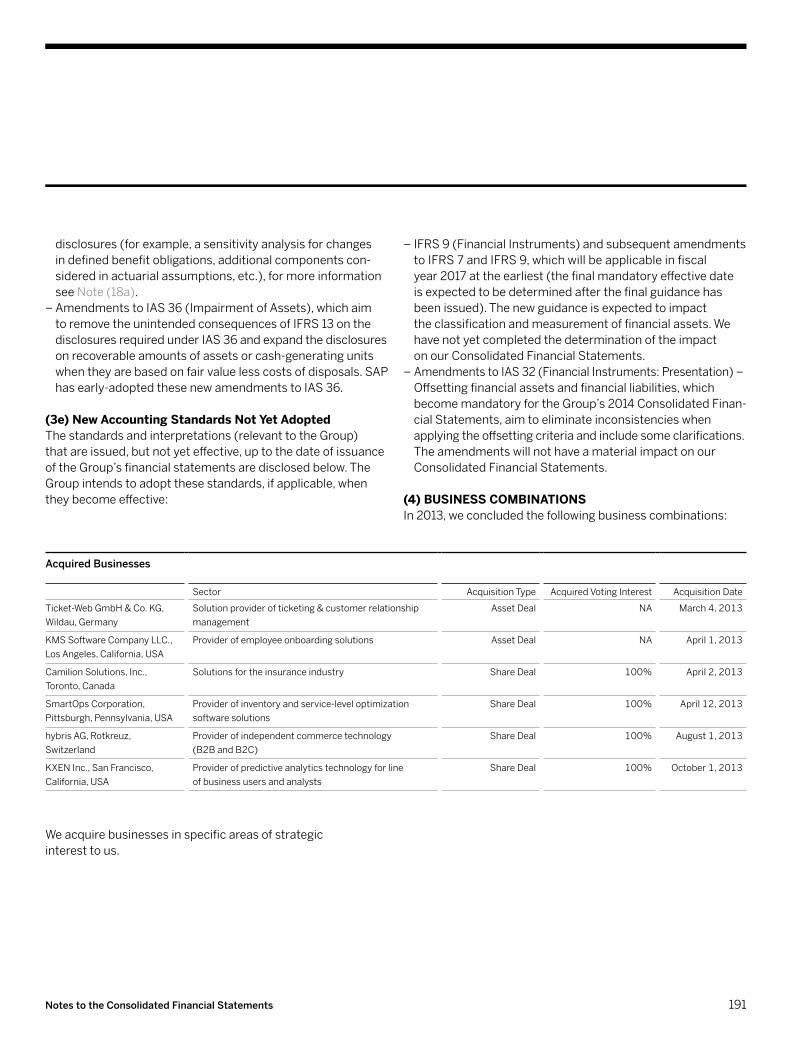
–IFRS9(FinancialInstruments)andsubsequentamendmentstoIFRS7andIFRS9,whichwillbeapplicableinfiscal year2017attheearliest(thefinalmandatoryeffectivedate isexpectedtobedeterminedafterthefinalguidancehasbeenissued).Thenewguidanceisexpectedtoimpact theclassificationandmeasurementoffinancialassets.Wehavenotyetcompletedthedeterminationoftheimpact onourConsolidatedFinancialStatements.
– AmendmentstoIAS32(FinancialInstruments:Presentation)– Offsettingfinancialassetsandfinancialliabilities,whichbecomemandatoryfortheGroup’s2014ConsolidatedFinan- cialStatements,aimtoeliminateinconsistencieswhenapplyingtheoffsettingcriteriaandincludesomeclarifications. TheamendmentswillnothaveamaterialimpactonourConsolidatedFinancialStatements.
(4) buSInESS COmbInAtIOnSIn2013,weconcludedthefollowingbusinesscombinations:
Acquired Businesses
Sector AcquisitionType AcquiredVotingInterest AcquisitionDate
Ticket-WebGmbH&Co.KG,Wildau,Germany
Solutionproviderofticketing&customerrelationshipmanagement
Asset Deal NA March4,2013
KMSSoftwareCompanyLLC.,LosAngeles,California,USA
Providerofemployeeonboardingsolutions Asset Deal NA April1,2013
CamilionSolutions,Inc., Toronto,Canada
Solutionsfortheinsuranceindustry ShareDeal 100% April2,2013
SmartOpsCorporation, Pittsburgh,Pennsylvania,USA
Providerofinventoryandservice-leveloptimization software solutions
ShareDeal 100% April12,2013
hybrisAG,Rotkreuz, Switzerland
Providerofindependentcommercetechnology (B2BandB2C)
ShareDeal 100% August1,2013
KXENInc.,SanFrancisco, California,USA
Providerofpredictiveanalyticstechnologyforline ofbusinessusersandanalysts
ShareDeal 100% October1,2013
disclosures(forexample,asensitivityanalysisforchanges indefinedbenefitobligations,additionalcomponentscon- sideredinactuarialassumptions,etc.),formoreinformationsee Note(18a).
–AmendmentstoIAS36(ImpairmentofAssets),whichaim toremovetheunintendedconsequencesofIFRS13onthedisclosuresrequiredunderIAS36andexpandthedisclosuresonrecoverableamountsofassetsorcash-generatingunitswhentheyarebasedonfairvaluelesscostsofdisposals.SAPhasearly-adoptedthesenewamendmentstoIAS36.
(3e) new Accounting Standards not yet AdoptedThestandardsandinterpretations(relevanttotheGroup) thatareissued,butnotyeteffective,uptothedateofissuanceoftheGroup’sfinancialstatementsaredisclosedbelow.TheGroupintendstoadoptthesestandards,ifapplicable,whentheybecomeeffective:
Weacquirebusinessesinspecificareasofstrategic interest to us.
191Notes to the Consolidated Financial Statements
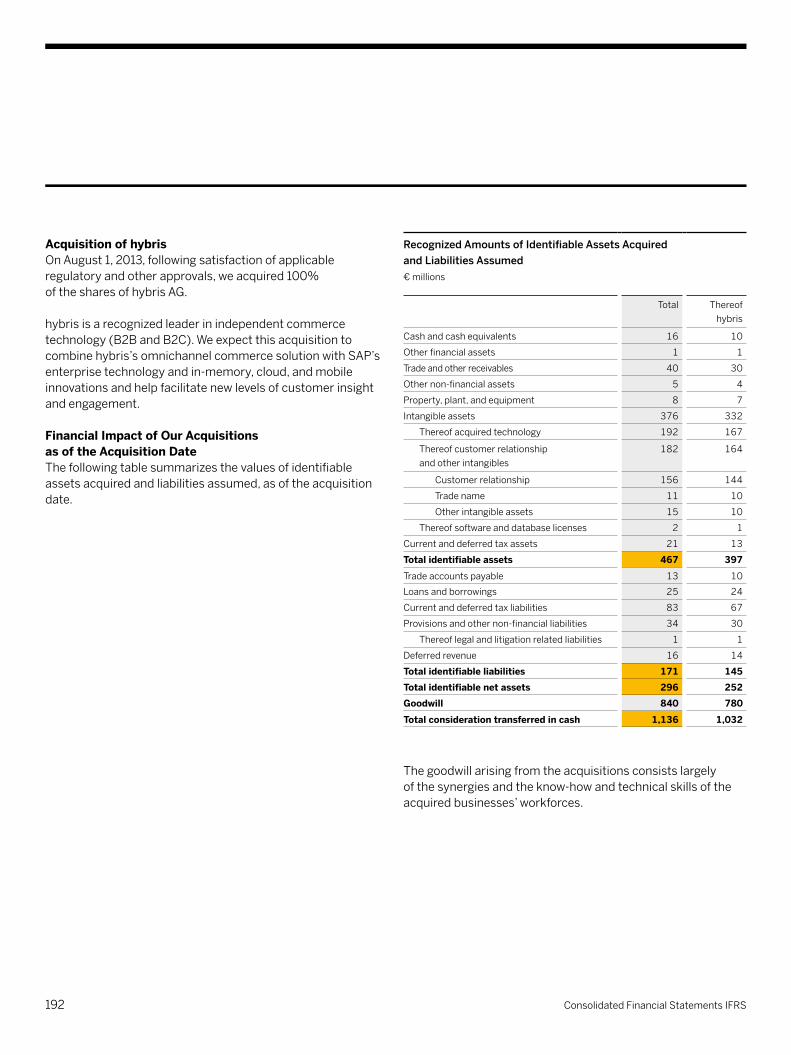
Acquisition of hybrisOn August 1, 2013, following satisfaction of applicable regulatoryandotherapprovals,weacquired100% ofthesharesofhybrisAG.
hybrisisarecognizedleaderinindependentcommercetechnology(B2BandB2C).Weexpectthisacquisitiontocombinehybris’somnichannelcommercesolutionwithSAP’senterprisetechnologyandin-memory,cloud,andmobileinnovationsandhelpfacilitatenewlevelsofcustomerinsightand engagement.
Financial Impact of Our Acquisitions as of the Acquisition DateThefollowingtablesummarizesthevaluesofidentifiableassetsacquiredandliabilitiesassumed,asoftheacquisitiondate.
Recognized Amounts of Identifiable Assets Acquired and Liabilities Assumed€ millions
Total Thereof hybris
Cashandcashequivalents 16 10
Otherfinancialassets 1 1
Tradeandotherreceivables 40 30
Othernon-financialassets 5 4
Property,plant,andequipment 8 7
Intangibleassets 376 332
Thereofacquiredtechnology 192 167
Thereofcustomerrelationship andotherintangibles
182 164
Customerrelationship 156 144
Trade name 11 10
Otherintangibleassets 15 10
Thereofsoftwareanddatabaselicenses 2 1
Currentanddeferredtaxassets 21 13
Total identifiable assets 467 397
Tradeaccountspayable 13 10
Loans and borrowings 25 24
Currentanddeferredtaxliabilities 83 67
Provisionsandothernon-financialliabilities 34 30
Thereoflegalandlitigationrelatedliabilities 1 1
Deferred revenue 16 14
Total identifiable liabilities 171 145Total identifiable net assets 296 252Goodwill 840 780
Total consideration transferred in cash 1,136 1,032
Thegoodwillarisingfromtheacquisitionsconsistslargely ofthesynergiesandtheknow-howandtechnicalskillsoftheacquiredbusinesses’workforces.
192 Consolidated Financial Statements IFRS
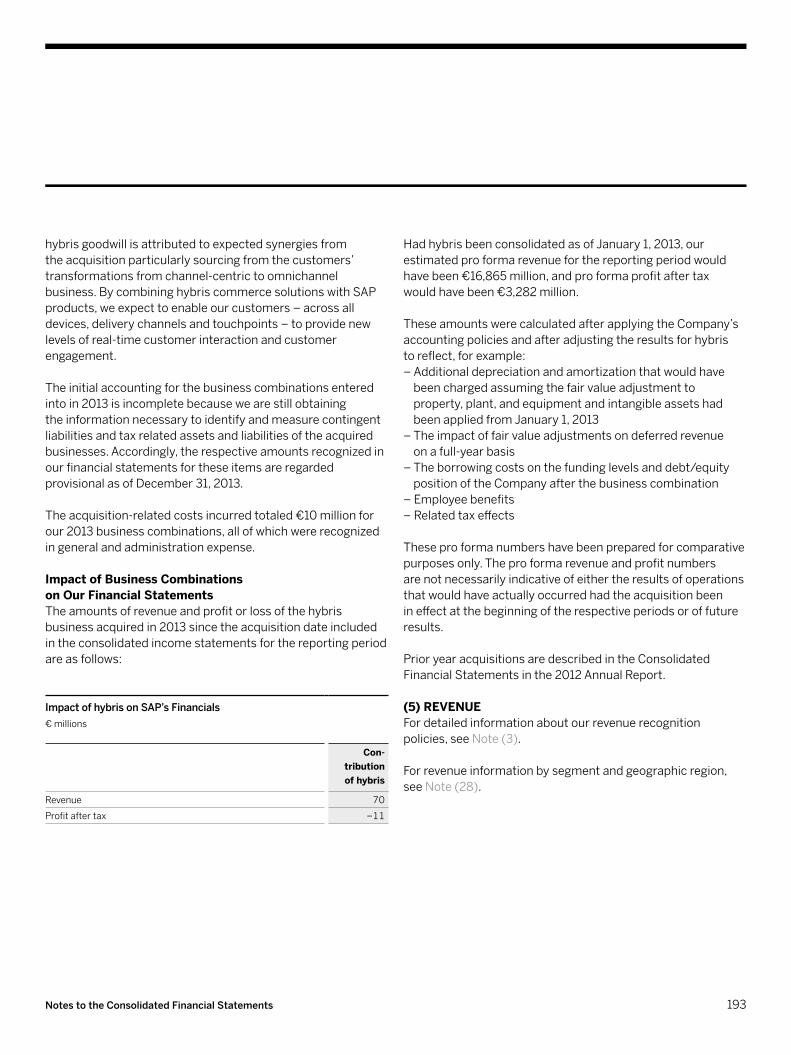
hybrisgoodwillisattributedtoexpectedsynergiesfrom theacquisitionparticularlysourcingfromthecustomers’transformationsfromchannel-centrictoomnichannelbusiness.BycombininghybriscommercesolutionswithSAPproducts,weexpecttoenableourcustomers–acrossalldevices,deliverychannelsandtouchpoints–toprovidenewlevelsofreal-timecustomerinteractionandcustomerengagement.
Theinitialaccountingforthebusinesscombinationsenteredinto in 2013 is incomplete because we are still obtaining theinformationnecessarytoidentifyandmeasurecontingentliabilitiesandtaxrelatedassetsandliabilitiesoftheacquiredbusinesses.Accordingly,therespectiveamountsrecognizedinourfinancialstatementsfortheseitemsareregardedprovisional as of December 31, 2013.
Theacquisition-relatedcostsincurredtotaled€10millionforour2013businesscombinations,allofwhichwererecognizedingeneralandadministrationexpense.
Impact of business Combinations on Our Financial StatementsTheamountsofrevenueandprofitorlossofthehybrisbusinessacquiredin2013sincetheacquisitiondateincludedintheconsolidatedincomestatementsforthereportingperiodareasfollows:
Impact of hybris on SAP’s Financials€ millions
Con-tribution of hybris
Revenue 70
Profitaftertax −11
HadhybrisbeenconsolidatedasofJanuary1,2013,ourestimatedproformarevenueforthereportingperiodwouldhavebeen€16,865million,andproformaprofitaftertax wouldhavebeen€3,282million.
TheseamountswerecalculatedafterapplyingtheCompany’saccountingpoliciesandafteradjustingtheresultsforhybris toreflect,forexample:–Additionaldepreciationandamortizationthatwouldhavebeenchargedassumingthefairvalueadjustmenttoproperty,plant,andequipmentandintangibleassetshadbeenappliedfromJanuary1,2013
–Theimpactoffairvalueadjustmentsondeferredrevenue onafull-yearbasis
–Theborrowingcostsonthefundinglevelsanddebt/equitypositionoftheCompanyafterthebusinesscombination
–Employeebenefits–Relatedtaxeffects
Theseproformanumbershavebeenpreparedforcomparativepurposesonly.Theproformarevenueandprofitnumbers arenotnecessarilyindicativeofeithertheresultsofoperationsthatwouldhaveactuallyoccurredhadtheacquisitionbeen ineffectatthebeginningoftherespectiveperiodsoroffutureresults.
PrioryearacquisitionsaredescribedintheConsolidatedFinancialStatementsinthe2012AnnualReport.
(5) rEVEnuEFordetailedinformationaboutourrevenuerecognitionpolicies, see Note(3).
Forrevenueinformationbysegmentandgeographicregion,see Note(28).
193Notes to the Consolidated Financial Statements
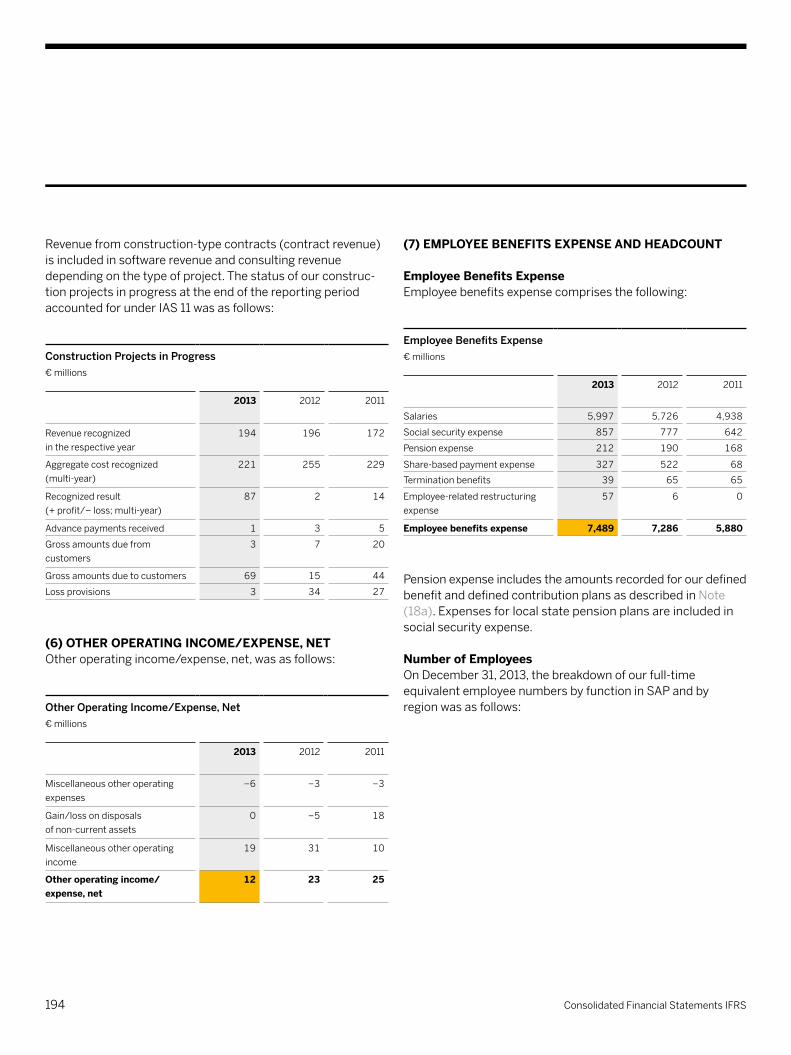
Revenuefromconstruction-typecontracts(contractrevenue)is included in software revenue and consulting revenue dependingonthetypeofproject.Thestatusofourconstruc- tionprojectsinprogressattheendofthereportingperiodaccountedforunderIAS11wasasfollows:
Construction Projects in Progress € millions
2013 2012 2011
Revenuerecognized intherespectiveyear
194 196 172
Aggregate cost recognized (multi-year)
221 255 229
Recognizedresult (+profit/–loss;multi-year)
87 2 14
Advancepaymentsreceived 1 3 5
Gross amounts due from customers
3 7 20
Gross amounts due to customers 69 15 44
Loss provisions 3 34 27
(6) OthEr OpErAtInG InCOmE/ExpEnSE, nEtOtheroperatingincome/expense,net,wasasfollows:
Other Operating Income/Expense, Net€ millions
2013 2012 2011
Miscellaneousotheroperating expenses
−6 −3 −3
Gain/lossondisposals ofnon-currentassets
0 −5 18
Miscellaneousotheroperating income
19 31 10
Other operating income/ expense, net
12 23 25
(7) EmplOyEE bEnEFItS ExpEnSE AnD hEADCOunt
Employee benefits Expense Employeebenefitsexpensecomprisesthefollowing:
Employee Benefits Expense€ millions
2013 2012 2011
Salaries 5,997 5,726 4,938
Socialsecurityexpense 857 777 642
Pensionexpense 212 190 168
Share-basedpaymentexpense 327 522 68
Termination benefits 39 65 65
Employee-relatedrestructuring expense
57 6 0
Employee benefits expense 7,489 7,286 5,880
PensionexpenseincludestheamountsrecordedforourdefinedbenefitanddefinedcontributionplansasdescribedinNote(18a).Expensesforlocalstatepensionplansareincludedinsocialsecurityexpense.
Number of EmployeesOnDecember31,2013,thebreakdownofourfull-timeequivalentemployeenumbersbyfunctioninSAPandby regionwasasfollows:
194 Consolidated Financial Statements IFRS
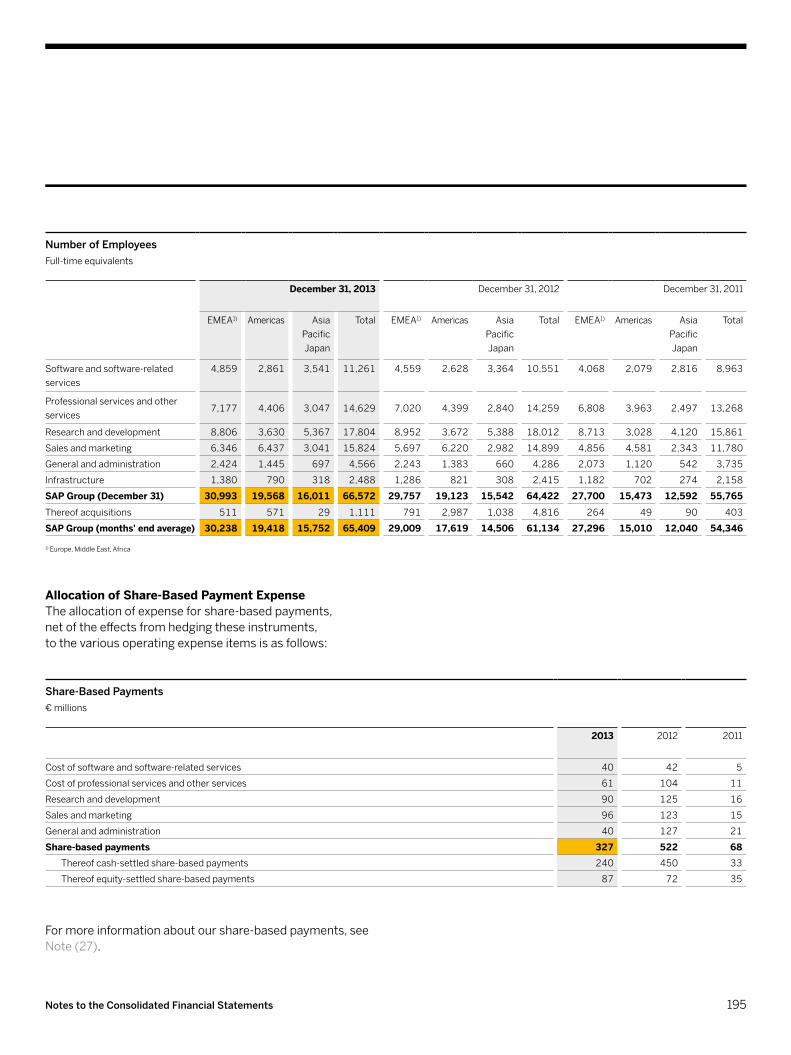
Number of EmployeesFull-timeequivalents
December 31, 2013 December 31, 2012 December 31, 2011
EMEA1) Americas Asia Pacific Japan
Total EMEA1) Americas Asia Pacific Japan
Total EMEA1) Americas Asia Pacific Japan
Total
Softwareandsoftware-related services
4,859 2,861 3,541 11,261 4,559 2,628 3,364 10,551 4,068 2,079 2,816 8,963
Professionalservicesandotherservices
7,177 4,406 3,047 14,629 7,020 4,399 2,840 14,259 6,808 3,963 2,497 13,268
Researchanddevelopment 8,806 3,630 5,367 17,804 8,952 3,672 5,388 18,012 8,713 3,028 4,120 15,861
Sales and marketing 6,346 6,437 3,041 15,824 5,697 6,220 2,982 14,899 4,856 4,581 2,343 11,780
General and administration 2,424 1,445 697 4,566 2,243 1,383 660 4,286 2,073 1,120 542 3,735
Infrastructure 1,380 790 318 2,488 1,286 821 308 2,415 1,182 702 274 2,158
SAp Group (December 31) 30,993 19,568 16,011 66,572 29,757 19,123 15,542 64,422 27,700 15,473 12,592 55,765
Thereofacquisitions 511 571 29 1,111 791 2,987 1,038 4,816 264 49 90 403
SAp Group (months' end average) 30,238 19,418 15,752 65,409 29,009 17,619 14,506 61,134 27,296 15,010 12,040 54,346
1) Europe,MiddleEast,Africa
Allocation of Share-based payment Expense Theallocationofexpenseforshare-basedpayments, netoftheeffectsfromhedgingtheseinstruments, tothevariousoperatingexpenseitemsisasfollows:
Share-Based Payments€ millions
2013 2012 2011
Costofsoftwareandsoftware-relatedservices 40 42 5
Costofprofessionalservicesandotherservices 61 104 11
Researchanddevelopment 90 125 16
Sales and marketing 96 123 15
General and administration 40 127 21
Share-based payments 327 522 68Thereofcash-settledshare-basedpayments 240 450 33
Thereofequity-settledshare-basedpayments 87 72 35
Formoreinformationaboutourshare-basedpayments,seeNote(27).
195Notes to the Consolidated Financial Statements

(8) OthEr nOn-OpErAtInG InCOmE/ExpEnSE, nEtOthernon-operatingincome/expense,netwasasfollows:
Other Non-Operating Income/Expense, Net € millions
2013 2012 2011
Foreigncurrencyexchangegain/loss,net 4 −154 −58
Thereoffromfinancialassets/liabilitiesatfairvaluethroughprofitorloss −75 −102 44
Thereoffromavailableforsalefinancialassets 0 −2 0
Thereoffromloansandreceivables 184 −32 −177
Thereoffromfinancialliabilitiesatamortizedcost −105 −20 79
Thereoffromnon-financialassets/liabilities 0 2 −4
Miscellaneousothernon-operatingincome 1 4 2
Miscellaneousothernon-operatingexpense −22 −23 −19
Other non-operating income/expense, net −17 −173 −75
196 Consolidated Financial Statements IFRS
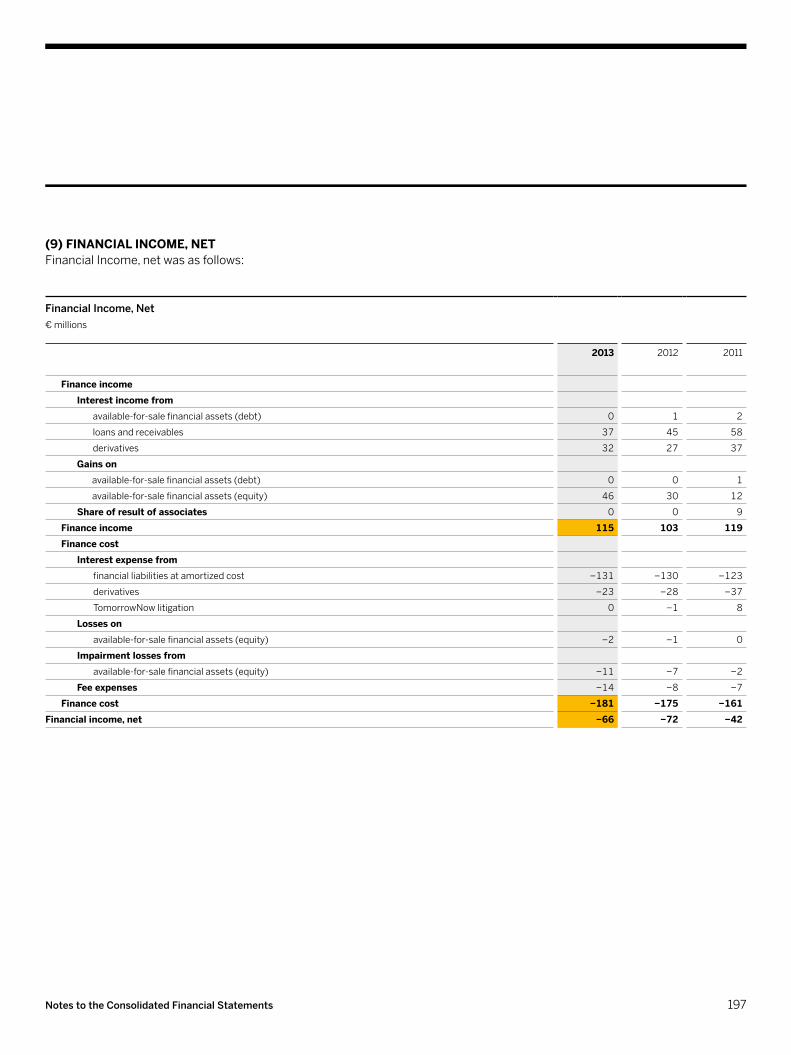
(9) FInAnCIAl InCOmE, nEtFinancialIncome,netwasasfollows:
Financial Income, Net€ millions
2013 2012 2011
Finance incomeInterest income from
available-for-salefinancialassets(debt) 0 1 2
loans and receivables 37 45 58
derivatives 32 27 37
Gains onavailable-for-salefinancialassets(debt) 0 0 1
available-for-salefinancialassets(equity) 46 30 12
Share of result of associates 0 0 9
Finance income 115 103 119Finance cost
Interest expense fromfinancial liabilities at amortized cost −131 −130 −123
derivatives −23 −28 −37
TomorrowNowlitigation 0 −1 8
losses onavailable-for-salefinancialassets(equity) −2 −1 0
Impairment losses fromavailable-for-salefinancialassets(equity) −11 −7 −2
Fee expenses −14 −8 −7
Finance cost −181 −175 −161Financial income, net −66 −72 −42
197Notes to the Consolidated Financial Statements
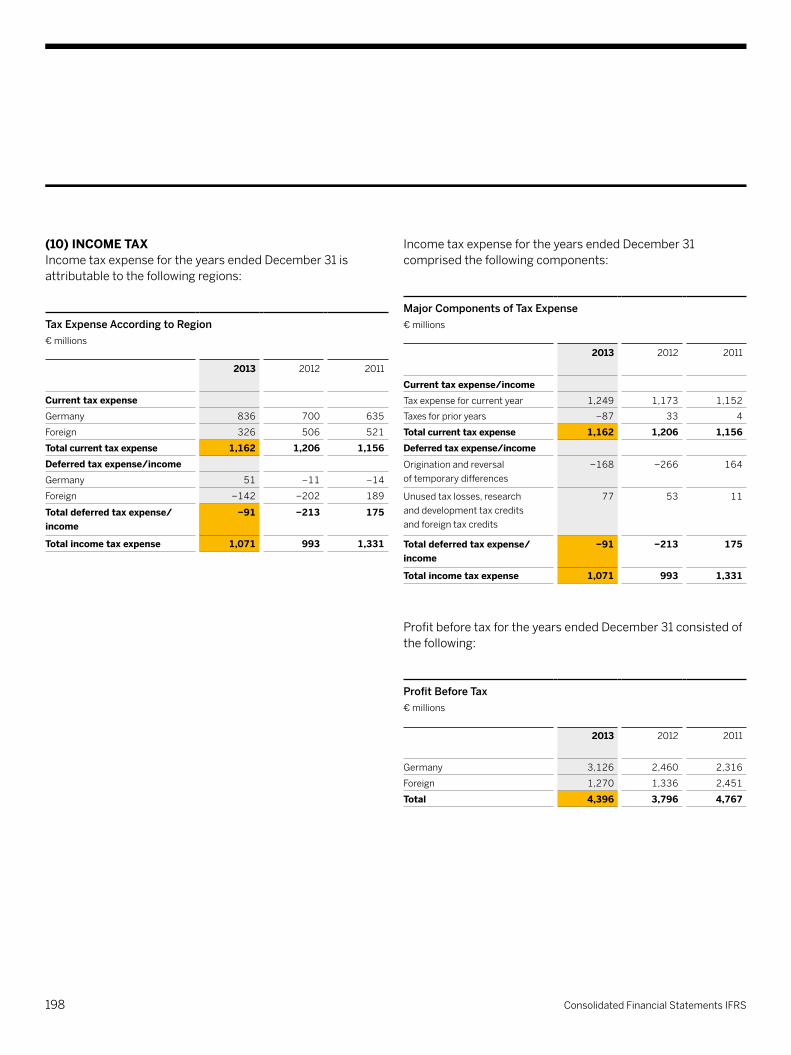
(10) InCOmE tAxIncometaxexpensefortheyearsendedDecember31isattributabletothefollowingregions:
Tax Expense According to Region€ millions
2013 2012 2011
Current tax expenseGermany 836 700 635
Foreign 326 506 521
Total current tax expense 1,162 1,206 1,156Deferred tax expense/incomeGermany 51 −11 −14
Foreign −142 −202 189
Total deferred tax expense/ income
−91 −213 175
Total income tax expense 1,071 993 1,331
IncometaxexpensefortheyearsendedDecember31comprisedthefollowingcomponents:
Major Components of Tax Expense€ millions
2013 2012 2011
Current tax expense/incomeTaxexpenseforcurrentyear 1,249 1,173 1,152
Taxesforprioryears −87 33 4
Total current tax expense 1,162 1,206 1,156Deferred tax expense/income
Origination and reversal oftemporarydifferences
−168 −266 164
Unusedtaxlosses,research anddevelopmenttaxcredits andforeigntaxcredits
77 53 11
Total deferred tax expense/ income
−91 −213 175
Total income tax expense 1,071 993 1,331
ProfitbeforetaxfortheyearsendedDecember31consistedofthefollowing:
Profit Before Tax € millions
2013 2012 2011
Germany 3,126 2,460 2,316
Foreign 1,270 1,336 2,451
Total 4,396 3,796 4,767
198 Consolidated Financial Statements IFRS
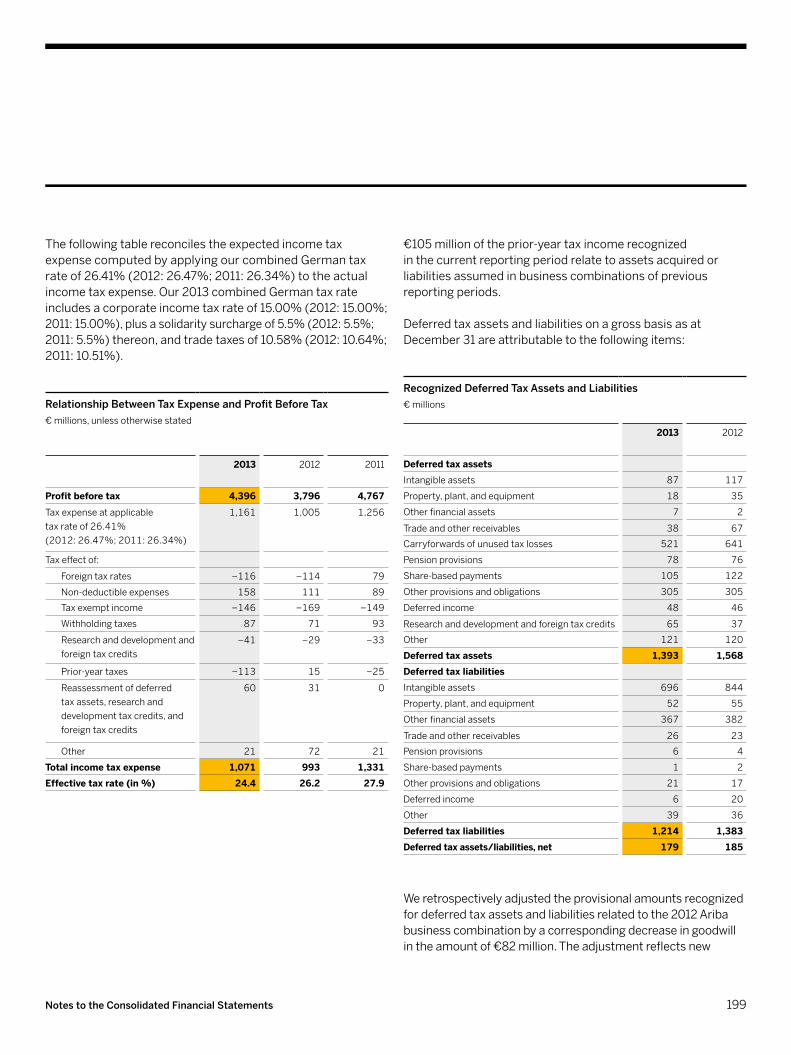
€105millionoftheprior-yeartaxincomerecognized inthecurrentreportingperiodrelatetoassetsacquiredorliabilities assumed in business combinations of previous reporting periods.
DeferredtaxassetsandliabilitiesonagrossbasisasatDecember31areattributabletothefollowingitems:
Recognized Deferred Tax Assets and Liabilities€ millions
2013 2012
Deferred tax assetsIntangibleassets 87 117
Property,plant,andequipment 18 35
Otherfinancialassets 7 2
Tradeandotherreceivables 38 67
Carryforwardsofunusedtaxlosses 521 641
Pension provisions 78 76
Share-basedpayments 105 122
Otherprovisionsandobligations 305 305
Deferred income 48 46
Researchanddevelopmentandforeigntaxcredits 65 37
Other 121 120
Deferred tax assets 1,393 1,568Deferred tax liabilitiesIntangibleassets 696 844
Property,plant,andequipment 52 55
Otherfinancialassets 367 382
Tradeandotherreceivables 26 23
Pension provisions 6 4
Share-basedpayments 1 2
Otherprovisionsandobligations 21 17
Deferred income 6 20
Other 39 36
Deferred tax liabilities 1,214 1,383Deferred tax assets/liabilities, net 179 185
Weretrospectivelyadjustedtheprovisionalamountsrecognizedfordeferredtaxassetsandliabilitiesrelatedtothe2012Aribabusinesscombinationbyacorrespondingdecreaseingoodwillintheamountof€82million.Theadjustmentreflectsnew
ThefollowingtablereconcilestheexpectedincometaxexpensecomputedbyapplyingourcombinedGermantax rateof26.41%(2012:26.47%;2011:26.34%)totheactualincometaxexpense.Our2013combinedGermantaxrateincludesacorporateincometaxrateof15.00%(2012:15.00%;2011:15.00%),plusasolidaritysurchargeof5.5%(2012:5.5%;2011:5.5%)thereon,andtradetaxesof10.58%(2012:10.64%;2011:10.51%).
Relationship Between Tax Expense and Profit Before Tax€millions,unlessotherwisestated
2013 2012 2011
Profit before tax 4,396 3,796 4,767
Taxexpenseatapplicable taxrateof26.41% (2012:26.47%;2011:26.34%)
1,161 1,005 1,256
Taxeffectof:
Foreigntaxrates −116 −114 79
Non-deductibleexpenses 158 111 89
Taxexemptincome −146 −169 −149
Withholdingtaxes 87 71 93
Researchanddevelopmentandforeigntaxcredits
−41 −29 −33
Prior-yeartaxes −113 15 −25
Reassessmentofdeferred taxassets,researchand developmenttaxcredits,andforeigntaxcredits
60 31 0
Other 21 72 21
Total income tax expense 1,071 993 1,331Effective tax rate (in %) 24.4 26.2 27.9
199Notes to the Consolidated Financial Statements
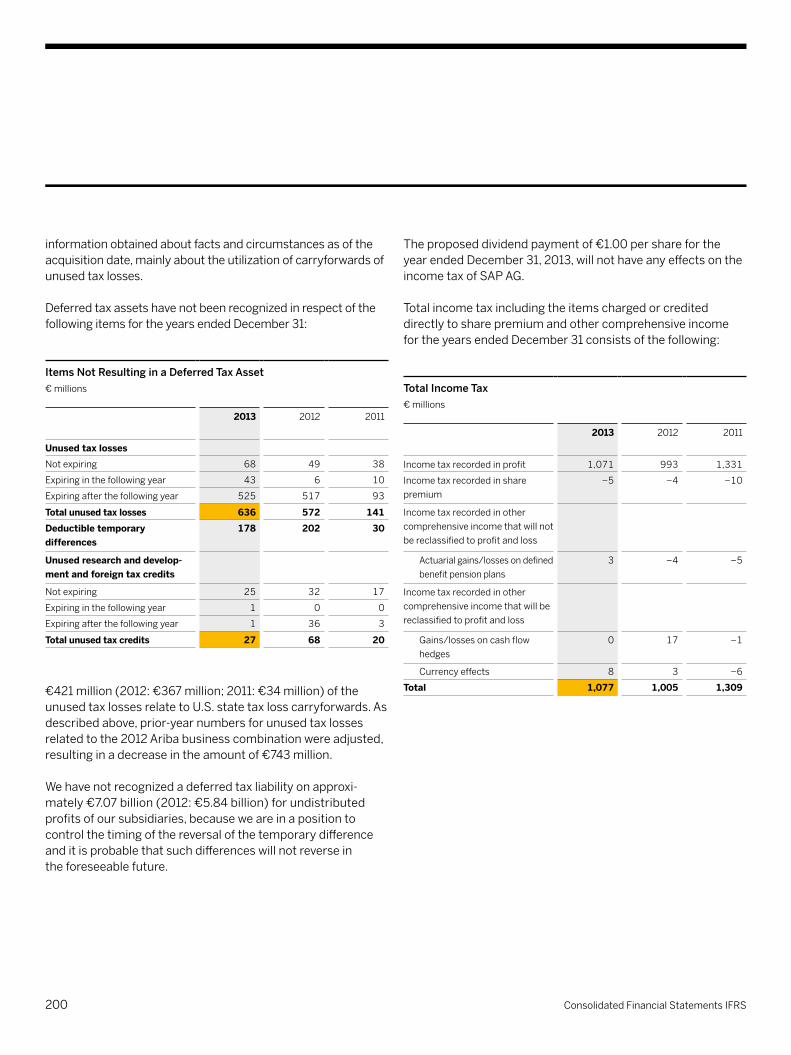
informationobtainedaboutfactsandcircumstancesasoftheacquisitiondate,mainlyabouttheutilizationofcarryforwardsofunusedtaxlosses.
DeferredtaxassetshavenotbeenrecognizedinrespectofthefollowingitemsfortheyearsendedDecember31:
Items Not Resulting in a Deferred Tax Asset€ millions
2013 2012 2011
unused tax lossesNotexpiring 68 49 38
Expiringinthefollowingyear 43 6 10
Expiringafterthefollowingyear 525 517 93
Total unused tax losses 636 572 141Deductible temporary differences
178 202 30
unused research and develop-ment and foreign tax credits
Notexpiring 25 32 17
Expiringinthefollowingyear 1 0 0
Expiringafterthefollowingyear 1 36 3
Total unused tax credits 27 68 20
€421million(2012:€367million;2011:€34million)oftheunusedtaxlossesrelatetoU.S.statetaxlosscarryforwards.Asdescribedabove,prior-yearnumbersforunusedtaxlossesrelatedtothe2012Aribabusinesscombinationwereadjusted,resultinginadecreaseintheamountof€743million.
Wehavenotrecognizedadeferredtaxliabilityonapproxi- mately€7.07billion(2012:€5.84billion)forundistributedprofitsofoursubsidiaries,becauseweareinapositiontocontrolthetimingofthereversalofthetemporarydifferenceanditisprobablethatsuchdifferenceswillnotreversein theforeseeablefuture.
Theproposeddividendpaymentof€1.00persharefortheyearendedDecember31,2013,willnothaveanyeffectsontheincometaxofSAPAG.
TotalincometaxincludingtheitemschargedorcrediteddirectlytosharepremiumandothercomprehensiveincomefortheyearsendedDecember31consistsofthefollowing:
Total Income Tax€ millions
2013 2012 2011
Incometaxrecordedinprofit 1,071 993 1,331
Incometaxrecordedinshare premium
−5 −4 −10
Incometaxrecordedinother comprehensiveincomethatwillnotbe reclassified to profit and loss
Actuarialgains/lossesondefinedbenefit pension plans
3 −4 −5
Incometaxrecordedinother comprehensiveincomethatwillbereclassified to profit and loss
Gains/lossesoncashflowhedges
0 17 −1
Currencyeffects 8 3 −6
Total 1,077 1,005 1,309
200 Consolidated Financial Statements IFRS
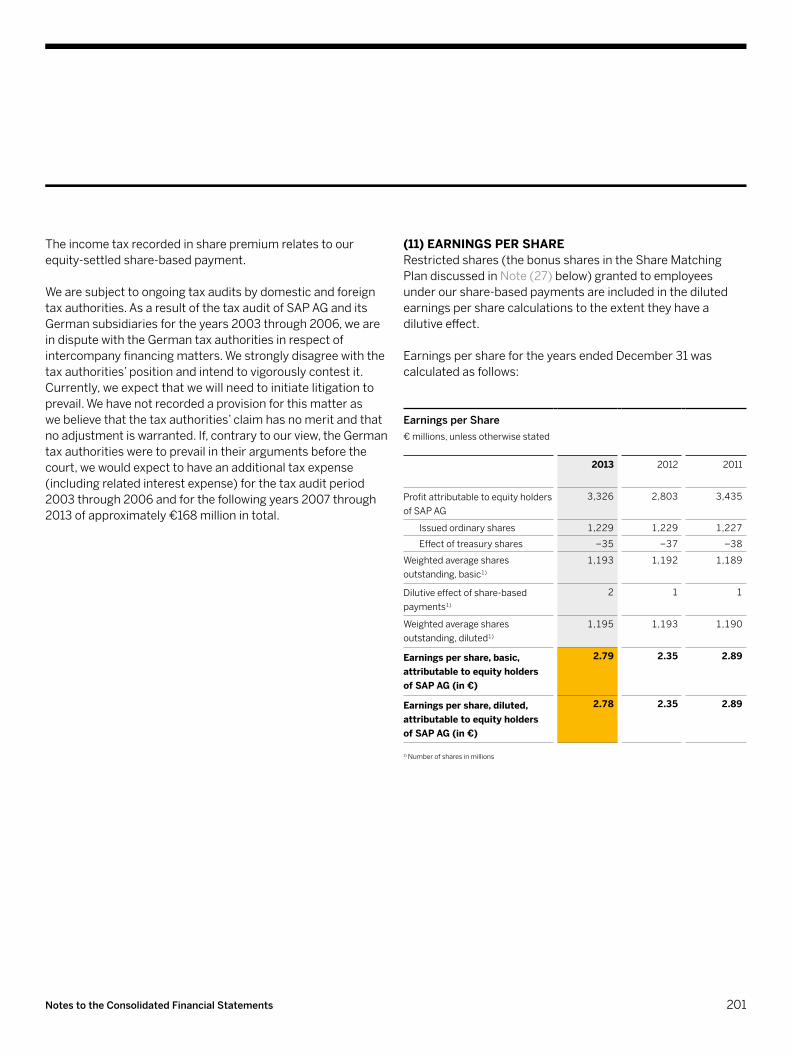
Theincometaxrecordedinsharepremiumrelatestoourequity-settledshare-basedpayment.
Wearesubjecttoongoingtaxauditsbydomesticandforeigntaxauthorities.AsaresultofthetaxauditofSAPAGanditsGermansubsidiariesfortheyears2003through2006,weareindisputewiththeGermantaxauthoritiesinrespectofintercompanyfinancingmatters.Westronglydisagreewiththetaxauthorities’positionandintendtovigorouslycontestit.Currently,weexpectthatwewillneedtoinitiatelitigationtoprevail.Wehavenotrecordedaprovisionforthismatteras webelievethatthetaxauthorities’claimhasnomeritandthatnoadjustmentiswarranted.If,contrarytoourview,theGermantaxauthoritiesweretoprevailintheirargumentsbeforethecourt,wewouldexpecttohaveanadditionaltaxexpense(includingrelatedinterestexpense)forthetaxauditperiod2003through2006andforthefollowingyears2007through2013ofapproximately€168millionintotal.
(11) EArnInGS pEr ShArERestrictedshares(thebonussharesintheShareMatchingPlan discussed in Note(27)below)grantedtoemployeesunderourshare-basedpaymentsareincludedinthedilutedearningspersharecalculationstotheextenttheyhaveadilutiveeffect.
EarningspersharefortheyearsendedDecember31wascalculatedasfollows:
Earnings per Share €millions,unlessotherwisestated
2013 2012 2011
Profitattributabletoequityholdersof SAP AG
3,326 2,803 3,435
Issuedordinaryshares 1,229 1,229 1,227
Effectoftreasuryshares −35 −37 −38
Weightedaverageshares outstanding, basic1)
1,193 1,192 1,189
Dilutiveeffectofshare-based payments1)
2 1 1
Weightedaverageshares outstanding, diluted1)
1,195 1,193 1,190
Earnings per share, basic, attributable to equity holders of SAp AG (in €)
2.79 2.35 2.89
Earnings per share, diluted, attributable to equity holders of SAp AG (in €)
2.78 2.35 2.89
1) Numberofsharesinmillions
201Notes to the Consolidated Financial Statements

(12) OthEr FInAnCIAl ASSEtSOtherfinancialassetsasatDecember31wereasfollows:
Other Financial Assets€ millions
2013 2012
Current Non-Current Total Current Non-Current Total
Loansandotherfinancialreceivables 90 243 333 35 208 243
Debt investments 38 0 38 15 14 29
Equityinvestments 0 322 322 0 201 201
Available-for-salefinancialassets 38 322 360 15 215 230
Derivatives 123 6 129 104 40 144
Investmentsinassociates 0 36 36 0 46 46
Total 251 607 858 154 509 663
loans and Other Financial receivablesLoansandotherfinancialreceivablesmainlyconsistoftimedeposits,investmentsinpensionassetsforwhichthecorrespondingliabilityisincludedinemployee-relatedobligations (see Note(18b)),otherreceivables,andloanstoemployeesandthirdparties.Themajorityofourloans andotherfinancialreceivablesareconcentratedintheUnitedStates.
AsatDecember31,2013,therewerenoloansandotherfinancialreceivablespastduebutnotimpaired.Wehavenoindicationsofimpairmentsofloansandotherfinancialreceivablesthatarenotpastdueandnotimpairedasatthereportingdate.Forgeneralinformationonfinancialrisk andthenatureofrisk,seeNote(24).
Available-for-Sale Financial AssetsOuravailable-for-salefinancialassetsconsistofdebtinvestmentsinbondsoffinancialandnon-financialcorporationsandmunicipalitiesandequityinvestments in listed and unlisted securities.
Theseavailable-for-salefinancialassetsaredenominated inthefollowingcurrencies:
Currencies of Available-for-Sale Financial Assets€ millions
2013 2012
Euros 51 36
U.S.dollars 305 185
Other 4 9
Total 360 230
Formoreinformationonfairvaluemeasurementwithregardtoourequityinvestments,seeNote(26).
DerivativesDetailedinformationaboutourderivativefinancialinstrumentsis presented in Note(25).
202 Consolidated Financial Statements IFRS

Thechangesintheallowancefordoubtfulaccountscharged toexpensewereimmaterialinallperiodspresented.
Concentrationsofcreditrisksarelimitedduetoourlargecustomerbaseanditsdistributionacrossmanydifferentindustries and countries worldwide.
(13) trADE AnD OthEr rECEIVAblESTradeandotherreceivableswereasfollows:
Trade and Other Receivables€ millions
2013 2012
Current Non-Current Total Current Non-Current Total
Trade receivables, net 3,802 14 3,816 3,837 0 3,837
Otherreceivables 63 84 147 80 88 168
Total 3,865 98 3,963 3,917 88 4,005
ThecarryingamountsofourtradereceivablesasatDecember31areasfollows:
Carrying Amounts of Trade Receivables€ millions
2013 2012
Grosscarryingamount 3,954 3,943
Salesallowancescharged to revenue
−96 –73
Allowance for doubtful accounts chargedtoexpense
−42 –33
Carrying amount trade receivables, net
3,816 3,837
203Notes to the Consolidated Financial Statements
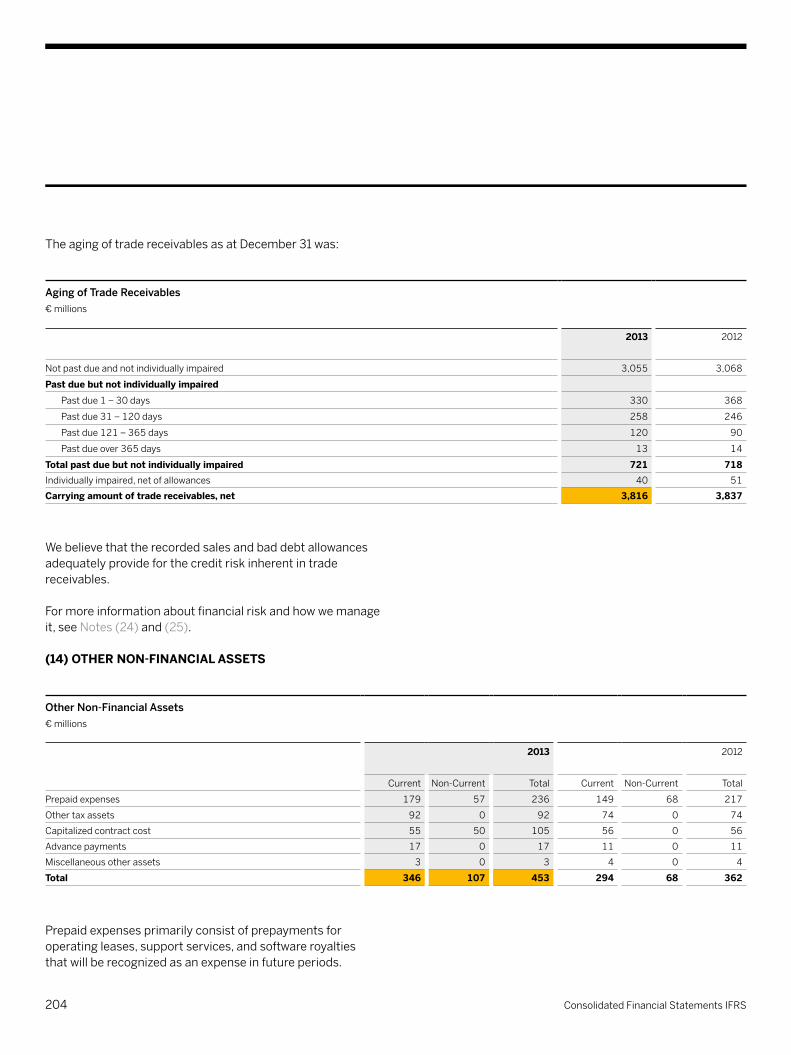
TheagingoftradereceivablesasatDecember31was:
Aging of Trade Receivables€ millions
2013 2012
Notpastdueandnotindividuallyimpaired 3,055 3,068
Past due but not individually impairedPastdue1 – 30days 330 368
Pastdue31 – 120days 258 246
Pastdue121 – 365days 120 90
Pastdueover365days 13 14
Total past due but not individually impaired 721 718Individuallyimpaired,netofallowances 40 51
Carrying amount of trade receivables, net 3,816 3,837
Webelievethattherecordedsalesandbaddebtallowancesadequatelyprovideforthecreditriskinherentintradereceivables.
Formoreinformationaboutfinancialriskandhowwemanageit, see Notes(24)and(25). (14) OthEr nOn-FInAnCIAl ASSEtS
Other Non-Financial Assets€ millions
2013 2012
Current Non-Current Total Current Non-Current Total
Prepaidexpenses 179 57 236 149 68 217
Othertaxassets 92 0 92 74 0 74
Capitalizedcontractcost 55 50 105 56 0 56
Advancepayments 17 0 17 11 0 11
Miscellaneousotherassets 3 0 3 4 0 4
Total 346 107 453 294 68 362
Prepaidexpensesprimarilyconsistofprepaymentsforoperatingleases,supportservices,andsoftwareroyalties thatwillberecognizedasanexpenseinfutureperiods.
204 Consolidated Financial Statements IFRS
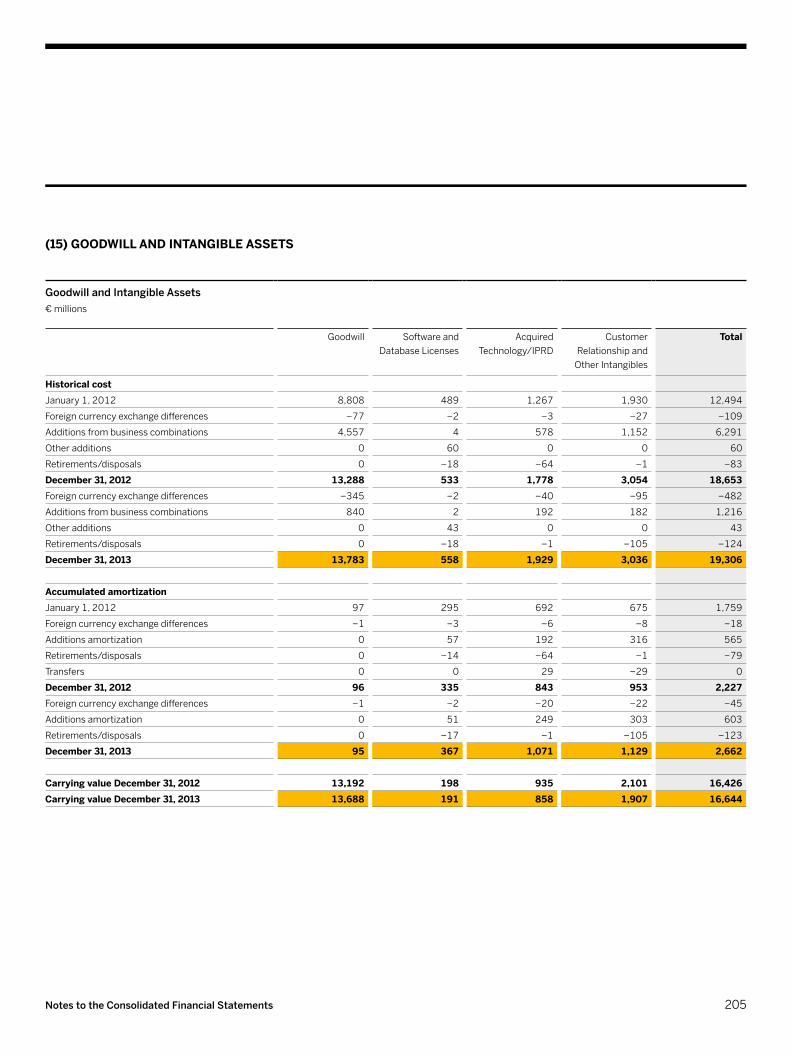
(15) GOODwIll AnD IntAnGIblE ASSEtS
Goodwill and Intangible Assets€ millions
Goodwill Software and Database Licenses
Acquired Technology/IPRD
Customer RelationshipandOtherIntangibles
Total
Historical costJanuary1,2012 8,808 489 1,267 1,930 12,494
Foreigncurrencyexchangedifferences −77 −2 −3 −27 −109
Additions from business combinations 4,557 4 578 1,152 6,291
Otheradditions 0 60 0 0 60
Retirements/disposals 0 −18 −64 −1 −83
December 31, 2012 13,288 533 1,778 3,054 18,653Foreigncurrencyexchangedifferences −345 −2 −40 −95 −482
Additions from business combinations 840 2 192 182 1,216
Otheradditions 0 43 0 0 43
Retirements/disposals 0 −18 −1 −105 −124
December 31, 2013 13,783 558 1,929 3,036 19,306
Accumulated amortizationJanuary1,2012 97 295 692 675 1,759
Foreigncurrencyexchangedifferences −1 −3 −6 −8 −18
Additions amortization 0 57 192 316 565
Retirements/disposals 0 −14 −64 −1 −79
Transfers 0 0 29 −29 0
December 31, 2012 96 335 843 953 2,227Foreigncurrencyexchangedifferences −1 −2 −20 −22 −45
Additions amortization 0 51 249 303 603
Retirements/disposals 0 −17 −1 −105 −123
December 31, 2013 95 367 1,071 1,129 2,662
Carrying value December 31, 2012 13,192 198 935 2,101 16,426Carrying value December 31, 2013 13,688 191 858 1,907 16,644
205Notes to the Consolidated Financial Statements

Theadditionsotherthanfrombusinesscombinationstosoftware and database licenses in 2013 and 2012 were individuallyacquiredfromthirdpartiesandincludecross-license agreements and patents.
Wecarrythefollowingsignificantintangibleassets:
Significant Intangible Assets
CarryingAmountin€Millions RemainingUsefulLife in Years
2013 2012
BusinessObjects–Customerrelationships:Maintenance 150 181 8 – 11
Sybase–Acquiredtechnologies 225 330 1 – 3
Sybase–Customerrelationships:Maintenance 466 581 9
Sybase–Customerrelationships:Messagingandlicense 66 109 1 – 7
SuccessFactors–Acquiredtechnologies 206 260 6
SuccessFactors–Customerrelationships:Subscription 383 404 13
Ariba–Acquiredtechnologies 186 238 7
Ariba–Customerrelationships 480 508 12 – 14
hybris–Acquiredtechnologies 159 0 7
hybris–Customerrelationships 137 0 4 – 14
Total significant intangible assets 2,458 2,611
ThecarryingamountofgoodwillhasbeenallocatedforimpairmenttestingpurposestotheSAP’soperatingsegmentsatDecember31,2013,and2012,asfollows:
Goodwill by Operating Segment€ millions
On-Premise Products
On-Premise Services
CloudApplications Ariba Total
7,462 1,122 2,167 2,523 13,274Adjustments 0 0 0 −82 −82
January 1, 2013 7,462 1,122 2,167 2,441 13,192Additions from business combinations 726 85 27 2 840Foreigncurrencyexchangedifferences −105 −12 −126 −100 −344December 31, 2013 8,083 1,195 2,067 2,343 13,688
Prioryeargoodwillamountshavebeenadjustedby€82millionrelatingtotaxadjustments.Formoreinformation,seeNote(10).
206 Consolidated Financial Statements IFRS
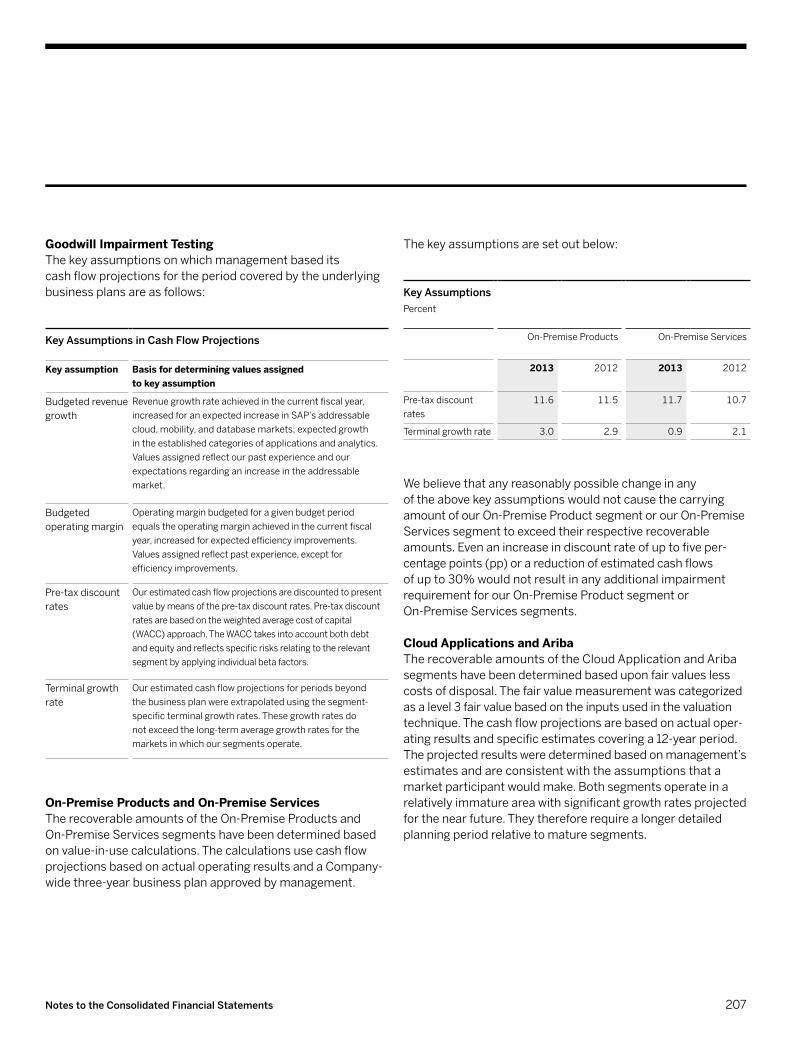
Goodwill Impairment TestingThekeyassumptionsonwhichmanagementbasedits cashflowprojectionsfortheperiodcoveredbytheunderlyingbusinessplansareasfollows:
Key Assumptions in Cash Flow Projections
Key assumption basis for determining values assigned to key assumption
Budgeted revenue growth
Revenuegrowthrateachievedinthecurrentfiscalyear,increasedforanexpectedincreaseinSAP’saddressablecloud,mobility,anddatabasemarkets;expectedgrowth intheestablishedcategoriesofapplicationsandanalytics.Valuesassignedreflectourpastexperienceandourexpectationsregardinganincreaseintheaddressablemarket.
Budgeted operating margin
Operating margin budgeted for a given budget period equalstheoperatingmarginachievedinthecurrentfiscalyear,increasedforexpectedefficiencyimprovements.Valuesassignedreflectpastexperience,exceptforefficiencyimprovements.
Pre-taxdiscountrates
Ourestimatedcashflowprojectionsarediscountedtopresentvaluebymeansofthepre-taxdiscountrates.Pre-taxdiscountratesarebasedontheweightedaveragecostofcapital(WACC)approach.TheWACCtakesintoaccountbothdebtandequityandreflectsspecificrisksrelatingtotherelevantsegmentbyapplyingindividualbetafactors.
Terminalgrowthrate
Ourestimatedcashflowprojectionsforperiodsbeyond thebusinessplanwereextrapolatedusingthesegment-specificterminalgrowthrates.Thesegrowthratesdo notexceedthelong-termaveragegrowthratesforthemarketsinwhichoursegmentsoperate.
On-Premise Products and On-Premise Services TherecoverableamountsoftheOn-PremiseProductsandOn-PremiseServicessegmentshavebeendeterminedbasedonvalue-in-usecalculations.ThecalculationsusecashflowprojectionsbasedonactualoperatingresultsandaCompany-widethree-yearbusinessplanapprovedbymanagement.
Thekeyassumptionsaresetoutbelow:
Key AssumptionsPercent
On-PremiseProducts On-PremiseServices
2013 2012 2013 2012
Pre-taxdiscount rates
11.6 11.5 11.7 10.7
Terminalgrowthrate 3.0 2.9 0.9 2.1
Webelievethatanyreasonablypossiblechangeinany oftheabovekeyassumptionswouldnotcausethecarryingamountofourOn-PremiseProductsegmentorourOn-PremiseServicessegmenttoexceedtheirrespectiverecoverableamounts.Evenanincreaseindiscountrateofuptofiveper- centagepoints(pp)orareductionofestimatedcashflows ofupto30%wouldnotresultinanyadditionalimpairmentrequirementforourOn-PremiseProductsegmentorOn-PremiseServicessegments.
Cloud Applications and Ariba TherecoverableamountsoftheCloudApplicationandAribasegmentshavebeendeterminedbaseduponfairvalueslesscostsofdisposal.Thefairvaluemeasurementwascategorizedasalevel3fairvaluebasedontheinputsusedinthevaluationtechnique.Thecashflowprojectionsarebasedonactualoper- atingresultsandspecificestimatescoveringa12-yearperiod.Theprojectedresultsweredeterminedbasedonmanagement’sestimatesandareconsistentwiththeassumptionsthatamarketparticipantwouldmake.Bothsegmentsoperateinarelativelyimmatureareawithsignificantgrowthratesprojectedforthenearfuture.Theythereforerequirealongerdetailedplanning period relative to mature segments.
207Notes to the Consolidated Financial Statements
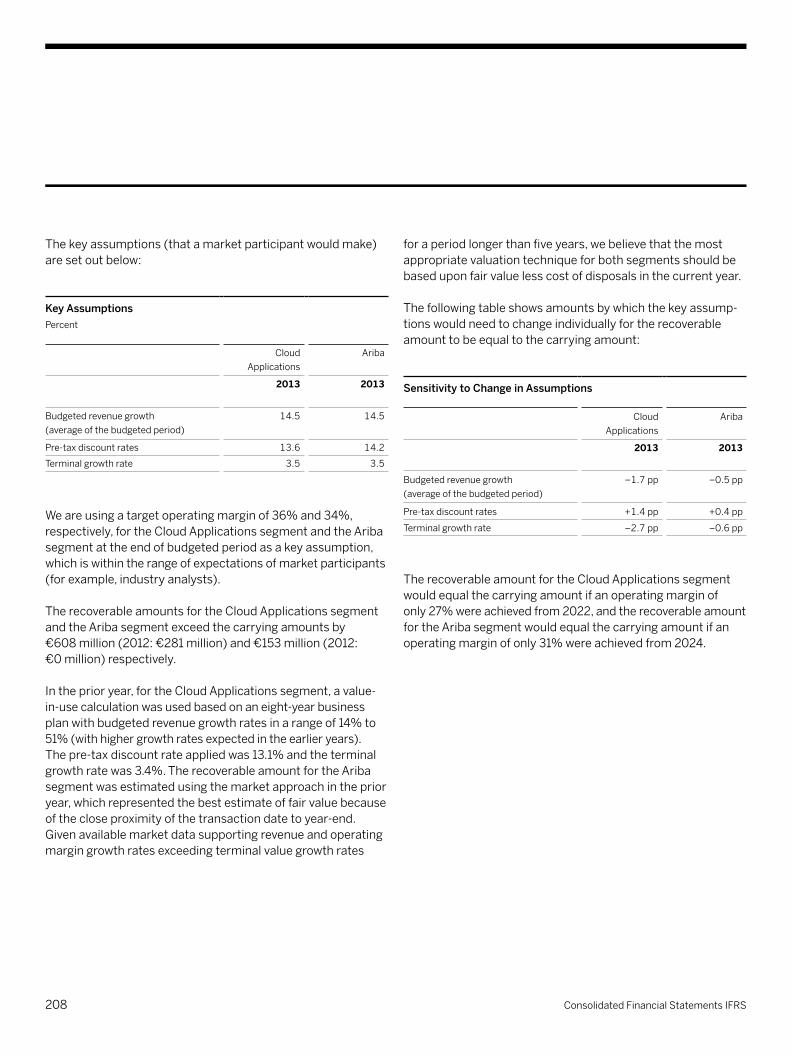
Thekeyassumptions(thatamarketparticipantwouldmake)aresetoutbelow:
Key AssumptionsPercent
Cloud Applications
Ariba
2013 2013
Budgetedrevenuegrowth (averageofthebudgetedperiod)
14.5 14.5
Pre-taxdiscountrates 13.6 14.2
Terminalgrowthrate 3.5 3.5
Weareusingatargetoperatingmarginof36%and34%,respectively,fortheCloudApplicationssegmentandtheAribasegmentattheendofbudgetedperiodasakeyassumption,whichiswithintherangeofexpectationsofmarketparticipants(forexample,industryanalysts).
TherecoverableamountsfortheCloudApplicationssegmentandtheAribasegmentexceedthecarryingamountsby €608million(2012:€281million)and€153million(2012: €0million)respectively.
Intheprioryear,fortheCloudApplicationssegment,avalue-in-usecalculationwasusedbasedonaneight-yearbusinessplanwithbudgetedrevenuegrowthratesinarangeof14%to51%(withhighergrowthratesexpectedintheearlieryears). Thepre-taxdiscountrateappliedwas13.1%andtheterminalgrowthratewas3.4%.TherecoverableamountfortheAribasegmentwasestimatedusingthemarketapproachintheprioryear,whichrepresentedthebestestimateoffairvaluebecauseofthecloseproximityofthetransactiondatetoyear-end. Given available market data supporting revenue and operating margingrowthratesexceedingterminalvaluegrowthrates
foraperiodlongerthanfiveyears,webelievethatthemostappropriatevaluationtechniqueforbothsegmentsshouldbebaseduponfairvaluelesscostofdisposalsinthecurrentyear.
Thefollowingtableshowsamountsbywhichthekeyassump- tionswouldneedtochangeindividuallyfortherecoverableamounttobeequaltothecarryingamount:
Sensitivity to Change in Assumptions
Cloud Applications
Ariba
2013 2013
Budgetedrevenuegrowth (averageofthebudgetedperiod)
–1.7pp –0.5pp
Pre-taxdiscountrates +1.4pp +0.4pp
Terminalgrowthrate –2.7pp –0.6pp
TherecoverableamountfortheCloudApplicationssegmentwouldequalthecarryingamountifanoperatingmarginof only27%wereachievedfrom2022,andtherecoverableamount fortheAribasegmentwouldequalthecarryingamountifanoperatingmarginofonly31%wereachievedfrom2024.
208 Consolidated Financial Statements IFRS
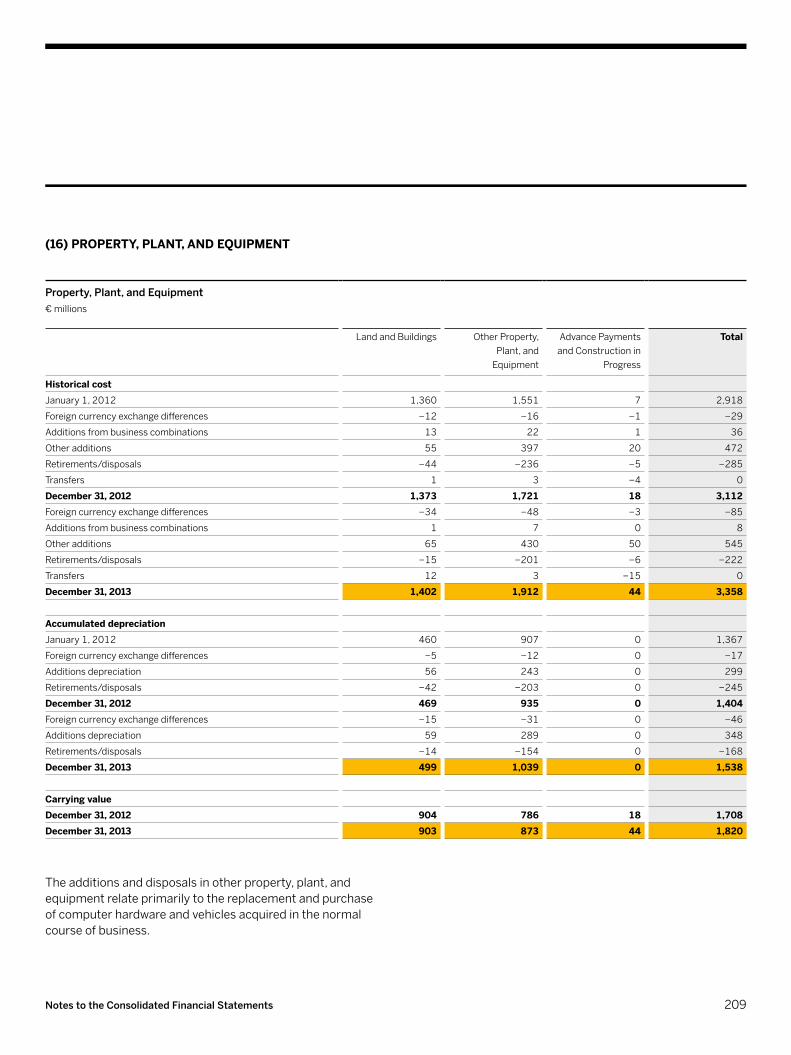
(16) prOpErty, plAnt, AnD EquIpmEnt
Property, Plant, and Equipment€ millions
Land and Buildings OtherProperty,Plant, and Equipment
AdvancePaymentsandConstructionin
Progress
Total
Historical costJanuary1,2012 1,360 1,551 7 2,918
Foreigncurrencyexchangedifferences −12 −16 −1 −29
Additions from business combinations 13 22 1 36
Otheradditions 55 397 20 472
Retirements/disposals −44 −236 −5 −285
Transfers 1 3 −4 0
December 31, 2012 1,373 1,721 18 3,112Foreigncurrencyexchangedifferences −34 −48 −3 −85
Additions from business combinations 1 7 0 8
Otheradditions 65 430 50 545
Retirements/disposals −15 −201 −6 −222
Transfers 12 3 −15 0
December 31, 2013 1,402 1,912 44 3,358
Accumulated depreciationJanuary1,2012 460 907 0 1,367
Foreigncurrencyexchangedifferences −5 −12 0 −17
Additions depreciation 56 243 0 299
Retirements/disposals −42 −203 0 −245
December 31, 2012 469 935 0 1,404Foreigncurrencyexchangedifferences −15 −31 0 −46
Additions depreciation 59 289 0 348
Retirements/disposals −14 −154 0 −168
December 31, 2013 499 1,039 0 1,538
Carrying valueDecember 31, 2012 904 786 18 1,708December 31, 2013 903 873 44 1,820
Theadditionsanddisposalsinotherproperty,plant,andequipmentrelateprimarilytothereplacementandpurchase ofcomputerhardwareandvehiclesacquiredinthenormalcourse of business.
209Notes to the Consolidated Financial Statements

(17) trADE AnD OthEr pAyAblES, FInAnCIAl lIAbIlItIES, AnD OthEr nOn-FInAnCIAl lIAbIlItIES
(17a) trade and Other payablesTradeandotherpayablesasatDecember31wereasfollows:
Trade and Other Payables€ millions
2013 2012
Current Non-Current Total Current Non-Current Total
Tradepayables 640 0 640 684 0 684
Advancepaymentsreceived 80 0 80 81 0 81
Miscellaneousotherliabilities 130 45 175 105 63 168
Trade and other payables 850 45 895 870 63 933
Miscellaneousotherliabilitiesincludemainlydeferralamountsfor free rent periods and liabilities related to government grants.
(17b) Financial liabilitiesFinancialliabilitiesasatDecember31wereasfollows:
Financial Liabilities€ millions
2013 2012
Nominalvolume Carryingamount Nominalvolume Carryingamount
Current Non-Current Current Non-Current Total Current Non-Current Current Non-Current Total
Bonds 500 1,800 500 1,791 2,291 600 2,300 600 2,287 2,887
Private placement transactions
86 1,922 86 1,891 1,977 0 2,094 0 2,088 2,088
Financial Debt 586 3,722 586 3,682 4,268 600 4,394 600 4,375 4,975
Otherfinancial liabilities
NA NA 162 76 238 NA NA 202 71 273
Financial liabilities 748 3,758 4,506 802 4,446 5,248
Financialliabilitiesareunsecured,exceptfortheretentionoftitleandsimilarrightscustomaryinourindustry.Effectiveinterestratesonourfinancialdebt(includingtheeffectsfrominterestrateswaps)were2.48%in2013,2.87%in2012,and2.98%in2011.
210 Consolidated Financial Statements IFRS

Forananalysisofthecontractualcashflowsofourfinancialliabilitiesbasedonmaturity,seeNote(24).Forinformationontheriskassociatedwithourfinancialliabilities,seeNote(25). Forinformationonfairvalues,seeNote(26).
BondsAsatDecember31,wehadoutstandingbondswiththefollowingterms:
Bonds
Maturity IssuePrice CouponRate Effective InterestRate
NominalVolume(in€millions)
balance on 12/31/2013 (in € millions)
Balance on12/31/2012 (in€millions)
Eurobond1–2010 2014 99.755% 2.50%(fix) 2.64% 500 500 499
Eurobond2–2010 2017 99.780% 3.50%(fix) 3.58% 500 499 498
Eurobond4–2010 2013 99.857% 2.25%(fix) 2.38% 600 0 600
Eurobond5–2012 2015 99.791% 1.00%(fix) 1.17% 550 547 547
Eurobond6–2012 2019 99.307% 2.125%(fix) 2.27% 750 745 743
bonds 2,291 2,887
InSeptember2012,wearrangedadebtissuanceprogram withaninitialrenewabletermof12months.Theprogramenablesustoissuebondsinanumberoftranchesindifferentcurrenciesuptoavolumeof€2.4billion.InNovember2012,weissuedbondsundertheprogramasshowninthetableabove. InSeptember2013,ourdebtissuanceprogramwasextendedby12monthsandthevolumewasincreasedto€4billion, allofwhichisavailablefornewbondissuances.
AllourEurobondsarelistedfortradingontheLuxembourgStockExchange.
211Notes to the Consolidated Financial Statements

Private Placement TransactionsOurprivateplacementtransactionshavethefollowingterms:
Private Placements
Maturity CouponRate Effective InterestRate
NominalVolume (in respective cur-rencyinmillions)
balance on 12/31/2013 (in € millions)
Balance on12/31/2012 (in€millions)
Germanpromissorynote
Tranche3–2009 2014 4.92%(fix) 4.98% €86 86 86
U.S.privateplacements
Tranche1–2010 2015 2.34%(fix) 2.40% US$300 216 227
Tranche2–2010 2017 2.95%(fix) 3.03% US$200 145 151
Tranche3–2011 2016 2.77%(fix) 2.82% US$600 434 454
Tranche4–2011 2018 3.43%(fix) 3.50% US$150 108 113
Tranche5–2012 2017 2.13%(fix) 2.16% US$242.5 175 183
Tranche6–2012 2020 2.82%(fix) 2.86% US$290 206 219
Tranche7–2012 2022 3.18%(fix) 3.22% US$444.5 313 336
Tranche8–2012 2024 3.33%(fix) 3.37% US$323 225 244
Tranche9–2012 2027 3.53%(fix) 3.57% US$100 69 75
Private placements 1,977 2,088
TheU.S.privateplacementnoteswereissuedbyoneofoursubsidiariesthathastheU.S.dollarasitsfunctionalcurrency.
Other Financial LiabilitiesOurotherfinancialliabilitiesmainlycomprisederivativeliabilities and liabilities for accrued interest.
(17c) Other non-Financial liabilitiesOthernon-financialliabilitiesasatDecember31wereasfollows:
Other Non-Financial Liabilities€ millions
2013 2012
Current Non-Current Total Current Non-Current Total
Otheremployee-relatedliabilities 1,775 112 1,887 1,768 98 1,866
Othertaxes 488 0 488 436 0 436
Other non-financial liabilities 2,263 112 2,375 2,204 98 2,302
212 Consolidated Financial Statements IFRS

Otheremployee-relatedliabilitiesmainlyrelatetovacationaccruals, bonus and sales commission accruals, as well asemployee-relatedsocialsecurityobligations.
Othertaxescomprisemainlypayrolltaxliabilitiesand value-addedtaxliabilities.
(18) prOVISIOnSProvisionsasatDecember31wereasfollows:
Provisions€ millions
2013 2012
Current Non-Current Total Current Non-Current Total
Pension plans and similar obligations (see Note(18a)) 2 62 64 3 69 72
Otherprovisions(seeNote(18b)) 643 215 858 840 278 1,118
Total 645 277 922 843 347 1,190
(18a) pension plans and Similar ObligationsWemaintainseveraldefinedbenefitanddefinedcontributionpensionplansforouremployeesinGermanyandatforeignsubsidiaries,whichprovideforoldage,disability,andsurvivors’benefits.Themeasurementdatesforthedomesticandf oreignbenefitplansareDecember31.IndividualbenefitplanshavealsobeenestablishedformembersofourExecutiveBoard.Furthermore,incertaincountriesweprovideterminationindemnitybenefitstoemployeesregardlessofthecause fortermination.Thesetypesofbenefitsaretypicallydefinedbylawintheseforeigncountries.
Ourdomesticdefinedbenefitpensionplansprovideparticipants withpensionbenefitsthatarebasedonthelengthofserviceandcompensationofemployees.
Thereisalsoadomesticemployee-financedpensionplanwhichSAPfundsthroughthepurchaseofqualifyinginsurancepoliciesandwhereSAPguaranteesaminimumreturnoninvestmentwhichisequivalenttothereturnguaranteedbytheinsurer.EventhoughtheriskthatSAPwouldbeliablefor areturnthatcannotbemetbytheinsurancecompanyisveryremote,theseemployee-financedplansdonotqualifyas
definedcontributionplansunderIFRSandconsequently, thepensionliabilitiesandtherespectiveinsurancepoliciesareincluded in domestic plan assets and plan liabilities respectively.
Foreigndefinedbenefitpensionplansprovideparticipants withpensionbenefitsthatarebasedoncompensationlevels,age,andlengthofservice.
ThepensionplaninSwitzerlandaccountedfor€189millionofdefinedbenefitobligationand€194millionoftheplanassets.Thisplanconsistsofthreebenefitsnamelyretirementbenefits,disabilitybenefitsandspousepension.Theseobligationsarebasedonsalaryandageoftheemployees.Bothemployerandemployeemakecontributionstotheplan.Statutoryminimumfundingobligationsexist.
213Notes to the Consolidated Financial Statements
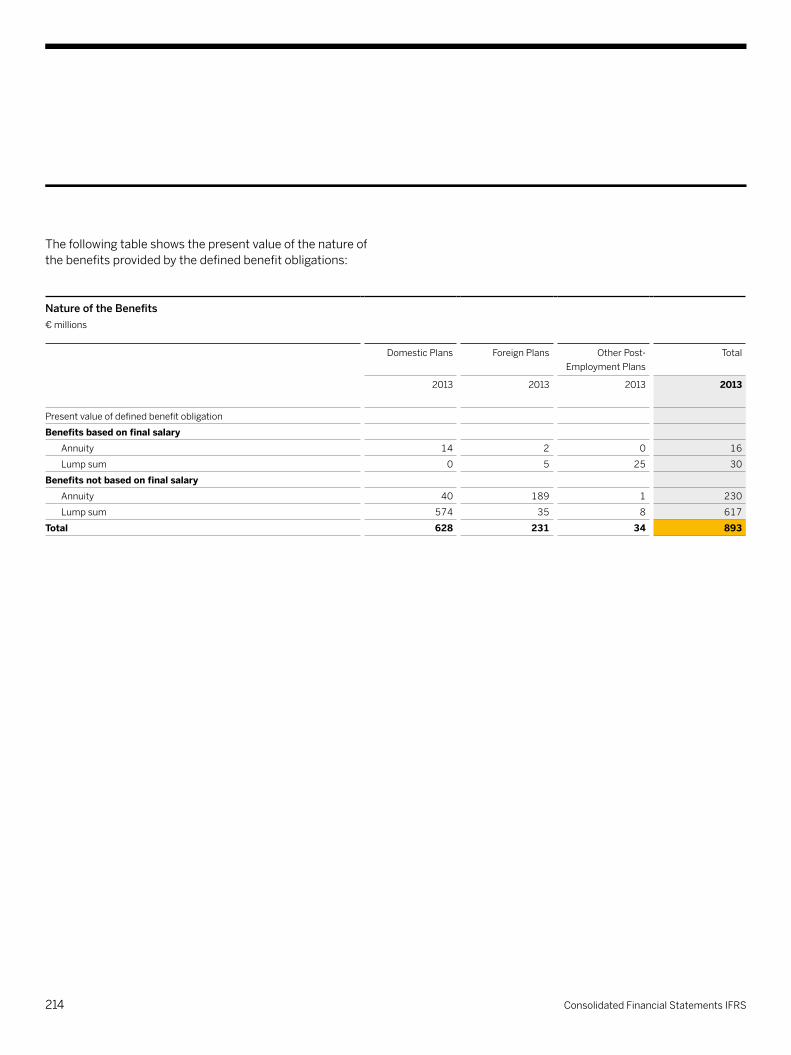
Thefollowingtableshowsthepresentvalueofthenatureof thebenefitsprovidedbythedefinedbenefitobligations:
Nature of the Benefits € millions
Domestic Plans ForeignPlans OtherPost- EmploymentPlans
Total
2013 2013 2013 2013
Present value of defined benefit obligation
benefits based on final salaryAnnuity 14 2 0 16
Lump sum 0 5 25 30
benefits not based on final salaryAnnuity 40 189 1 230
Lump sum 574 35 8 617
Total 628 231 34 893
214 Consolidated Financial Statements IFRS
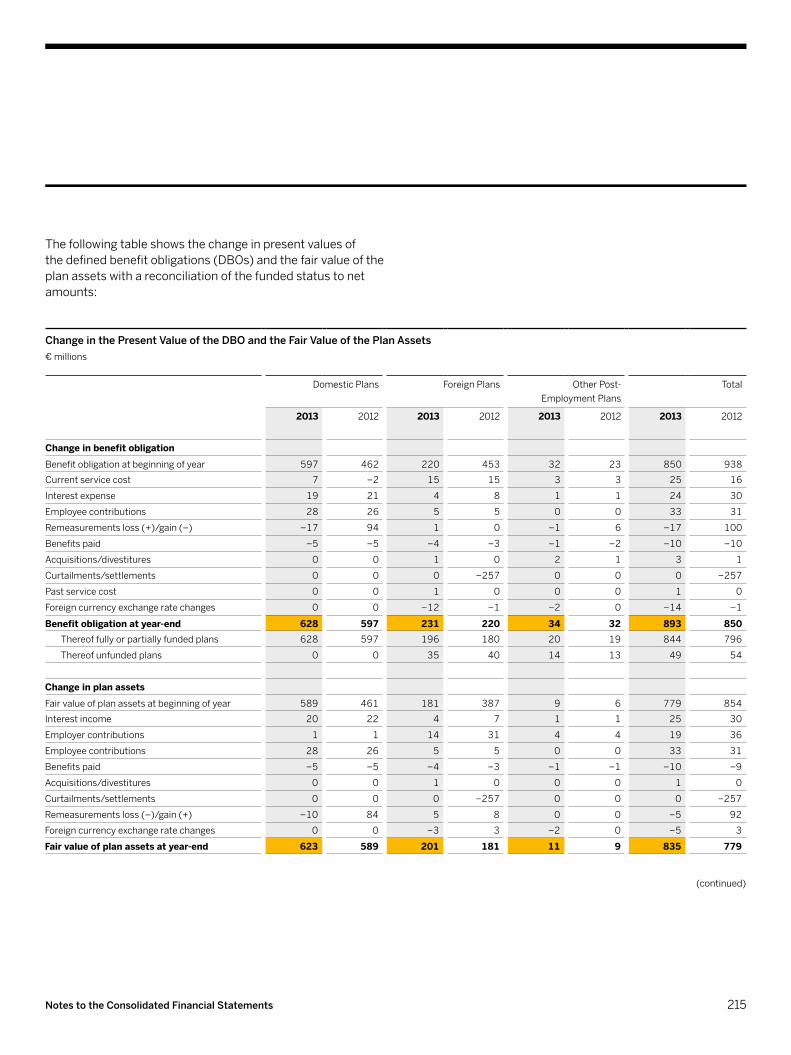
Thefollowingtableshowsthechangeinpresentvaluesof thedefinedbenefitobligations(DBOs)andthefairvalueoftheplanassetswithareconciliationofthefundedstatustonetamounts:
Change in the Present Value of the DBO and the Fair Value of the Plan Assets € millions
Domestic Plans ForeignPlans OtherPost- EmploymentPlans
Total
2013 2012 2013 2012 2013 2012 2013 2012
Change in benefit obligation
Benefitobligationatbeginningofyear 597 462 220 453 32 23 850 938
Currentservicecost 7 −2 15 15 3 3 25 16
Interestexpense 19 21 4 8 1 1 24 30
Employeecontributions 28 26 5 5 0 0 33 31
Remeasurementsloss(+)/gain(–) −17 94 1 0 −1 6 −17 100
Benefits paid −5 −5 −4 −3 −1 −2 −10 −10
Acquisitions/divestitures 0 0 1 0 2 1 3 1
Curtailments/settlements 0 0 0 −257 0 0 0 −257
Past service cost 0 0 1 0 0 0 1 0
Foreigncurrencyexchangeratechanges 0 0 −12 −1 −2 0 −14 −1
benefit obligation at year-end 628 597 231 220 34 32 893 850Thereoffullyorpartiallyfundedplans 628 597 196 180 20 19 844 796
Thereofunfundedplans 0 0 35 40 14 13 49 54
Change in plan assets
Fairvalueofplanassetsatbeginningofyear 589 461 181 387 9 6 779 854
Interestincome 20 22 4 7 1 1 25 30
Employercontributions 1 1 14 31 4 4 19 36
Employeecontributions 28 26 5 5 0 0 33 31
Benefits paid −5 −5 −4 −3 −1 −1 −10 −9
Acquisitions/divestitures 0 0 1 0 0 0 1 0
Curtailments/settlements 0 0 0 −257 0 0 0 −257
Remeasurementsloss(–)/gain(+) −10 84 5 8 0 0 −5 92
Foreigncurrencyexchangeratechanges 0 0 −3 3 −2 0 −5 3
Fair value of plan assets at year-end 623 589 201 181 11 9 835 779
(continued)
215Notes to the Consolidated Financial Statements
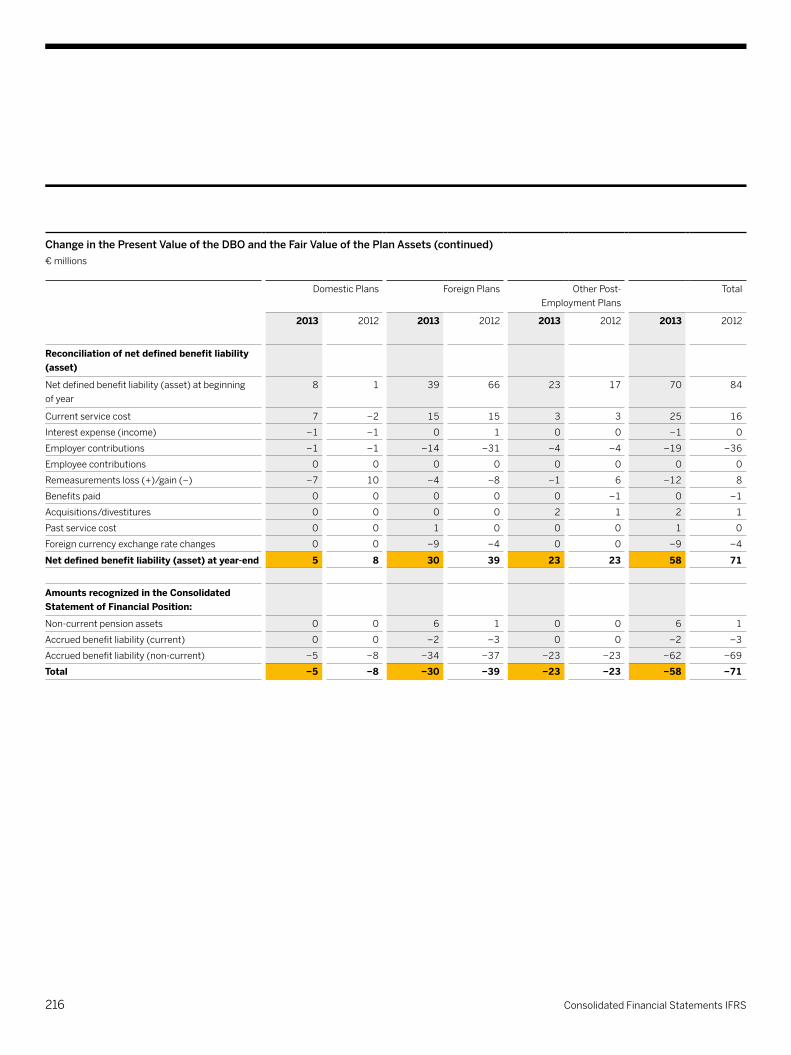
Change in the Present Value of the DBO and the Fair Value of the Plan Assets (continued) € millions
Domestic Plans ForeignPlans OtherPost- EmploymentPlans
Total
2013 2012 2013 2012 2013 2012 2013 2012
Reconciliation of net defined benefit liability (asset)
Netdefinedbenefitliability(asset)atbeginning ofyear
8 1 39 66 23 17 70 84
Currentservicecost 7 −2 15 15 3 3 25 16
Interestexpense(income) −1 −1 0 1 0 0 −1 0
Employercontributions −1 −1 −14 −31 −4 −4 −19 −36
Employeecontributions 0 0 0 0 0 0 0 0
Remeasurementsloss(+)/gain(–) −7 10 −4 −8 −1 6 −12 8
Benefits paid 0 0 0 0 0 −1 0 −1
Acquisitions/divestitures 0 0 0 0 2 1 2 1
Past service cost 0 0 1 0 0 0 1 0
Foreigncurrencyexchangeratechanges 0 0 −9 −4 0 0 −9 −4
net defined benefit liability (asset) at year-end 5 8 30 39 23 23 58 71
Amounts recognized in the Consolidated Statement of Financial Position:
Non-currentpensionassets 0 0 6 1 0 0 6 1
Accruedbenefitliability(current) 0 0 −2 −3 0 0 −2 −3
Accruedbenefitliability(non-current) −5 −8 −34 −37 −23 −23 −62 −69
Total −5 −8 −30 −39 −23 −23 −58 −71
216 Consolidated Financial Statements IFRS
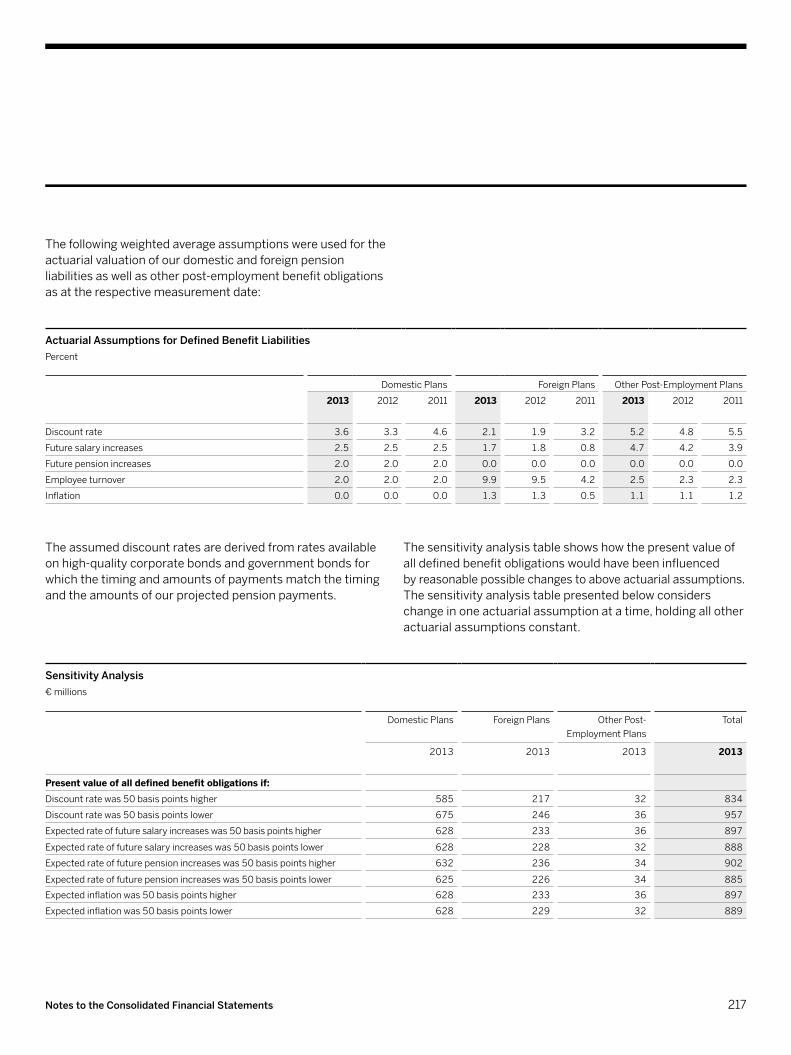
Thefollowingweightedaverageassumptionswereusedfortheactuarial valuation of our domestic and foreign pension liabilitiesaswellasotherpost-employmentbenefitobligationsasattherespectivemeasurementdate:
Actuarial Assumptions for Defined Benefit LiabilitiesPercent
Domestic Plans ForeignPlans OtherPost-EmploymentPlans
2013 2012 2011 2013 2012 2011 2013 2012 2011
Discount rate 3.6 3.3 4.6 2.1 1.9 3.2 5.2 4.8 5.5
Futuresalaryincreases 2.5 2.5 2.5 1.7 1.8 0.8 4.7 4.2 3.9
Futurepensionincreases 2.0 2.0 2.0 0.0 0.0 0.0 0.0 0.0 0.0
Employeeturnover 2.0 2.0 2.0 9.9 9.5 4.2 2.5 2.3 2.3
Inflation 0.0 0.0 0.0 1.3 1.3 0.5 1.1 1.1 1.2
Theassumeddiscountratesarederivedfromratesavailableonhigh-qualitycorporatebondsandgovernmentbondsforwhichthetimingandamountsofpaymentsmatchthetimingandtheamountsofourprojectedpensionpayments.
Thesensitivityanalysistableshowshowthepresentvalueofalldefinedbenefitobligationswouldhavebeeninfluenced byreasonablepossiblechangestoaboveactuarialassumptions. Thesensitivityanalysistablepresentedbelowconsiderschangeinoneactuarialassumptionatatime,holdingallotheractuarial assumptions constant.
Sensitivity Analysis€ millions
Domestic Plans ForeignPlans OtherPost- EmploymentPlans
Total
2013 2013 2013 2013
Present value of all defined benefit obligations if:Discountratewas50basispointshigher 585 217 32 834
Discountratewas50basispointslower 675 246 36 957
Expectedrateoffuturesalaryincreaseswas50basispointshigher 628 233 36 897
Expectedrateoffuturesalaryincreaseswas50basispointslower 628 228 32 888
Expectedrateoffuturepensionincreaseswas50basispointshigher 632 236 34 902
Expectedrateoffuturepensionincreaseswas50basispointslower 625 226 34 885
Expectedinflationwas50basispointshigher 628 233 36 897
Expectedinflationwas50basispointslower 628 229 32 889
217Notes to the Consolidated Financial Statements

Thecomponentsoftotalexpenseofdefinedbenefitpensionplansfortheyears2013,2012,and2011recognizedinoperatingexpensewereasfollows:
Total Expense of Defined Benefit Pension Plans€ millions
Domestic Plans ForeignPlans OtherPost-EmploymentPlans Total
2013 2012 2011 2013 2012 2011 2013 2012 2011 2013 2012 2011
Currentservicecost 7 −2 −1 15 15 18 3 3 3 25 16 20
Interestexpense 19 21 20 4 8 13 1 1 1 24 30 34
Interestincome −20 −22 −21 −4 −7 −12 −1 −1 0 −25 −30 −33
Past service cost 0 0 0 1 0 −2 0 0 0 1 0 −2
Total expense 6 −3 −2 16 16 17 4 3 4 26 16 19
Actual return on plan assets
10 106 28 9 15 5 1 1 0 20 122 33
Duetothefactthatourdomesticdefinedbenefitpensionplansprimarilyconsistofanemployee-financedpost-retirement planthatisfullyfinancedwithqualifyinginsurancepolicies,current servicecostmayturnintoacreditasaresultofadjustingthedefinedbenefitliability’scarryingamounttothefairvalueofthequalifyingplanassets.Suchadjustmentsarerecordedin service cost.
218 Consolidated Financial Statements IFRS
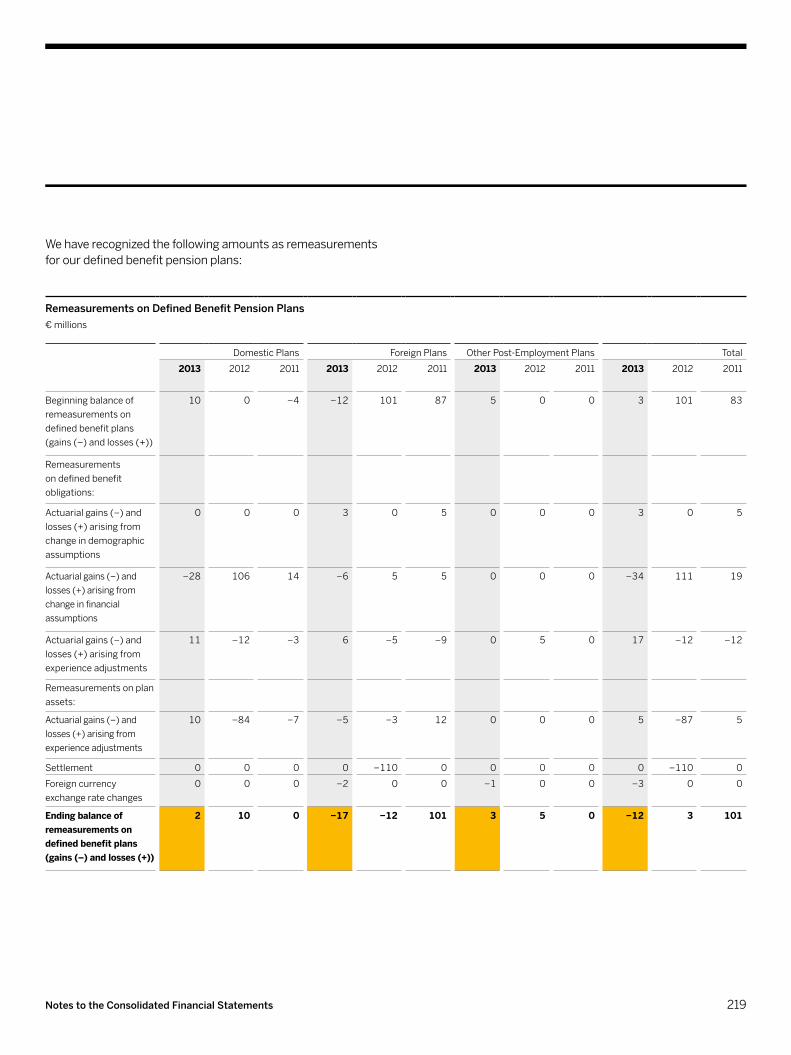
Wehaverecognizedthefollowingamountsasremeasurementsforourdefinedbenefitpensionplans:
Remeasurements on Defined Benefit Pension Plans€ millions
Domestic Plans ForeignPlans OtherPost-EmploymentPlans Total
2013 2012 2011 2013 2012 2011 2013 2012 2011 2013 2012 2011
Beginning balance of remeasurements on defined benefit plans (gains(–)andlosses(+))
10 0 −4 −12 101 87 5 0 0 3 101 83
Remeasurements on defined benefit obligations:
Actuarialgains(–)andlosses(+)arisingfromchangeindemographicassumptions
0 0 0 3 0 5 0 0 0 3 0 5
Actuarialgains(–)and losses(+)arisingfromchangeinfinancial assumptions
−28 106 14 −6 5 5 0 0 0 −34 111 19
Actuarialgains(–)andlosses(+)arisingfrom experienceadjustments
11 −12 −3 6 −5 −9 0 5 0 17 −12 −12
Remeasurementsonplanassets:
Actuarialgains(–)and losses(+)arisingfrom experienceadjustments
10 −84 −7 −5 −3 12 0 0 0 5 −87 5
Settlement 0 0 0 0 −110 0 0 0 0 0 −110 0
Foreigncurrency exchangeratechanges
0 0 0 −2 0 0 −1 0 0 −3 0 0
Ending balance of remeasurements on defined benefit plans (gains (–) and losses (+))
2 10 0 −17 −12 101 3 5 0 −12 3 101
219Notes to the Consolidated Financial Statements

Forthedeterminationofthetotalexpensefortheyears2013,2012,and2011,theprojectionofthedefinedbenefitobligationandthefairvalueoftheplanassetsasatDecember31,2013,2012,and2011,thefollowingprincipalactuarialassumptions(expressedasweightedaveragesforourforeignandpost-employmentbenefitplans)wereused:
Actuarial Assumptions for Total ExpensePercent
Domestic Plans ForeignPlans OtherPost-EmploymentPlans
2013 2012 2011 2013 2012 2011 2013 2012 2011
Discount rate 3.3 4.6 4.9 2.0 2.2 3.3 4.8 5.6 5.8
Futuresalaryincreases 2.5 2.5 2.5 1.7 1.8 1.3 4.2 3.9 3.4
Futurepensionincreases 2.0 2.0 2.0 0.0 0.0 0.0 0.0 0.0 0.0
Employeeturnover 2.0 2.0 2.0 9.8 10.2 4.2 2.0 1.9 2.0
Inflation 0.0 0.0 0.0 1.3 1.3 0.5 1.1 1.1 1.2
Ourinvestmentstrategyondomesticbenefitplansistoinvestall contributions in stable insurance policies.
Ourinvestmentstrategiesforforeignbenefitplansvaryaccordingtotheconditionsinthecountryinwhichtherespectivebenefitplansaresituated.Generally,along-terminvestmenthorizonhasbeenadoptedforallmajorforeignbenefitplans.Althoughourpolicyistoinvestinarisk-diversifiedportfolioconsistingofamixofassets,boththedefinedbenefitobligationandplanassetscanfluctuateover- timewhichexposestheGrouptoactuarialandmarket(investment)risks.Dependingonthestatutoryrequirements ineachcountry,itmightbenecessarytoreducethe
underfundingbyadditionofliquidassets.Tominimizetheseactuarialandmarketfluctuations,SAPreviewsrelevantfinancialfactorsforappropriatenessandreasonablenessandmakesmodificationstoeliminatecertaineffectswhenconsiderednecessary.
220 Consolidated Financial Statements IFRS

Our plan asset allocation as at December 31, 2013, and December31,2012,wasasfollows:
Plan Asset Allocation€ millions
2013 2012
Quoted in an ActiveMarket
NotQuotedinan ActiveMarket
Quoted in an ActiveMarket
NotQuotedinan ActiveMarket
Asset categoryEquityinvestments 48 0 42 0
Corporatebonds 65 0 63 0
Realestate 33 0 29 0
Insurancepolicies 9 623 8 589
Cashandcashequivalents 34 0 31 0
Others 23 0 17 0
Total 212 623 190 589
Ourexpectedcontributionin2014is€1millionfordomesticdefinedbenefitpensionplansand€15millionforforeigndefinedbenefitpensionplans,allofwhichisexpectedtobepaidincash.Theweighteddurationofourdefinedbenefitplansamountedto15yearsasatDecember31,2013,and 14yearsasatDecember31,2012.
Thetablebelowpresentsthematurityanalysisofthebenefitpayments:
Maturity Analysis€ millions
Domestic Plans ForeignPlans OtherPost- EmploymentPlans
2013 2013 2013
Lessthanayear 8 20 1
Between1 – 2years 9 36 2
Between2 – 5years 58 53 5
Over5years 989 205 64
Total 1,064 314 72
221Notes to the Consolidated Financial Statements
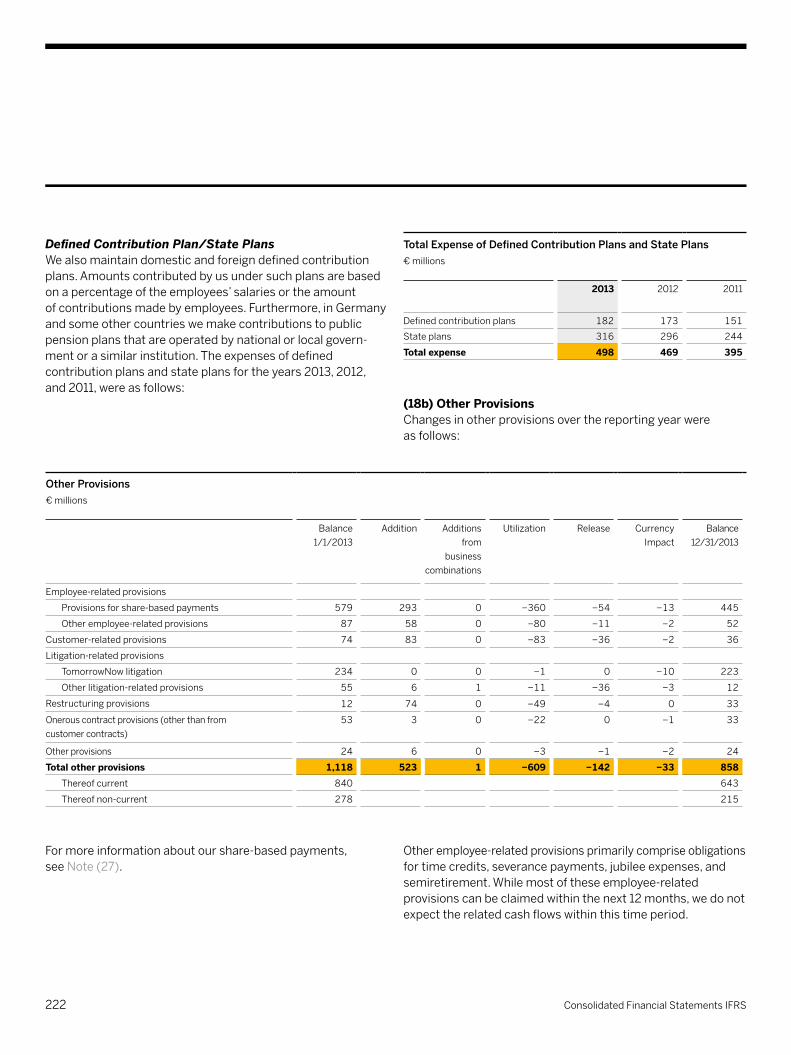
Defined Contribution Plan/State PlansWealsomaintaindomesticandforeigndefinedcontributionplans.Amountscontributedbyusundersuchplansarebasedonapercentageoftheemployees’salariesortheamount ofcontributionsmadebyemployees.Furthermore,inGermanyandsomeothercountrieswemakecontributionstopublicpensionplansthatareoperatedbynationalorlocalgovern- mentorasimilarinstitution.Theexpensesofdefinedcontributionplansandstateplansfortheyears2013,2012,and2011,wereasfollows:
Total Expense of Defined Contribution Plans and State Plans€ millions
2013 2012 2011
Defined contribution plans 182 173 151
State plans 316 296 244
Total expense 498 469 395
(18b) Other provisionsChangesinotherprovisionsoverthereportingyearwere asfollows:
Other Provisions€ millions
Balance 1/1/2013
Addition Additions from
business combinations
Utilization Release Currency Impact
Balance 12/31/2013
Employee-relatedprovisions
Provisionsforshare-basedpayments 579 293 0 −360 −54 −13 445
Otheremployee-relatedprovisions 87 58 0 −80 −11 −2 52
Customer-relatedprovisions 74 83 0 −83 −36 −2 36
Litigation-relatedprovisions
TomorrowNowlitigation 234 0 0 −1 0 −10 223
Otherlitigation-relatedprovisions 55 6 1 −11 −36 −3 12
Restructuringprovisions 12 74 0 −49 −4 0 33
Onerouscontractprovisions(otherthanfrom customercontracts)
53 3 0 −22 0 −1 33
Otherprovisions 24 6 0 −3 −1 −2 24
Total other provisions 1,118 523 1 −609 −142 −33 858Thereofcurrent 840 643
Thereofnon-current 278 215
Formoreinformationaboutourshare-basedpayments, see Note(27).
Otheremployee-relatedprovisionsprimarilycompriseobligations fortimecredits,severancepayments,jubileeexpenses,andsemiretirement.Whilemostoftheseemployee-relatedprovisionscanbeclaimedwithinthenext12months,wedonotexpecttherelatedcashflowswithinthistimeperiod.
222 Consolidated Financial Statements IFRS

Customer-relatedprovisionsincludeperformanceobligations,aswellasexpectedcontractlossesfromcontractswithcustomers.Theassociatedcashoutflowsaresubstantiallyshort-terminnature.
Litigation-relatedprovisionsrelateprimarilytothelitigationmatters described in Note(23).Theyincludetheexpensesrelatedtotheprovisionestablishedfortherelatedlitigationaswellasanyrelatedlegalfeesincurredtodateandexpectedtobeincurredinthefuture.Wehaveestablishedprovisionstakingintoaccountthefactsofeachcase.Thetimingofthecashoutflowsassociatedwithlegalclaimscannotbereasonablydeterminedinallcases.Formoreinformation,seeNote(3c).
Restructuringprovisionscomprisevariousrestructuringactivitiesthatoccurredin2013and2012.
During2012and2013,weimplementedorganizationalchangesinsalesandgo-to-marketinEMEAandNorthAmerica.WemadeotherchangestointegrateSybaseemployeesintoourglobalfinanceandadministrationorganizationandtointegratethebusinessactivitiesofCrossgate.Inlinewithournew cloudintegrationstrategy,wesetupaplantocoverallcloud-businessrelatedorganizationalchanges.Thecashoutflows fortheserestructuringprogramsaretypicallyshort-terminnature.
Non-customercontract-relatedonerouscontractprovisionshavebeenrecordedinconnectionwithunusedleasespaceandunfavorableacquiredfacilityleaseterms.Theutilizationofonerousleasesdependsonthetermsoftheunderlyingleasecontract.
Otherprovisionscomprisewarrantyobligationsanddecom- missioning,restoration,andsimilarliabilitiesassociatedwithleasedfacilities.Therelatedoutflowforwarrantyobligationsisshort-terminnature.Theassociatedcashoutflowsfordecommissioning,restoration,andsimilarliabilities,whicharetypicallylong-terminnature,aregenerallyexpectedtooccur atthedatesweexitthefacilitiestowhichtheyrelate.
(19) DEFErrED InCOmEDeferredincomeconsistsmainlyofprepaymentsmadeby our customers for support services, cloud subscriptions, and professionalservices;feesfrommultipleelementarrange- mentsallocatedtoundeliveredelements;andamountsrecordedinpurchaseaccountingatfairvalueforobligationstoperformunderacquiredsupportcontractsinconnection withacquisitions.
On December 31, 2013, current deferred income included a totalof€443millionindeferredrevenue(December31,2012:€317million),whichinfuturewillberecognizedasrevenuefrom cloud subscriptions and support. (20) tOtAl EquIty
Issued CapitalAsatDecember31,2013,SAPAGhadissued1,228,504,232no-parvaluebearershares(December31,2012:1,228,504,232)withacalculatednominalvalueof€1pershare.Allthesharesissuedarefullypaid.
223Notes to the Consolidated Financial Statements
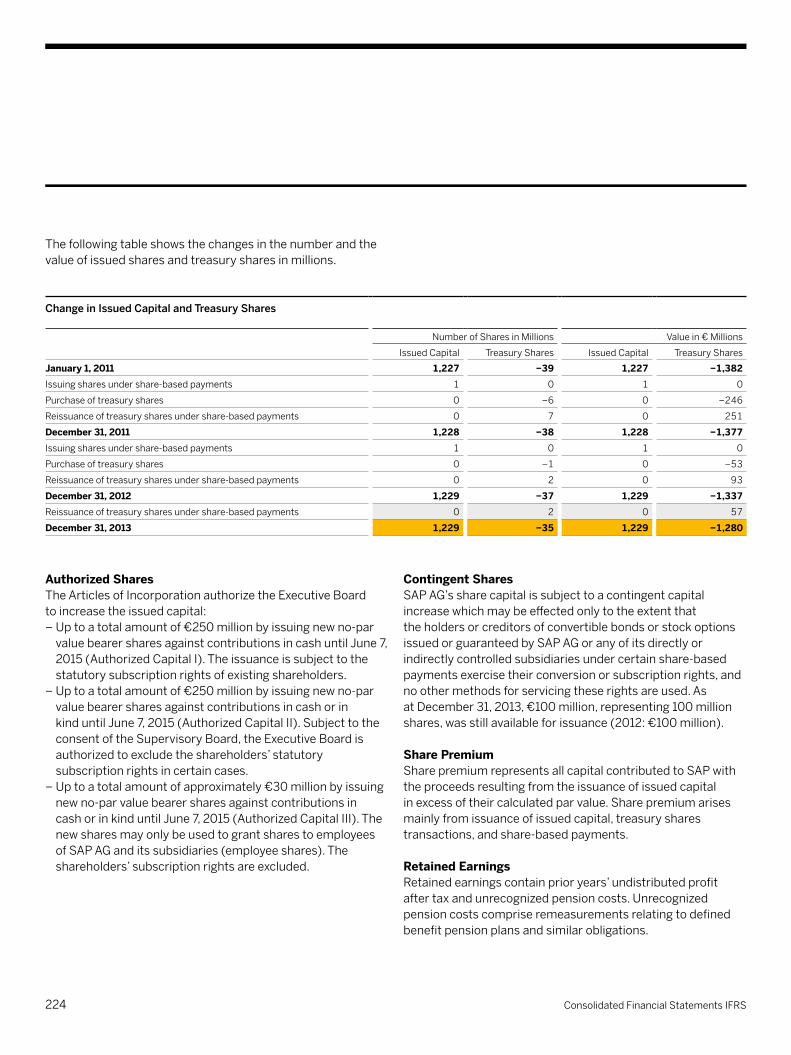
Thefollowingtableshowsthechangesinthenumberandthevalueofissuedsharesandtreasurysharesinmillions.
Change in Issued Capital and Treasury Shares
NumberofSharesinMillions Valuein€Millions
IssuedCapital TreasuryShares IssuedCapital TreasuryShares
January 1, 2011 1,227 −39 1,227 −1,382Issuingsharesundershare-basedpayments 1 0 1 0
Purchaseoftreasuryshares 0 −6 0 −246
Reissuanceoftreasurysharesundershare-basedpayments 0 7 0 251
December 31, 2011 1,228 −38 1,228 −1,377Issuingsharesundershare-basedpayments 1 0 1 0
Purchaseoftreasuryshares 0 −1 0 −53
Reissuanceoftreasurysharesundershare-basedpayments 0 2 0 93
December 31, 2012 1,229 −37 1,229 −1,337Reissuanceoftreasurysharesundershare-basedpayments 0 2 0 57
December 31, 2013 1,229 −35 1,229 −1,280
Authorized SharesTheArticlesofIncorporationauthorizetheExecutiveBoard toincreasetheissuedcapital:–Uptoatotalamountof€250millionbyissuingnewno-parvaluebearersharesagainstcontributionsincashuntilJune7,2015(AuthorizedCapitalI).Theissuanceissubjecttothestatutorysubscriptionrightsofexistingshareholders.
–Uptoatotalamountof€250millionbyissuingnewno-parvaluebearersharesagainstcontributionsincashorin kinduntilJune7,2015(AuthorizedCapitalII).SubjecttotheconsentoftheSupervisoryBoard,theExecutiveBoardisauthorizedtoexcludetheshareholders’statutorysubscriptionrightsincertaincases.
–Uptoatotalamountofapproximately€30millionbyissuingnewno-parvaluebearersharesagainstcontributionsin cashorinkinduntilJune7,2015(AuthorizedCapitalIII).ThenewsharesmayonlybeusedtograntsharestoemployeesofSAPAGanditssubsidiaries(employeeshares).Theshareholders’subscriptionrightsareexcluded.
Contingent SharesSAPAG’ssharecapitalissubjecttoacontingentcapitalincreasewhichmaybeeffectedonlytotheextentthat theholdersorcreditorsofconvertiblebondsorstockoptionsissuedorguaranteedbySAPAGoranyofitsdirectlyorindirectlycontrolledsubsidiariesundercertainshare-basedpaymentsexercisetheirconversionorsubscriptionrights,andnoothermethodsforservicingtheserightsareused.As at December 31, 2013, €100 million, representing 100 million shares,wasstillavailableforissuance(2012:€100million).
Share PremiumSharepremiumrepresentsallcapitalcontributedtoSAPwiththeproceedsresultingfromtheissuanceofissuedcapital inexcessoftheircalculatedparvalue.Sharepremiumarisesmainlyfromissuanceofissuedcapital,treasurysharestransactions,andshare-basedpayments.
Retained EarningsRetainedearningscontainprioryears’undistributedprofit aftertaxandunrecognizedpensioncosts.Unrecognizedpensioncostscompriseremeasurementsrelatingtodefinedbenefitpensionplansandsimilarobligations.
224 Consolidated Financial Statements IFRS
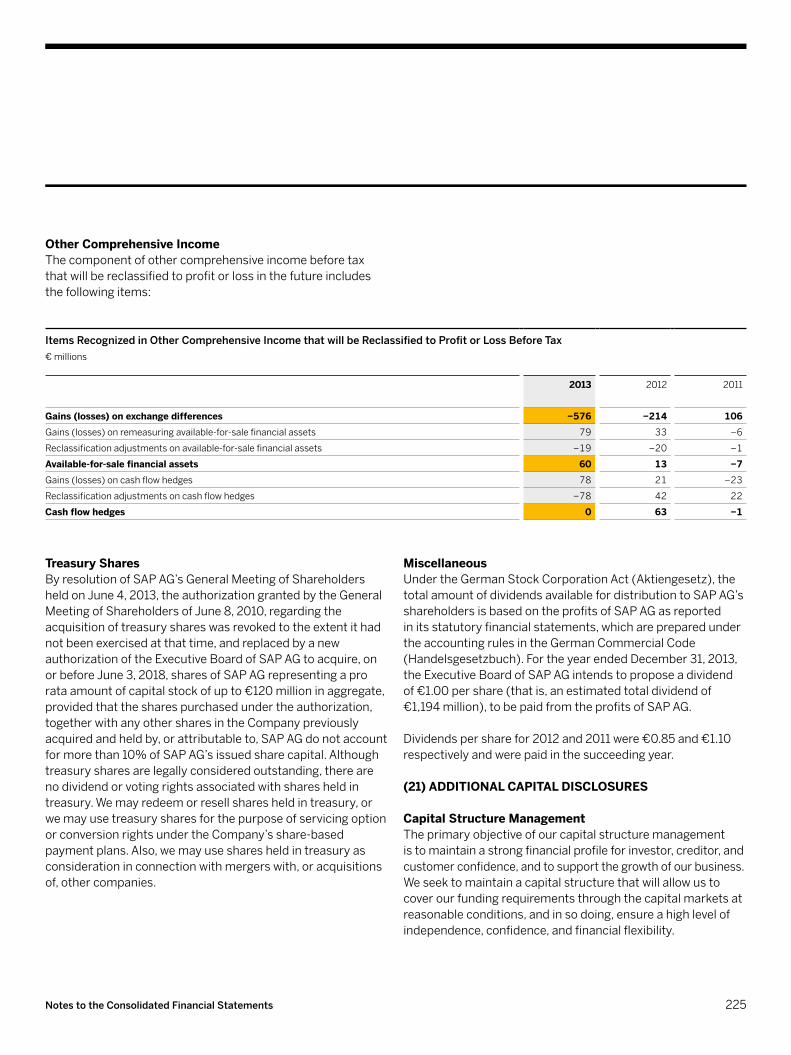
Other Comprehensive IncomeThecomponentofothercomprehensiveincomebeforetaxthatwillbereclassifiedtoprofitorlossinthefutureincludesthefollowingitems:
Items Recognized in Other Comprehensive Income that will be Reclassified to Profit or Loss Before Tax€ millions
2013 2012 2011
Gains (losses) on exchange differences −576 −214 106Gains(losses)onremeasuringavailable-for-salefinancialassets 79 33 −6
Reclassificationadjustmentsonavailable-for-salefinancialassets −19 −20 −1
Available-for-sale financial assets 60 13 −7Gains(losses)oncashflowhedges 78 21 −23
Reclassificationadjustmentsoncashflowhedges −78 42 22
Cash flow hedges 0 63 −1
Treasury Shares ByresolutionofSAPAG’sGeneralMeetingofShareholdersheldonJune4,2013,theauthorizationgrantedbytheGeneralMeetingofShareholdersofJune8,2010,regardingtheacquisitionoftreasuryshareswasrevokedtotheextentithadnotbeenexercisedatthattime,andreplacedbyanewauthorizationoftheExecutiveBoardofSAPAGtoacquire,onorbeforeJune3,2018,sharesofSAPAGrepresentingaprorata amount of capital stock of up to €120 million in aggregate, providedthatthesharespurchasedundertheauthorization,togetherwithanyothersharesintheCompanypreviouslyacquiredandheldby,orattributableto,SAPAGdonotaccountformorethan10%ofSAPAG’sissuedsharecapital.Althoughtreasurysharesarelegallyconsideredoutstanding,therearenodividendorvotingrightsassociatedwithsharesheldintreasury.Wemayredeemorresellsharesheldintreasury,orwemayusetreasurysharesforthepurposeofservicingoptionorconversionrightsundertheCompany’sshare-basedpaymentplans.Also,wemayusesharesheldintreasuryasconsiderationinconnectionwithmergerswith,oracquisitionsof,othercompanies.
MiscellaneousUndertheGermanStockCorporationAct(Aktiengesetz),thetotal amount of dividends available for distribution to SAP AG’s shareholdersisbasedontheprofitsofSAPAGasreported initsstatutoryfinancialstatements,whicharepreparedundertheaccountingrulesintheGermanCommercialCode(Handelsgesetzbuch).FortheyearendedDecember31,2013,theExecutiveBoardofSAPAGintendstoproposeadividend of€1.00pershare(thatis,anestimatedtotaldividendof€1,194million),tobepaidfromtheprofitsofSAPAG. Dividendspersharefor2012and2011were€0.85and€1.10respectivelyandwerepaidinthesucceedingyear. (21) ADDItIOnAl CApItAl DISClOSurES
Capital Structure ManagementTheprimaryobjectiveofourcapitalstructuremanagement istomaintainastrongfinancialprofileforinvestor,creditor,andcustomerconfidence,andtosupportthegrowthofourbusiness. Weseektomaintainacapitalstructurethatwillallowustocoverourfundingrequirementsthroughthecapitalmarketsatreasonableconditions,andinsodoing,ensureahighlevelofindependence,confidence,andfinancialflexibility.
225Notes to the Consolidated Financial Statements

Basedonourstrongcorporatefinancialprofileandourexcellent capitalmarketreputation,wehavesofarsuccessfullyexecutedexternalfinancingtransactionswithoutanexternalrating.However,wewillcontinuetocloselymonitorourfinancingsitu- ationtodeterminewhethernothavinganexternalratingcontinues to be appropriate.
Capital Structure
2013 2012 Change(in%)
€ millions %ofTotalequity
and liabilities
€ millions %ofTotalequity
and liabilities
Equity 16,048 59 14,133 54 14
Currentliabilities 6,347 23 6,546 25 −3
Non-currentliabilities 4,699 17 5,627 21 −16
Liabilities 11,046 41 12,173 46 −9
Total equity and liabilities 27,094 100 26,306 100 3
Ourfinancingactivitiesimprovedourdebtratio(definedastheratiooftotalliabilitiestototalequityandliabilities,expressed asapercentage)to41%attheendof2013(ascomparedto46%attheendof2012).Theratiooftotalfinancialdebttototalequityandliabilitiesdecreasedby3%to16%attheendof2013(19%asatDecember31,2012).Totalfinancialdebtconsistsofcurrentandnon-currentbondsorprivateplacements.Formoreinformationaboutourfinancialdebt, see Note(17).
Lookingaheadtofinancingactivitiesin2014,theCompanyintendstorepaya€500millionEurobondandan€86millionGermanpromissorynotewhentheybothmatureinApril.
Whilewemonitortheseratioscontinuously,ourmainfocus isonthemanagementofournetliquiditypositionasoutlinedinthefollowingtable:
Group Liquidity of SAP Group€ millions
2013 2012 Change
Cashandcashequivalents 2,748 2,477 271
Currentinvestments 93 15 78
Group liquidity 2,841 2,492 349Currentfinancialdebt 586 600 −14
Net liquidity 1 2,255 1,892 363Non-currentfinancialdebt 3,722 4,394 −672
Net liquidity 2 −1,467 −2,502 1,035
226 Consolidated Financial Statements IFRS
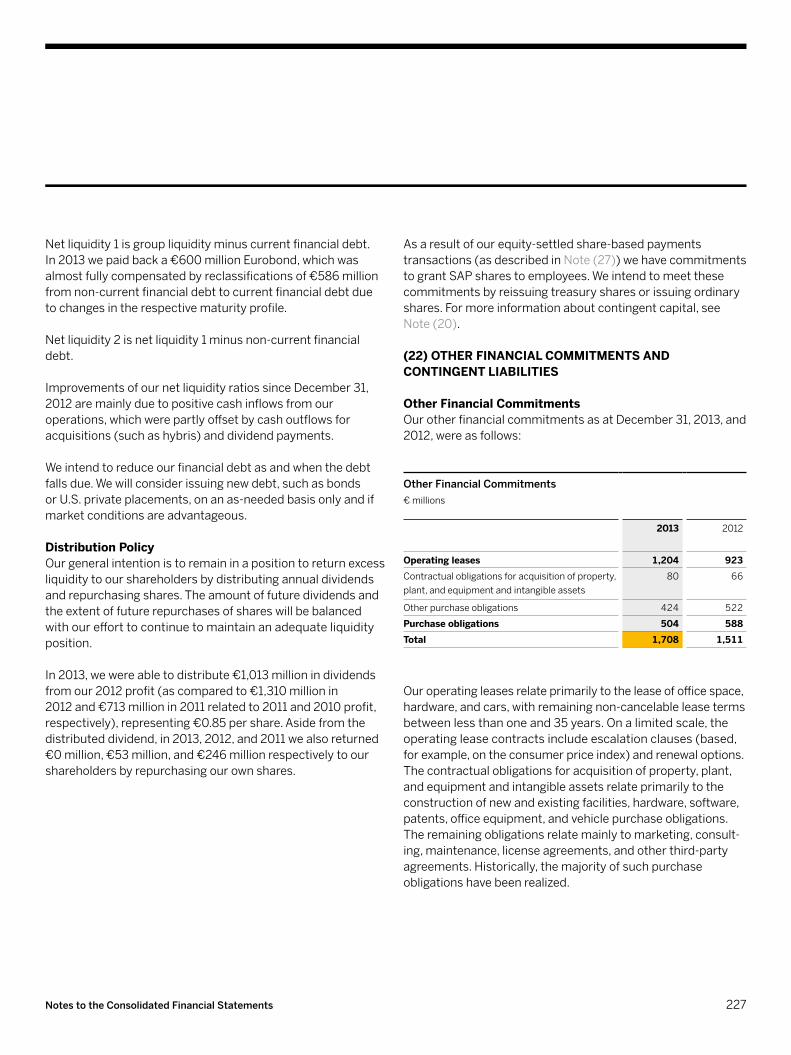
Netliquidity1isgroupliquidityminuscurrentfinancialdebt. In2013wepaidbacka€600millionEurobond,whichwasalmostfullycompensatedbyreclassificationsof€586millionfromnon-currentfinancialdebttocurrentfinancialdebtdue tochangesintherespectivematurityprofile.
Netliquidity2isnetliquidity1minusnon-currentfinancialdebt.
ImprovementsofournetliquidityratiossinceDecember31,2012aremainlyduetopositivecashinflowsfromouroperations,whichwerepartlyoffsetbycashoutflowsforacquisitions(suchashybris)anddividendpayments.
Weintendtoreduceourfinancialdebtasandwhenthedebtfallsdue.Wewillconsiderissuingnewdebt,suchasbonds orU.S.privateplacements,onanas-neededbasisonlyandifmarket conditions are advantageous.
Distribution PolicyOurgeneralintentionistoremaininapositiontoreturnexcessliquiditytoourshareholdersbydistributingannualdividendsandrepurchasingshares.Theamountoffuturedividendsandtheextentoffuturerepurchasesofshareswillbebalanced withourefforttocontinuetomaintainanadequateliquidityposition.
In2013,wewereabletodistribute€1,013millionindividendsfromour2012profit(ascomparedto€1,310millionin 2012and€713millionin2011relatedto2011and2010profit,respectively),representing€0.85pershare.Asidefromthedistributed dividend, in 2013, 2012, and 2011 we also returned €0million,€53million,and€246millionrespectivelytoourshareholdersbyrepurchasingourownshares.
Asaresultofourequity-settledshare-basedpaymentstransactions (as described in Note(27))wehavecommitmentstograntSAPsharestoemployees.Weintendtomeetthesecommitmentsbyreissuingtreasurysharesorissuingordinaryshares.Formoreinformationaboutcontingentcapital,seeNote(20). (22) OthEr FInAnCIAl COmmItmEntS AnD COntInGEnt lIAbIlItIES
Other Financial CommitmentsOurotherfinancialcommitmentsasatDecember31,2013,and2012,wereasfollows:
Other Financial Commitments€ millions
2013 2012
Operating leases 1,204 923Contractualobligationsforacquisitionofproperty,plant,andequipmentandintangibleassets
80 66
Otherpurchaseobligations 424 522
Purchase obligations 504 588Total 1,708 1,511
Ouroperatingleasesrelateprimarilytotheleaseofofficespace, hardware,andcars,withremainingnon-cancelableleasetermsbetweenlessthanoneand35years.Onalimitedscale,theoperating lease contracts include escalation clauses (based, forexample,ontheconsumerpriceindex)andrenewaloptions.Thecontractualobligationsforacquisitionofproperty,plant,andequipmentandintangibleassetsrelateprimarilytotheconstructionofnewandexistingfacilities,hardware,software,patents,officeequipment,andvehiclepurchaseobligations.Theremainingobligationsrelatemainlytomarketing,consult- ing,maintenance,licenseagreements,andotherthird-partyagreements.Historically,themajorityofsuchpurchaseobligationshavebeenrealized.
227Notes to the Consolidated Financial Statements
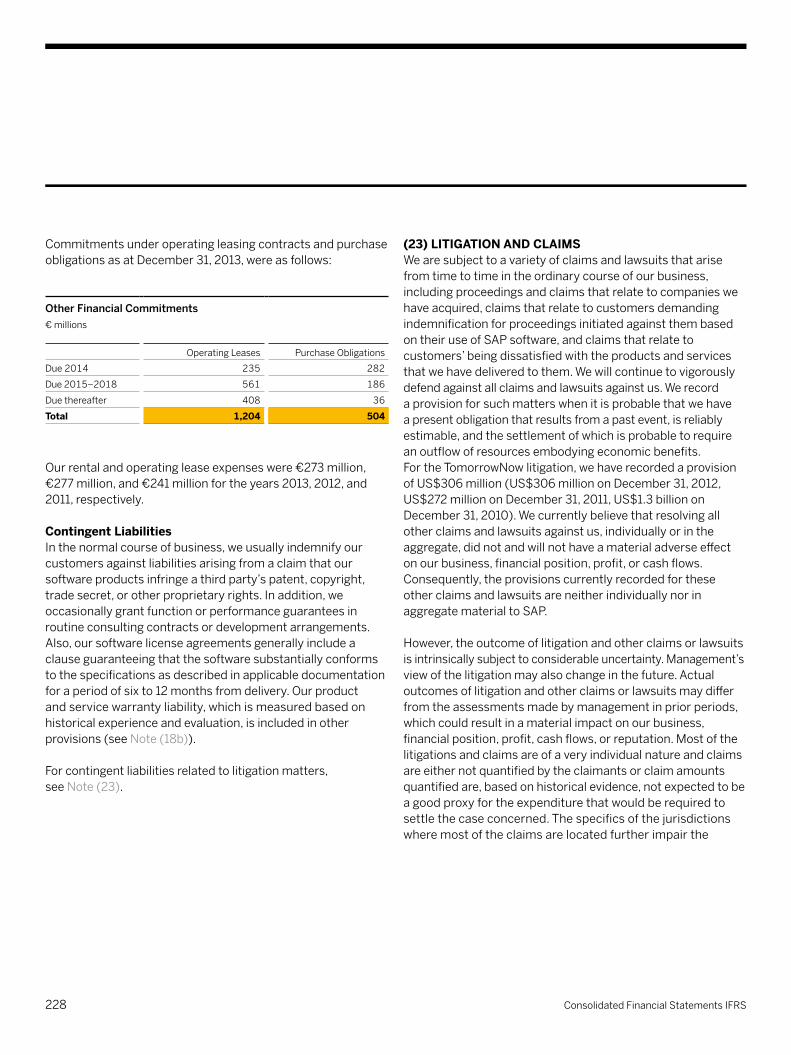
CommitmentsunderoperatingleasingcontractsandpurchaseobligationsasatDecember31,2013,wereasfollows:
Other Financial Commitments€ millions
Operating Leases PurchaseObligations
Due2014 235 282
Due2015–2018 561 186
Duethereafter 408 36
Total 1,204 504
Ourrentalandoperatingleaseexpenseswere€273million,€277million,and€241millionfortheyears2013,2012,and2011,respectively.
Contingent liabilitiesInthenormalcourseofbusiness,weusuallyindemnifyourcustomersagainstliabilitiesarisingfromaclaimthatoursoftwareproductsinfringeathirdparty’spatent,copyright,tradesecret,orotherproprietaryrights.Inaddition,weoccasionallygrantfunctionorperformanceguaranteesinroutine consulting contracts or development arrangements. Also,oursoftwarelicenseagreementsgenerallyincludeaclauseguaranteeingthatthesoftwaresubstantiallyconformstothespecificationsasdescribedinapplicabledocumentationforaperiodofsixto12monthsfromdelivery.Ourproduct andservicewarrantyliability,whichismeasuredbasedonhistoricalexperienceandevaluation,isincludedinotherprovisions (see Note(18b)).
Forcontingentliabilitiesrelatedtolitigationmatters, see Note(23).
(23) lItIGAtIOn AnD ClAImSWearesubjecttoavarietyofclaimsandlawsuitsthatarisefromtimetotimeintheordinarycourseofourbusiness,includingproceedingsandclaimsthatrelatetocompanieswehaveacquired,claimsthatrelatetocustomersdemandingindemnificationforproceedingsinitiatedagainstthembasedontheiruseofSAPsoftware,andclaimsthatrelatetocustomers’beingdissatisfiedwiththeproductsandservicesthatwehavedeliveredtothem.Wewillcontinuetovigorouslydefend against all claims and lawsuits against us. We record aprovisionforsuchmatterswhenitisprobablethatwehave apresentobligationthatresultsfromapastevent,isreliablyestimable,andthesettlementofwhichisprobabletorequireanoutflowofresourcesembodyingeconomicbenefits. FortheTomorrowNowlitigation,wehaverecordedaprovisionofUS$306million(US$306milliononDecember31,2012,US$272milliononDecember31,2011,US$1.3billiononDecember31,2010).Wecurrentlybelievethatresolvingallotherclaimsandlawsuitsagainstus,individuallyorintheaggregate,didnotandwillnothaveamaterialadverseeffectonourbusiness,financialposition,profit,orcashflows.Consequently,theprovisionscurrentlyrecordedfortheseotherclaimsandlawsuitsareneitherindividuallynorinaggregate material to SAP.
However,theoutcomeoflitigationandotherclaimsorlawsuitsisintrinsicallysubjecttoconsiderableuncertainty.Management’s viewofthelitigationmayalsochangeinthefuture.Actualoutcomesoflitigationandotherclaimsorlawsuitsmaydifferfromtheassessmentsmadebymanagementinpriorperiods,whichcouldresultinamaterialimpactonourbusiness,financialposition,profit,cashflows,orreputation.Mostofthelitigationsandclaimsareofaveryindividualnatureandclaimsareeithernotquantifiedbytheclaimantsorclaimamountsquantifiedare,basedonhistoricalevidence,notexpectedtobeagoodproxyfortheexpenditurethatwouldberequiredtosettlethecaseconcerned.Thespecificsofthejurisdictionswheremostoftheclaimsarelocatedfurtherimpairthe
228 Consolidated Financial Statements IFRS

Thejurybaseditsverdictonthetheoryofahypotheticallicense,thatis,thevalueofwhatTomorrowNowwouldhavepaidifithadnegotiatedwithOraclealicenseforthecopyrightsinfringedbyTomorrowNow.Beforeandduringthecourseofthetrial,variousdamagesamountshadbeenpresentedbythepartiestothelitigation.Theyincludedthefollowing:a)Beforethetrial,Oraclehadrequesteddamagesinexcess ofUS$3.5billionbasedonalleged“savedacquisitioncosts,”thecourtdismissedthatdamageclaimbasedonapretrialmotion,butOraclehastherighttoappealthatdismissal.
b)Duringthetrial,Oracle’sdamagesexpertspresented anamountofUS$408millionbasedonlostprofitsanddisgorgementofinfringer’sprofit.
c)Duringthetrial,membersofOraclemanagementpresented,aspartoftheirtestimonies,amountsofuptoUS$5billion.Oracle’sdamagesexpertpresentedadamagesestimateof“atleast”US$1.655billionunderahypotheticallicensetheory.Oracle’scounselaskedthejurytoaward“somewherebetweenUS$1.65andUS$3billion.”
d)Duringthetrial,thedamagesexpertforTomorrowNowandSAPpresentedanamountofUS$28millionbasedon lostprofitsandinfringer’sprofitsor,alternatively,US$40.6millionbasedonahypotheticallicensetheory.Counsel forSAPandTomorrowNowaskedthejurytoawardUS$28million.
Webelievedbothbeforeandduringthetrialandcontinuetobelievethatthehypotheticallicensetheoryisnotanappropriate basisforcalculatingthedamages.Instead,webelievethatdamagesshouldbebasedonlostprofitsandinfringer’sprofits.Assuch,SAPfiledpost-trialmotionsaskingthejudgetooverturnthejudgment.Ahearingonthepost-trialmotionswasheldinJuly2011.OnSeptember1,2011,thetrialjudgeissued anorderwhichsetasidethejuryverdictandvacatedthatpartofthejudgmentawardingUS$1.3billionindamages.ThetrialjudgealsogaveOraclethechoiceofacceptingreduceddamagesofUS$272millionorhavinganewtrialbasedonlostprofitsandinfringer'sprofits.Oraclefiledamotionseekinganearlyappealfromtherulingvacatingthejury'sdamagesaward,
predictabilityoftheoutcomeofthecases.Therefore,itisnotpracticabletoreliablyestimatethefinancialeffectthat theselitigationsandclaimswouldhaveifSAPweretoincurexpenditureforthesecases.
Formoreinformationabouttheprovisionsrecorded for litigation, see Note(18b).
Amongtheclaimsandlawsuitsarethefollowing:
Intellectual property litigationInMarch2007,UnitedStates-basedOracleCorporationandcertainofitssubsidiaries(Oracle)institutedlegalproceedingsintheUnitedStatesagainstTomorrowNow,Inc.,itsparentcompanySAPAmerica,Inc.andSAPAmerica’sparentcompany SAPAG(SAP).Oraclefiledseveralamendedcomplaintsbetween 2007and2009.Asamended,thelawsuitallegescopyrightinfringement,violationsoftheFederalComputerFraudandAbuseActandtheCaliforniaComputerDataAccessandFraudAct, unfair competition, intentional and negligent interference withprospectiveeconomicadvantage,andcivilconspiracy.ThelawsuitallegesthatSAPunlawfullycopiedandmisapprop-riatedproprietary,copyrightedsoftwareproductsandotherconfidentialmaterialsdevelopedbyOracletoserviceitsowncustomers.Thelawsuitsoughtinjunctivereliefandmonetarydamages,includingpunitivedamages,allegedbyOracleto beinthebillionsofU.S.dollars.ThetrialwasheldinNovember2010.Priortotrial,SAPAG,SAPAmericaandTomorrowNowstipulatedtoliabilityforcertainclaimsandSAPagreedtopayOracleUS$120millionforattorneys’fees.Afterthetrial,thejuryreturnedadamagesverdictofUS$1.3billion.Thejudgment,whichwasissuedonFebruary3,2011,additionallyprovidedforprejudgmentinterestofUS$15million.Thejudgmentamountisalsosubjecttopost-judgmentinterest,whichaccruesfromthetimejudgmentisentered.
229Notes to the Consolidated Financial Statements
whichwasdeniedbythejudge.Consequently,Oracleelectedtoproceedwithanewtrial.Inlieuofanewtrial,thepartiesstipulatedtoajudgmentofUS$306millionwhileeachpreserving allrightsforappeal.Bothpartieshavefiledtheirrespectivenoticeofappeal.Onappeal,Oracleisseekingthreeformsofrelief:(1)reinstatementoftheNovember2010US$1.3billionverdict;(2)asafirstalternative,anewtrialatwhichOraclemayagainseekhypotheticallicensedamages(basedinpartonevidenceofallegedsaveddevelopmentcosts)plusSAP'sallegedinfringer'sprofitswithoutanydeductionofexpenses(Oracledoesnotputanumberonitsclaimfortherequestednewtrial);and(3)asasecondalternative,increaseoftheremittitur(alternativetonewtrial)toUS$408.7million(versustheUS$272millionOraclehadpreviouslyrejected).SAPhasdismisseditscross-appeal.ThehearingistentativelyscheduledforMay13,2014,thoughthisissubjecttochange.
Additionally,inJune2007,SAPbecameawarethattheUnitedStatesDepartmentofJustice(U.S.DOJ)hadopenedaninvestigationconcerningrelatedissuesandhadissuedsub- poenastoSAPandTomorrowNow.TheDOJinvestigationhasbeenresolvedbywayofapleaagreementwhichincludesTomorrowNowpleadingguiltyto11countsofviolationsoftheComputerFraudandAbuseAct,onecountofcriminalcopyrightinfringement,thepaymentofaUS$20millionfineandthreeyears’probation.NochargeswerebroughtagainstSAPAGorsubsidiariesthereofotherthanTomorrowNow.
InApril2007,UnitedStates-basedVersataSoftware,Inc.(formerlyTrilogySoftware,Inc.)(Versata)institutedlegalpro- ceedingsintheUnitedStatesDistrictCourtfortheEasternDistrictofTexasagainstSAP.VersataallegedthatSAP’sproductsinfringeoneormoreoftheclaimsineachoffivepatentsheldbyVersata.Initscomplaint,Versatasoughtunspecifiedmonetarydamagesandpermanentinjunctiverelief.ThefirsttrialwasheldinAugust2009.ThejuryreturnedaverdictinfavorofVersataandawardedVersataUS$138.6millionforpastdamages.InJanuary2011,thecourtvacatedthejury’sdamagesawardandorderedanewtrialondamages.
TheretrialwasheldinMay2011.Thejuryreturnedaverdict infavorofVersataandawardedVersataUS$345millionforpastdamages.InSeptember2011,thejudgedeniedSAP’spost-trialmotionswiththeexceptionofreducingthedamagesverdictbyUS$16milliontoapproximatelyUS$329million.ThejudgealsoorderedapproximatelyUS$60millioninpre-judgment interest.Additionally,thejudgegrantedVersata’srequestfor abroadinjunctionwhichprohibitsSAPfrom1)sellingproductsintheUnitedStateswiththeinfringingfunctionality,2)pro- viding maintenance to or accepting maintenance revenue from existingcustomersintheUnitedStatesuntilsuchcustomersdisabletheinfringingfunctionalityandverifysuchdisablement,and3)licensingadditionaluserstoexistingcustomersintheUnitedStatesuntilsuchcustomersdisabletheinfringingfunctionalityandverifysuchdisablement.Finally,thejudgestayedtheinjunctionpendingtheoutcomeofanappeal.
BothpartiesappealedtotheU.S.CourtofAppealsfortheFederalCircuit.TheappealhearingoccurredinFebruary2013andadecisionwasissuedonMay1,2013.Thethree-judgepanelruledinVersata’sfavoroninfringementanddamages,leavingbothfullyintact.ThepastdamagesverdictcurrentlystandsatapproximatelyUS$390million.Regardingtheinjunction,thecourtruledthattheinjunctionwastoobroad,statingthatSAPshouldbeabletoprovidemaintenanceoradditionalseatsforpriorcustomersoftheinfringingproducts,solongasthemaintenanceortheadditionalseatdoes notinvolve,orallowaccessto,the“enjoinedcapability”whereenjoinedcapabilityisdefinedasthecapabilitytoexecuteapricingprocedureusinghierarchicalaccessofcustomerandproductdata.SAPfiledapetitionseekingrehearingbythethree-judgepanelthatissuedthisdecisionand/orbytheentireappealscourt.TheappealscourtrequestedthatVersatarespondtoSAP’spetitionnolaterthanJuly29,2013.InAugust2013,theappealscourtdeniedSAP’srequestforrehearingandissueditsmandatepassingjurisdictiontothedistrictcourt.
230 Consolidated Financial Statements IFRS

Separately,SAPfiledapetitionwiththeUnitedStatesPatentandTrademarkOffice(USPTO)challengingthevalidityof theassertedVersatapatent.InJanuary2013,theUSPTOgranted SAP’srequesttoreconsiderthevalidityofVersata’spatent andinstitutedtherelevantprocedure(transitionalpostgrantreview).AdecisionwasissuedinJune2013renderingallchallengedpatentclaims(includingallthepatentclaimsSAPwasfoundtohaveinfringed)unpatentable.Versatafiled withtheUSPTOarequestseekingreconsiderationofthedecisiononsixdifferentgrounds.TheUSPTOinvitedSAPtofileanoppositionrespondingtotwoofthesixgrounds.OnSeptember13,2013,theUSPTOdeniedVersata’srequestforreconsideration.
InJune2013,followingthedeterminationofunpatentability,SAPfiledarequestwiththeappealscourttostaythelitigationpendingreviewoftheUSPTOdecision.ThatrequestwasdeniedinearlyJuly2013.
InDecember2013,SAPfiledwiththeUnitedStatesSupremeCourtapetitionforawritofcertioraritoreviewthedecisions oftheappealscourt.ThatpetitionwasdeniedinJanuary2014.Immediatelythereafter,VersatarequestedthattheDistrictCourtdismissitsremainingclaimsforinjunctiveandequitablerelief.TheDistrictCourtgrantedthatrequestanddeemed thepreviouslyenteredjudgmentfinal.Onthatsameday,SAPrequestedthattheDistrictCourtvacatethejudgmentorstaythelitigation,basedontheUSPTOdecisiondeclaringVersata’spatentclaimsunpatentable.Thatrequestispending.
InAugust2007,UnitedStates-basedelcommerce.com,Inc.(elcommerce)institutedlegalproceedingsintheUnitedStatesagainstSAP.elcommerceallegedthatSAP’sproductsinfringeoneormoreoftheclaimsinonepatentheldbyelcommerce.Initscomplaint,elcommercesoughtunspecifiedmonetarydamagesandpermanentinjunctiverelief.ThecourtinEastTexasgrantedSAP’srequesttotransferthelitigationfromEastTexastoPennsylvania.SubsequenttotheMarkmanruling bythecourt,thepartiesagreedtotheentryoffinaljudgmentregardingnon-infringementbySAP.elcommercehasappealedthecourt’sMarkmanruling.Thehearingfortheappealwas
heldinMay2012,andweareawaitingthecourt’sdecision.SAPalsofiledareexaminationrequestwiththeUSPTOtoinvalidateelcommerce’spatent.OnSeptember23,2013,theUSPTOissuedadecisioninvalidatingthepatent.elcommercehassoughtrehearingfromtheUSPTO.
InFebruary2010,UnitedStates-basedTecSec,Inc.(TecSec)institutedlegalproceedingsintheUnitedStatesagainstSAP,Sybase,IBM,andmanyotherdefendants.TecSecalleged thatSAP’sproductsinfringeoneormoreoftheclaimsinfivepatentsheldbyTecSec.Initscomplaint,TecSecseeksunspeci- fiedmonetarydamagesandpermanentinjunctiverelief.Thetrialhasnotyetbeenscheduled.ThelegalproceedingshavebeenstayedagainstalldefendantspendingtheoutcomeofanappealbyTecSec.TheappealhearingoccurredinMarch2013.TheappellatecourtissueditsdecisioninOctober2013.Thatdecisiondidnotendthelitigationandthereforeweexpectthelawsuittoresumeatthedistrictcourtinthecomingmonths.
InApril2010,SAPinstitutedlegalproceedings(aDeclaratoryJudgmentaction)intheUnitedStatesagainstWellogix,Inc.andWellogixTechnologyLicensing,LLC(Wellogix).ThelawsuitseeksadeclaratoryjudgmentthatfivepatentsownedbyWellogixareinvalidand/ornotinfringedbySAP.Thetrialhasnotyetbeenscheduled.ThelegalproceedingshavebeenstayedpendingtheoutcomeofsixreexaminationsfiledwiththeUSPTO.InSeptember2013,theUSPTOissuedadecisiononfourofthesixreexaminations,invalidatingeveryclaim ofeachofthefourpatents.SAPisawaitingadecisiononthetworemainingreexaminationrequests.
Other litigationInApril2008,SouthAfrican-basedSystemsApplicationsConsultants(PTY)Limited(Securinfo)institutedlegalproceedingsinSouthAfricaagainstSAP.Securinfoallegesthat
231Notes to the Consolidated Financial Statements
SAPhascausedoneofitssubsidiariestobreachasoftwaredistributionagreementwithSecurinfo.Initscomplaint,Securinfoseeksdamagesofapproximately€610millionplusinterest.InSeptember2009,SAPfiledamotiontodismisswhichwasrejected.AtrialdatewhichwasscheduledforJune2011hasbeenpostponed.
InNovember2012,SAPfiledamotiontodismissbasedon aproceduralaspectofthecase.ThecourtfollowedSAP’sargumentanddismissedtheclaimbySecurinfo.SecurinfoappealedagainstthisdecisiononDecember19,2012.
InMarch2013,thecourtdismissedSecurinfo’sappeal.SecurinfoappealedagainstthisdecisiontotheSupreme CourtofSouthAfrica.TheSupremeCourtgrantedleavetoappealtothefullbenchofthecourtwhichhadoriginallydismissedSecurinfo’sappeals.Securinfohasappliedforanappealhearingdate.Thecourthasnotyetprovidedadate.
Wearesubjecttoongoingauditsbydomesticandforeigntaxauthorities.AlongwithmanyothercompaniesoperatinginBrazil,weareinvolvedinvariousproceedingswithBrazilianauthoritiesregardingassessmentsandlitigationmatters onnon-incometaxesonintercompanyroyaltypaymentsandintercompanyservices.Thetotalpotentialamountrelatedtothesemattersforallapplicableyearsisapproximately€76million.Wehavenotrecordedaprovisionforthesematters,aswebelievethatwewillprevailonthesematters.
Formoreinformationaboutincometaxrisk-relatedlitigation,see Note(10).
(24) FInAnCIAl rISk FACtOrSWeareexposedtovariousfinancialrisks,suchasmarket risks(includingforeigncurrencyexchangeraterisk,interestraterisk,andequitypricerisk),creditrisk,andliquidityrisk.
Market Risk
a) Foreign Currency Exchange Rate RiskForeigncurrencyexchangerateriskistheriskoflossduetoadversechangesinforeigncurrencyexchangerates.UnderIFRS,foreigncurrencyexchangeraterisksariseonaccountofmonetaryfinancialinstrumentsdenominatedincurrenciesotherthanthefunctionalcurrencywherethenon-functionalcurrencyistherespectiveriskvariable;translationrisksarenottaken into consideration.
Asagloballyactiveenterprise,wearesubjecttorisksassociatedwithfluctuationsinforeigncurrencieswithregardtoourordinaryoperations.SincetheGroup’sentitiesmainlyconducttheiroperatingbusinessintheirownfunctionalcurrencies,ourriskofexchangeratefluctuationsfromongoingordinaryoperationsisnotconsideredsignificant.However,occasionallywegenerateforeigncurrency-denominatedreceivables,payables,andothermonetaryitemsbytransactinginacurrencyotherthanthefunctionalcurrency.Tomitigatetheextentoftheassociatedforeigncurrencyexchangeraterisk,themajorityofthesetransactionsarehedgedasdescribed in Note(25).
Inrarecircumstances,transactinginacurrencyotherthanthefunctionalcurrencyalsoleadstoembeddedforeigncurrencyderivativesbeingseparatedandmeasuredatfairvaluethroughprofitorloss.
Inaddition,theIntellectualProperty(IP)holdersintheSAPGroup areexposedtorisksassociatedwithforecastedintercompanycashflowsinforeigncurrencies.Thesecashflowsarise outofroyaltypaymentsfromsubsidiariestotherespective IPholder.Theroyaltiesarelinkedtothesubsidiaries’externalrevenue.ThisarrangementleadstoaconcentrationoftheforeigncurrencyexchangerateriskwiththeIPholders,astheroyaltiesaremostlydenominatedinthesubsidiaries’localcurrencies,whilethefunctionalcurrencyoftheIPholderswiththehighestroyaltyvolumeistheeuro.Thehighestforeigncurrencyexchangerateexposureofthiskindrelatestothecurrenciesofsubsidiarieswithsignificantoperations,forexampletheU.S.dollar,thepoundsterling,theJapaneseyen,theSwissfranc,andtheAustraliandollar.
232 Consolidated Financial Statements IFRS

Generally,wearenotexposedtoanysignificantforeigncurrencyexchangerateriskwithregardtoourinvestingandfinancingactivities,assuchactivitiesarenormallyconductedinthefunctionalcurrencyoftheinvestingorborrowing entity.However,wewereexposedtoacashflowriskfromtheconsiderationtobepaidinU.S.dollarsfortheacquisitionofhybrisin2013andofSuccessFactorsandAriba,Inc.in2012asthefundswereprovidedthroughourfreecashandacquisitiontermloans,bothmostlygeneratedineuros.Formoreinformation, see Note(25).
b) Interest Rate RiskInterestraterisksresultfromchangesinmarketinterest rates,whichcancausechangesinthefairvaluesoffixedrateinstrumentsandintheinteresttobepaidorreceivedforvariablerateinstruments.WeareexposedtointerestrateriskasaresultofourinvestingandfinancingactivitiesmainlyineurosandU.S.dollars.
AsatDecember31,2013,ourliquiditywasmainlyinvestedintimedepositsandbondswithfixedyields,andmoneymarketinstrumentswithvariableyields,heldascashequivalents andcurrentandnon-currentinvestments.Sincethefixedyieldtimedepositsheldatyear-endhaveshortmaturities,theydonotexposeustoasubstantialfairvalueinterestraterisk.However,afairvalueinterestrateexposurearisesfromthebondsclassifiedasavailableforsale.Also,weareexposedtoacashflowriskfromourcashheldatbanksspreadacross theworldandthevariableyieldmoneymarketfunds,mainlyheldintheUnitedStates.
AsatDecember31,2013,wewereexposedtoaninterestrateriskfromourfinancingactivities(formoreinformation abouttheindividualinstruments,seeNote(17b))asallourissuedbonds,theU.S.privateplacementnotes,andtheremainingtrancheoftheGermanpromissorynotespayfixedinterest leading to a fair value risk.
c) Equity Price RiskEquitypriceriskistheriskoflossduetoadversechangesinequitymarkets.Weareexposedtosuchriskwithregardto ourinvestmentsinlistedequitysecurities(2013:€83million;2012:€52million)andourshare-basedpayments(fortheexposurefromtheseplans,seeNote(27)).
Credit RiskCreditriskistheriskofeconomiclossofprincipalorfinancialrewardsstemmingfromacounterparty’sfailuretorepayorservicedebtaccordingtothecontractualobligations. Toreducethecreditriskininvestments,wearrangedtoreceiverightstocollateralforcertaininvestingactivitiesinthefullamountoftheinvestmentvolume,whichwewouldbeallowedtomakeuseofonlyinthecaseofdefaultofthecounterparty totheinvestment.
Withtheexceptionofthesetransactions,wehavenotexecutedsignificantagreementstoreduceouroverallcreditriskexposure,suchasmasternettingarrangements.Therefore,thetotalamountsrecognizedascashandcashequivalents,currentinvestments,loansandotherfinancialreceivables,andderivativefinancialassetsrepresentourmaximumexposure tocreditrisks,exceptfortheagreementsmentionedabove.
liquidity riskLiquidityriskresultsfromthepotentialinabilitytomeetfinancialobligations,suchaspaymentstosuppliersoremployees.AmaturityanalysisthatprovidestheremainingcontractualmaturitiesofallourfinancialliabilitiesheldatDecember31,2013,isshowninthetablebelow.Financialliabilitiesshowninthetablebelowforwhichrepaymentcanberequestedbythecontractpartneratanytimeareassigned totheearliestpossibleperiod.VariableinterestpaymentswerecalculatedusingthelastrelevantinterestratefixedasatDecember 31, 2013. As we settle our derivative contracts gross, weshowthepayandreceivelegsseparatelyforallour
233Notes to the Consolidated Financial Statements

currencyandinterestratederivatives,whetherornotthefairvalueofthederivativeisnegative.Thecashoutflowsfor thecurrencyderivativesaretranslatedusingtheapplicableforward rate.
ThecashflowsforunrecognizedbutcontractuallyagreedfinancialcommitmentsareshowninNote(22).
Contractual Maturities of Financial Liabilities and Financial Assets€ millions
CarryingAmount
ContractualCashFlows
12/31/2013 2014 2015 2016 2017 2018 Thereafter
Non-derivative financial liabilitiesTradepayables −640 −640 0 0 0 0 0
Financialliabilities −4,336 −731 −863 −513 −891 −153 −1,730
Total of non-derivative financial liabilities −4,976 −1,371 −863 −513 −891 −153 −1,730
Derivative financial liabilities and assetsDerivative financial liabilities
Currencyderivativeswithoutdesignatedhedgerelationship −144
Cashoutflows −1,975 −9 −9 −8 −8 −15
Cashinflows 1,885 0 0 0 0 0
Currencyderivativeswithdesignatedhedgerelationship −3
Cashoutflows −178 0 0 0 0 0
Cashinflows 174 0 0 0 0 0
Interestratederivativeswithdesignatedhedgerelationship −23
Cashoutflows −12 −17 −27 −39 −37 −192
Cashinflows 30 35 35 35 28 123
Total of derivative financial liabilities −170 −76 9 −1 −12 −17 −84Derivative financial assets
Currencyderivativeswithoutdesignatedhedgerelationship 26
Cashoutflows −2,544 0 0 0 0 0
Cashinflows 2,569 0 0 0 0 0
Currencyderivativeswithdesignatedhedgerelationship 30
Cashoutflows −391 0 0 0 0 0
Cashinflows 419 0 0 0 0 0
Interestratederivativeswithdesignatedhedgerelationship 5
Cashoutflows −12 −25 −29 −36 −21 −24
Cashinflows 19 33 33 33 16 16
Total of derivative financial assets 61 60 8 4 −3 −5 −8Total of derivative financial liabilities and assets −109 −16 17 3 −15 −22 −92
234 Consolidated Financial Statements IFRS
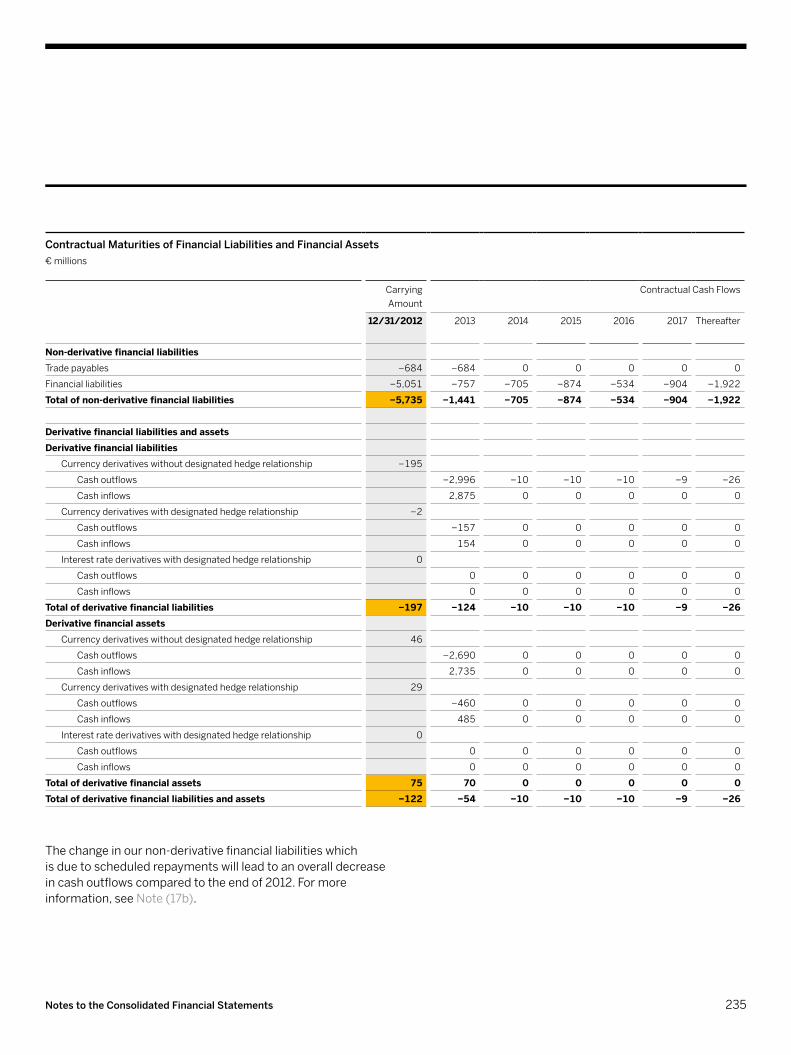
Contractual Maturities of Financial Liabilities and Financial Assets€ millions
CarryingAmount
ContractualCashFlows
12/31/2012 2013 2014 2015 2016 2017 Thereafter
Non-derivative financial liabilitiesTradepayables −684 −684 0 0 0 0 0
Financialliabilities −5,051 −757 −705 −874 −534 −904 −1,922
Total of non-derivative financial liabilities −5,735 −1,441 −705 −874 −534 −904 −1,922
Derivative financial liabilities and assetsDerivative financial liabilities
Currencyderivativeswithoutdesignatedhedgerelationship −195
Cashoutflows −2,996 −10 −10 −10 −9 −26
Cashinflows 2,875 0 0 0 0 0
Currencyderivativeswithdesignatedhedgerelationship −2
Cashoutflows −157 0 0 0 0 0
Cashinflows 154 0 0 0 0 0
Interestratederivativeswithdesignatedhedgerelationship 0
Cashoutflows 0 0 0 0 0 0
Cashinflows 0 0 0 0 0 0
Total of derivative financial liabilities −197 −124 −10 −10 −10 −9 −26Derivative financial assets
Currencyderivativeswithoutdesignatedhedgerelationship 46
Cashoutflows −2,690 0 0 0 0 0
Cashinflows 2,735 0 0 0 0 0
Currencyderivativeswithdesignatedhedgerelationship 29
Cashoutflows −460 0 0 0 0 0
Cashinflows 485 0 0 0 0 0
Interestratederivativeswithdesignatedhedgerelationship 0
Cashoutflows 0 0 0 0 0 0
Cashinflows 0 0 0 0 0 0
Total of derivative financial assets 75 70 0 0 0 0 0Total of derivative financial liabilities and assets −122 −54 −10 −10 −10 −9 −26
Thechangeinournon-derivativefinancialliabilitieswhich isduetoscheduledrepaymentswillleadtoanoveralldecreaseincashoutflowscomparedtotheendof2012.Formoreinformation, see Note(17b).
235Notes to the Consolidated Financial Statements
(25) FInAnCIAl rISk mAnAGEmEntWemanagemarketrisks(includingforeigncurrencyexchangeraterisk,interestraterisk,andequitypricerisk),creditrisk,andliquidityriskonaGroup-widebasisthroughourglobaltreasurydepartment.Ourriskmanagementandhedgingstrategy issetbyourtreasuryguidelineandotherinternalguidelines,andissubjecttocontinuousinternalriskanalysis.Derivativefinancialinstrumentsareonlypurchasedtoreducerisksand notforspeculation,whichisdefinedasenteringintoderivativeinstrumentswithoutacorrespondingunderlyingtransaction.
Inthefollowingsectionsweprovidedetailsonthemanagementofeachrespectivefinancialriskandourrelatedriskexposure.Inthesensitivityanalysesthatshowtheeffectsofhypotheticalchangesofrelevantriskvariablesonprofitorothercomprehen- siveincome,wedeterminetheperiodiceffectsbyrelating thehypotheticalchangesintheriskvariablestothebalanceoffinancialinstrumentsatthereportingdate.
Foreign Currency Exchange Rate Risk ManagementWecontinuallymonitorourexposuretocurrencyfluctuationrisksbasedonmonetaryitemsandforecastedtransactionsandpursueaGroup-widestrategytomanageforeigncurrencyexchangeraterisk,usingderivativefinancialinstruments,primarilyforeignexchangeforwardcontracts,asappropriate,withtheprimaryaimofreducingprofitorlossvolatility.
Currency Hedges Without Designated Hedge RelationshipTheforeignexchangeforwardcontractsweenterintotooffsetexposurerelatingtoforeigncurrencydenominatedmonetaryassetsandliabilitiesarenotdesignatedasbeinginahedgeaccountingrelationship,becausetherealizedcurrencygainsandlossesfromtheunderlyingitemsarerecognizedinprofit orlossinthesameperiodsasthegainsandlossesfromthederivatives.
Currencyhedgeswithoutadesignatedhedgerelationshipalsoincludeforeigncurrencyderivativesembeddedinnon-derivativehostcontractsthatareseparatedandaccountedforasderivativesaccordingtotherequirementsofIAS39.
Inaddition,during2012weheldforeigncurrencyoptions anddeal-contingentforwardcontractstopartiallyhedge thecashflowriskfromtheconsiderationpaidinU.S.dollars fortheacquisitionsofSuccessFactorsandAriba.
Currency Hedges with Designated Hedge Relationship (Cash Flow Hedges)Weenterintoderivativefinancialinstruments,primarilyforeignexchangeforwardcontracts,tohedgesignificantforecastedcashflows(royalties)fromforeignsubsidiariesdenominatedinforeigncurrencieswithadefinedsetofhedgeratiosandahedgehorizonofupto12months.Specifically,weexcludetheinterestcomponentandonlydesignatethespotrateoftheforeignexchangeforwardcontractsasthehedginginstrumenttooffsetanticipatedcashflowsrelatingtothesubsidiaries withsignificantoperations,includingtheUnitedStates,theUnitedKingdom,Japan,Switzerland,andAustralia.Wegenerally useforeignexchangederivativesthathavematuritiesof12monthsorless,whichmayberolledovertoprovidecontinuouscoverageuntiltheapplicableroyaltiesarereceived.
In2013,netgainstotaling€57million(2012:netgainsof €17million;2011:netlossesof€14million)resultingfromthechangeinthecomponentofthederivativesdesignatedashedginginstrumentswererecordedinothercomprehensiveincome.
FortheyearsendedDecember31,2013and2012,nopreviouslyhighlyprobabletransactiondesignatedasahedgeditemin aforeigncurrencycashflowhedgerelationshipceasedtobeprobable.Therefore,wedidnotdiscontinueanyofourcashflowhedgerelationships.Also,weidentifiednoineffectivenessinallyearsreported.In2013,wereclassifiednetgainsof€57million(2012:netlossesof€24million;2011:netlossesof€13million)fromothercomprehensiveincometoprofitorlossduetothehedgeditemsaffectingincome.Generally,thecashflowsofthehedgedforecastedtransactionsareexpectedtooccur
236 Consolidated Financial Statements IFRS
andtoberecognizedinprofitorlossmonthlywithinatimeframeof12monthsfromthedateofthestatementoffinancialposition.Itisestimatedthat€20millionofthenetgainsrecognizedinothercomprehensiveincomein2013,willbereclassifiedfromothercomprehensiveincometoprofitorlossduringfiscalyear2014.
Foreign Currency Exchange Rate ExposureInlinewithourinternalriskreportingprocess,weusethecashflow-at-riskmethodtoquantifyourriskpositionswithregardtoourforecastedintercompanytransactionsandvalue-at-riskforourforeigncurrencydenominatedfinancialinstruments. Inordernottoprovidetwodifferentmethodologies,wehaveoptedtodiscloseourriskexposurebasedonasensitivityanalysisconsideringthefollowing:–SincetheSAPGroup’sentitiesgenerallyoperateintheirfunctionalcurrencies,themajorityofournon-derivativemonetary financialinstruments,suchascashandcashequivalents,tradereceivables,tradepayables,loanstoemployeesandthirdparties,bankliabilities,andotherfinancialliabilities,aredenominatedintherespectiveentities’functionalcurrency.Thus,aforeigncurrencyexchangerateriskinthesetransactionsisnearlynon-existent.Inexceptionalcasesandlimitedeconomicenvironments,operatingandfinancingtransactionsaredenominatedincurrenciesotherthanthefunctionalcurrency,leadingtoaforeigncurrencyexchangerateriskfortherelatedmonetaryinstruments.Wherewehedgeagainstcurrencyimpactsoncashflows,theseforeigncurrency-denominatedfinancialinstrumentsareeconomicallyconvertedintothefunctionalcurrencybytheuseofforwardexchangecontractsoroptions.Therefore,fluctuationsinforeigncurrencyexchangeratesneitherhaveasignificantimpactonprofitnoronothercomprehensiveincomewithregardtoournon-derivativemonetaryfinancialinstruments.
–Incomeorexpensesrecordedinconnectionwiththenon-derivativemonetaryfinancialinstrumentsdiscussed abovearemainlyrecognizedintherelevantentity’sfunctionalcurrency.Therefore,fluctuationsinforeigncurrencyexchangeratesneitherhaveasignificantimpactonprofit noronothercomprehensiveincomeinthisregard.
–Ourfree-standingderivativesdesignedforhedgingforeign-currencyexchangeraterisksalmostcompletelybalance thechangesinthefairvaluesofthehedgeditemattributabletoexchangeratemovementsintheConsolidatedIncomeStatementsinthesameperiod.Asaconsequence,thehedgeditemsandthehedginginstrumentsarenotexposedtoforeigncurrencyexchangeraterisks,andtherebyhave noeffectonprofit.
Consequently,weareonlyexposedtosignificantforeigncurrencyexchangeratefluctuationswithregardto:–Derivativesheldwithinadesignatedcashflowhedgerelationship(excludingtheinterestelement,whichisnot partoftheassignedcashflowhedgerelationships)
–Foreigncurrencyembeddedderivatives–TheforeigncurrencyoptionsheldasatDecember31,2011, inconnectionwiththeacquisitionofSuccessFactors.
Wherewedonothaveasignificantexposuretowardsasinglecurrency,wediscloseoursensitivitytoourmajorforeigncurrencies (as described in Note(24))intotal.
237Notes to the Consolidated Financial Statements
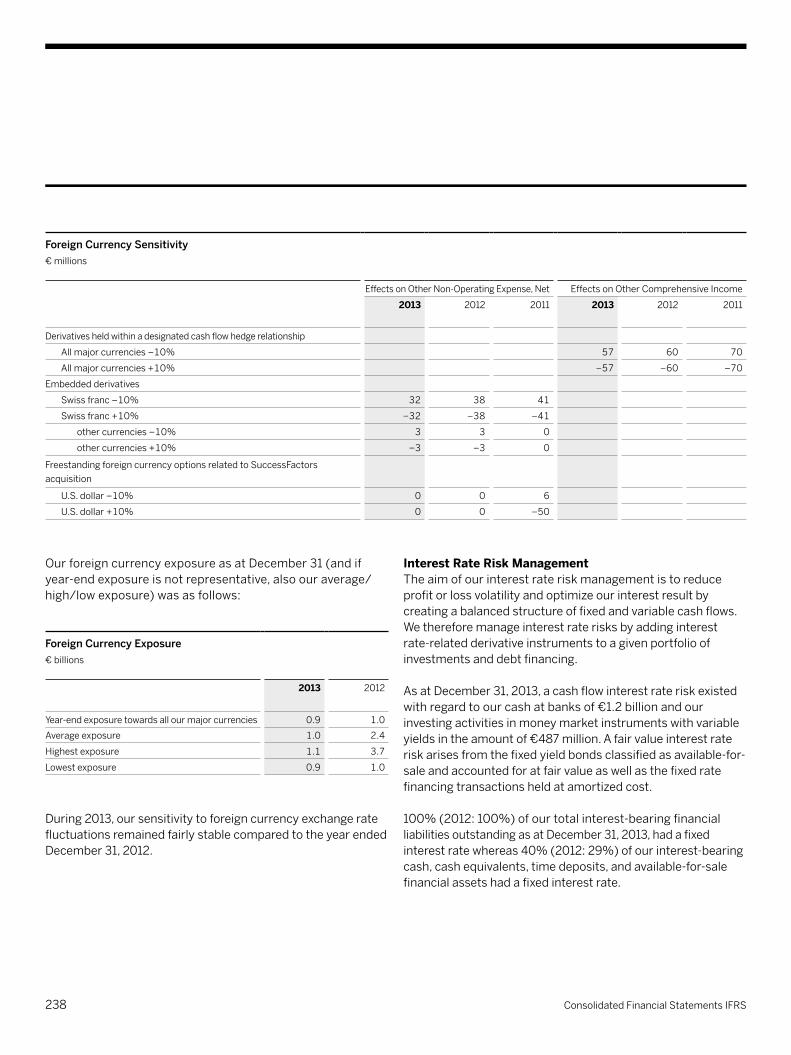
Foreign Currency Sensitivity€ millions
EffectsonOtherNon-OperatingExpense,Net EffectsonOtherComprehensiveIncome
2013 2012 2011 2013 2012 2011
Derivativesheldwithinadesignatedcashflowhedgerelationship
Allmajorcurrencies–10% 57 60 70
Allmajorcurrencies+10% −57 −60 –70
Embeddedderivatives
Swissfranc–10% 32 38 41
Swissfranc+10% −32 –38 –41
othercurrencies–10% 3 3 0
othercurrencies+10% −3 –3 0
FreestandingforeigncurrencyoptionsrelatedtoSuccessFactors acquisition
U.S.dollar–10% 0 0 6
U.S.dollar+10% 0 0 –50
OurforeigncurrencyexposureasatDecember31(andifyear-endexposureisnotrepresentative,alsoouraverage/high/lowexposure)wasasfollows:
Foreign Currency Exposure € billions
2013 2012
Year-endexposuretowardsallourmajorcurrencies 0.9 1.0
Averageexposure 1.0 2.4
Highestexposure 1.1 3.7
Lowestexposure 0.9 1.0
During2013,oursensitivitytoforeigncurrencyexchangeratefluctuationsremainedfairlystablecomparedtotheyearendedDecember 31, 2012.
Interest Rate Risk ManagementTheaimofourinterestrateriskmanagementistoreduceprofitorlossvolatilityandoptimizeourinterestresultbycreatingabalancedstructureoffixedandvariablecashflows.Wethereforemanageinterestraterisksbyaddinginterest rate-relatedderivativeinstrumentstoagivenportfolioofinvestmentsanddebtfinancing.
AsatDecember31,2013,acashflowinterestrateriskexistedwithregardtoourcashatbanksof€1.2billionandourinvestingactivitiesinmoneymarketinstrumentswithvariableyieldsintheamountof€487million.Afairvalueinterestrateriskarisesfromthefixedyieldbondsclassifiedasavailable-for-saleandaccountedforatfairvalueaswellasthefixedratefinancingtransactionsheldatamortizedcost.
100%(2012:100%)ofourtotalinterest-bearingfinancialliabilitiesoutstandingasatDecember31,2013,hadafixedinterestratewhereas40%(2012:29%)ofourinterest-bearingcash,cashequivalents,timedeposits,andavailable-for-salefinancialassetshadafixedinterestrate.
238 Consolidated Financial Statements IFRS

–Duetothedesignationofinterestratepayerswapsinacashflowhedgerelationship,theinterestratechangesaffect therespectiveamountsrecordedinothercomprehensiveincome.Themovementsrelatedtotheinterestrateswaps’variablelegwerenotreflectedinthesensitivitycalculation,astheyoffsetthevariableinterestratepaymentsfortheGermanprivateplacement(SSD).Wethereforeonlycon- sideredinterestratesensitivityindiscountingtheinterest rateswaps’fixedlegcashflowsintheequity-relatedsensitivitycalculation.
–ThedesignationofinterestratereceiverswapsinafairvaluehedgerelationshipleadstointerestratechangesaffectingFinancialIncome,net.Thefairvaluemovementsrelatedtotheinterestrateswapsarenotreflectedinthesensitivitycalculation,astheyoffsetthefixedinterestratepayments forthebondsandprivateplacementsashedgeditems.However,changesinmarketinterestratesaffecttheamountofinterestpaymentsfromtheinterestrateswap.Asaconsequence,theyareincludedintheintheprofit-relatedsensitivitycalculation.
Duetothecurrentlowinterestratelevelwebaseoursensitivityanalysesonayieldcurveshiftof+100/–20basispointstoavoid negative interest rates.
If,onDecember31,2013,2012,and2011,interestrateshadbeen100basispointshigher(20basispointslower),thiswouldnothavehadamaterialeffectonthefollowing:–Thegains/lossesonavailable-for-salefinancialassets inothercomprehensiveincome
–Financialincome,netforourvariableinterestrate investmentsandfinancialdebt
–Theeffectiveportionoftheinterestratecashflowhedge inothercomprehensiveincome
–Thevariableinterestpaymentsfromthereceiverswaps.
Derivatives with Designated Hedge Relationship (Fair Value Hedges)Themajorityofourinvestmentsarebasedonvariableratesand/orshortmaturitieswhileallourfinancingtransactionsarebasedonfixedratesandlongmaturities.Tomatchtheinterest-rateriskfromourfinancingtransactionstoourinvestments we use receiver interest rate swaps to convert certain of our fixedratefinancialliabilitiestofloatingandbythismeanssecurethefairvalueoftheswappedfinancingtransactions.Thedesiredfix-floatingmixofournetdebtissetbytheTreasuryCommittee.Interestrateswapsincluded,44%(2012:100%)ofourtotalinterest-bearingfinancialliabilitiesoutstandingasatDecember31,2013,hadafixedinterestrate.
Noneofthefairvalueadjustmentfromthereceiverswaps,thebasisadjustmentontheunderlyinghedgeditemsheldinfairvaluehedgerelationships,andthedifferencebetweenthetworecognizedinFinancialIncome,netismaterialinanyoftheyearspresented.
Interest Rate ExposureAsensitivityanalysisisprovidedtoshowtheimpactofourinterestrateriskexposureonprofitorlossandequityinaccordancewithIFRS7,consideringthefollowing:–Changesininterestratesonlyaffecttheaccountingfornon-derivativefixedratefinancialinstrumentsiftheyarerecognizedatfairvalue.Therefore,suchinterestratechangesdonotchangethecarryingamountsofournon-derivativefinancialliabilitiesasweaccountforthematamortizedcost.OnDecember31ofeachyear-endreported,wehadfixedratebondsclassifiedasavailable-for-saleasdescribedinNote(24).Wethereforeconsiderinterestratechangesrelatingtothefairvaluemeasurementofsuchfixedratenon-derivativefinancialassetsclassifiedasavailable-for-saleintheequity-relatedsensitivitycalculation.
–Incomeorexpensesrecordedinconnectionwithnon-derivativefinancialinstrumentswithvariableinterestratesaresubjecttointerestrateriskiftheyarenothedgeditemsinaneffectivehedgerelationship.Thus,wetakeintoconsiderationinterestratechangesrelatingtoourvariable-ratefinancingandourinvestmentsinmoneymarketinstrumentsintheprofit-relatedsensitivitycalculation.
239Notes to the Consolidated Financial Statements

OurinterestrateexposureasatDecember31(andifyear-endexposureisnotrepresentative,alsoouraverage/high/lowexposure)wasasfollows:
Interest rate risk exposure€ billions
2013 2012
Year-End Average High Low Year-End Average High Low
Fairvalueinterestraterisk
Frominvestments 0.04 0.06 0.13 0.04 0.03 0.10 0.30 0
Cashflowinterestraterisk
Frominvestments(incl.cash) 1.73 2.23 2.71 1.73 1.80 2.41 3.03 1.80
Fromfinancing 0 0.31 1.00 0 0 1.10 3.20 0
Frominterestrateswaps 2.39 0.60 2.40 0 0 0 0 0
Equity Price Risk ManagementOurinvestmentsinequityinstrumentswithquotedmarketpricesinactivemarkets(2013:€83million;2012:€52million)aremonitoredbasedonthecurrentmarketvaluethatisaffectedbythefluctuationsinthevolatilestockmarketsworld- wide.Anassumed20%increase(decrease)inequityprices asatDecember31,2013(2012),wouldnothaveamaterialimpactonthevalueofourinvestmentsinmarketableequitysecuritiesandthecorrespondingentriesinothercomprehensiveincome.
Weareexposedtoequitypriceriskwithregardtoourshare-basedpayments.Inordertoreduceresultingprofitorlossvolatility,wehedgecertaincashflowexposuresassociatedwiththeseplansthroughthepurchaseofderivativeinstruments,butdonotestablishadesignatedhedgerelationship.Inoursen- sitivityanalysisweincludetheunderlyingshare-basedpay- mentsandthehedginginstruments.Thus,webasethecalculationonournetexposuretoequitypricesaswebelievetakingonlythederivativeinstrumentintoaccountwould notproperlyreflectourequitypriceriskexposure.Anassumed20%increase(decrease)inequitypricesasatDecember31,
2013,wouldhaveincreased(decreased)ourshare-basedpaymentexpensesby€126million(€90million)(2012:increasedby€139million(decreasedby€117million);2011:increasedby€27million(decreasedby€25million)).
Credit Risk ManagementTomitigatethecreditriskfromourinvestingactivitiesandderivativefinancialassets,weconductallouractivities onlywithapprovedmajorfinancialinstitutionsandissuersthatcarryhighexternalratings,asrequiredbyourinternaltreasuryguideline.Amongitsstipulations,theguidelinerequiresthat weinvestonlyinassetsfromissuerswithaminimumratingofatleastBBB.Weonlymakeinvestmentsinissuerswith alowerratinginexceptionalcases.Suchinvestmentswerenotmaterialin2013.TheweightedaverageratingofourfinancialassetsisintherangeAtoA–.Wepursueapolicyofcautiousinvestmentscharacterizedbypredominantlycurrentinvestments, standard investment instruments, as well as awideportfoliodiversificationbydoingbusinesswithavarietyof counterparties.
240 Consolidated Financial Statements IFRS
liquidity risk managementOurliquidityismanagedbyourglobaltreasurydepartmentwiththeprimaryaimofmaintainingliquidityatalevelthatisadequatetomeetourfinancialobligations.
Ourprimarysourceofliquidityisfundsgeneratedfromourbusinessoperations,whichhavehistoricallybeentheprimarysourceoftheliquidfundsneededtomaintainourinvestingandfinancingstrategy.Themajorityofoursubsidiariespooltheircashsurplustoourglobaltreasurydepartment,whichthenarrangestofundothersubsidiaries’requirementsorinvestanynetsurplusinthemarket,seekingtooptimizeyields,whileensuringliquidity,byinvestingonlywithcounterpartiesandissuersofhighcreditquality,asexplainedabove.Hence,highlevelsofliquidassetsandmarketablesecuritiesprovide astrategicreserve,helpingkeepSAPflexible,sound,andindependent.
Apartfromeffectiveworkingcapitalandcashmanagement,wehavereducedtheliquidityriskinherentinmanagingourday-to-dayoperationsandmeetingourfinancingresponsibilitiesbyarranginganadequatevolumeofavailablecreditfacilitieswithvariousfinancialinstitutionsonwhichwecandrawifnecessary.
Inordertoretainhighfinancialflexibility,onNovember13,2013,SAPAGenteredintoa€2.0billionsyndicatedcreditfacilityagreementwithaninitialtermoffiveyearsendinginDecember2018,effectivelyreplacingthe€1.5billioncreditfacilityfrom2010.Theuseofthefacilityisnotrestrictedbyanyfinancialcovenants.BorrowingsunderthefacilitybearinterestofEURIBORorLIBORfortherespectivecurrencyplusamargin of22.5basispoints.Wearealsorequiredtopayacommitmentfeeof7.88basispointsperannumontheunusedavailablecredit.Wehaveneverdrawnonthefacility.
Additionally,asatDecember31,2013,and2012,SAPAGhadavailable lines of credit totaling €487 million and €489 million, respectively.AsatDecember31,2013,and2012,therewerenoborrowingsoutstandingundertheselinesofcredit.AsatDecember31,2013,and2012,certainsubsidiarieshadlinesofcreditavailablethatallowedthemtoborrowinlocalcurrenciesat prevailing interest rates up to €36 million and €48 million,
Tofurtherreduceourcreditrisk,werequirecollateralforcertaininvestmentsinthefullamountoftheinvestmentvolumewhichwewouldbeallowedtomakeuseofinthecaseofdefaultofthecounterpartytotheinvestment.Assuchcollateral,weonlyacceptbondsofnon-financialcorporationswithatleastinvestmentgraderatinglevel.
Inaddition,theconcentrationofcreditriskthatexistswhencounterpartiesareinvolvedinsimilaractivitiesbyinstrument,sector,orgeographicareaisfurthermitigatedbydiversificationofcounterpartiesthroughouttheworldandadherencetoaninternallimitsystemforeachcounterparty.Thisinternallimitsystemstipulatesthatthebusinessvolumewithindividualcounterpartiesisrestrictedtoadefinedlimit,whichdependsonthelowestofficiallong-termcreditratingavailablebyatleastoneofthemajorratingagencies,theTier1capitaloftherespectivefinancialinstitution,orparticipationintheGermanDepositors’GuaranteeFundorsimilarprotectionschemes. Wecontinuouslymonitorstrictcompliancewiththesecounter- partylimits.Asthepremiumforcreditdefaultswapsmainlydependsonmarketparticipants’assessmentsofthecredit- worthinessofadebtor,wealsocloselyobservethedevelopment ofcreditdefaultswapspreadsinthemarkettoevaluateprobableriskdevelopmentstotimelyreacttochangesiftheseshouldmanifest.
Thedefaultriskofourtradereceivablesismanagedseparately,mainlybasedonassessingthecreditworthinessofcustomersthroughexternalratingsandourhistoricalexperiencewithrespectivecustomers.Outstandingreceivablesarecontinuously monitoredlocally.Creditrisksareaccountedforthroughindividualandportfolioallowances.Formoreinformation,seeNote(3).Theimpactofdefaultonourtradereceivablesfromindividualcustomersismitigatedbyourlargecustomerbaseanditsdistributionacrossmanydifferentindustries,companysizes,andcountriesworldwide.Formoreinformationabout our trade receivables, see Note(13).Forinformationaboutthemaximumexposuretocreditrisk,seeNote(24).
241Notes to the Consolidated Financial Statements
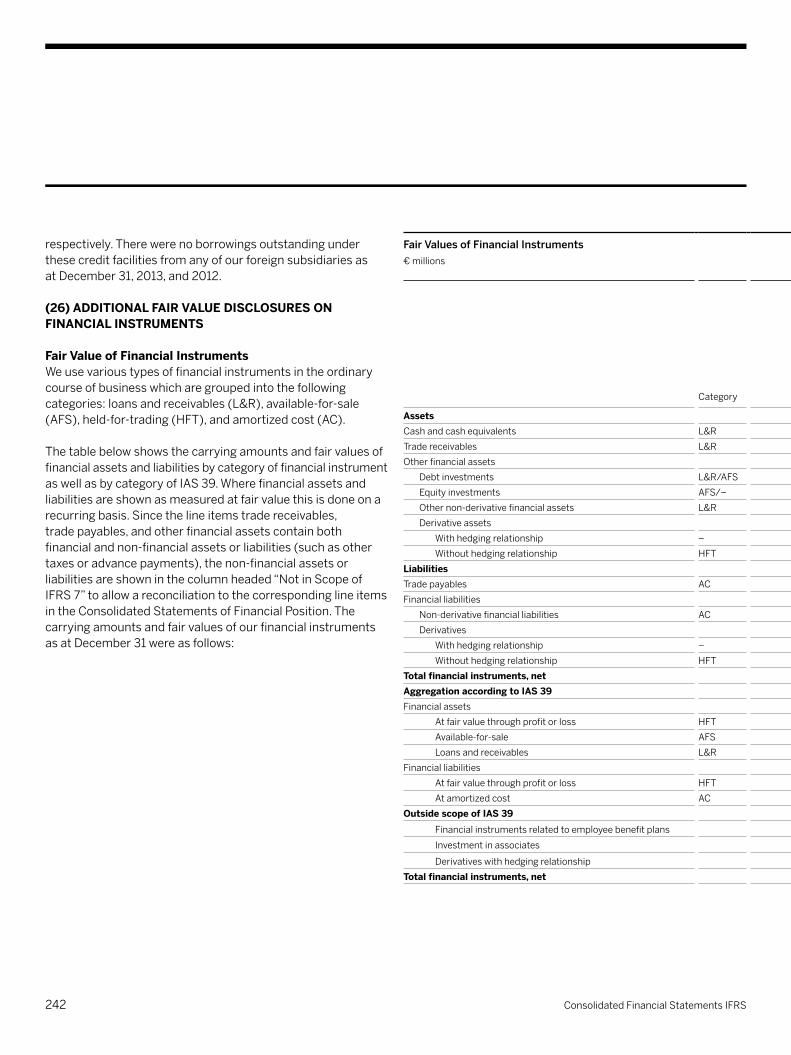
Fair Values of Financial Instruments € millions
Category
2013 2012
BookValue12/31/2013
MeasurementCategories FairValue12/31/2013
NotinScope of IFRS7
BookValue12/31/2012
MeasurementCategories FairValue12/31/2012
NotinScope of IFRS7
At Amortized
Cost
AtCost AtFair Value
At Amortized
Cost
AtCost AtFair Value
AssetsCashandcashequivalents L&R 2,748 2,748 2,748 2,477 2,477 2,477
Trade receivables L&R 3,963 3,816 3,816 147 4,005 3,837 3,837 168
Otherfinancialassets 858 663
Debt investments L&R/AFS 38 38 29 29
Equityinvestments AFS/– 0 322 322 36 149 52 52 46
Othernon-derivativefinancialassets L&R 214 214 119 159 159 84
Derivative assets
Withhedgingrelationship – 35 35 29 29
Withouthedgingrelationship HFT 94 94 115 115
liabilitiesTradepayables AC −895 −640 −640 −255 −933 −684 −684 −249
Financialliabilities −4,506 −5,248
Non-derivativefinancialliabilities AC −4,336 −4,439 −5,051 −5,228
Derivatives
Withhedgingrelationship – −26 −26 −2 −2
Withouthedgingrelationship HFT −144 −144 −195 −195
total financial instruments, net 2,168 1,802 0 319 2,018 47 964 738 149 28 589 49Aggregation according to IAS 39Financialassets
Atfairvaluethroughprofitorloss HFT 94 94 94 115 115 115
Available-for-sale AFS 360 0 360 360 230 149 81 81
Loans and receivables L&R 6,925 6,778 6,778 147 6,641 6,473 6,473 168
Financialliabilities
Atfairvaluethroughprofitorloss HFT −144 −144 −144 −195 −195 −195
At amortized cost AC −5,231 −4,976 −5,079 −255 −5,984 −5,735 −5,912 −249
Outside scope of IAS 39Financialinstrumentsrelatedtoemployeebenefitplans 119 119 84 84
Investmentinassociates 36 36 46 46
Derivativeswithhedgingrelationship 9 9 9 27 27 27total financial instruments, net 2,168 1,802 0 319 2,018 47 964 738 149 28 589 49
respectively.Therewerenoborrowingsoutstandingunderthesecreditfacilitiesfromanyofourforeignsubsidiariesas at December 31, 2013, and 2012.
(26) ADDItIOnAl FAIr VAluE DISClOSurES On FInAnCIAl InStrumEntS
Fair Value of Financial InstrumentsWeusevarioustypesoffinancialinstrumentsintheordinarycourseofbusinesswhicharegroupedintothefollowingcategories:loansandreceivables(L&R),available-for-sale(AFS),held-for-trading(HFT),andamortizedcost(AC). Thetablebelowshowsthecarryingamountsandfairvaluesoffinancialassetsandliabilitiesbycategoryoffinancialinstrument aswellasbycategoryofIAS39.Wherefinancialassetsandliabilitiesareshownasmeasuredatfairvaluethisisdoneonarecurringbasis.Sincethelineitemstradereceivables, tradepayables,andotherfinancialassetscontainbothfinancialandnon-financialassetsorliabilities(suchasothertaxesoradvancepayments),thenon-financialassetsorliabilitiesareshowninthecolumnheaded“NotinScopeofIFRS7”toallowareconciliationtothecorrespondinglineitemsintheConsolidatedStatementsofFinancialPosition.ThecarryingamountsandfairvaluesofourfinancialinstrumentsasatDecember31wereasfollows:
242 Consolidated Financial Statements IFRS
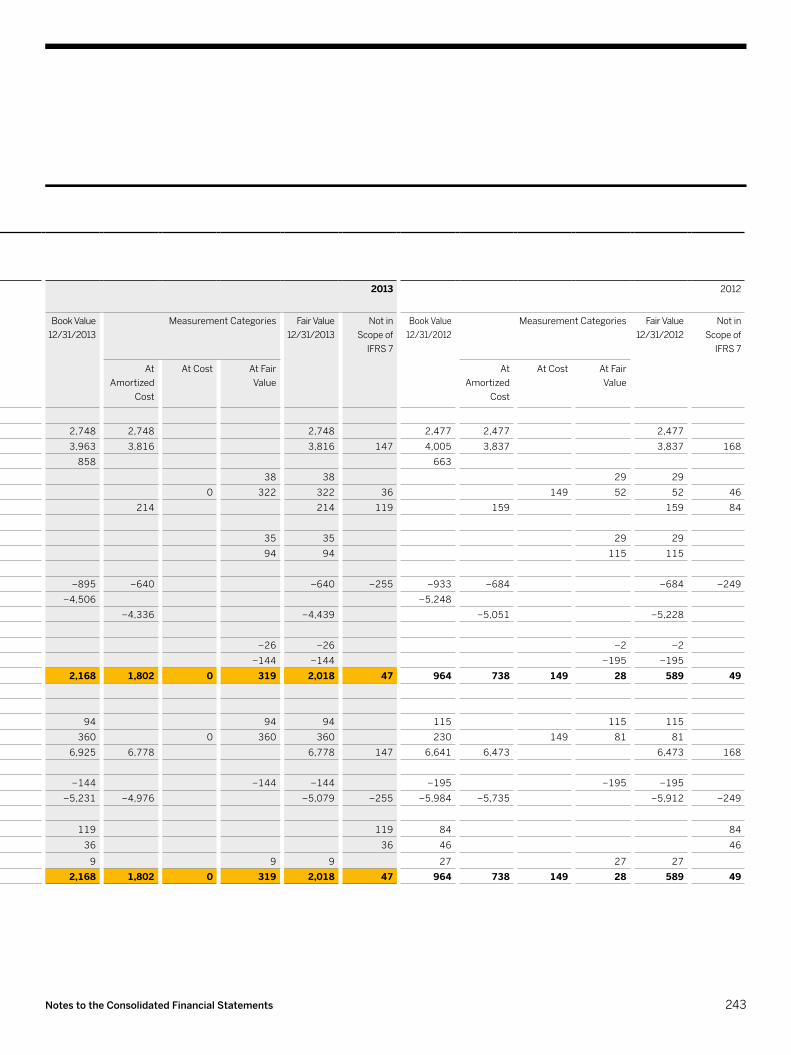
Fair Values of Financial Instruments € millions
Category
2013 2012
BookValue12/31/2013
MeasurementCategories FairValue12/31/2013
NotinScope of IFRS7
BookValue12/31/2012
MeasurementCategories FairValue12/31/2012
NotinScope of IFRS7
At Amortized
Cost
AtCost AtFair Value
At Amortized
Cost
AtCost AtFair Value
AssetsCashandcashequivalents L&R 2,748 2,748 2,748 2,477 2,477 2,477
Trade receivables L&R 3,963 3,816 3,816 147 4,005 3,837 3,837 168
Otherfinancialassets 858 663
Debt investments L&R/AFS 38 38 29 29
Equityinvestments AFS/– 0 322 322 36 149 52 52 46
Othernon-derivativefinancialassets L&R 214 214 119 159 159 84
Derivative assets
Withhedgingrelationship – 35 35 29 29
Withouthedgingrelationship HFT 94 94 115 115
liabilitiesTradepayables AC −895 −640 −640 −255 −933 −684 −684 −249
Financialliabilities −4,506 −5,248
Non-derivativefinancialliabilities AC −4,336 −4,439 −5,051 −5,228
Derivatives
Withhedgingrelationship – −26 −26 −2 −2
Withouthedgingrelationship HFT −144 −144 −195 −195
total financial instruments, net 2,168 1,802 0 319 2,018 47 964 738 149 28 589 49Aggregation according to IAS 39Financialassets
Atfairvaluethroughprofitorloss HFT 94 94 94 115 115 115
Available-for-sale AFS 360 0 360 360 230 149 81 81
Loans and receivables L&R 6,925 6,778 6,778 147 6,641 6,473 6,473 168
Financialliabilities
Atfairvaluethroughprofitorloss HFT −144 −144 −144 −195 −195 −195
At amortized cost AC −5,231 −4,976 −5,079 −255 −5,984 −5,735 −5,912 −249
Outside scope of IAS 39Financialinstrumentsrelatedtoemployeebenefitplans 119 119 84 84
Investmentinassociates 36 36 46 46
Derivativeswithhedgingrelationship 9 9 9 27 27 27total financial instruments, net 2,168 1,802 0 319 2,018 47 964 738 149 28 589 49
243Notes to the Consolidated Financial Statements

Determination of Fair ValuesIFRS13definesfairvalueasthepricethatwouldbereceivedtosellanassetorpaidtotransferaliabilityinanorderlytrans- actionbetweenmarketparticipantsonthemeasurementdate.Accordingly,bestevidenceoffairvalueprovidesquoted pricesinanactivemarket.Wheremarketpricesarenotreadilyavailable,valuationtechniqueshavetobeusedtoestablish fair value.
Dependingontheinputsusedfordeterminingfairvalueandtheirsignificanceforthevaluationtechniques,wehavecategorizedourfinancialinstrumentsatfairvalueintoathree-levelfairvaluehierarchyasmandatedbyIFRS13.
Thefairvaluehierarchygivesthehighestprioritytoquotedprices in active markets for identical assets or liabilities (Level 1)andthelowestprioritytounobservableinputs(Level3). Theinputsusedtomeasurefairvalueforonesingleinstrumentmayfallintodifferentlevelsofthefairvaluehierarchy.Insuchcases,thelevelinthefairvaluehierarchywithinwhichthefairvaluemeasurementinitsentiretyfallshasbeendeterminedbasedonthelowestlevelinputthatissignificanttothefairvalue measurementinitsentirety.Ourassessmentofthesignifi- canceofaparticularinputtothefairvaluemeasurementinitsentiretyrequiresjudgment,andconsidersfactorsspecific totheassetorliability.
Thelevelsofthefairvaluehierarchy,itsapplicationtoourfinancialassetsandliabilities,andtherespectivedeterminationoffairvaluearedescribedbelow–differentiatingbetweenthosethataremeasuredatfairvalueandthosethataremeasured atcostoramortizedcostwherefairvalueisonlydisclosed:–Level1:Quotedpricesinactivemarketsforidenticalassets
or liabilities.–Level2:Inputsotherthanthosethatcanbeobserved,eitherdirectlyorindirectly,suchasquotedpricesinactivemarketsforsimilarassetsorliabilities,quotedpricesforidentical orsimilarassetsorliabilitiesinmarketsthatarenotactive,orotherinputsthatareobservableorcanbecorroboratedbyobservablemarketdataforsubstantiallythefulltermoftheassets or liabilities.
–Level3:Unobservableinputsthataresupportedbylittleornomarketactivityandthataresignificanttothefairvalueoftheassetsorliabilities.
Itisourpolicytorecognizetransfersatthebeginningoftheperiodoftheeventorchangeincircumstancesthatcausedthetransfer.
244 Consolidated Financial Statements IFRS
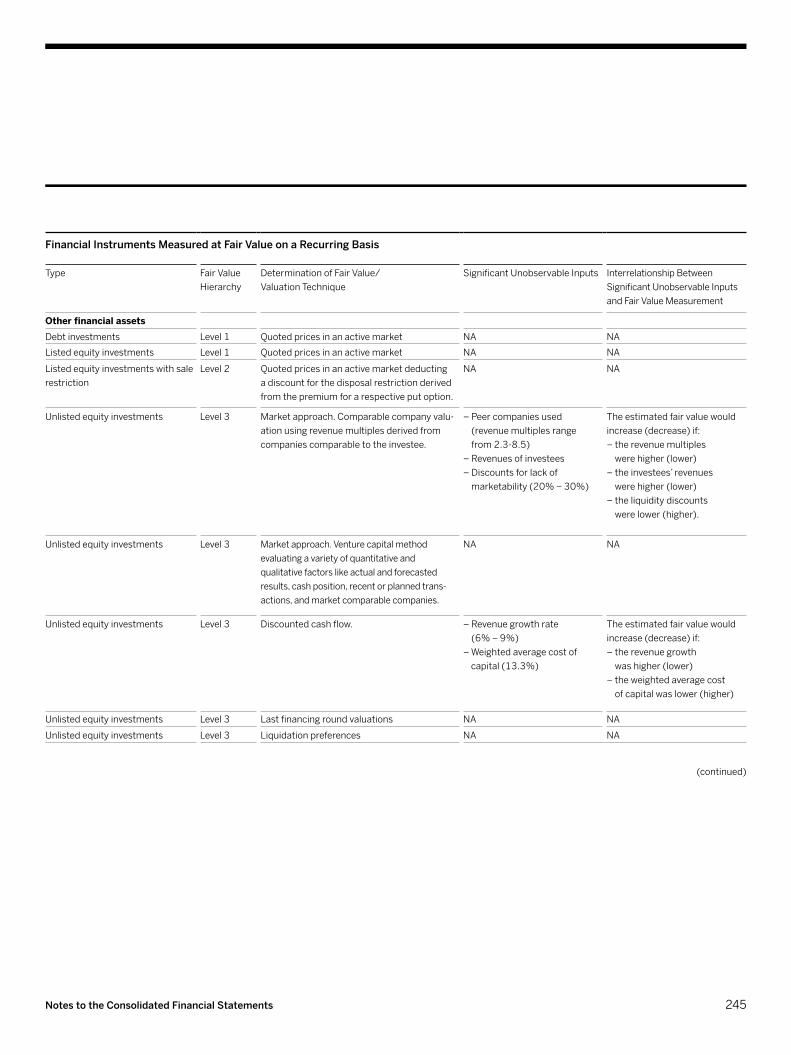
Financial Instruments Measured at Fair Value on a Recurring Basis
Type FairValueHierarchy
DeterminationofFairValue/ ValuationTechnique
SignificantUnobservableInputs InterrelationshipBetween SignificantUnobservableInputsandFairValueMeasurement
Other financial assetsDebt investments Level1 Quoted prices in an active market NA NA
Listedequityinvestments Level1 Quoted prices in an active market NA NA
Listedequityinvestmentswithsalerestriction
Level2 Quoted prices in an active market deducting adiscountforthedisposalrestrictionderivedfromthepremiumforarespectiveputoption.
NA NA
Unlistedequityinvestments Level3 Marketapproach.Comparablecompanyvalu-ation using revenue multiples derived from companiescomparabletotheinvestee.
– Peer companies used (revenue multiples range from2.3-8.5)
–Revenuesofinvestees– Discounts for lack of marketability(20% – 30%)
Theestimatedfairvaluewouldincrease(decrease)if:–therevenuemultiples werehigher(lower)
–theinvestees’revenues werehigher(lower)
–theliquiditydiscounts werelower(higher).
Unlistedequityinvestments Level3 Marketapproach.Venturecapitalmethod evaluatingavarietyofquantitativeand qualitativefactorslikeactualandforecasted results,cashposition,recentorplannedtrans-actions, and market comparable companies.
NA NA
Unlistedequityinvestments Level3 Discountedcashflow. –Revenuegrowthrate (6% – 9%)
–Weightedaveragecostof capital(13.3%)
Theestimatedfairvaluewouldincrease(decrease)if:–therevenuegrowth washigher(lower)
–theweightedaveragecost ofcapitalwaslower(higher)
Unlistedequityinvestments Level3 Last financing round valuations NA NA
Unlistedequityinvestments Level3 Liquidationpreferences NA NA
(continued)
245Notes to the Consolidated Financial Statements

Financial Instruments Measured at Fair Value on a Recurring Basis (continued)
Type FairValueHierarchy
DeterminationofFairValue/ ValuationTechnique
SignificantUnobservableInputs InterrelationshipBetween SignificantUnobservableInputsandFairValueMeasurement
Other financial assets (continued)
Privateequityfunds Level3 Netassetvalue/Fairmarketvalueasreportedbytherespectivefunds
NA NA
Interestrateswaps Level2 Discountedcashflow.Expectedfuturecashflowsareestimatedbased on forward interest rates from observableyieldcurvesandcontractinterestrates,discountedataratethatreflectsthe creditriskofthecounterparty.
NA NA
Calloptionsforshare-based paymentsplans
Level2 MonteCarloModel.Calculatedconsideringrisk-freeinterestrates,theremainingtermofthederivatives, thedividendyields,thestockprice,andthe volatilityofourshare.
NA NA
Other financial assets/ Financial liabilities
Foreignexchange(FX)forward contracts
Level2 DiscountedcashflowusingPar-Method.Expectedfuturecashflowsbasedonforwardexchangeratesarediscountedoverthe respectiveremainingtermofthecontractsusingtherespectivedepositinterestrates and spot rates.
NA NA
246 Consolidated Financial Statements IFRS
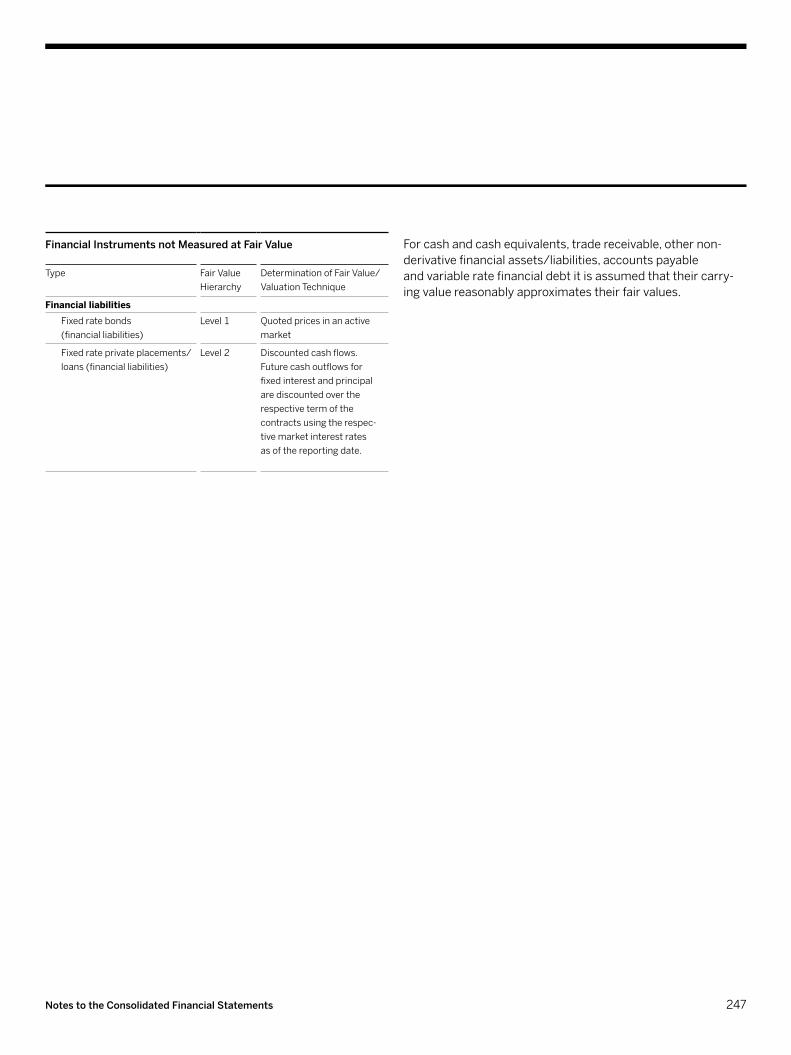
Forcashandcashequivalents,tradereceivable,othernon-derivativefinancialassets/liabilities,accountspayable andvariableratefinancialdebtitisassumedthattheircarry- ingvaluereasonablyapproximatestheirfairvalues.
Financial Instruments not Measured at Fair Value
Type FairValueHierarchy
DeterminationofFairValue/ValuationTechnique
Financial liabilitiesFixedratebonds (financialliabilities)
Level1 Quoted prices in an active market
Fixedrateprivateplacements/loans(financialliabilities)
Level2 Discountedcashflows.Futurecashoutflowsforfixedinterestandprincipalarediscountedoverthe respectivetermofthe contractsusingtherespec-tive market interest rates asofthereportingdate.
247Notes to the Consolidated Financial Statements
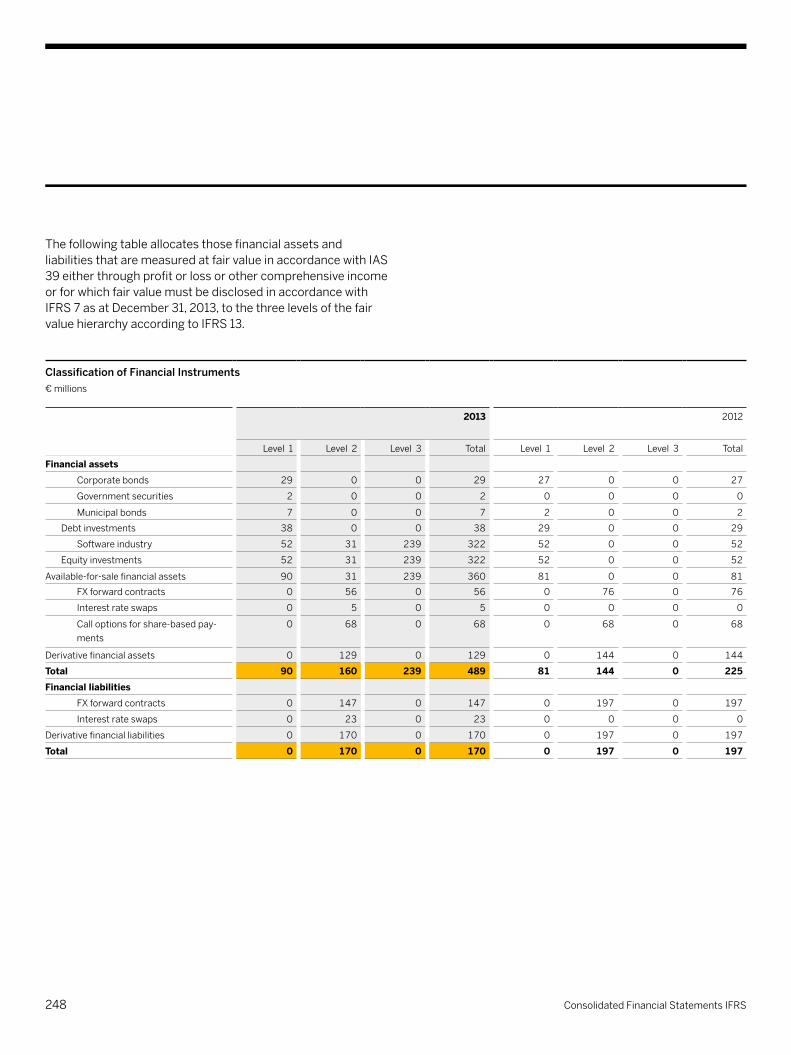
ThefollowingtableallocatesthosefinancialassetsandliabilitiesthataremeasuredatfairvalueinaccordancewithIAS39eitherthroughprofitorlossorothercomprehensiveincomeorforwhichfairvaluemustbedisclosedinaccordancewithIFRS7asatDecember31,2013,tothethreelevelsofthefairvaluehierarchyaccordingtoIFRS13.
Classification of Financial Instruments€ millions
2013 2012
Level 1 Level 2 Level 3 Total Level 1 Level 2 Level 3 Total
Financial assetsCorporatebonds 29 0 0 29 27 0 0 27
Government securities 2 0 0 2 0 0 0 0
Municipalbonds 7 0 0 7 2 0 0 2
Debt investments 38 0 0 38 29 0 0 29
Softwareindustry 52 31 239 322 52 0 0 52
Equityinvestments 52 31 239 322 52 0 0 52
Available-for-salefinancialassets 90 31 239 360 81 0 0 81
FXforwardcontracts 0 56 0 56 0 76 0 76
Interestrateswaps 0 5 0 5 0 0 0 0
Calloptionsforshare-basedpay-ments
0 68 0 68 0 68 0 68
Derivative financial assets 0 129 0 129 0 144 0 144
Total 90 160 239 489 81 144 0 225Financial liabilities
FXforwardcontracts 0 147 0 147 0 197 0 197
Interestrateswaps 0 23 0 23 0 0 0 0
Derivative financial liabilities 0 170 0 170 0 197 0 197
Total 0 170 0 170 0 197 0 197
248 Consolidated Financial Statements IFRS

transfers between level 1 and 2Transfersofavailable-for-saleequityinvestmentsfrom Level2toLevel1whichoccurredbecausedisposalrestrictionslapsedanddeductingadiscountforsuchrestrictionwasnolongernecessarywerenotmaterialinallyearspresented,whiletransfers from Level 1 to Level 2 did not occur at all.
level 3 disclosuresThefollowingtableshowsthereconciliationfromtheopeningtotheclosingbalancesforourLevel3fairvalues:
Reconciliation of Level 3 Fair Values€ millions
2013
UnlistedEquity InvestmentsandPrivate
EquityFunds
Opening balance 0
Transfers
intoLevel3 162
outofLevel3 −30
Purchases 79
Sales −16
Gains/losses
included in financial income, net in profit and loss 7
includedinavailable-for-salefinancialassets inothercomprehensiveincome
46
includedinexchangedifferences inothercomprehensiveincome
−9
Closing balance 239
Changeinunrealizedgains/lossesinprofit andlossforinvestmentsheldattheendofthe reporting period
0
ThetransfersintoandoutofLevel3relatetounlistedequityinvestments.
Changingtheunobservableinputstoreflectreasonablypossiblealternativeassumptionswouldnothaveamaterialimpactonthefairvaluesofourunlistedequityinvestmentsheldasavailable-for-saleasofthereportingdate. (27) ShArE-bASED pAymEntS SAPhasgrantedawardsundervariouscash-settledandequity-settledshare-basedpaymentstoitsdirectorsandemployees.Mostoftheseawardsaredescribedindetailbelow.SAPhasothershare-basedpayments,whichare,individuallyandinaggregate,immaterialtoourConsolidatedFinancialStatements.
a) Cash-Settled Share-based paymentsSAP’scash-settledshare-basedpaymentsincludethefollowingprograms:EmployeeParticipationPlan(EPP)andLong-TermIncentivePlan(LTIPlanfortheGlobalManagingBoard)2015,SOPPerformancePlan2009(SOPPP),StockOptionPlan2010(SOP2010(2010–2013tranches)),RestrictedStockUnitPlan2013(RSU2013),acquiredSFSFRights(formerSuccessFactorsawardsassumedinconnectionwiththeSuccessFactorsacquisitionin2012),acquiredAribaRights(formerAribaawardsassumedinconnectionwiththeAribaacquisitionin2012).
249Notes to the Consolidated Financial Statements
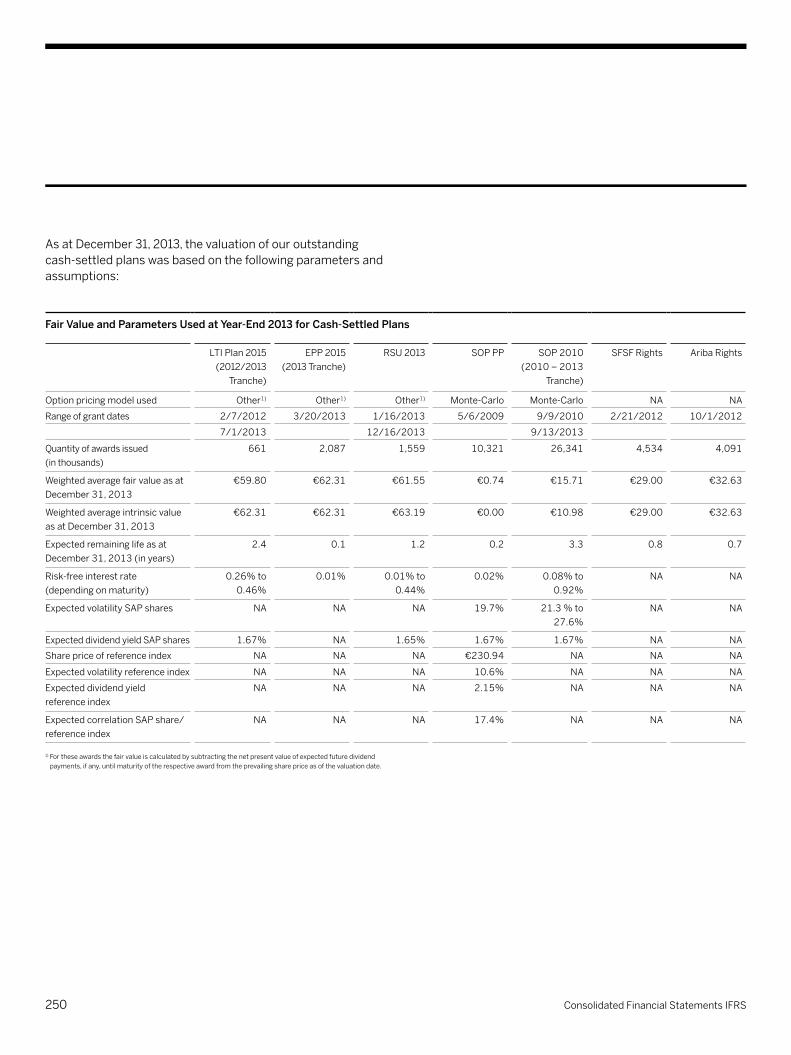
AsatDecember31,2013,thevaluationofouroutstandingcash-settledplanswasbasedonthefollowingparametersandassumptions:
Fair Value and Parameters Used at Year-End 2013 for Cash-Settled Plans
LTIPlan2015(2012/2013
Tranche)
EPP2015 (2013Tranche)
RSU2013 SOP PP SOP2010(2010–2013
Tranche)
SFSFRights AribaRights
Option pricing model used Other1) Other1) Other1) Monte-Carlo Monte-Carlo NA NA
Rangeofgrantdates 2/7/2012 3/20/2013 1/16/2013 5/6/2009 9/9/2010 2/21/2012 10/1/2012
7/1/2013 12/16/2013 9/13/2013
Quantityofawardsissued (inthousands)
661 2,087 1,559 10,321 26,341 4,534 4,091
WeightedaveragefairvalueasatDecember31,2013
€59.80 €62.31 €61.55 €0.74 €15.71 €29.00 €32.63
WeightedaverageintrinsicvalueasatDecember31,2013
€62.31 €62.31 €63.19 €0.00 €10.98 €29.00 €32.63
Expectedremaininglifeasat December31,2013(inyears)
2.4 0.1 1.2 0.2 3.3 0.8 0.7
Risk-freeinterestrate (dependingonmaturity)
0.26%to0.46%
0.01% 0.01%to0.44%
0.02% 0.08%to0.92%
NA NA
ExpectedvolatilitySAPshares NA NA NA 19.7% 21.3%to27.6%
NA NA
ExpecteddividendyieldSAPshares 1.67% NA 1.65% 1.67% 1.67% NA NA
Sharepriceofreferenceindex NA NA NA €230.94 NA NA NA
Expectedvolatilityreferenceindex NA NA NA 10.6% NA NA NA
Expecteddividendyield referenceindex
NA NA NA 2.15% NA NA NA
ExpectedcorrelationSAPshare/referenceindex
NA NA NA 17.4% NA NA NA
1) Fortheseawardsthefairvalueiscalculatedbysubtractingthenetpresentvalueofexpectedfuturedividendpayments,ifany,untilmaturityoftherespectiveawardfromtheprevailingsharepriceasofthevaluationdate.
250 Consolidated Financial Statements IFRS
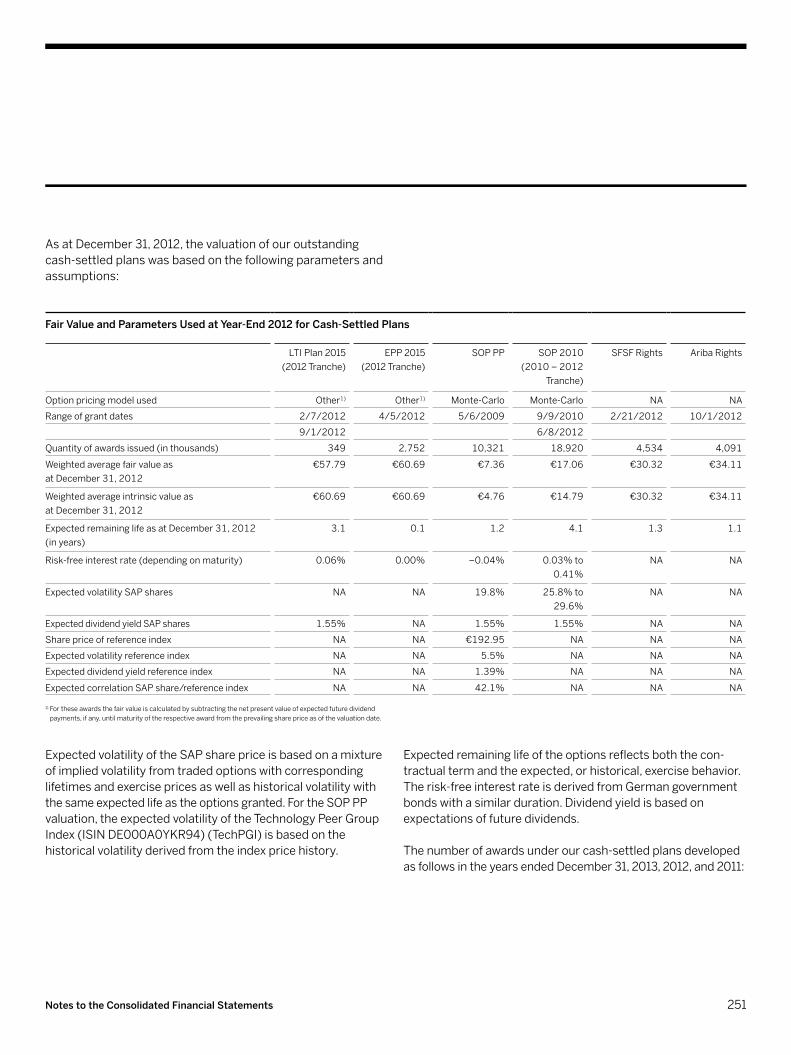
AsatDecember31,2012,thevaluationofouroutstandingcash-settledplanswasbasedonthefollowingparametersandassumptions:
Fair Value and Parameters Used at Year-End 2012 for Cash-Settled Plans
LTIPlan2015(2012Tranche)
EPP2015 (2012Tranche)
SOP PP SOP2010(2010–2012
Tranche)
SFSFRights AribaRights
Option pricing model used Other1) Other1) Monte-Carlo Monte-Carlo NA NA
Rangeofgrantdates 2/7/2012 4/5/2012 5/6/2009 9/9/2010 2/21/2012 10/1/2012
9/1/2012 6/8/2012
Quantityofawardsissued(inthousands) 349 2,752 10,321 18,920 4,534 4,091
Weightedaveragefairvalueas atDecember31,2012
€57.79 €60.69 €7.36 €17.06 €30.32 €34.11
Weightedaverageintrinsicvalueas atDecember31,2012
€60.69 €60.69 €4.76 €14.79 €30.32 €34.11
ExpectedremaininglifeasatDecember31,2012 (inyears)
3.1 0.1 1.2 4.1 1.3 1.1
Risk-freeinterestrate(dependingonmaturity) 0.06% 0.00% −0.04% 0.03%to0.41%
NA NA
ExpectedvolatilitySAPshares NA NA 19.8% 25.8%to29.6%
NA NA
ExpecteddividendyieldSAPshares 1.55% NA 1.55% 1.55% NA NA
Sharepriceofreferenceindex NA NA €192.95 NA NA NA
Expectedvolatilityreferenceindex NA NA 5.5% NA NA NA
Expecteddividendyieldreferenceindex NA NA 1.39% NA NA NA
ExpectedcorrelationSAPshare/referenceindex NA NA 42.1% NA NA NA
1) Fortheseawardsthefairvalueiscalculatedbysubtractingthenetpresentvalueofexpectedfuturedividendpayments,ifany,untilmaturityoftherespectiveawardfromtheprevailingsharepriceasofthevaluationdate.
ExpectedvolatilityoftheSAPsharepriceisbasedonamixtureofimpliedvolatilityfromtradedoptionswithcorrespondinglifetimesandexercisepricesaswellashistoricalvolatilitywiththesameexpectedlifeastheoptionsgranted.FortheSOPPPvaluation,theexpectedvolatilityoftheTechnologyPeerGroupIndex(ISINDE000A0YKR94)(TechPGI)isbasedonthehistoricalvolatilityderivedfromtheindexpricehistory.
Expectedremaininglifeoftheoptionsreflectsboththecon- tractualtermandtheexpected,orhistorical,exercisebehavior.Therisk-freeinterestrateisderivedfromGermangovernmentbondswithasimilarduration.Dividendyieldisbasedonexpectationsoffuturedividends.
Thenumberofawardsunderourcash-settledplansdevelopedasfollowsintheyearsendedDecember31,2013,2012,and2011:
251Notes to the Consolidated Financial Statements

Changes in Numbers of Outstanding Awards Under Our Cash-Settled Plansthousands
LTIPlan2015(2012/2013
Tranche)
EPP2015(2012/2013
Tranche)
RSU2013 SOP PP SOP 2010 (2010–2013
Tranche)
SFSFRights AribaRights
Outstandingasat12/31/2010 NA NA NA 9,575 5,373 NA NA
Grantedin2011 NA NA NA 0 5,192 NA NA
Exercisedin2011 NA NA NA 0 0 NA NA
Expiredin2011 NA NA NA 0 0 NA NA
Forfeitedin2011 NA NA NA −632 −515 NA NA
Outstandingasat12/31/2011 NA NA NA 8,943 10,050 NA NA
Grantedin2012 349 2,752 NA 0 8,331 4,534 4,091
AdjustmentbaseduponKPItargetachievementin2012 117 880 NA NA NA NA NA
Exercisedin2012 0 0 NA −3,294 0 −1,826 −1,587
Expiredin2012 0 0 NA 0 0 0 0
Forfeitedin2012 0 −130 NA −805 −954 −305 −144
Outstanding as at 12/31/2012 466 3,502 nA 4,844 17,427 2,403 2,360Grantedin2013 311 2,087 1,559 0 7,421 NA NA
AdjustmentbaseduponKPItargetachievementin2013 −18 −139 0 NA NA NA NA
Exercisedin2013 −196 −3,495 0 −992 −2,215 −797 −1,362
Expiredin2013 0 −7 0 0 0 0 0
Forfeitedin2013 −48 −103 −96 −385 −967 −531 −90
Outstanding as at 12/31/2013 515 1,845 1,463 3,467 21,666 1,075 908
Additional information Awardsexercisableasat12/31/2011 NA NA NA 8,943 0 NA NA
Awardsexercisableasat12/31/2012 0 0 NA 4,844 0 0 0
Awards exercisable as at 12/31/2013 0 0 0 3,467 1,609 0 0
Aggregateintrinsicvalueofvestedawards(in€millions),asat12/31/2011 NA NA NA 0 0 NA NA
Aggregateintrinsicvalueofvestedawards(in€millions),asat12/31/2012 28 213 NA 23 0 3 3
Aggregate intrinsic value of vested awards (in € millions), as at 12/31/2013 43 115 0 0 37 0 0
Weightedaverageshareprice(in€)forshareoptionsexercisedin2011 NA NA NA NA NA NA NA
Weightedaverageshareprice(in€)forshareoptionsexercisedin2012 NA NA NA 60.40 NA 30.32 34.11
weighted average share price (in €) for share options exercised in 2013 54.96 59.90 nA 61.38 55.47 29.00 32.63
Provisionasat12/31/2012(in€millions) 53 212 NA 36 137 39 51
provision as at 12/31/2013 (in € millions) 41 115 32 3 183 20 24
Expenserecognizedin2011(in€millions) NA NA NA −8 28 NA NA
Expenserecognizedin2012(in€millions) 53 216 NA 20 74 38 21
Expenserecognizedin2013(in€millions) −11 118 34 −28 83 10 21
252 Consolidated Financial Statements IFRS

Changes in Numbers of Outstanding Awards Under Our Cash-Settled Plansthousands
LTIPlan2015(2012/2013
Tranche)
EPP2015(2012/2013
Tranche)
RSU2013 SOP PP SOP 2010 (2010–2013
Tranche)
SFSFRights AribaRights
Outstandingasat12/31/2010 NA NA NA 9,575 5,373 NA NA
Grantedin2011 NA NA NA 0 5,192 NA NA
Exercisedin2011 NA NA NA 0 0 NA NA
Expiredin2011 NA NA NA 0 0 NA NA
Forfeitedin2011 NA NA NA −632 −515 NA NA
Outstandingasat12/31/2011 NA NA NA 8,943 10,050 NA NA
Grantedin2012 349 2,752 NA 0 8,331 4,534 4,091
AdjustmentbaseduponKPItargetachievementin2012 117 880 NA NA NA NA NA
Exercisedin2012 0 0 NA −3,294 0 −1,826 −1,587
Expiredin2012 0 0 NA 0 0 0 0
Forfeitedin2012 0 −130 NA −805 −954 −305 −144
Outstanding as at 12/31/2012 466 3,502 nA 4,844 17,427 2,403 2,360Grantedin2013 311 2,087 1,559 0 7,421 NA NA
AdjustmentbaseduponKPItargetachievementin2013 −18 −139 0 NA NA NA NA
Exercisedin2013 −196 −3,495 0 −992 −2,215 −797 −1,362
Expiredin2013 0 −7 0 0 0 0 0
Forfeitedin2013 −48 −103 −96 −385 −967 −531 −90
Outstanding as at 12/31/2013 515 1,845 1,463 3,467 21,666 1,075 908
Additional information Awardsexercisableasat12/31/2011 NA NA NA 8,943 0 NA NA
Awardsexercisableasat12/31/2012 0 0 NA 4,844 0 0 0
Awards exercisable as at 12/31/2013 0 0 0 3,467 1,609 0 0
Aggregateintrinsicvalueofvestedawards(in€millions),asat12/31/2011 NA NA NA 0 0 NA NA
Aggregateintrinsicvalueofvestedawards(in€millions),asat12/31/2012 28 213 NA 23 0 3 3
Aggregate intrinsic value of vested awards (in € millions), as at 12/31/2013 43 115 0 0 37 0 0
Weightedaverageshareprice(in€)forshareoptionsexercisedin2011 NA NA NA NA NA NA NA
Weightedaverageshareprice(in€)forshareoptionsexercisedin2012 NA NA NA 60.40 NA 30.32 34.11
weighted average share price (in €) for share options exercised in 2013 54.96 59.90 nA 61.38 55.47 29.00 32.63
Provisionasat12/31/2012(in€millions) 53 212 NA 36 137 39 51
provision as at 12/31/2013 (in € millions) 41 115 32 3 183 20 24
Expenserecognizedin2011(in€millions) NA NA NA −8 28 NA NA
Expenserecognizedin2012(in€millions) 53 216 NA 20 74 38 21
Expenserecognizedin2013(in€millions) −11 118 34 −28 83 10 21
Cash-settled plans granted to SAp employees (except for employees of SFSF and Ariba)
a.1) Employee Participation Plan (EPP) and Long-Term Incentive Plan (LTI Plan) 2015 SAPimplementedtwonewshare-basedpaymentsin2012:anEmployeeParticipationPlan(EPP)2015foremployeesandaLong-TermIncentive(LTI)Plan2015formembersoftheGlobalManagingBoard.
TheplansarefocusedonSAP’ssharepriceandtheachieve- mentoftwofinancialkeyperformanceindicators(KPIs):non-IFRStotalrevenueandnon-IFRSoperatingprofit,whicharederivedfromtheCompany’s2015financialKPIs.Undertheseplans,virtualshares,calledrestrictedshareunits(RSUs),aregrantedtoparticipants.ParticipantsarepaidoutincashbasedonthenumberofRSUsthatvest.
TheRSUsweregrantedandallocatedatthebeginningofeachyearthrough2015,withEPP2015RSUssubjecttoannualExecutiveBoardapproval.ParticipantsintheLTIPlan2015havealreadybeengrantedabudgetfortheyears2012to2015(2013to2015fornewplanparticipantsin2013).AllparticipantsintheLTIPlan2015aremembersoftheGlobalManagingBoard.
TheRSUallocationprocesswilltakeplaceatthebeginningofeachyearbasedonSAP’ssharepriceafterthepublication ofitspreliminaryannualresultsforthelastfinancialyearpriortotheperformanceperiod.
Attheendofthegivenyear,thenumberofRSUsthatfinallyvestwithplanparticipantsdependsonSAP’sactualper- formanceforthegivenyear,andmightbehigherorlowerthanthenumberofRSUsoriginallygranted.IfperformanceagainstbothKPItargetsreachesatleastthedefined80%threshold,theRSUsvest.Dependingonperformance,thevestingcanreachamaximumof150%ofthebudgetedamount.IfperformanceagainsteitherorbothofthoseKPItargetsdoesnotreachthedefinedthresholdof80%,noRSUsvestandRSUsgrantedforthatyearwillbeforfeited.Fortheyear2013,theRSUsgrantedatthebeginningoftheyearvestedwith92.97%(2012:133.55%)achievementoftheKPItargets.
253Notes to the Consolidated Financial Statements

Monetarybenefitsarecappedat110%ofthegrantprice(€30.80).Thedynamicexercisepriceatvaluationdateis€66.29.
a.3) SAP Stock Option Plan 2010 (SOP 2010 (2010 – 2013 Tranches))UndertheSAPStockOptionPlan2010,wegrantedmembersoftheSeniorLeadershipTeam/GlobalExecutives,SAP’s TopRewards(employeeswithanexceptionalrating/highpotentials)between2010and2013andonlyin2010and2011membersoftheExecutiveBoardcash-basedvirtualstockoptions,thevalueofwhichdependsonthemulti-yearper- formanceoftheSAPshare.
Thegrant-basevalueisbasedontheaveragefairmarketvalueofoneordinaryshareoverthefivebusinessdayspriortotheExecutiveBoardresolutiondate.
ThevirtualstockoptionsgrantedundertheSOP2010givetheemployeestherighttoreceiveacertainamountofmoney byexercisingtheoptionsunderthetermsandconditionsofthisplan.Afterathree-yearvestingperiod(fouryearsformembers oftheExecutiveBoard),theplanprovidesfor11predeterminedexercisedateseverycalendaryear(onedatepermonthexceptinApril)untiltherightslapsesixyearsafterthegrantdate(sevenyearsformembersoftheExecutiveBoard).EmployeescanexercisetheirvirtualstockoptionsonlyiftheyareemployedbySAP;iftheyleavetheCompany,theyforfeitthem.ExecutiveBoardmembers’optionsarenon-forfeitableoncegranted– iftheserviceagreementendsinthegrantyear,thenumberofoptions is reduced proratatemporis.Anyoptionsnotexer- cisedattheendoftheirtermexpire.
Theexercisepriceis110%ofthegrantbasevalue(115%formembersoftheExecutiveBoard)whichis€39.03(€40.80)forthe2010tranche,€46.23(€48.33)forthe2011tranche,€49.28forthe2012tranche,and€59.85forthe2013tranche.
Monetarybenefitswillbecappedat100%oftheexerciseprice(150%formembersoftheExecutiveBoard).
UndertheEPP2015,theRSUsarepaidoutinthefirstquarteroftheyearaftertheone-yearperformanceperiod,whereas theRSUsformembersoftheGlobalManagingBoardundertheLTIPlan2015aresubjecttoathree-year-holdingperiodbeforepayout,whichoccursstartingin2016.
Theplansincludea“look-back”provision,duetothefactthattheseplansarebasedonreachingcertainKPIlevelsin2015. Iftheoverallachievementin2015ishigherorlowerthanrepresentedbythenumberofRSUsvestedfrom2012to2014,thenumberofRSUsgrantedin2015canincreaseordecreaseaccordingly.However,RSUsthatwerealreadyfullyvestedinprioryearscannotbeforfeited.FortheEPP,theapplicationofthe“look-back”-provisionissubjecttoapprovalbytheExecutiveBoardin2015.
ThefinalfinancialeffectofeachtrancheoftheEPP2015 andtheLTIPlan2015willdependonthenumberofvestedRSUsandtheSAPshareprice,whichissetdirectlyafter theannouncementofthepreliminaryfourthquarterandfull-yearresultsforthelastfinancialyearundertheEPP2015 (oftherespectivethree-yearholdingperiodundertheLTIPlan2015),andthusmaybesignificantlyaboveorbelowthebudgeted amounts.
a.2) SOP Performance Plan 2009 (SOP PP)UndertheSOPPerformancePlan2009,wegrantedto topexecutivesandtopperformerscash-basedvirtualstockoptions,thevalueofwhichdependsonthemulti-yearperformanceoftheSAPsharerelativetoanindustry-specificsharepriceindex,theTechPGI.
ThefuturepayoutattheexercisedatewillbebasedontheoutperformanceoftheSAPsharepriceovertheTechPGI.ExerciseisonlypossibleiftheSAPsharepricehasoutper- formedtheTechPGI.Forthatpurpose,theSOPPP2009agreementdefinestheinitialvalueoftheTechPGI(€97.54)aswellastheSAPinitialexerciseprice(€28.00pershare).After avestingperiodoftwoyears,theplanprovidesfor4prede- terminedexercisedateseverycalendaryearuntiltherightslapsefiveyearsafterthegrantdate.ThelatestpossibleexercisedayforeligibleemployeeswillbeinMarch2014.
254 Consolidated Financial Statements IFRS
thenumberofRSUsthatcanvestiscappedat200%of thenumberoriginallygranted.PerformanceagainsttheKPItargetswas100%infiscalyear2013.
TheRSUsarepaidoutincashuponvesting.
a.5) SuccessFactors Cash-Settled Awards Replacing Pre-Acquisition SuccessFactors Awards (SFSF Rights)InconjunctionwiththeacquisitionofSuccessFactorsin2012,underthetermsoftheacquisitionagreement,SAPexchangedunvestedRestrictedStockAwards(RSAs),RestrictedStockUnits(RSUs),andPerformanceStockUnits(PSUs)heldbyemployeesofSuccessFactorsforcash-settledshare-basedpaymentawardsofSAP(SFSFRights).
RSAs,RSUs,andPSUsunvestedattheclosingoftheacqui- sitionwereconvertedintotherighttoreceive,attheoriginallyagreedvestingdates,anamountincashequaltothenumberofRSAsandRSUsheldatthevestingdatemultipliedbyUS$40.00pershare.
Therewere4.5millionunvestedRSAs,RSUs,andPSUsat theacquisitiondate,representingafairvalueof€128millionafter considering forfeitures dependent on grant dates and remainingvestingperiods.Ofthetotalfairvalue,€59millionwas allocated to consideration transferred and €68 million was allocatedtofutureservicestobeprovidedandwillberecog- nizedaspost-acquisitioncompensationexpenseastheawardsvestovertheremainderoftheoriginalvestingterms–theremainingvestingperiodforsuchSuccessFactorsRightsareinarangeofuptofouryearsfromtheacquisitiondate.FromJanuary1,2013,toDecember31,2013,0.8millionSFSFRightsvested.TheunrecognizedexpenserelatedtoSFSFRightswas€11 million as at December 31, 2013, and will be recognized overaremainingvestingperiodofupto2.0years.
Cash-settled plans granted to employees of SFSF and Ariba
a.4) Restricted Stock Unit Plan 2013 (RSU 2013)Wemaintainshare-basedpaymentplansthatallowfortheissuanceofrestrictedstockunits(RSU)toretainandmotivateexecutivesandcertainemployeesoftheSuccessFactorsandAribabusinesses,whichweacquiredin2012.
UndertheRSU2013Plan,wegrantedacertainnumberofRSUsthroughout2013representingacontingentrighttoreceiveacashpaymentdeterminedbythemarketvalueof thesamenumberofSAPAGAmericanDepositoryReceipts ontheNewYorkStockExchangeandthenumberofRSUsthatultimatelyvest.GrantedRSUswillvestindifferenttranches,either:–Overaone-to-threeyearserviceperiodonly,or–Overaone-to-threeyearserviceperiodanduponmeetingcertainkeyperformanceindicators(KPIs).
ThenumberofRSUsthatcouldvestforSuccessFactorsemployeesundertheperformance-basedgrantswascontingentuponaweightedachievementofperformancemilestonesforthefiscalyearendedDecember31,2013 relatedto:–Specificindicatorsofcloudsubscriptionsandsupportrevenue(80%)and
–Profitcontributionofsuchspecificindicatorsofcloudsubscriptionsandsupportrevenue(20%).
Dependingonperformance,thenumberofRSUsvestingcouldhaverangedbetween80%and140%ofthenumberinitiallygranted.PerformanceagainsttheKPItargetswassetat100%infiscalyear2013.
ThenumberofRSUsthatcouldvestforAribaemployees undertheperformance-basedgrantswascontingentuponachievementofperformancemilestonesforthefiscalyearendedDecember31,2013relatedtospecificindicatorsofgrowthincloudsubscriptionsandsupportrevenue.TheKPItargetsincludedaminimumthresholdforatleast50%vesting.IfperformanceagainsttheKPItargetshadnotexceededtheminimumthreshold,noRSUswouldhavevested.Additionally,
255Notes to the Consolidated Financial Statements
a.6) Ariba Cash-Settled Awards Replacing Pre-Acquisition Ariba Awards (Ariba Rights)ThetermsoftheacquisitionagreementunderwhichSAPacquiredAribain2012requiredSAPtoexchangeunvestedRestrictedStockAwards(RSAs)andRestrictedStockUnits(RSUs)heldbyemployeesofAribaforcash-settledshare-basedpaymentawardsofSAP(AribaRights).
RSAsandRSUsunvestedattheclosingoftheacquisition wereconvertedintotherighttoreceiveanamountincashequal tothenumberofRSAsandRSUsheldatthevestingdatemultipliedbyUS$45.00pershareinaccordancewiththeres- pective vesting terms.
Therewere4.1millionunvestedRSAsandRSUsattheacqui- sition date, representing a fair value of €138 million after consideringforfeituresdependentongrantdatesandremain- ingvestingperiods.Ofthetotalfairvalue,€86millionwasallocated to consideration transferred and €52 million was allocated to future services to be provided and will be recognized aspost-acquisitioncompensationexpenseastheawardsvestovertheremainderofthevestingterms–theremainingvestingperiodforsuchAribaRightsareinarangeofupto 3.5yearsatacquisitiondate(inaccordancewiththeoriginallyagreedvestingdates).FromJanuary1,2013,toDecember31,2013,1.4millionAribaRightsvested.TheunrecognizedexpenserelatedtoAribaRightswas€7millionasatDecember31, 2013, and will be recognized over a remaining vesting periodofupto1.75years.
b) Equity-Settled Share-Based PaymentsEquity-settledplansincludeprimarilytheShareMatchingPlan(SMP).
UndertheShareMatchingPlan(SMP)implementedin2010,SAPoffersitsemployeestheopportunitytopurchaseSAPAGsharesatadiscountof40%.ThenumberofSAPsharesaneligibleemployeemaypurchasethroughtheSMPislimitedtoapercentageoftheemployee’sannualbasesalary.Afterathree-yearholdingperiod,suchplanparticipantswillreceiveone(in2012:five)freematchingshareofSAPforeverythreeSAPsharesacquired.
ThetermsforthemembersoftheSeniorLeadershipTeam/GlobalExecutivesareslightlydifferentthanthosefortheotheremployees.Theydonotreceiveadiscountwhenpurchasingtheshares.However,afterathree-yearholdingperiod,theyreceivetwo(in2012:five)freematchingSAPsharesforeverythreeSAPsharesacquired.ThisplanisnotopentomembersoftheSAPExecutiveBoard.
256 Consolidated Financial Statements IFRS
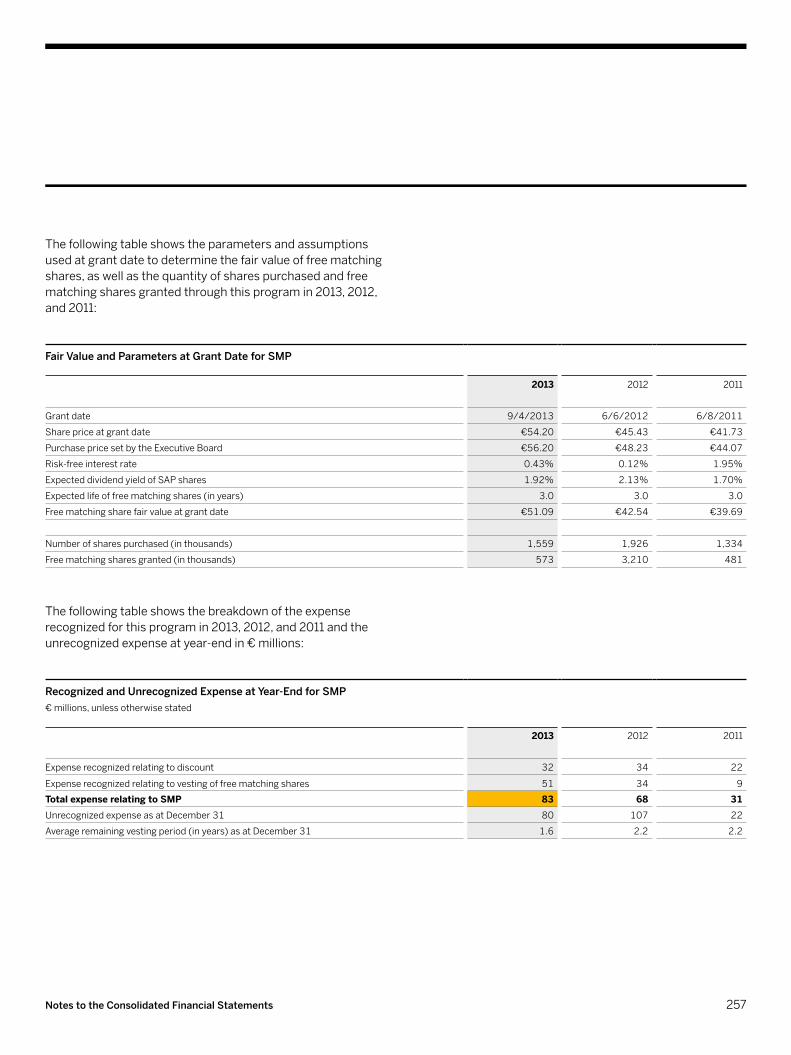
Thefollowingtableshowstheparametersandassumptionsusedatgrantdatetodeterminethefairvalueoffreematchingshares,aswellasthequantityofsharespurchasedandfreematchingsharesgrantedthroughthisprogramin2013,2012,and2011:
Fair Value and Parameters at Grant Date for SMP
2013 2012 2011
Grant date 9/4/2013 6/6/2012 6/8/2011
Sharepriceatgrantdate €54.20 €45.43 €41.73
PurchasepricesetbytheExecutiveBoard €56.20 €48.23 €44.07
Risk-freeinterestrate 0.43% 0.12% 1.95%
ExpecteddividendyieldofSAPshares 1.92% 2.13% 1.70%
Expectedlifeoffreematchingshares(inyears) 3.0 3.0 3.0
Freematchingsharefairvalueatgrantdate €51.09 €42.54 €39.69
Numberofsharespurchased(inthousands) 1,559 1,926 1,334
Freematchingsharesgranted(inthousands) 573 3,210 481
Thefollowingtableshowsthebreakdownoftheexpenserecognizedforthisprogramin2013,2012,and2011andtheunrecognizedexpenseatyear-endin€millions:
Recognized and Unrecognized Expense at Year-End for SMP€millions,unlessotherwisestated
2013 2012 2011
Expenserecognizedrelatingtodiscount 32 34 22
Expenserecognizedrelatingtovestingoffreematchingshares 51 34 9
Total expense relating to SMP 83 68 31UnrecognizedexpenseasatDecember31 80 107 22
Averageremainingvestingperiod(inyears)asatDecember31 1.6 2.2 2.2
257Notes to the Consolidated Financial Statements
(28) SEGmEnt AnD GEOGrAphIC InFOrmAtIOn
General InformationOurinternalreportingsystemproducesreportsinwhichbusinessactivitiesarepresentedinavarietyofways,forexample,bylineofbusiness,geography,andareasofresponsibilityoftheindividualBoardmembers.Basedonthesereports,theExecutiveBoard,whichisresponsibleforassessingtheperformanceofvariouscompanycomponentsandmakingresourceallocationdecisionsasourChiefOperatingDecisionMaker(CODM),evaluatesbusinessactivitiesinanumberofdifferentways.
SAPhastwodivisions–On-PremiseandCloud,whicharefurtherdividedintooperatingsegments.OurOn-Premisedivisioniscomprisedoftwooperatingsegments:On-PremiseProductsandOn-PremiseServices,andourClouddivisioniscomprisedoftwooperatingsegments:CloudApplicationsandAriba.Alloperatingsegments are reportable segments.
OnAugust1,2013,SAPacquiredhybrisAG.Sincethemajorityofhybris’activitiesarecurrentlydeliveredinanon-premisemodel,themajorityofhybris’activitiesarecorrespondinglyreflectedintheOn-Premisesegments.
Themostimportantfactorsweusetoidentifyoperatingsegments are distinctions among our product and service offerings,notably:–Betweendivisions,thesoftwaredeliverymodel(softwaretobeinstalledonthecustomer’shardware(on-premisesoftware),asdistinctfromsoftwarefordeliveryinthecloud)
–WithintheOn-Premisedivision,thetypesofservicesoffered–WithintheClouddivision,thefieldsinwhichthecloud
applications are used
TheOn-Premisedivisionderivesitsrevenuesprimarilyfromthesaleofon-premisesoftware(thatis,softwaredesigned foruseonhardwareonthecustomer’spremises),mobilesoftware(thatis,softwaredesignedforuseonmobiledevices),andservicesrelatingtosuchsoftware.WithintheOn-Premisedivision,theOn-PremiseProductssegmentisprimarilyengagedinmarketingandlicensingouron-premiseandmobilesoftwareproductsandprovidingsupportservicesforthesesoftwareproducts.TheOn-PremiseServicessegmentprimarilyperformsvariousprofessionalservices,mainlyimplementationservices of our software products and educational services on theuseofoursoftwareproducts.
TheClouddivisionderivesitsrevenuesprimarilyfromthe saleofcloudsoftware(thatis,softwaredesignedfordeliverythroughthecloud)andservicesrelatingtosuchsoftware(includingsupportservices,professionalservices,andeduca- tionalservices).WithintheClouddivision,theCloudApplicationssegmentisprimarilyengagedinmarketingandsellingsubscriptionstothecloudsoftwareofferingsdevelopedbySAPandSuccessFactors.TheAribasegmentprimarilymarketsandsellsthecloudsoftwareofferingsdevelopedbyAribaandderivesrevenuefromitscloud-basedcollaborativebusiness network.
258 Consolidated Financial Statements IFRS

Information About profit or loss, Assets, and liabilities
Operating Segments Revenue and Profit or Loss€ millions
On-PremiseDivision CloudDivision TotalOn-Premise
ProductsOn-Premise
ServicesDivision
TotalCloud
ApplicationsAriba Division
Total
2013Software 4,517 0 4,517 1 0 1 4,518
Cloudsubscriptionsandsupport 0 0 0 412 344 757 757
Software and cloud subscriptions 4,517 0 4,517 413 345 758 5,275
Support 8,710 0 8,710 16 30 46 8,756
Software and software-related service revenue 13,227 0 13,227 429 375 804 14,032Professional services and other service revenue 0 2,695 2,695 85 85 170 2,865
Total revenue 13,227 2,695 15,923 514 461 975 16,897Cost of revenue −2,020 −2,134 −4,154 −178 −180 −358 −4,512
Gross profit 11,207 562 11,769 336 281 617 12,385Costofsalesandmarketing −3,447 0 −3,447 −328 −151 −479 −3,926
Reportable segment profit/loss 7,760 562 8,322 8 130 138 8,4602012
Software 4,656 0 4,656 2 0 2 4,658
Cloudsubscriptionsandsupport 0 0 0 257 86 343 343
Software and cloud subscriptions 4,656 0 4,656 259 86 345 5,001
Support 8,226 0 8,226 10 10 20 8,246
Software and software-related service revenue 12,881 0 12,881 269 96 365 13,246Professional services and other service revenue 0 2,967 2,967 67 25 91 3,058
Total revenue 12,881 2,967 15,848 336 120 456 16,304Cost of revenue −1,994 −2,306 −4,300 −163 −72 −234 −4,533
Gross profit 10,887 661 11,549 173 49 222 11,771Costofsalesandmarketing −3,414 0 −3,414 −231 −43 −275 −3,689
Reportable segment profit/loss 7,473 661 8,134 −59 5 −53 8,0822011
Software 4,105 0 4,105 0 2 2 4,107
Cloudsubscriptionsandsupport 0 0 0 18 0 18 18
Software and cloud subscriptions 4,105 0 4,105 18 2 20 4,125
Support 7,220 0 7,220 0 0 1 7,220
Software and software-related service revenue 11,325 0 11,325 18 2 20 11,346Professional services and other service revenue 0 2,901 2,901 12 1 13 2,914
Total revenue 11,325 2,901 14,226 29 4 33 14,260Cost of revenue −1,762 −2,201 −3,963 −66 −9 −75 −4,038
Gross profit 9,564 700 10,264 −37 −5 −42 10,222Costofsalesandmarketing −2,919 0 −2,919 −32 −2 −34 −2,954
Reportable segment profit/loss 6,644 700 7,344 −69 −7 −76 7,268
259Notes to the Consolidated Financial Statements
Segmentasset/liabilityinformationisnotregularlyprovided toourCODM.GoodwillbyoperatingsegmentisdisclosedinNote(15).
Measurement and PresentationOurmanagementreportingsystemreportsourintersegmentservicesascostreductionsanddoesnottrackthemasinternalrevenue.Intersegmentservicesmainlyrepresentutilization ofhumanresourcesofonesegmentbyanothersegmentonaproject-by-projectbasis.Intersegmentservicesarechargedbasedoninternalcostratesincludingcertainindirectoverheadcosts,excludingaprofitmargin.
Mostofourdepreciationandamortizationexpenseaffectingoperatingsegmentprofitsisallocatedtothesegmentsaspartofbroaderinfrastructureallocationsandisthusnottrackedseparatelyontheoperatingsegmentlevel.Depreciationandamortizationexpensethatisdirectlyallocatedtotheoperatingsegments is immaterial in all operating segments presented.
Theaccountingpoliciesappliedinthemeasurementsoftheoperatingsegments’revenuesandprofitsdifferfromIFRSaccounting principles described in Note(3)asfollows:–Themeasurementsoftheoperatingsegmentsrevenuesandprofitsgenerallyattributerevenuetothesegmentbasedonthenatureofthebusinessregardlessofrevenueclassificationinourincomestatement.Thus,forexample, theCloudApplicationssegment’srevenuemayincludecer- tainamountsclassifiedassoftwarerevenueinourConsolidatedIncomeStatements.
–Themeasurementsoftheoperatingsegments’revenuesandprofitsincludestherecurringrevenuesthatwouldhavebeenreflectedbyacquiredentitieshaditremainedastand-aloneentitybutwhicharenotreflectedasrevenueunderIFRS asaresultofpurchaseaccountingforcustomercontractsineffectatthetimeofanacquisition.
–Themeasurementsoftheoperatingsegments’profitsexcludesshare-basedpaymentexpense,andrestructuringcostsaswellasresearchanddevelopmentexpenseandgeneralandadministrationexpenseatsegmentlevel.TheseexpensesaremanagedandreviewedattheGrouplevelonly.
–Themeasurementsoftheoperatingsegments’profitsexcludethefollowingacquisition-relatedcharges:Amortizationexpense/impairmentchargesofintangiblesacquiredinbusinesscombinationsandcertainstand-aloneacquisitionsofintellectualpropertyExpensesfrompurchasedin-processresearchanddevelopment Restructuringexpensesandsettlementsofpre-existingrelationshipsAcquisition-relatedthird-partycoststhatarerequired tobeexpensed
–Themeasurementsoftheoperatingsegments’profitsexcludesresultsofthediscontinuedoperationsthatqualifyassuchunderIFRSinallrespectsexceptiftheydonotrepresentamajorlineofbusiness.ForallperiodspresentedthisrelatesexclusivelytotheoperationsofTomorrowNow.
CostofrevenueforourOn-PremiseServicessegmentalsoincludessalesandmarketingexpensesrelatedtoprofessionalservicesandotherservicesthatresultfromsalesandmarketing effortsthatcannotbeclearlyseparatedfromprovidingtheservices.Forthisreason,nosalesandmarketingexpensesassuchhavebeenallocatedtothissegment.
260 Consolidated Financial Statements IFRS
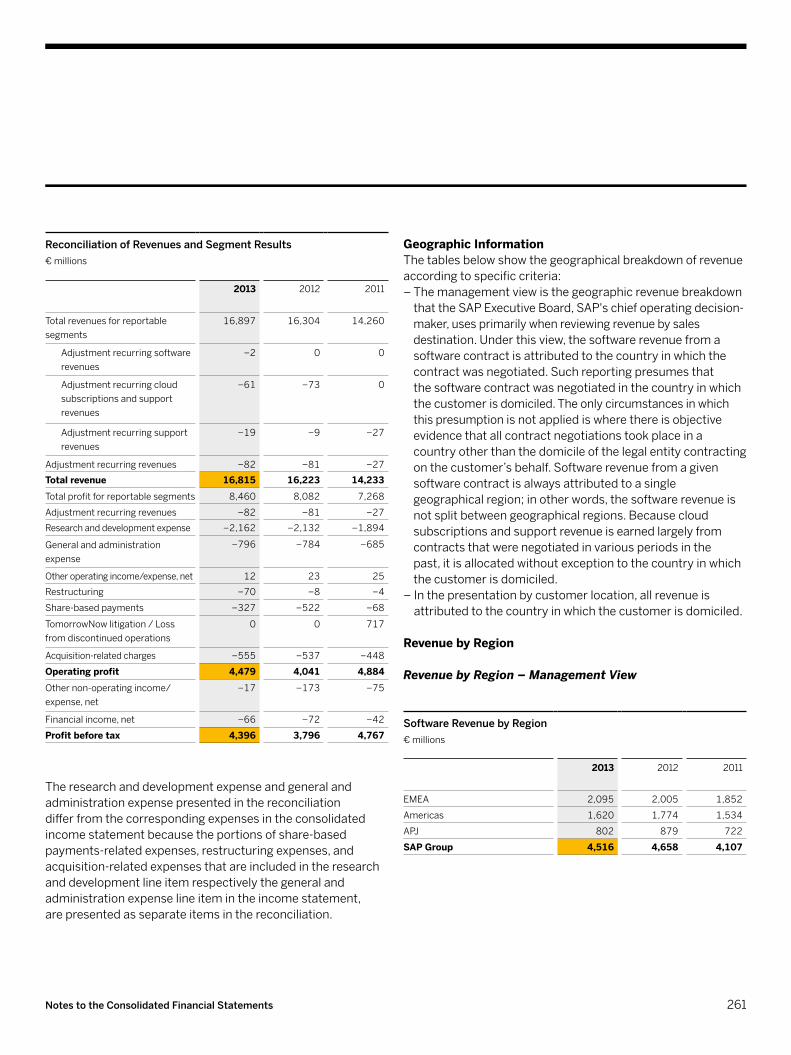
Geographic Information Thetablesbelowshowthegeographicalbreakdownofrevenueaccordingtospecificcriteria:–ThemanagementviewisthegeographicrevenuebreakdownthattheSAPExecutiveBoard,SAP'schiefoperatingdecision-maker,usesprimarilywhenreviewingrevenuebysales destination.Underthisview,thesoftwarerevenuefromasoftwarecontractisattributedtothecountryinwhichthecontractwasnegotiated.Suchreportingpresumesthat thesoftwarecontractwasnegotiatedinthecountryinwhich thecustomerisdomiciled.Theonlycircumstancesinwhichthispresumptionisnotappliediswherethereisobjectiveevidencethatallcontractnegotiationstookplaceinacountryotherthanthedomicileofthelegalentitycontractingonthecustomer’sbehalf.Softwarerevenuefromagivensoftwarecontractisalwaysattributedtoasinglegeographicalregion;inotherwords,thesoftwarerevenueisnotsplitbetweengeographicalregions.Becausecloudsubscriptionsandsupportrevenueisearnedlargelyfromcontractsthatwerenegotiatedinvariousperiodsinthe past,itisallocatedwithoutexceptiontothecountryinwhichthecustomerisdomiciled.
–Inthepresentationbycustomerlocation,allrevenueisattributedtothecountryinwhichthecustomerisdomiciled.
Revenue by Region
Revenue by Region – Management View
Software Revenue by Region € millions
2013 2012 2011
EMEA 2,095 2,005 1,852
Americas 1,620 1,774 1,534
APJ 802 879 722
SAp Group 4,516 4,658 4,107
Reconciliation of Revenues and Segment Results € millions
2013 2012 2011
Total revenues for reportable segments
16,897 16,304 14,260
Adjustment recurring software revenues
−2 0 0
Adjustment recurring cloud subscriptions and support revenues
−61 −73 0
Adjustment recurring support revenues
−19 −9 −27
Adjustment recurring revenues −82 −81 −27
Total revenue 16,815 16,223 14,233
Total profit for reportable segments 8,460 8,082 7,268
Adjustment recurring revenues −82 −81 −27
Researchanddevelopmentexpense −2,162 −2,132 −1,894
General and administration expense
−796 −784 −685
Otheroperatingincome/expense,net 12 23 25
Restructuring −70 −8 −4
Share-basedpayments −327 −522 −68
TomorrowNowlitigation/Lossfrom discontinued operations
0 0 717
Acquisition-relatedcharges −555 −537 −448
Operating profit 4,479 4,041 4,884
Othernon-operatingincome/ expense,net
−17 −173 −75
Financialincome,net −66 −72 −42
Profit before tax 4,396 3,796 4,767
Theresearchanddevelopmentexpenseandgeneralandadministrationexpensepresentedinthereconciliation differfromthecorrespondingexpensesintheconsolidatedincomestatementbecausetheportionsofshare-basedpayments-relatedexpenses,restructuringexpenses,andacquisition-relatedexpensesthatareincludedintheresearchanddevelopmentlineitemrespectivelythegeneralandadministrationexpenselineitemintheincomestatement, arepresentedasseparateitemsinthereconciliation.
261Notes to the Consolidated Financial Statements
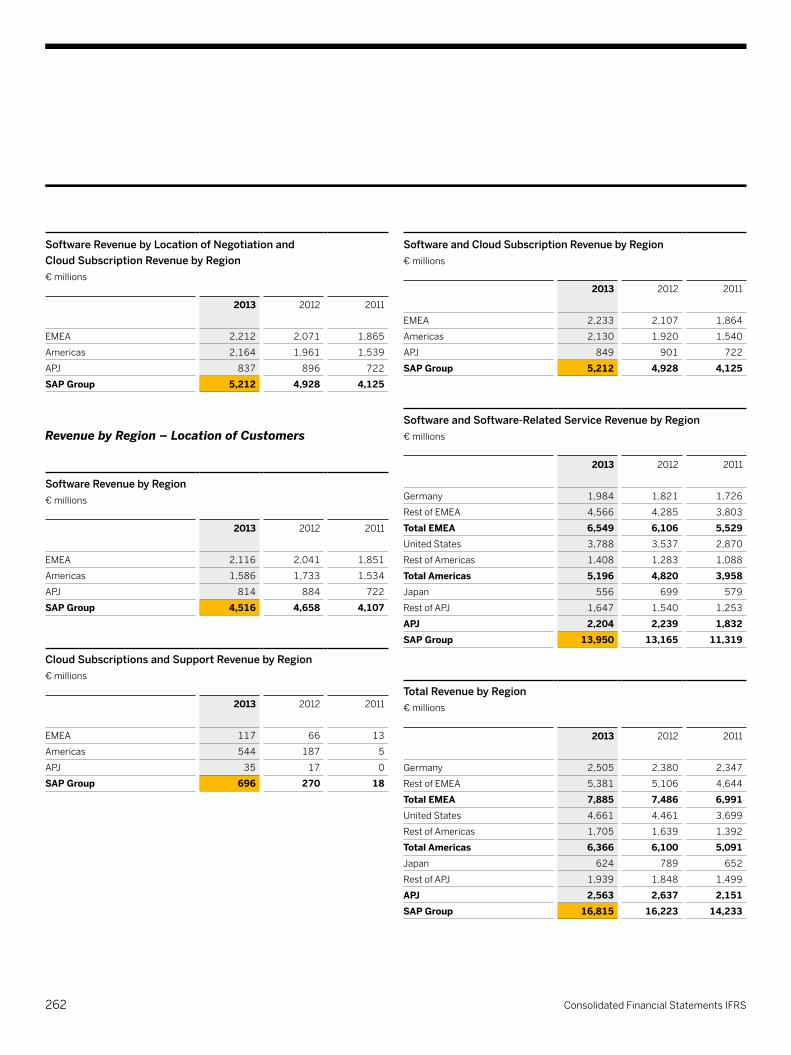
Software and Cloud Subscription Revenue by Region€ millions
2013 2012 2011
EMEA 2,233 2,107 1,864
Americas 2,130 1,920 1,540
APJ 849 901 722
SAp Group 5,212 4,928 4,125
Software and Software-Related Service Revenue by Region € millions
2013 2012 2011
Germany 1,984 1,821 1,726
RestofEMEA 4,566 4,285 3,803
total EmEA 6,549 6,106 5,529UnitedStates 3,788 3,537 2,870
RestofAmericas 1,408 1,283 1,088
total Americas 5,196 4,820 3,958Japan 556 699 579
RestofAPJ 1,647 1,540 1,253
ApJ 2,204 2,239 1,832SAp Group 13,950 13,165 11,319
Total Revenue by Region € millions
2013 2012 2011
Germany 2,505 2,380 2,347
RestofEMEA 5,381 5,106 4,644
total EmEA 7,885 7,486 6,991UnitedStates 4,661 4,461 3,699
RestofAmericas 1,705 1,639 1,392
total Americas 6,366 6,100 5,091Japan 624 789 652
RestofAPJ 1,939 1,848 1,499
ApJ 2,563 2,637 2,151SAp Group 16,815 16,223 14,233
Software Revenue by Location of Negotiation and Cloud Subscription Revenue by Region € millions
2013 2012 2011
EMEA 2,212 2,071 1,865
Americas 2,164 1,961 1,539
APJ 837 896 722
SAp Group 5,212 4,928 4,125
Revenue by Region – Location of Customers
Software Revenue by Region€ millions
2013 2012 2011
EMEA 2,116 2,041 1,851
Americas 1,586 1,733 1,534
APJ 814 884 722
SAp Group 4,516 4,658 4,107
Cloud Subscriptions and Support Revenue by Region € millions
2013 2012 2011
EMEA 117 66 13
Americas 544 187 5
APJ 35 17 0
SAp Group 696 270 18
262 Consolidated Financial Statements IFRS

Non-Current Assets € millions
2013 2012
Germany 2,337 2,318
France 2,112 2,120
RestofEMEA 4,161 3,251
EmEA 8,610 7,689UnitedStates 9,823 10,395
RestofAmericas 123 97
Americas 9,946 10,492Japan 19 22
RestofAPJ 204 216
ApJ 223 238SAp Group 18,779 18,418
Non-currentassetsaspresentedinthetableabovefollowtherequirementsofIFRS8forageographicalbreakdownof non-currentassetsexcludingfinancialinstruments,deferredtaxassets,post-employmentbenefits,andrightsarising under insurance contracts.
Forinformationaboutthebreakdownofourfull-timeequivalentemployeenumbersbyregion,seeNote(7). (29) bOArD OF DIrECtOrS
Executive boardMembershipsonsupervisoryboardsandothercomparablegoverningbodiesofenterprises,otherthansubsidiaries of SAP on December 31, 2013
Bill McDermott Co-ChiefExecutiveOfficerStrategy,Governance,BusinessDevelopment, CorporateDevelopment,SalesandEcosystemActivitiesCommunicationsandMarketing
BoardofDirectors,ANSYS,Inc.,Canonsburg, Pennsylvania,UnitedStatesBoardofDirectors,UnderArmour,Inc.,Baltimore, Maryland,UnitedStates
Jim Hagemann Snabe Co-ChiefExecutiveOfficerStrategy,Governance,BusinessDevelopment, CorporateDevelopment,CommunicationsandMarketing
BoardofDirectors,Bang&Olufsena/s,Stuer,DenmarkBoardofDirectors,TheDanskeBankGroup,Copenhagen,Denmark(fromMarch18,2013)SupervisoryBoard,SiemensAG,Munich,Germany (fromOctober1,2013)
Dr. Werner BrandtChiefFinancialOfficer,LaborRelationsDirectorFinanceandAdministrationincludingInvestorRelations andDataProtection&PrivacyHumanResources
SupervisoryBoard,DeutscheLufthansaAG, FrankfurtamMain,GermanySupervisoryBoard,QIAGENN.V.,Venlo,theNetherlandsSupervisoryBoard,RWEAG,Essen,Germany (fromApril18,2013)
Gerhard OswaldBoardAreaScaleQuality&SupportSAPActiveGlobalSupport,SAPHANAEnterpriseCloud, CloudDelivery,QualityGovernance&Production,Solution&KnowledgePackaging,SAPLabsNetwork(jointleadershipwithVishalSikka)
263Notes to the Consolidated Financial Statements
ChairmanoftheBoardofDirectors,BlykInternationalLtd.,London,UKChairmanoftheBoardofDirectors,HuhtamäkiOyj, Espoo,Finland
Panagiotis Bissiritsas 1), 2), 6)
SupportExpert
Prof. Anja Feldmann 5), 9)
ProfessorattheElectricalEngineeringandComputerScienceFacultyattheTechnischeUniversitätBerlin
Prof. Dr. Wilhelm Haarmann 2), 6), 8), 9)
Attorney-at-law,certifiedpublicauditor,certifiedtaxadvisorLinklatersLLP,Rechtsanwälte,Notare,Steuerberater, FrankfurtamMain,Germany
ChairmanoftheSupervisoryBoard,CinemaxXAG, Hamburg,Germany
Margret Klein-Magar 1), 2), 5), 8)
VicePresident,HeadofPeoplePrinciples
Lars Lamadé 1), 2), 8), 9)
ProjectManagerOPDCOO
DeputyChairmanoftheSupervisoryBoard, Rhein-Neckar-LoewenGmbH,Kronau,Germany
Bernard Liautaud 2), 5), 7)
GeneralPartnerBaldertonCapital,London,UK
BoardofDirectors,nlyteSoftwareLtd.,London,UKBoardofDirectors,TalendSA,Suresnes,FranceBoardofDirectors,CapGemini,Paris,France (untilOctober8,2013)BoardofDirectors,Quickbridge(UK)Ltd.,London,UKBoardofDirectors,SCYTLSecureElectronicVotingSA,Barcelona, Spain
Dr. Vishal Sikka Products&InnovationGlobalProductDevelopmentincludingSAPHANA, CustomDevelopment,Design&UserExperience,GlobalResearch,SAPLabsNetwork(jointleadershipwithGerhardOswald)
Board Members Who Left During 2013Lars Dalgaard (untilMay31,2013)Luisa Deplazes Delgado(untilJune30,2013)
Supervisory boardMembershipsonsupervisoryboardsandothercomparablegoverningbodiesofenterprises,otherthansubsidiaries of SAP on December 31, 2013
Prof. Dr. h. c. mult. Hasso Plattner 2), 4), 5), 7), 8), 9)
Chairman
BoardofDirectors,Bramasol,Inc.,SanFrancisco, California,USA(untilJuly1,2013)SupervisoryBoard,OligoLichttechnikGmbH,Hennef,Germany
Christiane Kuntz-Mayr 1), 4), 5), 9)
DeputyChairpersonDeputyChairpersonoftheWorksCouncilatSAPAG
Pekka Ala-Pietilä 5), 7), 8)
ChairmanoftheBoardofDirectors,SolidiumOy, Helsinki,Finland
BoardofDirectors,PöyryPlc,Vantaa,FinlandChairmanoftheBoardofDirectors,CVONGroupLimited,London,UKBoardofDirectors,CVONLimited,London,UKChairmanoftheBoardofDirectors,CVONInnovation ServicesOy,Turku,FinlandBoardofDirectors,CVONFutureLimited,London,UK
264 Consolidated Financial Statements IFRS
BoardofDirectors,AbiquoGroupInc.,RedwoodCity,California,UnitedStatesBoardofDirectors,VestiaireCollectiveSA, Levallois-Perret,FranceBoardofDirectors,Dashlane,Inc.,NewYork,NewYork, UnitedStatesBoardofDirectors,RecordedFuture,Inc.,Cambridge,Massachusetts,UnitedStatesBoardofDirectors,eWiseGroup,Inc.,RedwoodCity, California,UnitedStatesBoardofDirectors,QubitDigitalLtd.,London,UK
Dr. h. c. Hartmut Mehdorn 4), 6), 9)
CEOofFBB,FlughafenBerlin-BrandenburgGmbH,Berlin,Germany
BoardofDirectors,AirBerlinPLC&Co.LuftverkehrsKG, Berlin(untilJanuary7,2013)AdvisoryBoard,Fiege-Gruppe,Greven,GermanyBoardofDirectors,RZD–RussianRailways,Moscow,Russia
Dr. Kurt Reiner 1), 5), 6)
DevelopmentExpert
Mario Rosa-Bian 1), 4), 9)
ProjectPrincipalConsultant
Dr. Erhard Schipporeit 3), 8)
IndependentManagementConsultant
SupervisoryBoard,TalanxAG,Hanover,GermanySupervisoryBoard,DeutscheBörseAG,FrankfurtamMain,GermanySupervisoryBoard,HDIV.a.G.,Hanover,GermanySupervisoryBoard,HannoverRückversicherungSE, Hanover,GermanySupervisoryBoard,FuchsPetrolubSE,Mannheim,GermanySupervisoryBoard,BDOAG,Hamburg,GermanyBoardofDirectors,TUITravelPLC,London,UKBoardofDirectors,FidelityFundsSICAV,Luxembourg
Stefan Schulz 1), 3), 5), 9)
VicePresident,IPatHANAEnterpriseCloud
SupervisoryBoard,ORTECInternationalBeheerB.V.,Zoetermeer,theNetherlands(fromJune17,2013)
Inga Wiele 1), 3), 5)
SeniorInternalStrategicConsultant
Prof. Dr.-Ing. Dr.-Ing. E. h. Klaus Wucherer 3), 5)
ManagingDirectorofDr.KlausWuchererInnovations-undTechnologieberatungGmbH,Erlangen,Germany
DeputyChairmanoftheSupervisoryBoard,HEITECAG,Erlangen,GermanySupervisoryBoard,DürrAG,Bietigheim-Bissingen,GermanySupervisoryBoard,LEONIAG,Nuremberg,GermanyChairmanoftheSupervisoryBoard,FestoAG&Co.KG,Esslingen,Germany
InformationasatDecember31,2013
1)Electedbytheemployees2)MemberoftheCompany’sGeneralandCompensationCommittee3)MemberoftheCompany’sAuditCommittee4)MemberoftheCompany’sMediationCommittee5)MemberoftheCompany’sTechnologyandStrategyCommittee6)MemberoftheCompany’sFinanceandInvestmentCommittee7)MemberoftheCompany’sNominationCommittee8)MemberoftheCompany’sSpecialCommittee9)MemberoftheCompany’sPeopleandOrganizationCommittee
265Notes to the Consolidated Financial Statements
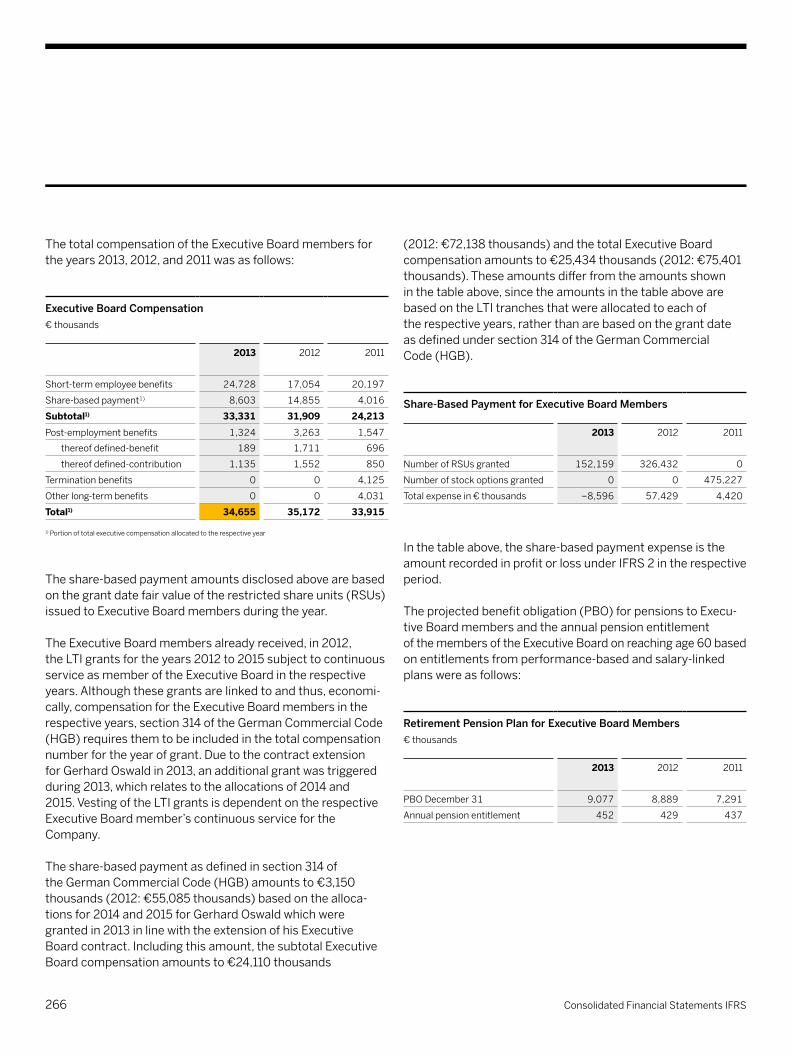
(2012:€72,138thousands)andthetotalExecutiveBoardcompensationamountsto€25,434thousands(2012:€75,401thousands).Theseamountsdifferfromtheamountsshown inthetableabove,sincetheamountsinthetableabovearebasedontheLTItranchesthatwereallocatedtoeachof therespectiveyears,ratherthanarebasedonthegrantdateasdefinedundersection314oftheGermanCommercial Code(HGB).
Share-Based Payment for Executive Board Members
2013 2012 2011
NumberofRSUsgranted 152,159 326,432 0
Numberofstockoptionsgranted 0 0 475,227
Totalexpensein€thousands −8,596 57,429 4,420
Inthetableabove,theshare-basedpaymentexpenseistheamountrecordedinprofitorlossunderIFRS2intherespectiveperiod.
Theprojectedbenefitobligation(PBO)forpensionstoExecu- tiveBoardmembersandtheannualpensionentitlement ofthemembersoftheExecutiveBoardonreachingage60based onentitlementsfromperformance-basedandsalary-linkedplanswereasfollows:
Retirement Pension Plan for Executive Board Members€thousands
2013 2012 2011
PBODecember31 9,077 8,889 7,291
Annual pension entitlement 452 429 437
ThetotalcompensationoftheExecutiveBoardmembersfortheyears2013,2012,and2011wasasfollows:
Executive Board Compensation €thousands
2013 2012 2011
Short-termemployeebenefits 24,728 17,054 20,197
Share-basedpayment1) 8,603 14,855 4,016
Subtotal1) 33,331 31,909 24,213
Post-employmentbenefits 1,324 3,263 1,547
thereofdefined-benefit 189 1,711 696
thereofdefined-contribution 1,135 1,552 850
Termination benefits 0 0 4,125
Otherlong-termbenefits 0 0 4,031
Total1) 34,655 35,172 33,915
1) Portionoftotalexecutivecompensationallocatedtotherespectiveyear
Theshare-basedpaymentamountsdisclosedabovearebasedonthegrantdatefairvalueoftherestrictedshareunits(RSUs)issuedtoExecutiveBoardmembersduringtheyear.
TheExecutiveBoardmembersalreadyreceived,in2012, theLTIgrantsfortheyears2012to2015subjecttocontinuousserviceasmemberoftheExecutiveBoardintherespectiveyears.Althoughthesegrantsarelinkedtoandthus,economi- cally,compensationfortheExecutiveBoardmembersintherespectiveyears,section314oftheGermanCommercialCode(HGB)requiresthemtobeincludedinthetotalcompensationnumberfortheyearofgrant.Duetothecontractextension forGerhardOswaldin2013,anadditionalgrantwastriggeredduring2013,whichrelatestotheallocationsof2014and 2015.VestingoftheLTIgrantsisdependentontherespectiveExecutiveBoardmember’scontinuousservicefortheCompany.
Theshare-basedpaymentasdefinedinsection314of theGermanCommercialCode(HGB)amountsto€3,150thousands(2012:€55,085thousands)basedonthealloca- tionsfor2014and2015forGerhardOswaldwhichweregrantedin2013inlinewiththeextensionofhisExecutiveBoardcontract.Includingthisamount,thesubtotalExecutiveBoardcompensationamountsto€24,110thousands
266 Consolidated Financial Statements IFRS
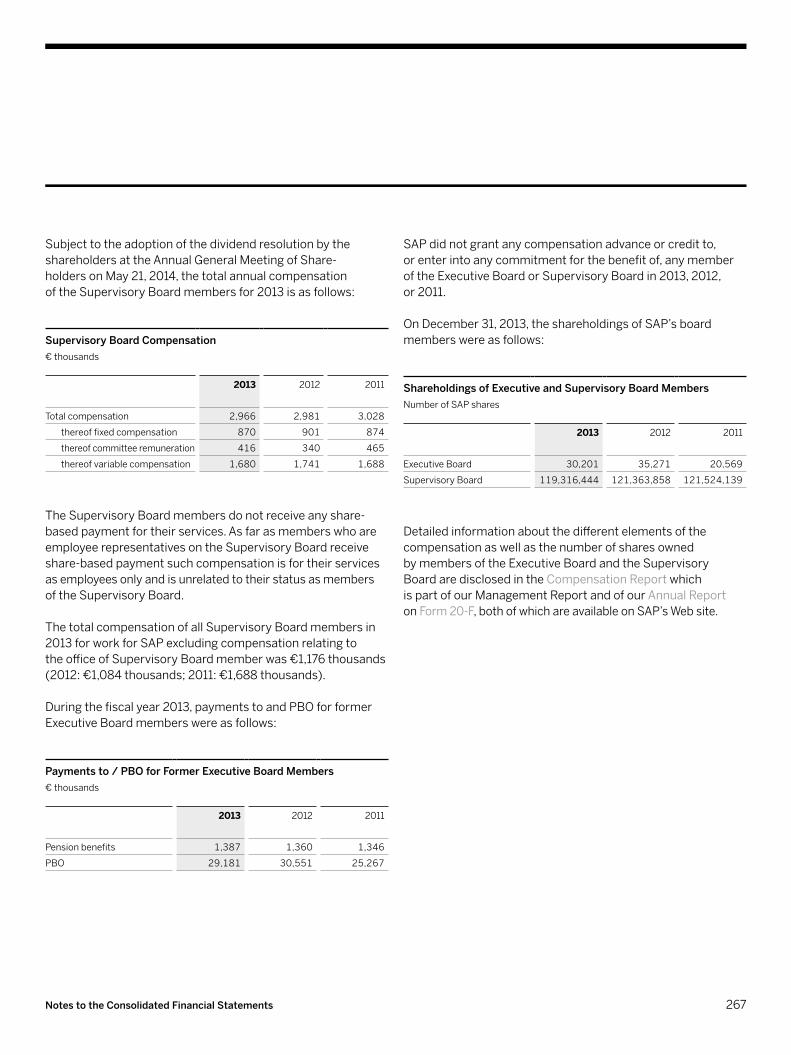
SubjecttotheadoptionofthedividendresolutionbytheshareholdersattheAnnualGeneralMeetingofShare- holdersonMay21,2014,thetotalannualcompensation oftheSupervisoryBoardmembersfor2013isasfollows:
Supervisory Board Compensation €thousands
2013 2012 2011
Total compensation 2,966 2,981 3,028
thereoffixedcompensation 870 901 874
thereofcommitteeremuneration 416 340 465
thereofvariablecompensation 1,680 1,741 1,688
TheSupervisoryBoardmembersdonotreceiveanyshare-basedpaymentfortheirservices.AsfarasmemberswhoareemployeerepresentativesontheSupervisoryBoardreceiveshare-basedpaymentsuchcompensationisfortheirservicesasemployeesonlyandisunrelatedtotheirstatusasmembers oftheSupervisoryBoard.
ThetotalcompensationofallSupervisoryBoardmembersin2013forworkforSAPexcludingcompensationrelatingto theofficeofSupervisoryBoardmemberwas€1,176thousands(2012:€1,084thousands;2011:€1,688thousands).
Duringthefiscalyear2013,paymentstoandPBOforformerExecutiveBoardmemberswereasfollows:
Payments to / PBO for Former Executive Board Members€thousands
2013 2012 2011
Pension benefits 1,387 1,360 1,346
PBO 29,181 30,551 25,267
SAPdidnotgrantanycompensationadvanceorcreditto, orenterintoanycommitmentforthebenefitof,anymemberoftheExecutiveBoardorSupervisoryBoardin2013,2012, or 2011.
OnDecember31,2013,theshareholdingsofSAP’sboardmemberswereasfollows:
Shareholdings of Executive and Supervisory Board MembersNumberofSAPshares
2013 2012 2011
ExecutiveBoard 30,201 35,271 20,569
SupervisoryBoard 119,316,444 121,363,858 121,524,139
Detailedinformationaboutthedifferentelementsofthecompensationaswellasthenumberofsharesowned bymembersoftheExecutiveBoardandtheSupervisory BoardaredisclosedintheCompensationReportwhich ispartofourManagementReportandofourAnnualReport on Form20-F,bothofwhichareavailableonSAP’sWebsite.
267Notes to the Consolidated Financial Statements
Allamountsrelatedtotheabovementionedtransactions were immaterial to SAP in all periods presented.
ForinformationaboutthecompensationofourExecutiveBoardandSupervisoryBoardmembers,seeNote(29).
(30) rElAtED pArty trAnSACtIOnSCertainExecutiveBoardandSupervisoryBoardmembersofSAPAGcurrentlyhold,orheldwithinthelastyear,positions ofsignificantresponsibilitywithotherentities,aspresentedinNote(29).Wehaverelationshipswithcertainoftheseentitiesintheordinarycourseofbusiness,wherebywebuyandsell awidevarietyofproductsandservicesatpricesbelievedtobeconsistentwiththosenegotiatedatarm’slengthbetweenunrelated parties.
CompaniescontrolledbyHassoPlattner,chairmanofourSupervisoryBoardandChiefSoftwareAdvisorofSAP,engagedinthefollowingtransactionswithSAP:providingconsultingservices to SAP, selling a piece of land to SAP, receiving sport sponsoringfromSAP,makingpurchasesofSAPproductsandservices.Intheprioryear,thisalsoincludedpurchasinganentitythroughanassetdealfromacompanyindirectlyheldbyhim.
ChristianeKuntz-Mayr,vicechairpersonoftheSAPSuper- visoryBoard,actsasamanageroffamily&kids@workgemeinnützigeUG("family&kids@work").Family&kids@workissupportedfinanciallybySAP.
WilhelmHaarmannpracticedasapartnerinthelawfirmHAARMANNPartnerschaftsgesellschaftinFrankfurtamMain,Germany,untilFebruary2013.InFebruary2013,hebecame apartnerinLinklatersLLP.SAPoccasionallypurchasedandpurchaseslegalandsimilarservicesfrombothofthesefirms.
268 Consolidated Financial Statements IFRS
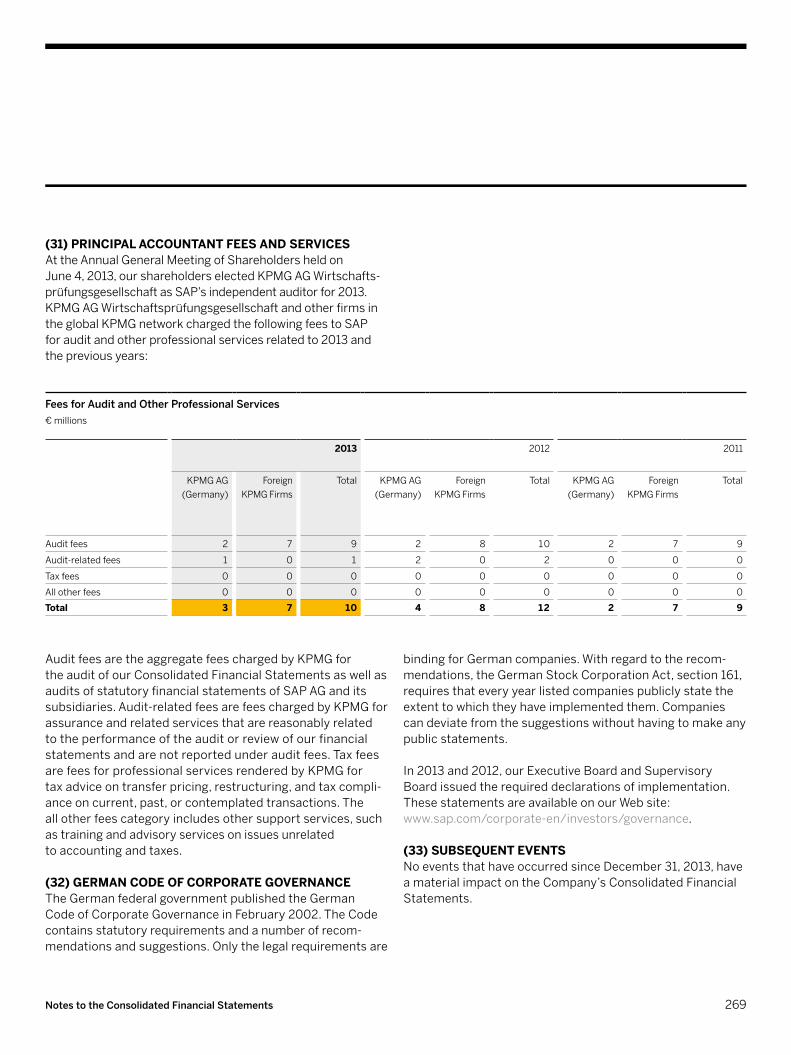
(31) prInCIpAl ACCOuntAnt FEES AnD SErVICESAttheAnnualGeneralMeetingofShareholdersheldon June4,2013,ourshareholderselectedKPMGAGWirtschafts- prüfungsgesellschaftasSAP’sindependentauditorfor2013.KPMGAGWirtschaftsprüfungsgesellschaftandotherfirmsintheglobalKPMGnetworkchargedthefollowingfeestoSAP forauditandotherprofessionalservicesrelatedto2013andthepreviousyears:
Fees for Audit and Other Professional Services € millions
2013 2012 2011
KPMGAG(Germany)
ForeignKPMGFirms
Total KPMGAG(Germany)
ForeignKPMGFirms
Total KPMGAG(Germany)
ForeignKPMGFirms
Total
Audit fees 2 7 9 2 8 10 2 7 9
Audit-relatedfees 1 0 1 2 0 2 0 0 0
Taxfees 0 0 0 0 0 0 0 0 0
Allotherfees 0 0 0 0 0 0 0 0 0
Total 3 7 10 4 8 12 2 7 9
AuditfeesaretheaggregatefeeschargedbyKPMGfor theauditofourConsolidatedFinancialStatementsaswellasauditsofstatutoryfinancialstatementsofSAPAGanditssubsidiaries.Audit-relatedfeesarefeeschargedbyKPMGforassuranceandrelatedservicesthatarereasonablyrelated totheperformanceoftheauditorreviewofourfinancialstatementsandarenotreportedunderauditfees.TaxfeesarefeesforprofessionalservicesrenderedbyKPMGfor taxadviceontransferpricing,restructuring,andtaxcompli- anceoncurrent,past,orcontemplatedtransactions.The allotherfeescategoryincludesothersupportservices,suchastrainingandadvisoryservicesonissuesunrelated toaccountingandtaxes.
(32) GErmAn CODE OF COrpOrAtE GOVErnAnCETheGermanfederalgovernmentpublishedtheGerman CodeofCorporateGovernanceinFebruary2002.TheCodecontainsstatutoryrequirementsandanumberofrecom- mendationsandsuggestions.Onlythelegalrequirementsare
bindingforGermancompanies.Withregardtotherecom- mendations,theGermanStockCorporationAct,section161,requiresthateveryyearlistedcompaniespubliclystatetheextenttowhichtheyhaveimplementedthem.Companiescandeviatefromthesuggestionswithouthavingtomakeanypublic statements.
In2013and2012,ourExecutiveBoardandSupervisoryBoardissuedtherequireddeclarationsofimplementation.ThesestatementsareavailableonourWebsite: www.sap.com/corporate-en/investors/governance.
(33) SubSEquEnt EVEntSNoeventsthathaveoccurredsinceDecember31,2013,haveamaterialimpactontheCompany’sConsolidatedFinancialStatements.
269Notes to the Consolidated Financial Statements
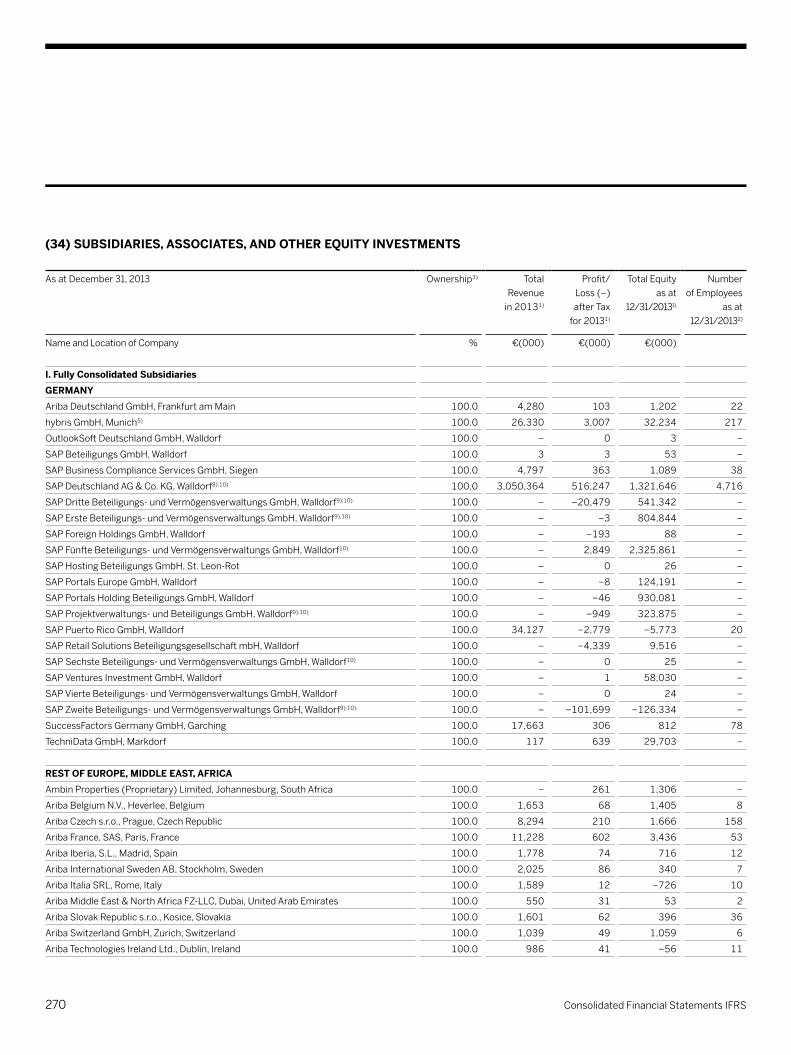
(34) SubSIDIArIES, ASSOCIAtES, AnD OthEr EquIty InVEStmEntS
As at December 31, 2013 Ownership3) Total Revenuein20131)
Profit/ Loss(–) afterTax
for 20131)
TotalEquity as at
12/31/20131)
Number ofEmployees
as at 12/31/20132)
NameandLocationofCompany % €(000) €(000) €(000)
I. Fully Consolidated SubsidiariesGErmAnyAribaDeutschlandGmbH,FrankfurtamMain 100.0 4,280 103 1,202 22
hybrisGmbH,Munich5) 100.0 26,330 3,007 32,234 217
OutlookSoftDeutschlandGmbH,Walldorf 100.0 – 0 3 –
SAPBeteiligungsGmbH,Walldorf 100.0 3 3 53 –
SAPBusinessComplianceServicesGmbH,Siegen 100.0 4,797 363 1,089 38
SAPDeutschlandAG&Co.KG,Walldorf8),10) 100.0 3,050,364 516,247 1,321,646 4,716
SAPDritteBeteiligungs-undVermögensverwaltungsGmbH,Walldorf9),10) 100.0 – −20,479 541,342 –
SAPErsteBeteiligungs-undVermögensverwaltungsGmbH,Walldorf9),10) 100.0 – −3 804,844 –
SAPForeignHoldingsGmbH,Walldorf 100.0 – −193 88 –
SAPFünfteBeteiligungs-undVermögensverwaltungsGmbH,Walldorf10) 100.0 – 2,849 2,325,861 –
SAPHostingBeteiligungsGmbH,St.Leon-Rot 100.0 – 0 26 –
SAPPortalsEuropeGmbH,Walldorf 100.0 – −8 124,191 –
SAPPortalsHoldingBeteiligungsGmbH,Walldorf 100.0 – −46 930,081 –
SAPProjektverwaltungs-undBeteiligungsGmbH,Walldorf9),10) 100.0 – −949 323,875 –
SAPPuertoRicoGmbH,Walldorf 100.0 34,127 −2,779 −5,773 20
SAPRetailSolutionsBeteiligungsgesellschaftmbH,Walldorf 100.0 – −4,339 9,516 –
SAPSechsteBeteiligungs-undVermögensverwaltungsGmbH,Walldorf10) 100.0 – 0 25 –
SAPVenturesInvestmentGmbH,Walldorf 100.0 – 1 58,030 –
SAPVierteBeteiligungs-undVermögensverwaltungsGmbH,Walldorf 100.0 – 0 24 –
SAPZweiteBeteiligungs-undVermögensverwaltungsGmbH,Walldorf9),10) 100.0 – −101,699 −126,334 –
SuccessFactorsGermanyGmbH,Garching 100.0 17,663 306 812 78
TechniDataGmbH,Markdorf 100.0 117 639 29,703 –
rESt OF EurOpE, mIDDlE EASt, AFrICAAmbinProperties(Proprietary)Limited,Johannesburg,SouthAfrica 100.0 – 261 1,306 –
AribaBelgiumN.V.,Heverlee,Belgium 100.0 1,653 68 1,405 8
AribaCzechs.r.o.,Prague,CzechRepublic 100.0 8,294 210 1,666 158
AribaFrance,SAS,Paris,France 100.0 11,228 602 3,436 53
AribaIberia,S.L.,Madrid,Spain 100.0 1,778 74 716 12
AribaInternationalSwedenAB,Stockholm,Sweden 100.0 2,025 86 340 7
AribaItaliaSRL,Rome,Italy 100.0 1,589 12 −726 10
AribaMiddleEast&NorthAfricaFZ-LLC,Dubai,UnitedArabEmirates 100.0 550 31 53 2
AribaSlovakRepublics.r.o.,Kosice,Slovakia 100.0 1,601 62 396 36
AribaSwitzerlandGmbH,Zurich,Switzerland 100.0 1,039 49 1,059 6
AribaTechnologiesIrelandLtd.,Dublin,Ireland 100.0 986 41 −56 11
270 Consolidated Financial Statements IFRS
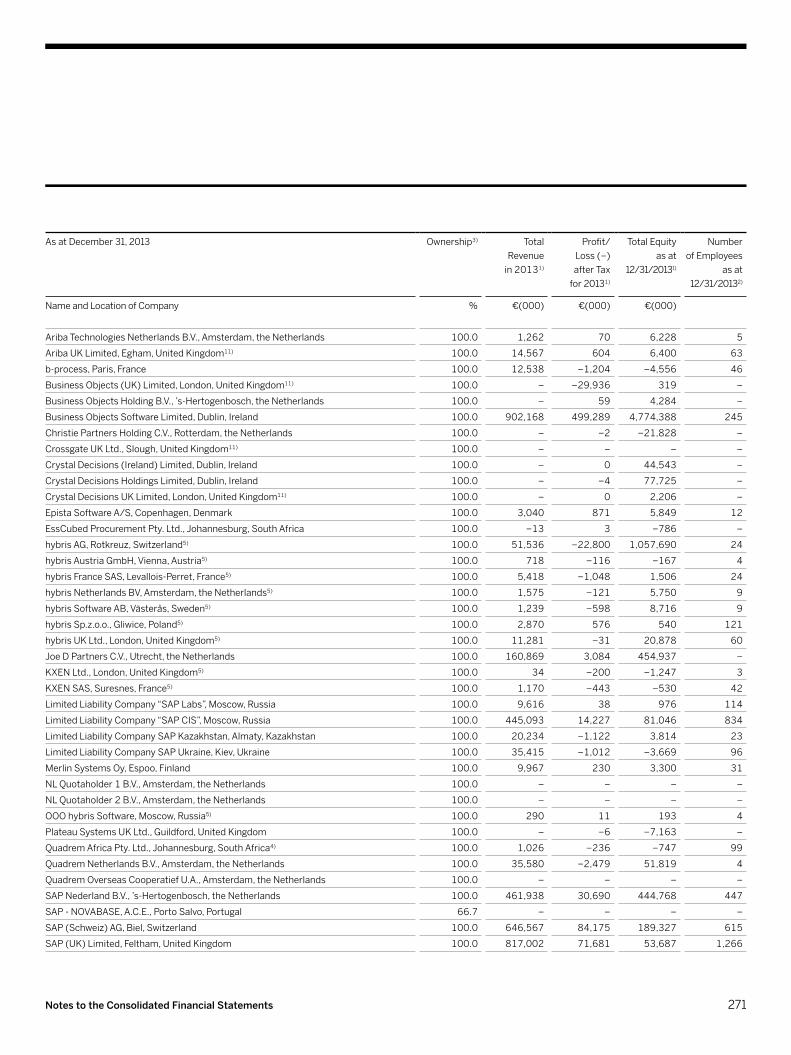
As at December 31, 2013 Ownership3) Total Revenuein20131)
Profit/ Loss(–) afterTax
for 20131)
TotalEquity as at
12/31/20131)
Number ofEmployees
as at 12/31/20132)
NameandLocationofCompany % €(000) €(000) €(000)
AribaTechnologiesNetherlandsB.V.,Amsterdam,theNetherlands 100.0 1,262 70 6,228 5
AribaUKLimited,Egham,UnitedKingdom11) 100.0 14,567 604 6,400 63
b-process,Paris,France 100.0 12,538 −1,204 −4,556 46
BusinessObjects(UK)Limited,London,UnitedKingdom11) 100.0 – −29,936 319 –
BusinessObjectsHoldingB.V.,’s-Hertogenbosch,theNetherlands 100.0 – 59 4,284 –
BusinessObjectsSoftwareLimited,Dublin,Ireland 100.0 902,168 499,289 4,774,388 245
ChristiePartnersHoldingC.V.,Rotterdam,theNetherlands 100.0 – −2 −21,828 –
CrossgateUKLtd.,Slough,UnitedKingdom11) 100.0 – – – –
CrystalDecisions(Ireland)Limited,Dublin,Ireland 100.0 – 0 44,543 –
CrystalDecisionsHoldingsLimited,Dublin,Ireland 100.0 – −4 77,725 –
CrystalDecisionsUKLimited,London,UnitedKingdom11) 100.0 – 0 2,206 –
EpistaSoftwareA/S,Copenhagen,Denmark 100.0 3,040 871 5,849 12
EssCubedProcurementPty.Ltd.,Johannesburg,SouthAfrica 100.0 −13 3 −786 –
hybrisAG,Rotkreuz,Switzerland5) 100.0 51,536 −22,800 1,057,690 24
hybrisAustriaGmbH,Vienna,Austria5) 100.0 718 −116 −167 4
hybrisFranceSAS,Levallois-Perret,France5) 100.0 5,418 −1,048 1,506 24
hybrisNetherlandsBV,Amsterdam,theNetherlands5) 100.0 1,575 −121 5,750 9
hybrisSoftwareAB,Västerås,Sweden5) 100.0 1,239 −598 8,716 9
hybrisSp.z.o.o.,Gliwice,Poland5) 100.0 2,870 576 540 121
hybrisUKLtd.,London,UnitedKingdom5) 100.0 11,281 −31 20,878 60
JoeDPartnersC.V.,Utrecht,theNetherlands 100.0 160,869 3,084 454,937 –
KXENLtd.,London,UnitedKingdom5) 100.0 34 −200 −1,247 3
KXENSAS,Suresnes,France5) 100.0 1,170 −443 −530 42
LimitedLiabilityCompany“SAPLabs”,Moscow,Russia 100.0 9,616 38 976 114
LimitedLiabilityCompany“SAPCIS”,Moscow,Russia 100.0 445,093 14,227 81,046 834
LimitedLiabilityCompanySAPKazakhstan,Almaty,Kazakhstan 100.0 20,234 −1,122 3,814 23
LimitedLiabilityCompanySAPUkraine,Kiev,Ukraine 100.0 35,415 −1,012 −3,669 96
MerlinSystemsOy,Espoo,Finland 100.0 9,967 230 3,300 31
NLQuotaholder1B.V.,Amsterdam,theNetherlands 100.0 – – – –
NLQuotaholder2B.V.,Amsterdam,theNetherlands 100.0 – – – –
OOOhybrisSoftware,Moscow,Russia5) 100.0 290 11 193 4
PlateauSystemsUKLtd.,Guildford,UnitedKingdom 100.0 – −6 −7,163 –
QuadremAfricaPty.Ltd.,Johannesburg,SouthAfrica4) 100.0 1,026 −236 −747 99
QuadremNetherlandsB.V.,Amsterdam,theNetherlands 100.0 35,580 −2,479 51,819 4
QuadremOverseasCooperatiefU.A.,Amsterdam,theNetherlands 100.0 – – – –
SAPNederlandB.V.,’s-Hertogenbosch,theNetherlands 100.0 461,938 30,690 444,768 447
SAP-NOVABASE,A.C.E.,PortoSalvo,Portugal 66.7 – – – –
SAP(Schweiz)AG,Biel,Switzerland 100.0 646,567 84,175 189,327 615
SAP(UK)Limited,Feltham,UnitedKingdom 100.0 817,002 71,681 53,687 1,266
271Notes to the Consolidated Financial Statements
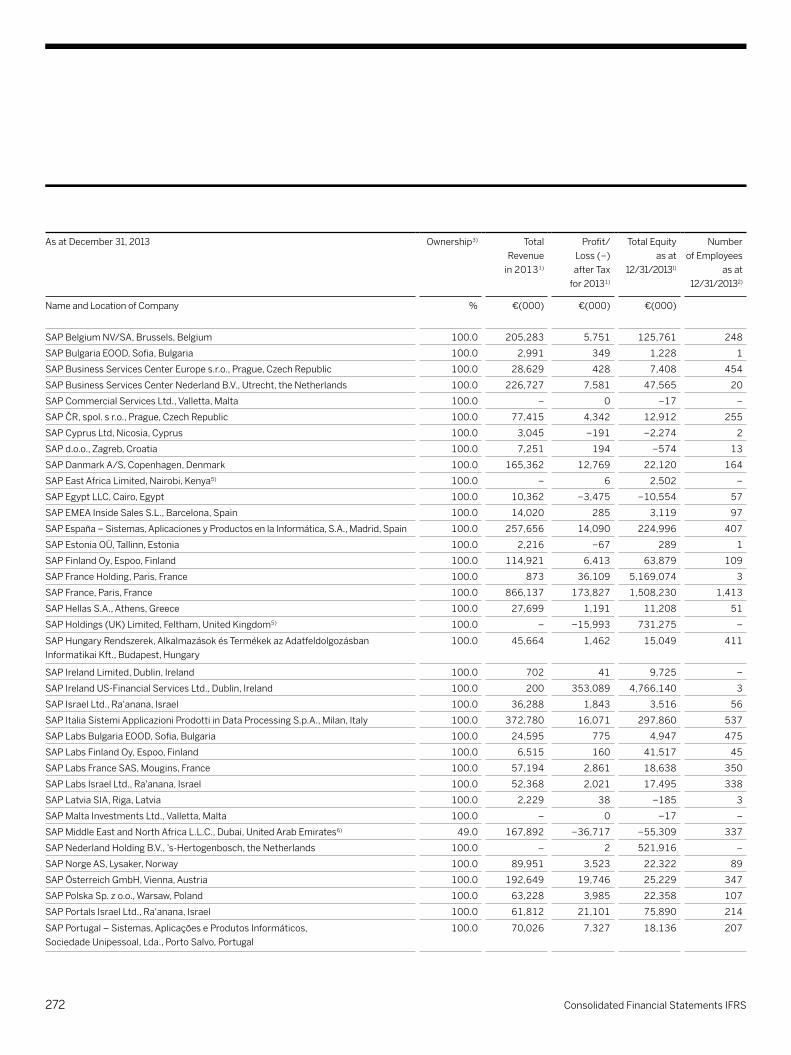
As at December 31, 2013 Ownership3) Total Revenuein20131)
Profit/ Loss(–) afterTax
for 20131)
TotalEquity as at
12/31/20131)
Number ofEmployees
as at 12/31/20132)
NameandLocationofCompany % €(000) €(000) €(000)
SAPBelgiumNV/SA,Brussels,Belgium 100.0 205,283 5,751 125,761 248
SAPBulgariaEOOD,Sofia,Bulgaria 100.0 2,991 349 1,228 1
SAPBusinessServicesCenterEuropes.r.o.,Prague,CzechRepublic 100.0 28,629 428 7,408 454
SAPBusinessServicesCenterNederlandB.V.,Utrecht,theNetherlands 100.0 226,727 7,581 47,565 20
SAPCommercialServicesLtd.,Valletta,Malta 100.0 – 0 −17 –
SAPČR,spol.sr.o.,Prague,CzechRepublic 100.0 77,415 4,342 12,912 255
SAPCyprusLtd,Nicosia,Cyprus 100.0 3,045 −191 −2,274 2
SAPd.o.o.,Zagreb,Croatia 100.0 7,251 194 −574 13
SAPDanmarkA/S,Copenhagen,Denmark 100.0 165,362 12,769 22,120 164
SAPEastAfricaLimited,Nairobi,Kenya5) 100.0 – 6 2,502 –
SAPEgyptLLC,Cairo,Egypt 100.0 10,362 −3,475 −10,554 57
SAPEMEAInsideSalesS.L.,Barcelona,Spain 100.0 14,020 285 3,119 97
SAPEspaña–Sistemas,AplicacionesyProductosenlaInformática,S.A.,Madrid,Spain 100.0 257,656 14,090 224,996 407
SAPEstoniaOÜ,Tallinn,Estonia 100.0 2,216 −67 289 1
SAPFinlandOy,Espoo,Finland 100.0 114,921 6,413 63,879 109
SAPFranceHolding,Paris,France 100.0 873 36,109 5,169,074 3
SAPFrance,Paris,France 100.0 866,137 173,827 1,508,230 1,413
SAPHellasS.A.,Athens,Greece 100.0 27,699 1,191 11,208 51
SAPHoldings(UK)Limited,Feltham,UnitedKingdom5) 100.0 – −15,993 731,275 –
SAPHungaryRendszerek,AlkalmazásokésTermékekazAdatfeldolgozásban InformatikaiKft.,Budapest,Hungary
100.0 45,664 1,462 15,049 411
SAPIrelandLimited,Dublin,Ireland 100.0 702 41 9,725 –
SAPIrelandUS-FinancialServicesLtd.,Dublin,Ireland 100.0 200 353,089 4,766,140 3
SAPIsraelLtd.,Ra'anana,Israel 100.0 36,288 1,843 3,516 56
SAPItaliaSistemiApplicazioniProdottiinDataProcessingS.p.A.,Milan,Italy 100.0 372,780 16,071 297,860 537
SAPLabsBulgariaEOOD,Sofia,Bulgaria 100.0 24,595 775 4,947 475
SAPLabsFinlandOy,Espoo,Finland 100.0 6,515 160 41,517 45
SAPLabsFranceSAS,Mougins,France 100.0 57,194 2,861 18,638 350
SAPLabsIsraelLtd.,Ra'anana,Israel 100.0 52,368 2,021 17,495 338
SAPLatviaSIA,Riga,Latvia 100.0 2,229 38 −185 3
SAPMaltaInvestmentsLtd.,Valletta,Malta 100.0 – 0 −17 –
SAPMiddleEastandNorthAfricaL.L.C.,Dubai,UnitedArabEmirates6) 49.0 167,892 −36,717 −55,309 337
SAPNederlandHoldingB.V.,’s-Hertogenbosch,theNetherlands 100.0 – 2 521,916 –
SAPNorgeAS,Lysaker,Norway 100.0 89,951 3,523 22,322 89
SAPÖsterreichGmbH,Vienna,Austria 100.0 192,649 19,746 25,229 347
SAP Polska Sp. z o.o., Warsaw, Poland 100.0 63,228 3,985 22,358 107
SAPPortalsIsraelLtd.,Ra'anana,Israel 100.0 61,812 21,101 75,890 214
SAPPortugal–Sistemas,AplicaçõeseProdutosInformáticos, SociedadeUnipessoal,Lda.,PortoSalvo,Portugal
100.0 70,026 7,327 18,136 207
272 Consolidated Financial Statements IFRS

As at December 31, 2013 Ownership3) Total Revenuein20131)
Profit/ Loss(–) afterTax
for 20131)
TotalEquity as at
12/31/20131)
Number ofEmployees
as at 12/31/20132)
NameandLocationofCompany % €(000) €(000) €(000)
SAPPublicServicesHungaryKft.,Budapest,Hungary 100.0 4,284 549 1,306 7
SAPRomaniaSRL,Bucharest,Romania 100.0 27,044 2,298 5,311 270
SAPSaudiArabiaSoftwareServicesLtd,Riyadh,KingdomofSaudiArabia 100.0 44,426 3,561 37,416 50
SAPSaudiArabiaSoftwareTradingLtd,Riyadh,KingdomofSaudiArabia 75.0 36,862 −25,350 −24,698 81
SAPServiceandSupportCentre(Ireland)Limited,Dublin,Ireland 100.0 80,598 2,899 34,430 884
SAP sistemi, aplikacije in produkti za obdelavo podatkov d.o.o., Ljubljana, Slovenia 100.0 13,920 844 3,561 22
SAP Slovensko s.r.o., Bratislava, Slovakia 100.0 37,036 2,532 15,373 180
SAPSvenskaAktiebolag,Stockholm,Sweden 100.0 166,507 7,525 15,933 154
SAPTrainingandDevelopmentInstituteFZCO,Dubai,UnitedArabEmirates 100.0 4,532 −254 −437 36
SAPTürkiyeYazilimÜretimveTicaretA.S.,Istanbul,Turkey 100.0 78,245 −10,007 10,138 155
SAPUAB(Lithuania),Vilnius,Lithuania 100.0 2,491 106 −58 3
SAPV(Mauritius),Ebene,Mauritius7) 0 – 258 22,932 –
SAP West Balkans d.o.o., Belgrade, Serbia 100.0 16,177 2,389 7,595 29
SuccessFactors(UK)Limited,London,UnitedKingdom 100.0 20,662 1,610 2,255 100
SuccessFactorsDenmarkApS,Copenhagen,Denmark 100.0 1,687 171 279 4
SuccessFactorsFranceSAS,Paris,France 100.0 9,109 290 573 45
SuccessFactorsIrelandLimited,Dublin,Ireland 100.0 773 32 77 6
SuccessFactorsItalySRL,Milan,Italy 100.0 1,507 44 71 5
SuccessFactorsNetherlandsB.V.,Amsterdam,theNetherlands 100.0 5,071 359 16,926 22
SuccessFactorsSchweizGmbH,Zurich,Switzerland 100.0 3,620 −257 −388 7
Sybase(UK)Limited,Maidenhead,UnitedKingdom11) 100.0 0 −4 327 –
SybaseFranceSARL,Paris,France 100.0 46,272 4,754 12,919 –
SybaseIberiaS.L.,Madrid,Spain 100.0 – 2 65,920 –
SybaseSouthAfrica(Proprietary)Limited,Johannesburg,SouthAfrica 89.5 – 38 75 –
SycloInternationalLimited,Leatherhead,UnitedKingdom 11) 100.0 510 977 0 –
SystemsApplicationsProductsAfricaRegion(Proprietary)Limited,Johannesburg,SouthAfrica
100.0 81,563 10,920 23,403 39
SystemsApplicationsProductsAfrica(Proprietary)Limited,Johannesburg,SouthAfrica 100.0 – 3,146 62,455 –
SystemsApplicationsProductsNigeriaLimited,Abuja,Nigeria 100.0 16,604 −907 2,953 43
SystemsApplicationsProductsSouthAfrica(Proprietary)Limited, Johannesburg,SouthAfrica
89.5 227,424 −12,240 −5,707 455
TheInfohrmGroupLtd.,London,UnitedKingdom 100.0 88 223 −245 –
TomorrowNow(UK)Limited,Feltham,UnitedKingdom11) 100.0 – 0 0 –
TomorrowNowNederlandB.V.,Amsterdam,theNetherlands 100.0 – −9 −3,301 –
273Notes to the Consolidated Financial Statements

As at December 31, 2013 Ownership3) Total Revenuein20131)
Profit/ Loss(–) afterTax
for 20131)
TotalEquity as at
12/31/20131)
Number ofEmployees
as at 12/31/20132)
NameandLocationofCompany % €(000) €(000) €(000)
AmErICAS110405,Inc.,NewtownSquare,Pennsylvania,USA 100.0 – 0 15,150 –
Alliente,Inc.,Pittsburgh,Pennsylvania,USA 100.0 – – – –
AribaCanada,Inc.,Mississauga,Canada 100.0 3,094 129 1,214 21
AribaHoldings,Inc.,GrandCayman,CaymanIslands 100.0 – – – –
Ariba,Inc.,Sunnyvale,California,USA 100.0 299,460 −92,369 3,093,731 1,245
AribaInternationalHoldings,Inc.,Wilmington,Delaware,USA 100.0 – – – –
AribaInternational,Inc.,Wilmington,Delaware,USA 100.0 7,405 301 −1,722 43
AribaInvestmentCompany,Inc.,Wilmington,Delaware,USA 100.0 – 2,638 210,474 –
BusinessObjectsArgentinaS.R.L.,BuenosAires,Argentina 100.0 – 0 49 –
BusinessObjectsOptionLLC,Wilmington,Delaware,USA 100.0 −33 2,032 63,668 –
CamilionSolutions,Inc.,Markham,Canada5) 100.0 9,364 −3,017 31,701 114
CubeTreeLLC,SanMateo,California,USA 100.0 505 492 680 –
ExtendedSystems,Inc.,Boise,Idaho,USA 99.0 – 32 16,513 –
FinancialFusion,Inc.,Concord,Massachusetts,USA 100.0 – – – –
FreeMarketsInternationalHoldingsInc.deMexico,deS.deR.L.deC.V., MexicoCity,Mexico
100.0 – – −60 –
FreeMarketsLtda.,SãoPaulo,Brazil 100.0 52 −376 −464 –
hybrisCanada,Inc.,Montréal,Canada5) 100.0 13,492 723 254 244
hybrisSoftwareBrasilLtda.,Morumbi,Brazil5) 100.0 23 −389 −821 4
hybris(US)Corp.,Wilmington,Delaware,USA5) 100.0 28,138 1,400 25,043 125
iAnywhereSolutions,Inc.,Dublin,California,USA 99.0 75,212 36,253 172,933 43
InxightFederalSystemsGroup,Inc.,Wilmington,Delaware,USA 100.0 – 0 66 –
JamAcquisitionIILLC,SanMateo,California,USA 100.0 200 200 178 –
Jobs2Web,Inc.,Minnetonka,Minnesota,USA 100.0 2,897 2,637 2,482 –
KXEN,Inc.,SanFrancisco,CaliforniaUSA5) 100.0 531 −651 21,199 11
PlateauSystemsLLC,Arlington,Virginia,USA 100.0 4,564 3,972 5,603 –
QuadremBrazilLtda.,RiodeJaneiro,Brazil 100.0 23,672 2,001 7,370 175
QuadremCanadaLtd.,Mississauga,Canada 100.0 923 102 506 8
QuadremChileLtda.,SantiagodeChile,Chile 100.0 13,566 −677 1,732 187
QuadremColombiaSAS,Bogotá,Colombia 100.0 240 −26 −33 3
QuadremInternationalLtd.,Hamilton,Bermuda 100.0 – 826 69,569 –
QuadremMexicoS.deR.deC.V.,MexicoCity,Mexico 100.0 360 2 −38 3
QuadremPeruS.A.C.,Lima,Peru 100.0 2,803 −1,346 −2,105 89
QuadremU.S.,Inc.,Plano,Texas,USA 100.0 – – – –
SAPAmerica,Inc.,NewtownSquare,Pennsylvania,USA 100.0 3,530,473 114,589 4,992,376 5,819
SAPAndinaydelCaribeC.A.,Caracas,Venezuela 100.0 14,481 −53,041 −35,312 26
SAP Argentina S.A., Buenos Aires, Argentina 100.0 172,462 −14,424 4,773 618
SAPBrasilLtda,SãoPaulo,Brazil 100.0 553,602 −12,986 43,000 1,441
274 Consolidated Financial Statements IFRS

As at December 31, 2013 Ownership3) Total Revenuein20131)
Profit/ Loss(–) afterTax
for 20131)
TotalEquity as at
12/31/20131)
Number ofEmployees
as at 12/31/20132)
NameandLocationofCompany % €(000) €(000) €(000)
SAPCanada,Inc.,Toronto,Canada 100.0 708,115 50,265 470,548 2,201
SAPChileLimitada,Santiago,Chile 100.0 – 1,015 13,618 –
SAPColombiaSAS,Bogotá,Colombia 100.0 129,544 −5,209 −15,589 216
SAPCostaRica,S.A.,SanJosé,CostaRica 100.0 14,550 −4,394 −4,404 13
SAPFinancial,Inc.,Toronto,Canada 100.0 – 25,202 6,738 –
SAPGlobalMarketing,Inc.,NewYork,NewYork,USA 100.0 276,915 1,148 24,311 543
SAPHANARealTimeFund,Wilmington,Delaware,USA7) 0 – −904 −1,292 –
SAPIndustries,Inc.,NewtownSquare,Pennsylvania,USA 100.0 468,227 40,420 396,489 446
SAPInternational,Inc.,Miami,Florida,USA 100.0 29,221 −3,806 8,615 65
SAPInternationalPANAMAS.A.,PanamaCity,Panama5) 100.0 234 −30 334 2
SAPInvestments,Inc.,Wilmington,Delaware,USA 100.0 – 25,169 666,458 –
SAPLABS,LLC,PaloAlto,California,USA 100.0 545,498 10,662 221,018 2,184
SAPMéxicoS.A.deC.V.,MexicoCity,Mexico 100.0 306,180 8,737 −18,242 569
SAPNationalSecurityServices,Inc.,NewtownSquare,Pennsylvania,USA 100.0 178,593 35,723 173,364 268
SAPPERUS.A.C.,Lima,Peru 100.0 29,648 −3,248 4,846 55
SAPPublicServices,Inc.,Washington,D.C.,USA 100.0 288,791 13,780 256,245 202
SAPTechnologiesInc.,PaloAlto,California,USA 100.0 – – – –
SAPVenturesFundI,L.P.,Wilmington,Delaware,USA7) 0 – 31,690 110,261 –
SAPVenturesFundII,L.P.,Wilmington,Delaware,USA5),7) 0 – −2,630 −2,584 –
SuccessFactors,Inc.,SanMateo,California,USA 100.0 413,455 −173,389 2,406,889 1,373
SuccessFactorsBrasilConsultoriaeAssistênciaemVendasLimitada,SãoPaulo,Brazil 100.0 6,571 −332 −272 28
SuccessFactorsCanadaInc.,Ottawa,Canada 100.0 8,564 254 580 33
SuccessFactorsCayman,Ltd.,GrandCayman,CaymanIslands 100.0 – – 208 –
SuccessFactorsdeMéxico,S.deR.L.deC.V.,MexicoCity,Mexico 100.0 4,175 138 155 19
SuccessFactorsInternationalHoldings,LLC,SanMateo,California,USA 100.0 – – 102 –
SuccessFactorsInternationalServices,Inc.,SanMateo,California,USA 100.0 3,486 168 286 7
SuccessFactorsMiddleEastHoldings,LLC,SanMateo,California,USA 100.0 – – – –
SurplusRecord,Inc.,Chicago,Illinois,USA 100.0 3,006 755 7,757 –
Sybase365LLC,Dublin,California,USA 100.0 101,570 1,192 57,218 116
Sybase365Ltd.,Tortola,BritishVirginIslands 100.0 – 0 −908 –
SybaseArgentinaS.A.,BuenosAires,Argentina 100.0 – −112 703 –
SybaseGlobalLLC,Dublin,California,USA 100.0 – – 7,064 –
SybaseIntlHoldingsLLC,Dublin,California,USA 100.0 – 0 11,346 –
Sybase,Inc.,Dublin,California,USA 100.0 547,633 252,904 4,375,352 1,031
TheInforhrmGroup,Inc.,Washington,Columbia,USA 100.0 34 −6 −24 –
TomorrowNow,Inc.,Bryan,Texas,USA 100.0 – −1,454 −179,441 3
YouCalc,Inc.,SanMateo,California,USA 100.0 – – – –
275Notes to the Consolidated Financial Statements
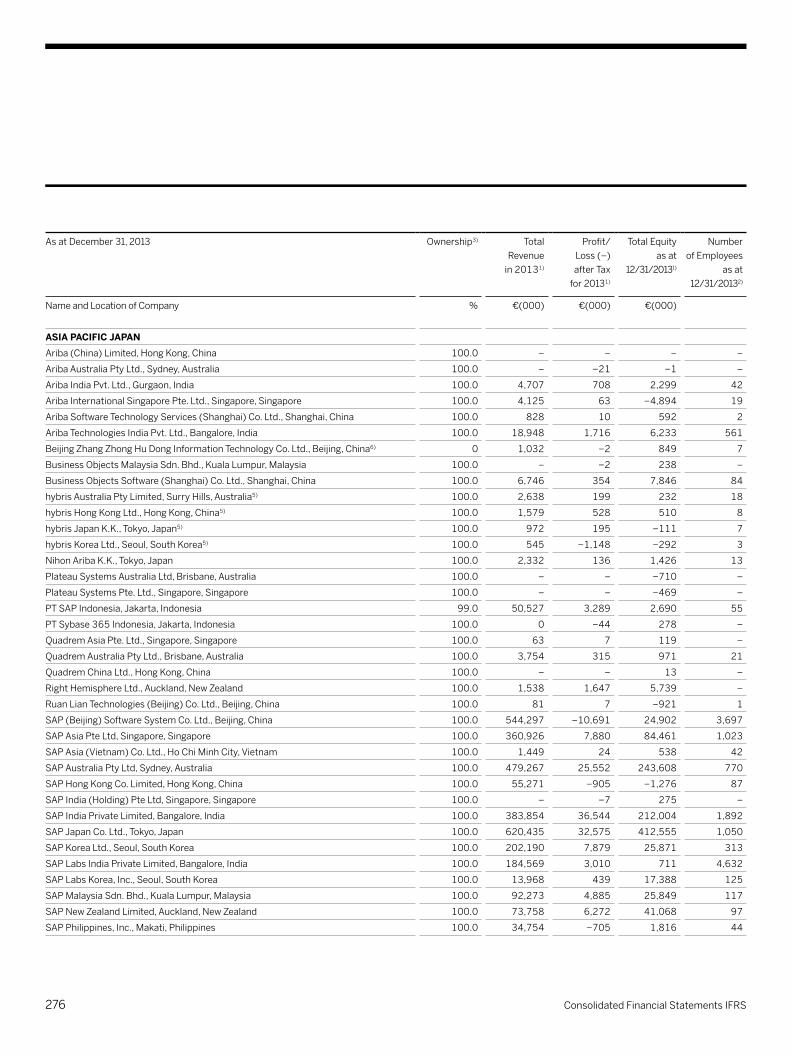
As at December 31, 2013 Ownership3) Total Revenuein20131)
Profit/ Loss(–) afterTax
for 20131)
TotalEquity as at
12/31/20131)
Number ofEmployees
as at 12/31/20132)
NameandLocationofCompany % €(000) €(000) €(000)
ASIA pACIFIC JApAnAriba(China)Limited,HongKong,China 100.0 – – – –
AribaAustraliaPtyLtd.,Sydney,Australia 100.0 – −21 −1 –
AribaIndiaPvt.Ltd.,Gurgaon,India 100.0 4,707 708 2,299 42
AribaInternationalSingaporePte.Ltd.,Singapore,Singapore 100.0 4,125 63 −4,894 19
AribaSoftwareTechnologyServices(Shanghai)Co.Ltd.,Shanghai,China 100.0 828 10 592 2
AribaTechnologiesIndiaPvt.Ltd.,Bangalore,India 100.0 18,948 1,716 6,233 561
BeijingZhangZhongHuDongInformationTechnologyCo.Ltd.,Beijing,China6) 0 1,032 −2 849 7
BusinessObjectsMalaysiaSdn.Bhd.,KualaLumpur,Malaysia 100.0 – −2 238 –
BusinessObjectsSoftware(Shanghai)Co.Ltd.,Shanghai,China 100.0 6,746 354 7,846 84
hybrisAustraliaPtyLimited,SurryHills,Australia5) 100.0 2,638 199 232 18
hybrisHongKongLtd.,HongKong,China5) 100.0 1,579 528 510 8
hybrisJapanK.K.,Tokyo,Japan5) 100.0 972 195 −111 7
hybrisKoreaLtd.,Seoul,SouthKorea5) 100.0 545 −1,148 −292 3
NihonAribaK.K.,Tokyo,Japan 100.0 2,332 136 1,426 13
PlateauSystemsAustraliaLtd,Brisbane,Australia 100.0 – – −710 –
PlateauSystemsPte.Ltd.,Singapore,Singapore 100.0 – – −469 –
PTSAPIndonesia,Jakarta,Indonesia 99.0 50,527 3,289 2,690 55
PTSybase365Indonesia,Jakarta,Indonesia 100.0 0 −44 278 –
Quadrem Asia Pte. Ltd., Singapore, Singapore 100.0 63 7 119 –
QuadremAustraliaPtyLtd.,Brisbane,Australia 100.0 3,754 315 971 21
QuadremChinaLtd.,HongKong,China 100.0 – – 13 –
RightHemisphereLtd.,Auckland,NewZealand 100.0 1,538 1,647 5,739 –
RuanLianTechnologies(Beijing)Co.Ltd.,Beijing,China 100.0 81 7 −921 1
SAP(Beijing)SoftwareSystemCo.Ltd.,Beijing,China 100.0 544,297 −10,691 24,902 3,697
SAP Asia Pte Ltd, Singapore, Singapore 100.0 360,926 7,880 84,461 1,023
SAPAsia(Vietnam)Co.Ltd.,HoChiMinhCity,Vietnam 100.0 1,449 24 538 42
SAPAustraliaPtyLtd,Sydney,Australia 100.0 479,267 25,552 243,608 770
SAPHongKongCo.Limited,HongKong,China 100.0 55,271 −905 −1,276 87
SAPIndia(Holding)PteLtd,Singapore,Singapore 100.0 – −7 275 –
SAPIndiaPrivateLimited,Bangalore,India 100.0 383,854 36,544 212,004 1,892
SAPJapanCo.Ltd.,Tokyo,Japan 100.0 620,435 32,575 412,555 1,050
SAPKoreaLtd.,Seoul,SouthKorea 100.0 202,190 7,879 25,871 313
SAPLabsIndiaPrivateLimited,Bangalore,India 100.0 184,569 3,010 711 4,632
SAPLabsKorea,Inc.,Seoul,SouthKorea 100.0 13,968 439 17,388 125
SAPMalaysiaSdn.Bhd.,KualaLumpur,Malaysia 100.0 92,273 4,885 25,849 117
SAPNewZealandLimited,Auckland,NewZealand 100.0 73,758 6,272 41,068 97
SAPPhilippines,Inc.,Makati,Philippines 100.0 34,754 −705 1,816 44
276 Consolidated Financial Statements IFRS
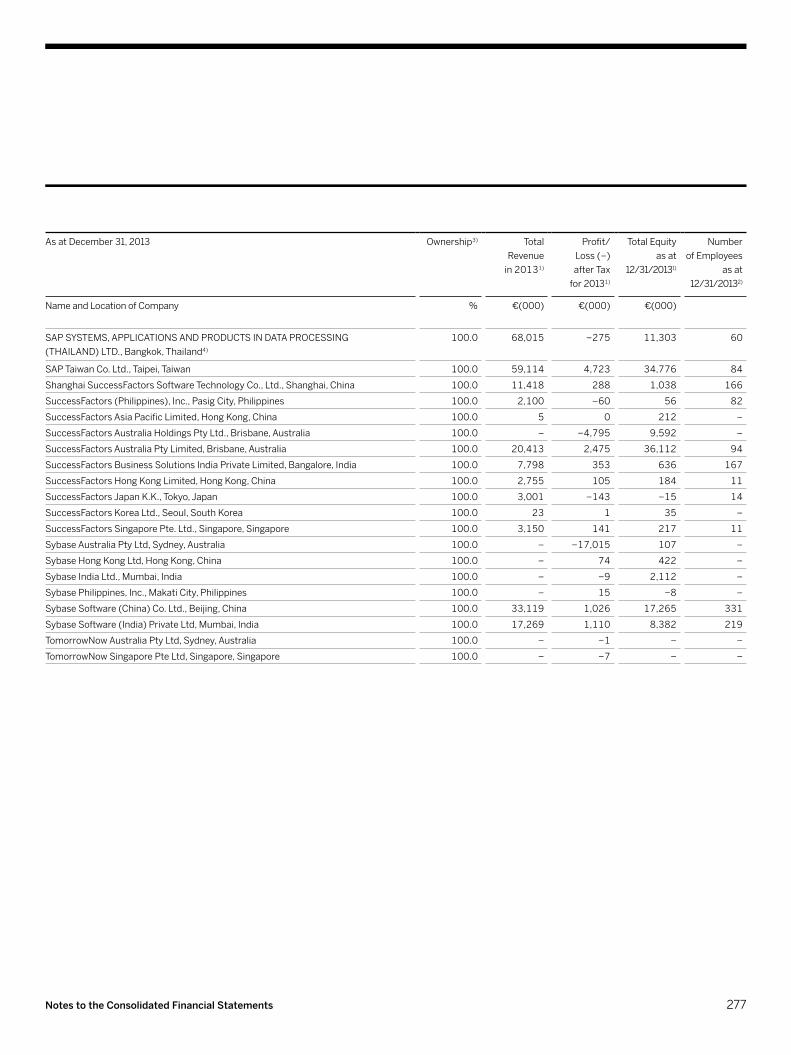
As at December 31, 2013 Ownership3) Total Revenuein20131)
Profit/ Loss(–) afterTax
for 20131)
TotalEquity as at
12/31/20131)
Number ofEmployees
as at 12/31/20132)
NameandLocationofCompany % €(000) €(000) €(000)
SAPSYSTEMS,APPLICATIONSANDPRODUCTSINDATAPROCESSING (THAILAND)LTD.,Bangkok,Thailand4)
100.0 68,015 −275 11,303 60
SAPTaiwanCo.Ltd.,Taipei,Taiwan 100.0 59,114 4,723 34,776 84
ShanghaiSuccessFactorsSoftwareTechnologyCo.,Ltd.,Shanghai,China 100.0 11,418 288 1,038 166
SuccessFactors(Philippines),Inc.,PasigCity,Philippines 100.0 2,100 −60 56 82
SuccessFactorsAsiaPacificLimited,HongKong,China 100.0 5 0 212 –
SuccessFactorsAustraliaHoldingsPtyLtd.,Brisbane,Australia 100.0 – −4,795 9,592 –
SuccessFactorsAustraliaPtyLimited,Brisbane,Australia 100.0 20,413 2,475 36,112 94
SuccessFactorsBusinessSolutionsIndiaPrivateLimited,Bangalore,India 100.0 7,798 353 636 167
SuccessFactorsHongKongLimited,HongKong,China 100.0 2,755 105 184 11
SuccessFactorsJapanK.K.,Tokyo,Japan 100.0 3,001 −143 −15 14
SuccessFactorsKoreaLtd.,Seoul,SouthKorea 100.0 23 1 35 –
SuccessFactorsSingaporePte.Ltd.,Singapore,Singapore 100.0 3,150 141 217 11
SybaseAustraliaPtyLtd,Sydney,Australia 100.0 – −17,015 107 –
SybaseHongKongLtd,HongKong,China 100.0 – 74 422 –
SybaseIndiaLtd.,Mumbai,India 100.0 – −9 2,112 –
SybasePhilippines,Inc.,MakatiCity,Philippines 100.0 – 15 −8 –
SybaseSoftware(China)Co.Ltd.,Beijing,China 100.0 33,119 1,026 17,265 331
SybaseSoftware(India)PrivateLtd,Mumbai,India 100.0 17,269 1,110 8,382 219
TomorrowNowAustraliaPtyLtd,Sydney,Australia 100.0 – −1 – –
TomorrowNowSingaporePteLtd,Singapore,Singapore 100.0 – −7 – –
277Notes to the Consolidated Financial Statements

As at December 31, 2013 Ownership3) Total Revenuein20131)
Profit/ Loss(–) afterTax
for 20131)
TotalEquity as at
12/31/20131)
Number ofEmployees
as at 12/31/20132)
NameandLocationofCompany % €(000) €(000) €(000)
II. InVEStmEntS In ASSOCIAtESAlteryx,Inc.,Irvine,California,USA 15.42 21,168 −4,781 −728 171
ChinaDataComCorporationLimited,Guangzhou,China 28.30 47,689 4,456 37,361 1,049
GreaterPacificCapital(Cayman)L.P.,GrandCayman,CaymanIslands12) 5.35 497 −822 285,845 –
Original1GmbH,FrankfurtamMain,Germany13) 40.00 – – – –
ProcurementNegóciosEletrônicosS/A,RiodeJaneiro,Brazil 17.00 23,033 1,063 12,655 –
1) ThesefiguresarebasedonourlocalIFRSfinancialstatementspriortoeliminationsresultingfromconsolidationandtherefore donotreflectthecontributionofthesecompaniesincludedintheConsolidatedFinancialStatements.Thetranslationoftheequityinto Groupcurrencyisbasedonperiod-endclosingexchangerates,andonaverageexchangeratesforrevenueandnetincome/loss.
2) AsatDecember31,2013,includingmanagingdirectors,inFTE.3) Nochangesinownershippercentageunlessotherwisespecifiedinthefootnotes.4) Duringtheyear2013,SAP'sownershipofthefollowingsubsidiarychanged:SAPSYSTEMS,APPLICATIONSANDPRODUCTSINDATAPROCESSING(THAILAND)LTD.,Bangkok,Thailand (2012:49%);QuadremAfricaPty.Ltd.,Johannesburg,SouthAfrica(2012:49%).
5) Consolidatedforthefirsttimein2013.6) AgreementswiththeothershareholdersprovidethatSAPAGfullycontrolstheentity.7) SAPAGdoesnotholdanyownershipinterestsinfourstructuredentities,SAPV(Mauritius),SAPHANARealTimeFund,SAPVenturesFundI,L.P.andSAPVenturesFundII,L.P.However, basedonthetermsoflimitedpartnershipagreementsunderwhichtheseentitieswereestablished,SAPAGisexposedtothemajorityofthereturnsrelatedtotheiroperationsand hasthecurrentabilitytodirecttheseentities'activitiesthataffectthesereturns,inaccordancewithIFRS10.Accordingly,theresultsofoperationsareincludedinSAP’sconsolidatedfinancialstatements.
8) EntitywhosepersonallyliablepartnerisSAPAG.9) Entitywithprofitandlosstransferagreement.10) PursuanttoHGB,section264(3)orsection264b,thesubsidiaryisexemptfromapplyingcertainlegalrequirementstotheirstatutory stand-alonefinancialstatementsincludingtherequirementtopreparenotestothefinancialstatementsandareviewofoperations, therequirementofindependentauditandtherequirementofpublicdisclosure.
11) Pursuanttosections479Ato479CoftheUKCompaniesAct2006thesubsidiariesareexemptfromhavingtheirfinancialstatementsaudited onthebasisthatSAPAGhasprovidedaguaranteeofthesesubsidiaries'liabilitiesinrespectoftheirfinancialyearended31December2013.
12) GreaterPacificCapital(Cayman)ispartofafund-of-fundsconceptactingasoneofthefeeder-fundstothepartnership.Thereareneither financialstatementsfortheyearendedDecember31,2013norbudgetorforecastavailablehencetheinformationprovidedisbasedonthe auditedfinancialstatementsfortheyearendedDecember31,2012.
13) Original1GmbHisinliquidationandithasnotbeenderegisteredfromthecommercialregisteryet.
278 Consolidated Financial Statements IFRS
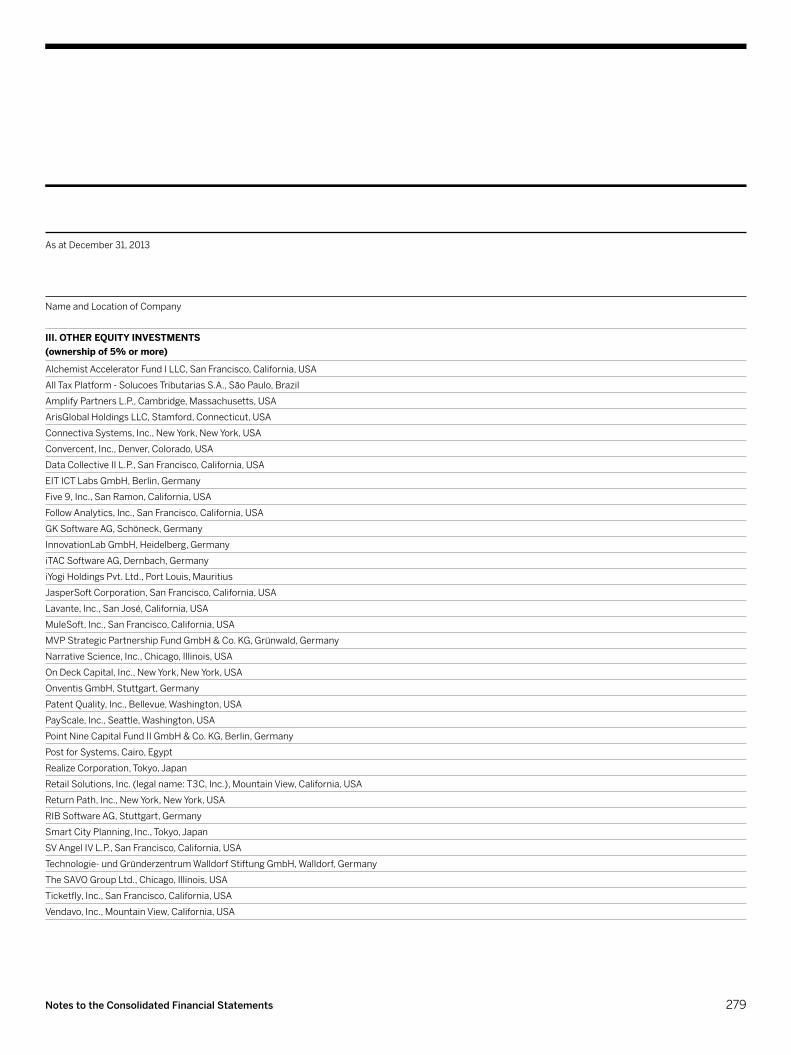
As at December 31, 2013
NameandLocationofCompany
III. OthEr EquIty InVEStmEntS (ownership of 5% or more)
AlchemistAcceleratorFundILLC,SanFrancisco,California,USA
AllTaxPlatform-SolucoesTributariasS.A.,SãoPaulo,Brazil
AmplifyPartnersL.P.,Cambridge,Massachusetts,USA
ArisGlobalHoldingsLLC,Stamford,Connecticut,USA
ConnectivaSystems,Inc.,NewYork,NewYork,USA
Convercent,Inc.,Denver,Colorado,USA
DataCollectiveIIL.P.,SanFrancisco,California,USA
EITICTLabsGmbH,Berlin,Germany
Five9,Inc.,SanRamon,California,USA
FollowAnalytics,Inc.,SanFrancisco,California,USA
GKSoftwareAG,Schöneck,Germany
InnovationLabGmbH,Heidelberg,Germany
iTACSoftwareAG,Dernbach,Germany
iYogiHoldingsPvt.Ltd.,PortLouis,Mauritius
JasperSoftCorporation,SanFrancisco,California,USA
Lavante,Inc.,SanJosé,California,USA
MuleSoft,Inc.,SanFrancisco,California,USA
MVPStrategicPartnershipFundGmbH&Co.KG,Grünwald,Germany
NarrativeScience,Inc.,Chicago,Illinois,USA
OnDeckCapital,Inc.,NewYork,NewYork,USA
OnventisGmbH,Stuttgart,Germany
PatentQuality,Inc.,Bellevue,Washington,USA
PayScale,Inc.,Seattle,Washington,USA
PointNineCapitalFundIIGmbH&Co.KG,Berlin,Germany
PostforSystems,Cairo,Egypt
RealizeCorporation,Tokyo,Japan
RetailSolutions,Inc.(legalname:T3C,Inc.),MountainView,California,USA
ReturnPath,Inc.,NewYork,NewYork,USA
RIBSoftwareAG,Stuttgart,Germany
SmartCityPlanning,Inc.,Tokyo,Japan
SVAngelIVL.P.,SanFrancisco,California,USA
Technologie-undGründerzentrumWalldorfStiftungGmbH,Walldorf,Germany
TheSAVOGroupLtd.,Chicago,Illinois,USA
Ticketfly,Inc.,SanFrancisco,California,USA
Vendavo,Inc.,MountainView,California,USA
279Notes to the Consolidated Financial Statements
Walldorf,February20,2014
SAP AGWalldorf, BadenTheExecutiveBoard
Bill McDermott Jim Hagemann Snabe
Werner Brandt Gerhard Oswald
Vishal Sikka
280 Consolidated Financial Statements IFRS
U.S.lawrequiresthatmanagementsubmitareportontheeffectivenessofinternalcontroloverfinancialreportingintheconsolidatedfinancialstatements.For2013,thatreportis asfollows:
ThemanagementofSAPisresponsibleforestablishingandmaintainingadequateinternalcontroloverfinancialreportingassuchtermisdefinedinRules13a-15(f)and15d-15(f)undertheU.S.SecuritiesExchangeActof1934.SAP’sinternalcontroloverfinancialreportingisaprocessdesignedunderthesupervisionofSAP’sco-CEOsandCFOtoprovidereasonableassuranceregardingthereliabilityoffinancialreportingand thepreparationoffinancialstatementsforexternalreportingpurposesinaccordancewithInternationalFinancialReportingStandards(IFRS)asissuedbytheInternationalAccountingStandardsBoard(IASB).
SAP’smanagementassessedtheeffectivenessoftheCompany’sinternalcontroloverfinancialreportingasatDecember31,2013.Inmakingthisassessment,itusedthecriteriasetforthbytheCommitteeofSponsoringOrganizationsoftheTreadwayCommission(COSO)inInternalControl-IntegratedFramework(1992).
Basedontheassessmentunderthesecriteria,SAPmanagementhasconcludedthat,asatDecember31,2013,theCompany’sinternalcontroloverfinancialreportingwaseffective.
KPMGAGWirtschaftsprüfungsgesellschaft,ourindependentregisteredpublicaccountingfirm,hasissueditsattestationreportontheeffectivenessofSAP’sinternalcontroloverfinancialreporting.Itisincludedintheindependentauditor’sreportontheConsolidatedFinancialStatementsandManagementReportasatDecember31,2013.
Management’s Annual Report on InternalControl over Financial Reporting inthe Consolidated Financial Statements
281Management’s Annual Report on Internal Control

Five-year Summary
Analyze our financial, social, and environmental
performance over the past five years.
To learn more about SAP’s performance please visit www.sapintegratedreport.com
Additional InformationFive-YearSummaryGlossaryAddressesFinancialandSustainabilityPublicationsFinancialCalendarPublication Details
283284287308309310311
283
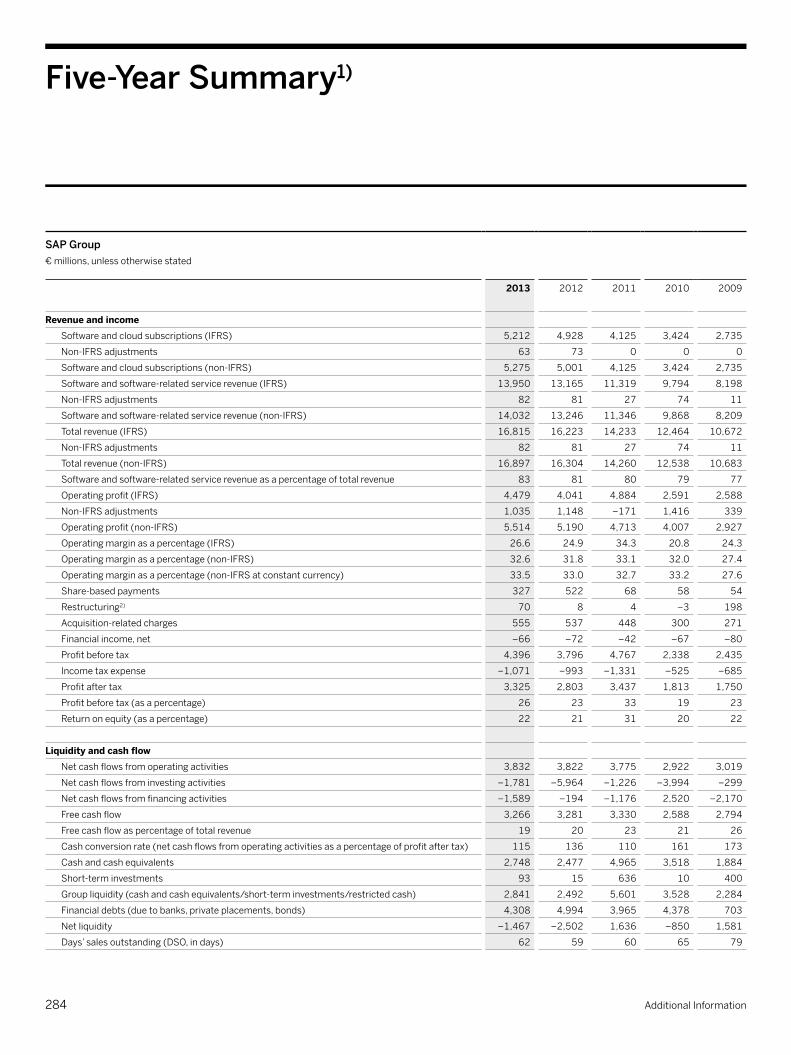
Five-Year Summary1)
SAP Group€millions,unlessotherwisestated
2013 2012 2011 2010 2009
Revenue and incomeSoftwareandcloudsubscriptions(IFRS) 5,212 4,928 4,125 3,424 2,735
Non-IFRSadjustments 63 73 0 0 0
Softwareandcloudsubscriptions(non-IFRS) 5,275 5,001 4,125 3,424 2,735
Softwareandsoftware-relatedservicerevenue(IFRS) 13,950 13,165 11,319 9,794 8,198
Non-IFRSadjustments 82 81 27 74 11
Softwareandsoftware-relatedservicerevenue(non-IFRS) 14,032 13,246 11,346 9,868 8,209
Totalrevenue(IFRS) 16,815 16,223 14,233 12,464 10,672
Non-IFRSadjustments 82 81 27 74 11
Totalrevenue(non-IFRS) 16,897 16,304 14,260 12,538 10,683
Softwareandsoftware-relatedservicerevenueasapercentageoftotalrevenue 83 81 80 79 77
Operatingprofit(IFRS) 4,479 4,041 4,884 2,591 2,588
Non-IFRSadjustments 1,035 1,148 –171 1,416 339
Operatingprofit(non-IFRS) 5,514 5,190 4,713 4,007 2,927
Operatingmarginasapercentage(IFRS) 26.6 24.9 34.3 20.8 24.3
Operatingmarginasapercentage(non-IFRS) 32.6 31.8 33.1 32.0 27.4
Operatingmarginasapercentage(non-IFRSatconstantcurrency) 33.5 33.0 32.7 33.2 27.6
Share-basedpayments 327 522 68 58 54
Restructuring2) 70 8 4 –3 198
Acquisition-relatedcharges 555 537 448 300 271
Financialincome,net –66 –72 –42 –67 –80
Profitbeforetax 4,396 3,796 4,767 2,338 2,435
Incometaxexpense –1,071 –993 –1,331 –525 –685
Profitaftertax 3,325 2,803 3,437 1,813 1,750
Profitbeforetax(asapercentage) 26 23 33 19 23
Returnonequity(asapercentage) 22 21 31 20 22
liquidity and cash flowNetcashflowsfromoperatingactivities 3,832 3,822 3,775 2,922 3,019
Netcashflowsfrominvestingactivities –1,781 –5,964 –1,226 –3,994 –299
Netcashflowsfromfinancingactivities –1,589 –194 –1,176 2,520 –2,170
Freecashflow 3,266 3,281 3,330 2,588 2,794
Freecashflowaspercentageoftotalrevenue 19 20 23 21 26
Cashconversionrate(netcashflowsfromoperatingactivitiesasapercentageofprofitaftertax) 115 136 110 161 173
Cashandcashequivalents 2,748 2,477 4,965 3,518 1,884
Short-terminvestments 93 15 636 10 400
Groupliquidity(cashandcashequivalents/short-terminvestments/restrictedcash) 2,841 2,492 5,601 3,528 2,284
Financialdebts(duetobanks,privateplacements,bonds) 4,308 4,994 3,965 4,378 703
Netliquidity –1,467 –2,502 1,636 –850 1,581
Days’salesoutstanding(DSO,indays) 62 59 60 65 79
284 Additional Information

SAP Group€millions,unlessotherwisestated
2013 2012 2011 2010 2009
Assets, equity and liabilitiesTradeandotherreceivables 3,963 4,005 3,577 3,177 2,598
Total current assets 7,352 6,928 9,669 7,143 5,255
Totalnon-currentassets 19,741 19,378 13,558 13,696 8,119
Deferredcloudsubscriptionandsupportrevenue(IFRS) 443 317 4 2 0
Non-IFRSadjustments 4 40 0 0 0
Deferredcloudsubscriptionandsupportrevenue(non-IFRS) 447 358 4 2 0
Totalcurrentliabilities(includingdeferredincome) 6,347 6,546 6,266 5,153 3,416
Totalnon-currentliabilities(includingdeferredincome) 4,699 5,627 4,254 5,862 1,467
Totalequity(includingnon-controllinginterests) 16,048 14,133 12,7079) 9,824 8,491
Total assets 27,094 26,306 23,227 20,841 13,374
Equityratio(totalequityasapercentageoftotalassets) 59 54 55 47 63
Debtratio(totalliabilitiesasapercentageoftotalassets) 41 46 45 53 37
Investmentsingoodwill,intangibleassetsorproperty,plant,andequipment (includingcapitalizationsduetoacquisitions)
1,812 6,859 657 5,502 299
Depreciation and amortization 951 863 724 534 499
Operating expensesCostofsoftwareandsoftware-relatedservices 2,597 2,555 2,107 1,823 1,658
Costofprofessionalservicesandotherservices 2,402 2,520 2,247 2,071 1,851
Total cost of revenue 4,999 5,075 4,354 3,894 3,509
Researchanddevelopment 2,282 2,261 1,935 1,729 1,591
Researchanddevelopment(asapercentageoftotalrevenue) 14 14 14 14 15
Researchanddevelopment(asapercentageoftotaloperatingexpenses) 18 19 21 18 20
Numberofemployeesinresearchanddevelopmentatyear-end3) 17,804 18,012 15,861 15,884 14,813
Sales and marketing 4,131 3,912 3,083 2,646 2,199
General and administration 866 949 715 636 564
Financial performance measuresIssuedsharesatyear-end(inmillions) 1,229 1,229 1,228 1,227 1,226
Weightedaveragesharesoutstanding,basic(inmillions) 1,193 1,192 1,189 1,188 1,188
Earningspershare,basic(in€) 2.79 2.35 2.89 1.52 1.47
Weightedaveragesharesoutstanding,diluted(inmillions) 1,195 1,193 1,190 1,189 1,189
Earningspershare,diluted(in€) 2.78 2.35 2.89 1.52 1.47
Dividendperordinaryshare(in€) 1.00 0.85 1.10 0.60 0.50
Total dividend distributed4) 1,194 1,013 1,310 713 594
Totaldividenddistributedasapercentageofprofitaftertax 36 36 38 39 34
SAPsharepriceatyear-end(in€) 62.31 60.69 40.85 38.10 33.00
SAPshareprice–peak(in€) 64.80 61.43 45.90 38.40 35.26
SAPshareprice–low(in€) 52.20 41.45 34.26 31.12 25.01
285Five-Year Summary

SAP Group€millions,unlessotherwisestated
2013 2012 2011 2010 2009
Financial performance measures (continued)Marketcapitalization(in€billions) 76.5 74.7 50.2 46.7 40.5
ReturnonSAPordinaryshares5)1-yearinvestmentperiod(asapercentage) 4.20 52.10 8.70 17.00 32.90
ReturnonSAPordinaryshares5)5-yearinvestmentperiod(asapercentage) 21.80 13.10 1.70 1.20 1.30
ReturnonSAPordinaryshares5)10-yearinvestmentperiod(asapercentage) 7.90 13.80 2.20 3.20 –1.20
Employees and personnel expensesNumberofemployeesatyear-end3) 66,572 64,422 55,765 53,513 47,584
Numberofemployees,annualaverage3) 65,409 61,134 54,346 49,970 48,471
Personnelexpenses 7,489 7,286 5,880 5,261 4,963
Personnelexpenses–excludingshare-basedpayments 7,162 6,764 5,812 5,203 4,909
Personnelexpensesperemployee–excludingshare-basedpayments(in€thousands) 109 111 107 104 101
WomenworkingatSAP(asapercentage) 31 30 30 30 29
Women in management7)(total,asapercentage) 21.2 20.8 19.5 18.7 17.6
Women managing managers6),7)(asapercentage) 14.3 14.5 13.5 13.7 14.7
Women managing teams6),7)(asapercentage) 21.7 21.1 20.5 19.6 19.1
EmployeeEngagementIndex(asapercentage) 77 79 77 68 69
BusinessHealthCultureIndex(asapercentage) 67 66 65 59 61
Employeeretention(asapercentage) 93.5 94.0 92.8 92.9 94.2
Totalturnoverrate(asapercentage) 8 7 9 9 11
EnvironmentGreenhousegasemissions(inkilotons) 545 485 490 455 480
Greenhousegasemissionsperemployee3)(intons) 8.3 7.9 9.0 8.7 9.2
Greenhousegasemissionsper€revenue(ingrams) 32.4 30.0 34.4 36.4 42.0
Totalenergyconsumption(inGWh) 910 860 860 845 860
Energyconsumedperemployee3)(inkWh) 13,900 14,000 15,700 16,100 16,500
Datacenterenergyconsumed(inGWh) 173 160 154 144 157
Datacenterenergyperemployee3)(inkWh) 2,633 2,598 2,824 2,746 3,001
Renewableenergysourced(asapercentage) 43 51 32 32 0
Customers NetPromoterScore8)(asapercentage) 12.1 8.9 NA NA NA
1) Amountsfor2009to2013accordingtoIFRS,unlessotherwisestated 2) Includes–€5million(2010)and€4million(2009)acquisition-relatedcharges 3) Full-timeequivalents 4) 2013numbersarebasedontheproposeddividendfor2013andon2013closingleveloftreasurystock. 5) Assumingalldividendsarereinvested 6) Relatestodifferentlevelsofmanagementposition 7) Numbersbasedonyear-end 8) In2012,weadoptedanewmethodologyformeasuringcustomerloyalty:NetPromoterScore(NPS). TherearethereforenocomparableNPSvaluesforyearspriorto2012.
9) TotalequityafterIAS19(revised)adoption:€12,689million
286 Additional Information

A
ABAP – SAP software programming language.
add-on–SAPapplicationthatistechnicallydependenton–andcanonlybeinstalledontopof–anotherSAPapplication.
Americas’ SAP Users’ Group (ASUG)–Non-profitorganizationof SAP customer companies dedicated to providing educational and networking opportunities in support of SAP software and implementation.TheseusergroupsareestablishedinregionsaroundtheworldtoshareknowledgeandinfluenceSAPdevelopmentefforts.ASUGisthelargestusergroupwithmorethan50,000membersintheAmericas.
analytics–Dataanalysistypicallygeneratedintheformofreportsandchartsthatcanbeusedforbusinessinsightanddecision making.
analytics solutions from SAP–AnalyticssolutionsfromSAPenablepeopletounleashthepowerofcollectiveinsightin BigDatabyempoweringthemwiththerightinformationattherighttimetomakeinsightfulbusinessdecisions,anticipatechange,anduncovernewopportunities.WhenpoweredbySAPHANA,companiescanunleashthepowerofreal-timecollective insightbyovercomingtheclassictrade-offbetweenthespeed andflexibilityofdataanalysis.Ouranalyticsofferingscovertheareas of business intelligence, enterprise performance man-agement, and governance, risk, and compliance.
application–Softwarethatenablesorganizationstoperformcertainbusinessprocessesoractivitiesandtoaddressspecificbusiness needs.
applied analytics–CategoryofofferingswithintheanalyticssolutionsfromSAPportfoliocomprisingindividualofferingsforanalyticapplications,analyticcontent,andaccelerators.
Ariba–SAP’sacquisitionofAriba,Inc.,aleadingcloud-basedbusiness commerce network, completed on October 1, 2012. Allcloud-relatedsupplierassetsofSAParenowconsolidatingunderAriba,whichoperatesasanindependentbusiness under thename“Ariba,anSAPcompany.”Aribasolutionsforprocurement,financials,andsourcing,aswellastheAriba Network,continuetomaintaintheAribabrand.
Ariba Network–Businesscommercenetworkwhere com paniesofallsizescanconnecttotheirtradingpartnersanywhere,atanytimefromanyapplicationordevicetobuy,sell,andmanagetheircashmoreefficientlyandeffectivelythaneverbefore.CompaniesaroundtheworldusetheAribaNetworktosimplifyinter-enterprisecommerceandenhancetheresultstheydeliver.See“businessnetwork.”
b
benchmarking – Process of measuring products, services, andpracticesagainstthoseofleadingcompanies,which can also be used as a reference point of measurement for evalu ating best practices.
best practice–Amanagementconceptthatinvolvesdevisingamethodofprocessthatmosteffectivelyproducesadesiredoutcome.SAPapplicationsusebusinessbestpracticestohelpcustomersautomatecommonbusinessprocessesthroughsoftwareandtechnology.See“SAPBestPractices.”
Big Data–Thelargevolumeofdatacreatedbybillionsof connected devices and people generating a tremendous amountofinformationabouttheirbehavior,location,andactivity.Thisavailabilityofmassiveamountsofdatarequirescompaniestorethinktechnologyarchitectureanddatabasestructures.
Business Health Culture Index–Ascoreforthegeneralculturalconditionsinanorganizationthatenableemployees tostayhealthyandbalanced.Theindexiscalculatedbasedontheresultsofregularemployeesurveys.
Glossary
287Glossary
core applications – Standard business applications available inSAPBusinessSuite,includingSAPERP,SAPCustomerRelationshipManagement(SAPCRM),SAPProductLifecycle Management(SAPPLM),SAPSupplyChainManagement(SAPSCM),andSAPSupplierRelationshipManagement (SAPSRM).
core solutions–Offeringsforstandardbusinessapplicationsandtechnologiesthatprovidecustomerswithastable,consistentsolutionsuitethatallowsthemtobemoreefficientand agile, make decisions in real time, and create new value fortheirowncustomers.See“coreapplications.”
CO2 equivalent–Ameasuretocomparetheemissionsofvariousgreenhousegasesbasedupontheirglobalwarmingpotential.Forexample,theglobalwarmingpotentialformethaneover100yearsis21.Thismeansthatemissionsofone millionmetrictonsofmethaneareequivalenttoemissionsof 21millionmetrictonsofcarbondioxide.
custom development project (CDP)–Realizationofacustom-developedsolutionthatmeetsuniquebusinessneeds,realizedatSAPorinacustomer’sdevelopmentsystem.
customer connection – A simple process directed at incrementallyenhancingandimprovingtheproductsandsolutionsSAPcustomersareusingtoday.ItoffersSAPcustomerstheopportunitytosuggestsmallenhancementstoproducts and solutions in mainstream maintenance, for fast andnon-disruptivedeliveryusingnotesandsupportpackages.
D
data center energy –TheamountofenergyconsumedinSAP’sdatacentersrelatedtothenumberofemployees(expressedinfull-timeequivalents/FTEs).
data warehouse – An electronic collection of information organizedforeasyaccessbycomputerprograms.See“SAPNetWeaverBusinessWarehouse.”
design thinking–Amethodologyforroutineinnovationthatbringstogethertherightsideofthebrain(creative)withtheleftsideofthebrain(analytical).
business intelligence (BI)–Softwarethatenablesuserstoanalyzeanorganization’srawdataandmakefact-baseddecisions.BI-relatedprocessesincludedatamining,analytical processing,querying,andreporting.SAPBusinessObjects BIsolutionsincludetheSAPBusinessObjectsBIplatform,SAPCrystalReports,SAPBusinessObjectsDashboards,andSAPLumira.
business network–Anonlineservicethatconnects businessesandtheirsystemstothoseoftheirtradingpartnersandenablesnewprocessesandinformationandinsightsharingonlypossibleinadigitalenvironment.See“AribaNetwork.”
business user–Employeeswhospendsignificanttimefindingandsharinginformation,collaboratingwithothers,coordinat-ingprojects,devisingstrategyoroperationaltactics,andcom-ingupwithnewideasbasedoninformationgatheredfrom multiple sources. Also called knowledge or information workers or business consumers.
business warehouse–See“datawarehouse.”
C
channel partner–SAPpartnercategorythatincludesvalue-addedresellers(VARs),independentsoftwarevendors(ISVs),andvalue-addeddistributors.
cloud computing–Generictermforflexible,IT-relatedservicesavailablethrough,orhostedon,theInternetforconsumers and business, including storage, computing power, software development environments, and applications, combined withservicedelivery.Accessedasneeded“inthecloud,”these serviceseliminatetheneedforin-houseITresources.See “softwareasaservice.”
288 Additional Information
disruptive technology–Processbywhichaproductorservicetakesrootinitiallyinsimpleapplicationsatthebottomof amarketandthenrelentlesslymoves“upmarket,”eventuallydisplacingestablishedcompetitors.TermcoinedbyClaytonChristensen.
DSAG – Abbreviation for DeutschsprachigeSAP-Anwender-gruppe(German-SpeakingSAPUsers’Group),which hasaround43,062membersfrom2,735companiesin German-speakingcountriesandbeyond.
E
ecosystem–ConstructencompassingSAPanditscustomersandpartnersthatextendsthevalueSAPprovidestoits customers.Bybringingtogethercommunity-basedinsight,innovativepartnersolutions,andindustry-leadingcollaborationandco-innovation,itenablescustomerstoextractthegreatestpossiblevaluefromtheirSAPinvestments.
embedded analytics–Incorporatingbusinessintelligencewithinoperationalapplicationsandbusinessprocesses.
Employee Engagement Index–Ascoreforthelevelofemployeecommitment,pride,andloyalty,aswellasthefeelingofemployeesofbeingadvocatesfortheircompany.
employee retention–Theratiooftheaverageheadcount(expressedinfull-timeequivalents/FTEs)minusemployee- initiatedterminations(turnover)dividedbytheaverage headcount,takingintoaccountthepast12months.
enabler effect–Reductionofgreenhousegasemissions andincreaseofenergysavingsintheentireeconomythroughinnovativetechnologyprovidedbytheICTsector.
end-to-end process–Setofactivitiessupportingdefinedmanagement,core,orsupportprocesses.Customerscanusetheseactivitiesasareferencetomaptheirownprocesses.
end-to-end solution–Softwaresolutionthatcoversone end-to-endprocess.
enhancement package–Optionalsoftwarepackagesthatenablecompaniestotakeadvantageofinnovationwhilekeepingtheircoresoftwarestable.Enhancementpackagescontainimprovedgeneralbusinessandindustryfunctionality,enterpriseservices,andotheruserinterfaceandfunctionalimprovements. Organizations can activate selected business functions containedwithintheenhancementpackagesanddeploythemontheirowntimetablewithminimaldisruptiontobusiness operations.
enterprise mobility–Termusedinbusinessandindustrytorefertotheconceptandapproachtomakingabusinessmobile.AtSAP,weuse“enterprisemobility"asourumbrellatermforanoverallmobilestrategy.
enterprise resource planning–See“SAPERP.”
enterprise service–AsetofhighlyintegratedWebservicesthatcanbeaccessedandusedrepeatedlybyapplicationstosupportbusinessprocesses.Usedasbuildingblocksfor composing larger units of software, enterprise services can be quicklydefinedbySAPoritspartnersandassembledto compose new applications and enable new business processes. See Web service.
environmental impact–Apositiveornegativechangeto thenaturalenvironment.
G
Global Reporting Initiative (GRI)–Anon-profitorganizationthatprovidescompaniesandorganizationswithacomprehensivesustainabilityreportingframeworkthatiswidelyusedaroundtheworld.
greenhouse gas footprint–Thesumofallgreenhousegasemissionsmeasuredandreported,includingrenewableenergyandthird-partyreductions,forexample,offsets.
289Glossary
Internet of Things–Afusionofthedigitalworldandthephysical worldthatbringstogetherdifferentconceptsandtechnicalcomponents.Everydayobjectsandmachineshavesensorsthatcan“communicate”witheachotherovertheInternet,making new models possible for business processes, collabo-ration, miniaturization of devices, and mobile communications. SAPoffersseveralsolutionsthataddresstheInternetofThings.
ISO 14001–Astandardforenvironmentalmanagementsystemsthatprovidespracticaltoolsforcompaniesandorganizationstoidentifyandcontroltheirenvironmentalimpactandconstantlyimprovetheirenvironmentalperformance.
K
key performance indicator (KPI)–Performancefigureforwhichthresholdvaluesaredefinedandagainstwhichvalidationisexecuted.
l
lean – Set of manufacturing principles originating from JapanesecarmanufacturerToyotathatfirstdefinescustomervalue,thenreorganizeseverysteprequiredtodesign,order,build,deliver,andmaintainthisvalueacrossalltheorganizationsandunits.Asaresult,firmscandomorewithless,respondmorequicklytocustomerneeds,createjobsthataremorerewardingforemployees,andreducetheirimpacton theenvironment.
legal change–CorrectiontoSAPsoftwaretoadaptanSAP softwarereleasetochangesinlegalandregulatoryrequirements.
line of business (LoB)–Internalorganizationalareaorbusinessunitinacompany(division)thatcombinesallrespon-sibilities for a particular product, group, or set of processes. Examplesincludesales,purchasing,humanresources,finance,marketing, and so on.
line-of-business (LoB) applications–Inthecontextof computing, a set of core software applications vital to running an enterprise,suchasaccounting,HR,procurement,andsoon.
I
inclusivity–Foranorganizationthatacceptsitsaccountabilitytothoseitimpactsandwhoimpactit:Theparticipation ofstakeholdersindevelopingandachievingastrategicandaccountableresponsetosustainability.
independent software vendor (ISV)–Companythatmakesandsellssoftwareproductsthatrunononeormorecomputerhardwareoroperatingsystemplatforms.
industry–Aneconomicsectorcharacterizedbyavaluechain,businessprocesses,andasetofproductsandservicesthat istypicalorcommonforallcompaniesbelongingtothis sector.AtSAP,“industries”isalsousedasatermtodifferentiatebetweenlines-of-businessfunctionssuchasmarketing, procurement,andfinance,andthosefunctionsspecifictoanindustry.SAPhassoftwareportfoliosthataddressthebusinessneedsof25differentindustries.
industry application–Softwareunitsupportingaspecificcollectionofbusinessprocessesrequiredtoaddressthebusinessneedsofaspecificindustry.
in-memory computing – A major advance in information technologythatcreatesadramaticchangeincomputing,analytics,anddatastorage.Combiningadvancesinmulticore processingwithmoreaffordableservers,in-memorycomputingallowsinformationtobestoredinthemainmemoryratherthaninrelationaldatabasestogreatlyaccelerateprocessingtimes.ItdisruptsthetraditionalITstackcomprisedofhard-ware,middleware,andsoftware,wheredisk-basedrelationaldatabases can become bottlenecks.
in-memory database–Databasethatkeepsallactiverecordsinmainmemoryratherthanondisk.Accessingin-memoryrecordsisconsiderablyfasterthanretrievingthemfromthedisk,significantlyincreasingperformance.SAPHANAis SAP’sgroundbreakingdatabasethatallowsbusinessestotakeadvantageofin-memorycomputing.See“SAPHANA.”
290 Additional Information
M
mainstream maintenance–FirstSAPmaintenancephase,whichincludesthefullscopeofsupport.Itisfollowedby anextendedmaintenance,customer-specificmaintenance,orpriority-onesupportphase.
maintenance – Software support comprising support for legalchangesandcorrectionsdeliveredthroughtheSAPNotes tool, support packages, problem support, and access to informationandonlineservicechannels–dependingonthemaintenancephase.
maintenance strategy–Setofrulesthatdeterminethelengthand conditions of maintenance for SAP software releases. Detailedrulescandifferdependingonthetypeofapplication.
mobile apps – Applications for mobile devices available for download,demo,andpurchaseonSAPStore,AppStore,andotheronlinestores.Mobileappsarecategorizedaseither business/productinfocusorasconsumer-focused.ATSAP,ourmobileappsaretask-oriented(productivityoranalytical)orallowfullaccess(process)toexistingon-premisesoftware.
mobile solutions–MobilesolutionsfromSAPprovideafoundationforenterprisemobilityandseamlessintegrationwiththecoreenterpriseapplicationsofourcustomers. Ourportfolioofmobilesolutionsincludesenterprisemobilitymanagement,includingtheSAPAfariamobiledevicemanagementsolutionandtheSAPMobileDocumentssolution;mobileapps;andSAPMobilePlatform.
N
Net Promoter Score (NPS)–Describesthewillingnessof customers to recommend or promote an organization or companytoothers.Itisdefinedasthepercentageofcustomersthatarelikelytorecommendanorganizationorcompany tofriendsorcolleagues(promoters)minusthepercentageofcustomersthatareunlikelytodoso.
“the networked economy”–Conditionintoday’smarketplace,wherebusinessesandtheirsystemsareconnectedtodigitalcommunitiesofexistingandpotentialpartners.Themovetothisnew,interenterpriseoperatingmodelisacceleratedbytrendssuchascloudcomputing,enterprisemobility,andtheconvergence of enterprise applications and social media. SeeAribaNetwork.
non-profit or not-for-profit – A corporation or an association thatconductsbusinessforthebenefitofthepublicwithoutshareholdersandwithoutaprofitmotive.
O
(carbon) offset or greenhouse gas (GHG) offset – A unit ofcarbondioxide-equivalent(CO2equivalent)thatisreduced,avoided,orsequesteredtocompensateforemissions occurringelsewhere.
on demand–Modelofsoftwaredeploymentwherebyproviderslicenseanapplicationtocustomersforuseasaservicewhentheyneedit,thatis,“ondemand.”Iteliminatestheneed foron-siteITresourcestomanageinfrastructureandtherebyreducesoperationalexpenses.Duetotheirsoftware-as-a- servicenature,on-demandsolutionsareoftenavailableinthecloud.
on device–Anytime,anywhereaccesstoSAPapplicationsanddatafromanytypeofwiredorwirelessdevice(desktop,laptop,mobile,tablets,sensors,andsoon).
on premise–Traditionalmodelofsoftwaredeploymentwhereenterprisespurchasesoftwarelicensesanddeployapplicationsin-house.
291Glossary
predictive analytics–Bringsadvancedanalyticscapabilitiestoabroadspectrumofuserstohelpuncovernewbusinessopportunities,predicttrends,andproactivelyrespondto change.TherecentacquisitionofKXENenablesSAPtoextendpredictiveanalyticstoolsbeyonddatascientiststoline-of-businessusersandanalystsintheworkplacebyautomatingkeymodelingandanalyticaltasksandenablingfasterdeploymentandadoption.AvailableinSAPPredictiveAnalysissoftware.
priority-one support – An additional optional maintenance phaseofferedafterexpirationofmainstreammaintenanceforspecificreleasesoftheSAPBusinessObjectsBusiness IntelligenceplatformandformerSAPBusinessObjectssolutionsnolongeractivelysoldormarketed.
product–Anon-versionedhigh-levelviewofsoftwarefrom asoftwarelogisticsperspective.Itisa“bracket”thatcontainscorresponding software product versions.
Product Availability Matrix (PAM)–DatabasethatbundlestechnicalandreleaseplanninginformationonSAPcompo-nentsforquickreference.InformationontheavailabilityofSAPcomponent releases and maintenance end dates, as well as release information are available.
product footprint –Theenvironmentalimpactofproducts,processes,orservicesbyproduction,usage,anddisposal.
product instance–Agroupoftechnicallydependentsoftwarecomponentversionsthatarepartofa(software)product versionandhavetobeinstalledandoperatedonasinglelogicalsystem/server.Thesoftwareproductinstancesofasoftwareproductversionshowthemaximaldistributionpossibility ofthesoftwareproductversion.Alsoknownas“software productinstance.”
product line–Individualproductsgroupedtogetherbasedontheirmainbrandnames,includingallversions,technicalreleases,editions,options,add-ons,deliverytypes,andrelatedtools.Example:Theproductline“SAPCustomerRelationshipManagement”wouldincludeSAPCRM7.0,SAPCloudforSales,SAPCloudforService,SAPCRMrapid-deploymentsolution,theSAPCustomerInsightmobileapp,andsoon.
One SAP–AnorganizationalapproachatSAPthatpromotesstrongcollaborationamongallareasofthecompanyacrossservices,software,andecosystem,supporting“onefacetothecustomer.”
open source–Softwarebasedontheconceptofsoftwaredeveloperscomingtogethertobuildavirtualcommunityandsolvingacommonproblembydevelopingworkingsoftwarethateveryonehasarighttochange.SuccessfuldevelopmentprojectsundertheopensourcemodelincludeLinux–afreeoperatingsystemsupportedbySAP.
original equipment manufacturer (OEM)–Companythatproducesaproductorcomponenttobepurchasedforsaleorusebyothermanufacturersorthatincorporatesapurchasedproductorcomponentintoitsownnewproductforfurthersale.
P
plug-in–Softwarethatenhancesthefunctionalityofan existingapplication.
point of sale (POS) – Generic term used in distribution to describeallinformationthatisrecordedatthetimeaproductissold.Thedatatypicallyincludesthelocationofthesale,pricepoint,SKU,end-usercontactinformation,andpartnercontactinformation.TheSAPPoint-of-Saleapplicationcanhelpretailbusinessesreducetheoperatingcostsofstoresystems–whiledeliveringanenhancedcustomerexperience.
“powered by SAP HANA”–AnSAPofferingpoweredby SAPHANArunsontheSAPHANAplatform.Morethan100SAPapplicationsarecurrently“poweredbySAPHANA.” PartnersolutionsorapplicationsthatarepoweredbySAPHANAarecertifiedbySAPtorunontheSAPHANAplatform.Theseapplicationstakeadvantageofdistinctivecapabilities ofSAPHANAtodeliverkeybenefits,suchassimpleradminis-tration,reducedoverhead,andbetterbusinessintelligenceoverconventionaltraditionaltechnologyplatforms.
292 Additional Information
product version – One or more software component versions madeavailableatthesametimeforimplementinga well-definedscopeoffunctionality.Theversionsofaproductfulfilltheprincipleoffunctionalcontinuity.Fromadeliverypointofview,theversionindicatesthereleaseofaproductandcaneitherbestand-aloneoradd-on.Alsoknownas“softwareproductversion.”
R
Ramp-Up Knowledge Transfer – SAP training program thatdeliversearlyproduct-relatedknowledgetopresales,sales,consultants,partners,andsupportteams.Thisprogramcontributestothesuccessfulimplementationoframp-upprojectsandisacrucialelementoftheramp-upprocessintheproductinnovationlifecycleatSAP.
release–SAPsoftwarethathasaversionnumber,isshippedataparticulartime,andhasdefinedmaintenancephases.
release-to-customer date–Datethatmarkstheinitialavailabilityofareleasetocustomersandthebeginningoftherestrictedshipmentphase.
renewable energy–Thesharesandtypesofelectricityobtainedfromrenewablesourcessuchashydro,wind,solar,geothermal,andbiomass.Itiscalculatedbyaddingtheamountofrenewableenergyspecificallysourced,producedon-sitebyourownsolarcellsandcoveredbyRenewableEnergyCertificates(RECs).
restricted shipment phase–Firstphaseofareleasedelivery,whichisrolledoutwithintheframeworkoftheSAPRamp-Upprogram.Theprogramdetermineshowmanycustomersreceivethereleaseandincreasesdistributioninacontrolledway.Thisphaseisfollowedbytheunrestrictedshipmentphase.
road map–Producttimelinethathasavarietyofobjectives,includingcommunicationtocustomers,users,orotherpartiesinterestedinthetimingoffutureproductreleases;thefeaturesplannedforthosereleases;generalprioritizationoffeatures;andinsomecases,therequirementsoffeaturesinenoughdetailthatcurrentandprospectivecustomerscangivefeed-backonthefeatureitselfandtheproduct’sdirection.
S
SAP ActiveEmbedded–Enhancedengagementservicesforoptimizingsolutionsandacceleratingadoptionoftechnologieswithoutdisruptingcustomerbusinesses.
SAP Active Global Support (SAP AGS) – A global organization withmorethan4,000supportengineersanddevelopersthatfocusesonsupportofferings,helpingcompaniesmanagetheapplicationlifecycleandoptimizesolutionperformanceandconsequentlymanagecomplexity,mitigaterisks,andcontrolcosts.Theservicesareavailablethroughsevenstrategicallylocatedglobalsupportcentersandmorethan30localsupportcenters.
SAP Adaptive Server Enterprise (SAP ASE)–Ahigh-performancerelationaldatabasemanagementsystemformission-critical,data-intensiveenvironments.Itensureshighestoperationalefficiencyandthroughputonabroadrangeof platforms.Keyfeaturesincludedataencryptiontoprotectfrominternalandexternalbreaches,partitioningtechnologyfor betterperformanceandeasiermaintenance;andvirtualizationandclusteringcapabilitiesforcontinuousavailabilityand efficientuseofresources.FormerlycalledSAPSybaseASE.
SAP Afaria–Amobiledevicemanagementsolutionthat providesasingleadministrativeconsoletocentrallymanage,secure,anddeploymobiledata,applications,anddevices.SAPAfariasimplifiesthemanagementcomplexitiesofaworkforceonthegobymakingthedatastoredandtransmittedbymobiledevices secure.
SAP Best Practices–Packagesthatprovideprovenmethodsand tools for organizations to implement best business practicesinkeyareasandarangeofindustriesusingSAP software.Thepackagesdelivermethodology,documentation,andpreconfigurationthatenablerapid,reliabledeploymentwithquickreturnoninvestment.
293Glossary
SAP Cloud for Financials–Acloud-basedfinancialmanagementsolutionwithanintuitive,easy-to-consumeinterface andpersonalizedinformation.Itfeaturesembedded,dynamicanalytics,enablingcompaniestoachievesuperiorfinancialinsightacrossthebusiness.Customerscanusethesolution todrivestreamlined,end-to-endcompliantfinancialprocesses aswellasreal-timefinancialperformanceinformationforeveryoneinthebusiness.ItincludesthesolutionformelycalledSAPFinancialsOnDemandandispartoftheSAPCloudforFinanceportfolio.
SAP Cloud for Sales, SAP Cloud for Service, and SAP Cloud for Marketing–Individualpeople-centric,cloud-basedportfoliosforsales,service,andmarketingorganizationswithdesigned-insocialcollaborationtohelptransformsocial mediaconversationsintobusinessinsight.TheSAPCloudforSalesportfoliocomplementstheon-premiseSAPCRMapplication,offersenterprisesrunningSAPBusinessSuite,apre-integratedcloudsolutionthatembracesthewaysalesrepresentativescollaborateandimprovestheirproductivity,andincludestheformerSAPSalesOnDemandsolution. TheportfoliosincludetheSAPCloudforSocialEngagementsolutionandthesolutionformerlycalledSAPCustomer OnDemand.
SAP Cloud for Social Engagement–Acloud-basedsolutionthathelpstransformsocialmediaconversationsintobusinessinsight.Marketingandcustomerserviceorganizationscan useittobetterengagewithcustomerstoincreasebrandloyalty,manage reputational risks, and capitalize on opportunities. FormerlycalledSAPSocialOnDemand.
SAP Cloud powered by SAP HANA–In2013,SAPbeganofferingSAPCloudpoweredbySAPHANAthatincludesinfrastructure,platform,andsoftwareasservicesinthecloud,incorporatingtheformerSAPHANAEnterpriseCloudmanagedcloudservicesoffering.Itallowsentireenterprisesystems toberuninthecloudandprovidescustomerswithanewdeploymentoptiontogainimmediatevaluefromtheinnovationsofSAPHANA.Thisenablestheoperationofmission-criticalbusinessapplicationsaswellasnewapplicationspoweredby SAPHANA.
SAP Business All-in-One–Comprehensiveandflexible business management solution targeted to midsize companies withupto2,500employeesthatarelookingforacomprehen-sive,integratedindustry-specificERPsolutionwithbuilt-in best practices.
SAP Business ByDesign–Adaptable,cloud-basedbusinesssuiteideallysuitedforSMEsandsubsidiariesoflargecorpora-tions,itisacomplete,integratedsuitethatcanrunawholeenterprise–financials,humanresources,sales,procurement,customerservice,andsupplychain.Thelatestversionsenablepartnersandcustomerstoextendthesystemcapabilitiesorbuildcloud-basedapplicationsusingSAPBusinessByDesignStudio.
SAP Business One–Applicationdesignedespeciallyfor smallbusinesseswithupto100employees,providingasingle,integratedsolutionformanagingtheentirebusinessacrossfinancials,sales,customerrelationships,purchasing,inventory, analytics,andoperations.
SAP Business Suite–Softwaresuitethathelpscompaniesbuildacomprehensivebusinessprocessplatformtorunandperformbetter.Thesoftwaresupportscorebusinessoperationsrangingfromsupplierrelationshipstoproduction,warehousemanagement,sales,andadministrativefunctions,throughtocustomerrelationships.ThemainapplicationsinthesuiteareSAPCRM,SAPERP,SAPPLM,SAPSRM,andSAPSCM.SAPBusinessSuite,SAPCRM,andSAPERParenowavailablepow-eredbySAPHANA.
SAP Business Suite powered by SAP HANA–InJanuary2013,SAPlaunchedSAPBusinessSuitepoweredbySAPHANA, anext-generationbusinesssuitethatcapturesandanalyzesdatainrealtimeonasinglein-memoryplatformempoweringcustomerstoruntheirbusinessinrealtimetotransact,analyze,andpredictinstantlyandproactively.ThecoreapplicationsinthesuitenowtakeadvantageofSAPHANAforsmarter innovations, faster business processes, and simpler interactions.
294 Additional Information
SAP Co-Innovation Lab – SAP location featuring a simulated, heterogeneousdatacenterthatincorporateshardwareandinfrastructuresoftwarefromvariousvendors.Thelabprovidesahands-onenvironmentforSAP,customers,andpartnerstoinnovate,accelerate,andshowcasenewbusinesssolutionsandtechnologiescollaboratively.Customersandpartnerscan visitthelabtoevaluatethelatestSAPandpartnersolutionsinasimulated,real-worldinfrastructure.SAPCo-InnovationLablocationsincludeSãoPaulo,Brazil;PaloAlto,California(UnitedStates);Tokyo,Japan;Seoul,Korea;Bangalore,India;Walldorf,Germany;Zurich,Switzerland;Moscow,Russia.
SAP Community Network–Onlineportalwithnearly twomillionmembersinmorethan200countries,providingindividualswiththeopportunitytotradeexperienceandinsights,pursuebusinessopportunities,andlearnfromeachother.SAPoffersdistinctcommunitiesinthenetworkthat offerinformation,trustedresources,andco-innovation.See“BusinessProcessExpertcommunity,”“SAPDeveloper Network,”and“SAPUniversityAlliancescommunity.”
SAP CRM powered by SAP HANA–FirstSAPBusinessSuiteapplicationpoweredbySAPHANA.
SAP Custom Development–SAPorganizationthatspecializesinbuildingindividualsoftwaresolutionsthataddresstheuniqueneedsofcustomers,andthatfitseamlesslywithexist-ingSAPsoftware.TheorganizationdrawsonSAPinnovations,especiallySAPHANA,todeliverunmatchedimpactandvalueforspecificcustomerusecases.See“custom developmentproject.”
SAP Customer Relationship Management (SAP CRM) – Applicationthatprovidescomprehensivesoftwaresupporttohelpmarketing,sales,andserviceprofessionalsobtaincompletecustomerintelligencethattheycanleveragetomanagecustomerrelationshipsandcustomer-relatedprocesseseffectively.SAPCRMcanenablemultichannelcustomerinter-actions,includingmobilesmartphones,theInternet,andsocialmediaandalsooffersacommunicationsinfrastructurethat isdesignedtohelpconnectingwithotherusersanytime, anywhere.SAPoffersCRMapplicationsinbothon-premiseandon-demanddeploymentmodels.
SAP Data Management–PortfoliothatreplacesandextendstheconceptandpreviouslynamedofferingofSAPReal-TimeDataPlatform.Itreferstothedatamanagementcapabilitiesinthefollowingofferings,whicharestillavailableasindividualofferings:SAPHANA;SAPASE;SAPIQ;SAPSQLAnywhere;SAPESP;SAPReplicationServer;SAPPowerDesigner;SAPControlCenter,SAPPowerBuilder,andSAPDataServices.Together,theseallowuserstoaccess,store,andcapitalizeonBig Data to support business decision making in real time.
SAP d-code–NewnameforSAPTechEdconferencesin2014,whichgobeyondtechnicaleducationtoencompassabroaderscope of topics and audience.
SAP Developer Network–PartofSAPCommunityNetwork,thisonlinecommunityoffersdeeptechnicalcontent andexpertiseforSAPdevelopers,analysts,consultants,andadministrators.
SAP EcoHub–Onlinesolutionmarketplacethatcentralizesinformation about SAP and partner solutions – and includes featuressuchasfeedback,ratings,anddemostohelpdiscover,evaluate,andbuysolutionstocomplementaninvestmentinSAP software.
SAP Education–Anorganizationwithmorethan1,000resourcesonglobalscalethatprovidesacompleteand high-qualityenablementofferingacrosstheentirecustomerlifecycleforalltargetaudiences(businessusers,projectteams,customers,partners,andsoon).Thecomprehensiveportfolioof educational products and services leverages a multimodal offering(on-site,e-learning,andvirtualclassrooms)toaccelerateenablementandreducecostandcertificationspathstohelpensureenablementquality.
295Glossary
SAP Executive Board–TheofficialgoverningbodyofSAP,overseeinganddecidingontheactivitiesofthecompany. Subjecttotherequirementsofstockcorporationlaw,theSAPExecutiveBoardiscommittedtotheinterestsofSAPandboundbycompanypolicy.ItprovidestheSAPSupervisoryBoardwithregular,prompt,andcomprehensivereportsaboutallessentialissuesofbusiness,corporatestrategy,andpotentialrisks.MembershipintheSAPExecutiveBoardispart oftheofficialtitlesfortheseboardmembers.
SAP Financing–ServicethathelpscompaniesinvestinSAPsolutionsimplementedbyastrategicpartnerofSAP:SiemensFinancialServicesGmbH(SFS).SFStargetsthefinancing servicechieflyatmidsizecompanies.Dependingonlocalconditions,theSFSplanleasessolutionstocustomersandprovidesloanfinance.
SAP for Aerospace & Defense (SAP for A&D) – Solution port-foliospecificallydesignedtomeettheneedsoftheaerospaceanddefenseindustry.Itofferscapabilitiesformaintenance,repairandoverhaul,airlineoperations,defense,manufacturing,contractandprogrammanagement,andbusinessacquisitions.
SAP for Automotive–Solutionportfoliodesignedtomeetthespecificneedsoftheautomotiveindustry.Itscapabilitieshelplinkcomplexbusinessprocessesintoalogicalflow,maximizingefficiencyandprofitabilityandsatisfyingcustomers’expectations.
SAP for Banking–Solutionportfoliothatenablesbanks toobtainallcustomerinformationataglanceandoffersafullcomplementofhigh-performancecapabilitiesforstrategicplanning,financialaccounting,costing,andenterprise-widecontrol.Italsofeatureskeyindustry-specificapplications forprofitabilitymanagement,riskmanagement,customerrelationshipmanagement,andintegratedcustomeraccountsystems.
SAP for Chemicals–Solutionportfoliothatdeliverssupportforspecificprocessesandtoolsthatchemicalcompaniesrequire.Industry-specificcapabilitiesincluderecipemanage-ment,batchmanagement,andversioncontrol.
SAP Enterprise Support–Servicesthatprovideproactivesupport in addition to all features of SAP Standard Support services.Theseproactivesupportservicesencompasstools,processes,andservicesthatenablecontinuousimprovement,holisticapplicationlifecyclemanagementforcontinuous innovation, business and operational process improvements, andleverstoaddressthetotalcostofoperation(TCO).
SAP Environment, Health & Safety Management (SAP EHS Management)–Anapplicationthatsupportssustainabilityinitiatives–enablingcompaniestomanageEHSoperational,financial,andreportingrisksholisticallyacrosstheirfacilitiesandextendedbusinessnetwork.AsanintegralpartofSAPBusinessSuite,theapplicationsystematicallyembedsEHSrequirementsandtasksdirectlyintoenterprisebusiness processes, reinforcing compliance and risk reduction across global operations.
SAP ERP–ApplicationdesignedtooptimizebusinessandITprocessesbyreducingITcomplexity,increasingadaptability,anddeliveringmoreITvalueatalowercostthantraditionalERPsolutions.Itcansupportmission-critical,end-to-endbusinessprocessesforfinance,humancapitalmanagement,assetmanagement,sales,procurement,andotheressentialcorporatefunctions.SAPERPcanalsosupportindustry-specificprocessesbyprovidingindustry-specificbusinessfunctionsthatcanbeactivatedselectivelyviatheswitchframework,keepingtheapplicationcorestableandhelpingensuremaximumperformance.
SAP ERP powered by SAP HANA–ThesecondSAPBusinessSuiteapplicationpoweredbySAPHANA.
296 Additional Information

SAP for Consumer Products–Solutionportfoliothat supportstheintegrationofeverystepoftheconsumerproductvaluechain–fromsupplierstoconsumers.KeycapabilitiesincludemobileandInternetsales,tradepromotionmanagement,inventorymanagement,brandandchannelmanagement,anddemand signal management.
SAP for Defense & Security–Solutionportfoliothatoffers avarietyofcapabilitiesthatmeetthecriticalneedsofthedefenseandsecuritysector.Keyindustry-specificcapabilitiesincludeacquisitionandmaterialsmanagement;forceplanning;maintenance,repair,andoverhaul(MRO);personnelandorga-nization;infrastructuremanagement;planningandsupportfordeployedoperations;in-servicesupport;andlinemaintenance.
SAP for Engineering, Construction & Operations (SAP for EC&O)–Solutionportfoliodesignedtomeetthespecificrequirementsofproject-orientedenterprisesthatoffers capabilities for industrial plant construction, construction of commercialandprivatebuildings,andshipbuilding.
SAP for Healthcare–Solutionportfolioforhospitalsandclinicstomanageavarietyofrequiredadministrativeand clinical processes.
SAP for High Tech–Solutionportfoliothatmeetsthedemandsofhigh-techindustries,includingRosettaNet support.
SAP for Higher Education and Research (SAP for HE&R) – Solutionportfoliothatsupportsorganizationalprocessesanduniqueneedsofpublicandprivateuniversities,multicampusinstitutions,researchagencies,andmedicalcolleges,includingcampusmanagement,grantsmanagement,studentlife-cyclemanagement,financials,operations,humancapitalmanagement, procurement,analytics,research,andassetmanagement.
SAP for Industrial Machinery & Components (SAP for IM&C) – Solutionportfoliothatcoordinatestheentirescopeof businessactivities(estimating,orderentry,projectmanagement,andproductionplanning)fortheindustrialsectorandsupportsareas ranging from maintenance and services to billing and profitabilityanalysis.
SAP for Insurance–Solutionportfoliothatintegratessteps intheinsurancebusinessprocess,includingcapabilitiesforcustomercontact,policyandproductmanagement,collectionsand disbursement, and claims management.
SAP for Life Sciences–Solutionportfoliothatmeetstherequirementsofpharmaceutical,biotechnology,and diagnostics companies, as well as manufacturers of medical devices and products.
SAP for Media–Solutionportfoliothatsupportsprocessesspecifictothemediaindustrywithcapabilitiesthatincludesales and distribution, advertising management, product development,andintellectualpropertymanagement.
SAP for Mill Products – Solution portfolio for manufacturers ofbuildingmaterials,thepaperandtimberindustry, metalandprimarymetalproducers,andtextileandfurniture manufacturers.
SAP for Mining–Solutionportfoliothatsupportsprocessesspecifictotheminingindustry,includingminingoperationsandassetperformance;salesandsupplychainmanagement;operationalriskandcompliance;aswellashumanresources;finance;procurement;andITmanagement.
SAP for Oil & Gas (SAP for O&G)–Solutionportfoliothatmeetsthedemandsofoilandgascompaniesofallsizes.
SAP for Professional Services–Solutionportfoliothat delivers integrated tools, best practices, and support for automatedprocessesdesignedspecificallyforthedemands oftheprofessionalservicesindustry,includingmanagement consultanciesaswellasaccountingandlegalfirms.
297Glossary

SAP Global Managing Board–TheSAPGlobalManagingBoardwasestablishedinMay2012inadditiontotheSAPExecutiveBoardandallowsSAPtoappointabroaderrangeofgloballeaderstohelpsteertheorganization.ItcomprisesmembersoftheSAPExecutiveBoardandselectedadditionalexecutives,andhasadvisoryanddecision-supportingfunctionsfortheSAPExecutiveBoard.Perdefinition,allmembersoftheSAPExecutiveBoardaremembersoftheSAPGlobalManagingBoard.
SAP Global Research and Business Incubation–ResearchandinnovationunitintegratedintotheProducts&InnovationorganizationatSAPinApril2013.Thenewdecentralizedstructurecombinesthestrengthsofresearchanddevelopmenttobenefitnewproducts(includingSAPHANA)andstrategictopics(suchasmobileandbusinessintelligence).Ateammanagestheprojectgovernanceofpubliclyfundedprojects aswellashandlingecosystems,communications,and relationshipmanagementwithstakeholdersfromacademiaand governments.
SAP HANA–Flexible,data-agnostic,in-memoryplatformthathelpsorganizationsanalyzetheirbusinessoperations,usinghugevolumesofdetailedtransactionalandanalyticinformationfromvirtuallyanydatasource.Theplatformprovidesthefoundationforinnovativeapplicationsthattakeadvantage ofanin-memorydatabaseandcalculationengine,allowingcustomerstoconductcomplexplanning,forecasting,andsimulationbasedonreal-timedata.
SAP HANA Cloud Platform–Developmentplatform- as-a-service(PaaS)designedtohelpcustomers,independent software vendors,andpartnersrapidlycreateinnovativeenterprisesoftwareapplicationsinthecloudleveragingourleadingin-memorytechnology.
SAP for Public Sector – Solution portfolio for public administration,providinganelectronicframeworkthatenablesonlinecommunicationthroughvariousapplicationsfor thepublic,governmentauthorities,andrelatedentities.
SAP for Retail–Solutionportfoliothatoffersmultichannelapplicationsdesignedspecificallytoprovidethebestretail services to a large customer base.
SAP for Sports & Entertainment–Solutionportfoliothatcomprises solutions for sports teams, leagues, and venues, designedtohelpthemdeepenfanengagement,driveon-fieldperformance,andoptimizebusinessefficiency.
SAP for Telecommunications–Solutionportfoliothatprovidestelecommunicationsenterprisesofalltypesandsizes arangeofindustry-specificcapabilities,includingsupport for convergent invoicing and contract accounting.
SAP for Transportation & Logistics–Solutionportfoliothatcoverstheuniquebusinessneedsofpostalservices,railways,airlines, and toll collection companies, as well as logistics serviceproviders,tooptimizesupplychainandplanning.
SAP for Utilities–Solutionportfolioforallsupplyandenergyindustries,withcapabilitiesrangingfromcallcentersandInternetcommunicationstoconsumptionbilling.
SAP for Wholesale Distribution–Solutionportfoliothataddressestheneedsofmidsizeandlargewholesaledistribution businessesinawiderangeofsegments.Industry-specific capabilitiessupportnewbusinessmodelsandstrategiesthatmeettheneedsofanimportantsupplysector.
SAP Ganges–NameofasolutionevolvingfromanSAPprojectthatfocusedonimprovingtheITinfrastructureofmicro-businesses(small,usuallyfamily-ownedshopsellinggroceriesandothersundries).Solutionincludessoftware for POS devices as well as services provided to retailers, distributors,wholesalers,andmanufacturers.Theservices alsoincludeprovidingbankswithreportingthatsupplements creditworthinessforretailers.Solutioniscurrentlyonly availablefortheIndianmarket.
298 Additional Information
SAP HANA Enterprise Cloud–See“SAPCloudpoweredbySAPHANA.”
SAP HANA Live–Umbrellatermforagroupofanalytics foundationsforSAPHANA,specifictoanindustryorforaparticularsoftware(SAPHANALiveforEventManagement, SAPHANALiveforSAPCRM),andsoon,aswellasabrowser(SAPHANALiveBrowser).
SAP HANA One–DeploymentofSAPHANAcertifiedforproductiveuseontheAmazonWebServicesCloud.SAPHANAOnecanbedeployedforproductionusewithsmalldatasets, in minutes, opening a door to starter projects from customers, ISVs,andstartups.
SAP IQ–Ananalyticsserverdesignedspecificallyforadvancedanalytics,datawarehousing,andbusinessintelligenceenvironments.Abletoworkwithmassivevolumesofstructuredandunstructureddata,itisideallysuitedtotakeadvantage ofBigDataopportunitiesbydiscoveringmoreaccurateinsightinto business performance and market dynamics.FormerlycalledSAPSybaseIQ.
SAP Jam–SocialsoftwareplatformthatincludestheformerSuccessFactorsJam,SAPStreamWork,andnewsoftware. Itenablessalesteamsandinternalexpertstosociallyconnectandcommunicatewithcustomersinthecontextofeachopportunity.Customerscanalsoeasilyprovidefeedbackandsharewhatisimportanttothemtostrengthenrelationships.
SAP Learning Solution – Portfolio of learning tools including alearningportal,learningmanagementsystem,authoringtools,andcontentmanagementsystem.Individualtrainingandstrategicpersonneldevelopmentaresupportedinthesolution.
SAP Lumira–Datavisualizationsoftwarethathelps connect,access,andvisualizedatawithoutasinglelineofcode.FormerlycalledSAPVisualIntelligence.
SAP Managed Services–Organizationandofferingsthatenable SAP customers to access SAP applications and thatprovidetheinfrastructurerequired.Inthisway,solutionsarereadytouseandcanbeadaptedtocustomers’growingrequirements.
SAP Manufacturing – Solution for managing manufacturing operationswithembeddedleanmanufacturingandSixSigmaprinciples.Itprovidescapabilitiesforplanning,execution, quality,maintenance,aswellasenvironment,health,andsafety.
SAP MaxAttention–Supportoptionwithafullrangeof services customized for individual customer needs and coveringallstagesofanSAPsolution’slifecycle,drivenbyanon-sitetechnicalqualitymanager.
SAP Mobile–OverarchingcategorytermusedtocommunicateallSAPmobileofferingstogether.Theseincludeanytypeofmobileapps,solutions,technology,orplatform(including SAPMobilePlatform),aswellassolutionsextensionsandrapid-deploymentsolutionsandanySybase-relatedproducts.
SAP Mobile Platform – A platform of mobile capabilities and technologythatbundlesthreeexistingofferingsunderonename(SybaseUnwiredPlatform,SybaseMobiliser,andaSycloofferingnamedAgentry).SAPMobilePlatformisofferedinenterpriseorconsumereditionsandeacheditionisavailableaseitheranon-premiseoracloudversion.
SAP Month of Service–HeldinOctober,SAP’ssignaturecorporatevolunteerismeffortoffersSAPemployeesaroundtheworldopportunitiestocometogethertosupportsocialchangeintheircommunities.
SAP NetWeaver–Acomprehensivetechnologystackdesignedtoefficientlydevelop,run,andextendbusinessapplications.SAPNetWeaverprovidesfoundationandenterprisesoftware,includingtheSAPNetWeaverBusinessWarehouseapplication,andtheSAPNetWeaverApplicationServer,SAPNetWeaverPortal,andSAPNetWeaverProcessOrchestrationcomponents.ItfacilitatestheeasyintegrationofSAPsoftwarewithheterogeneoussystemenvironments,third-partysolutions,andexternalbusinesspartners.See“technologyplatform.”
299Glossary

SAP NetWeaver Master Data Management (SAP NetWeaver MDM)–ComponentofSAPNetWeaverthatensurescross-systemdataconsistencyacrossdisparatesystemsandhelpsintegratebusinessprocesses–providingasingleversionofmasterdataforsupplier,product,customer,oruser-defineddataobjectsinheterogeneousenvironments.
SAP NetWeaver Mobile–ComponentofSAPNetWeaverthathelpsITorganizationsextendapplications,data,andprocesstomobileworkersthatarenotalwaysconnectedtothecompanynetwork.Itincludesover-the-airdevicemanagement,applicationdesigntools,andsynchronizationmiddlewarethatallowoccasionallyconnectedmobiledevicestointer-operateaspartofacompany'sbusinessprocesses.
SAP NetWeaver Portal–ComponentofSAPNetWeaverthatoffersacompleteportalinfrastructureandhigh-performancefunctions for knowledge management and collaboration betweenenterprises.TheportalisbasedonopenstandardsandWebservicesandistightlylinkedwithotherSAPNetWeaver components,soitalsosupportsheterogeneousITlandscapesandiscompatiblewithJava,J2EE,andMicrosoft.NET.
SAP NetWeaver Process Integration (SAP NetWeaver PI) – ComponentofSAPNetWeaverthatenablesdifferentversionsofSAPandnon-SAPsystemsfromdifferentvendorsrunningondifferentplatforms(forexample,JavaABAPandsoon) tocommunicatewitheachother.Includesallcapabilities previouslycoveredbySAPNetWeaverExchangeInfrastructuretorealizecross-systembusinessprocesses.
SAP NetWeaver Visual Composer–DesigntoolthatfacilitatesthecreationofSAPNetWeaverPortalcontentusingavisualuserinterface,ratherthanwrittencode.
SAP Notes–ToolthatprovidesinstructionsonhowtoremoveknownerrorsfromSAPsoftware,includingadescriptionofthesymptoms,cause,andlocationoftheerrors.
SAP NetWeaver Adaptive Computing Controller – Tool based ontheJ2EEengineofSAPNetWeaverApplicationServer thatenablesuserstocontroltheentirelandscapefromasinglepoint.Administratorscanmonitortheruntimedataoflogicalandphysicallandscapes;start,stop,orrelocateapplicationservices;andassignhardwareresourcestoapplication services.
SAP NetWeaver Application Server (SAP NetWeaver AS) – ComponentofSAPNetWeaverthatprovidessupportforplatform-independentWebservices,businessapplications,andstandards-baseddevelopmentbaseduponkeytechnologiessuchasJavaandABAPtechnology.
SAP NetWeaver Business Intelligence–SeeSAPNetWeaverBusinessWarehouse.
SAP NetWeaver Business Warehouse (SAP NetWeaver BW) – ApplicationofSAPNetWeaverthatprovidesacompleteview ofacompanyandthetoolsneededtomaketherightdecisions,optimizeprocesses,andmeasurestrategicsuccess,suchasbusiness-criticalfactorsandbenchmarks.FormerlycalledSAPNetWeaverBusinessIntelligence.
SAP NetWeaver Developer Studio–ToolbasedontheopensourceEclipseframeworkthatsupportstheefficientdevelop-mentofWebDynpro,Webservices,andJava/J2EEbusinessapplications,aswellasJavaprojectsonalarge-scalebasisforbothSAPtechnologiesandstandardtechnologies.
SAP NetWeaver Gateway–AtechnologyframeworkenablingexposureandsimplifiedaccesstoSAPsoftwarefromanydeviceorenvironmentusingstandard,openprotocols.Itopensdata and processes running on SAP applications for software developerstocreateappsindifferentenvironmentsanddevicestoengagemanymorebusinessconsumers.
300 Additional Information
SAP PartnerEdge–Global,partner-to-partnerbusinesscollaborationnetworkwhereSAPpartnerscanshareexpertise,developmentcapabilities,solutions,andknowledgetoextendtheirmarketreach.Inlate2012,SAP’sextranetforpartners,SAPChannelPartnerPortal,mergedwithSAPPartnerEdge.Thecombinedsite,availableatwww.sappartneredge.com now gives partners access to information, product and business news, tools, training, and business resources to order products. PartnerscanalsomanagetheirrelationshipwithSAPandcollaboratewithotherSAPpartnersthroughSAPPartnerEdge.
SAPPHIRE NOW–SAP’ssignaturebusinesstechnologyeventandthelargestSAPcustomer-drivenconferenceisheldannuallyinseverallocationsaroundtheglobe.Theglobaleventin theUnitedStatesisco-locatedwiththeAmericas’SAPUsers’Group(ASUG)annualconference.Attendeesdiscovernewinitiatives,solutions,products,andservices,aswellasuniqueaccesstothelatestbusinessstrategiesandindustrybestpracticesfromSAPcustomers,partners,executives,andindus-tryexpertstohelpthemdrivebusinessresultsacrossalllevels.
SAP Premier Customer Network–ExclusiveSAPcommunityoftopindustryleadersrepresentingsomeoftheworld’slargestandbest-runbusinesses.Forthesepremiercustomers,SAPaimstosimplifyandtailorthepartnershiptowardtheuniqueneedsofeachcustomerbyproactivelyassemblingthebesttalentandsynchronizationacrossallSAPlinesofbusiness(product development, sales, services, support, and market-ing)globally.
SAP Product Lifecycle Management (SAP PLM) – Applicationthathelpscompaniesmanage,track,andcontrolallproduct-relatedinformationoverthecompleteproductandassetlifecycleaswellasthroughouttheextendedsupplychain.SAPPLMisdesignedtofacilitatecreativityandtofreethe process of product innovation from organizational constraints.
SAP Real-Time Data Platform–SeeSAPDataManagement.
SAP Ramp-Up – Program SAP uses to introduce new applicationreleasesonthemarkettoselectedcustomersduringtherestrictedshipmentphase.
SAP Rapid Deployment solutions–Packagesofpreconfiguredsoftwareandpredefinedserviceswithcontentincludingbestpractices,templates,tools,andbusinessuserenablementwithpredeterminedscope,time,andcosts.Becausethesolutionsareinstalledquickly,customerscanbenefitfromcrucialsoftwarefunctionalitywithinaslittleas12weeks,helpinglowerthetotalcostofimplementationandgivingcustomers immediate and tangible value.
SAP Replication Server–Softwarethatmovesandsynchro-nizes data in real time, allowing companies to gain better useofapplicationdataandtocreatereportswithoutaffectingoperationalsystems.Administratorscansetupredundantdisasterrecoverysitesanddistribute,consolidate,andsynchronizedataacrossmultipleplatforms.FormerlycalledSAPSybaseReplicationServer.
SAP River – An integrated development environment and programminglanguagethatallowsrapiddevelopmentofbusinessapplicationstorunonSAPHANA.
SAP road maps – Available for industries, lines of business, andtechnology,SAProadmapshighlighttheSAPsolutionsavailabletoday,plannedinnovation,andtheSAPvisionfor thefuture.
SAP Safeguarding–Project-basedsupportoptionthat helpscustomersmanagerisksandenablethetechnicalrobustness of SAP solutions during implementation, upgrade, and operations.
301Glossary

SAP Solution Manager – Application management solution thatenablescustomerstomanagetheirSAPandnon-SAPapplicationsbetter.WithSAPSolutionManager,customerscancentralize,enhance,automate,andimprovethemanagementoftheirentiresystemlandscape,thusreducingtotalcostofownership.Thesolutionincludesfeaturessuchasdiagnostics,testing,rootcauseanalysis,andsolutionmonitoring.
SAP solutions for enterprise performance management (EPM)–Softwarethathelpscompaniesimproveperformance,organizationalagility,anddecisionmaking.SAPsolutions forEPMincludeSAPBusinessPlanningandConsolidation, SAPProfitabilityandCostManagement,SAPFinancial Consolidation,andSAPDisclosureManagementapplications.
SAP solutions for governance, risk, and compliance (GRC) – Applicationsthatprovideorganizationswithareal-timeapproachtomanagingGRCacrossheterogeneousenvironments.SAPsolutionsforGRCincludetheSAPRiskManagement, SAPAccessControl,andSAPGlobalTradeServicesapplications aswellastheSAPSustainabilityPerformanceManagementanalyticapplication,amongothers.
SAP solutions for small businesses and midsize companies – SAPBusinessAll-in-Onesolution,SAPBusinessOneapplication, andSAPBusinessObjectsEdgesolutionsthatcombine business management and business intelligence software for smallbusinessesandmidsizecompanies.Aswithlargeenter-prises,thesefirmsseektostreamlinebusinessprocesses, cutcosts,drivegrowth,andincreaseprofitabilitybyreceivingtherightinformationattherighttime–acrossalloperations.
SAP solutions for sustainability–Sustainabilitysoftwareincludesthemeasurementofsustainabilitykeyperformanceindicators;energyandcarbonmanagement;andenvironment,health,andsafety.SAPsolutionsforsustainabilityhelp organi zationstackleenergyconsumptionandgreenhouse gasemissions,aswellassupporteffortsinproductsafety,healthcare,andsustainabilityperformancemanagement.
SAP Service Marketplace–Extranetplatformthatofferscapabilities for collaboration between SAP, customers, and partners.Theextranetprovidescentralaccessandguided navigationtoSAP’scompleteproductlistingwithsupport,maintenance, and upgrade information.
SAP Services–AportfolioofservicesthathelpscustomersderivevaluefromtheirSAPsolutionsinafast,cost-effective,andpredictableway.Theportfoliocomprisesthreecategoriesofservices:Highvalue(people-centricofferingsinareassuchasbusinesstransformation,industry-specific(forexample,banking),andarchitecture-focusedprojects),innovationservices(helpleadthemarketadoptionofSAPinnovations suchasSAPHANA,mobility,andcloudofferings);and engineered services (assembled to order to provide faster time tovalueandlowerTCOwithgreaterpredictability,including rapid-deploymentsolutions).
SAP SMS 365–Interoperabilityservicesthatsimplifythedeploymentanddeliveryofinter-operatormessagingoverincompatiblenetworks,protocolstacks,andhandsetsamongmobileoperatorsworldwide.Messagesaredeliveredthrough asecureoperator-grademessagingplatform,withadvancedprotocolconversion,routing,queuing,andtranscoding capa bilities.
SAP Solidarity Fund–TheSAPSolidarityFunde.V.wassetupbySAPemployeesasanimmediateresponsetotheSeptember11,2001,attacks.Thegoalofthischaritableassociationwas tohelppeople–asaresultofanaturaldisaster,forexample–quicklyandwithminimumbureaucracy.TheactivitiesoftheSAPSolidarityFundaremadepossiblemainlythroughcontri-butionsfromSAPemployeesandpeopleassociatedwithSAP.Sinceitsfoundation,theSAPSolidarityFundhasmanagedtomakemorethan€2millionavailableforvariousprojects.
SAP Solution Explorer–Acustomer-facingself-service toolthathelpsusersfindthebusinessmanagementsoftware solutionstheyneedfromSAPtooperateprofitably,adapt continuously,andgrowsustainably.ContentincludesvaluemapsandexecutivesummariesforallSAP-supportedlines ofbusinesses,industries,technology,andselectedtopics.
302 Additional Information

SAP SQL Anywhere–Amobile,embedded,andcloud-enabledfullyrelationaldatabasethatisembeddedinmorethan 10 million installations worldwide, from laptops to tablets to smartphones.FormerlycalledSAPSybaseSQLAnywhere.
SAP Standard Support–Supportoptionofferingareliableresponsetotechnicaldisruptionsandformaintainingsystemhealthandintegrity.Thisbasicsupportofferingfeaturesincludingupdates,problemresolution,knowledgetransfer,qualitymanagement,andmoretokeepITlandscapesup-to-dateandstable.
SAP Startup Focus–Programthatoffersavarietyofresourcesforyoungcompaniesincludingtechnology,training,technicaladviceandvaluablego-to-marketsupport.Itservesasadevelopmentandgrowthacceleratorthatprovidesan integratedapproachforstartupstoinnovateontheSAPHANAplatform.
SAP StreamWork–See“SAPJam.”
SAP Supplier Relationship Management (SAP SRM) – Procurementapplicationthathelpsorganizationsinallindustriesimprovetheircentralizedsourcingandcontractmanagementandinteractwithsuppliersthroughmultiplechannels.SAPSRMisdesignedtoaccelerateandoptimizetheentireend-to-endprocure-to-payprocessbysupportingintegratedprocessesandbyenforcingcontractcompliance,whichcanresultinrealizablesavings.
SAP Supply Chain Management (SAP SCM) – Application thathelpscompaniesadapttheirsupply-chainprocessesto arapidlychangingcompetitiveenvironment.SAPSCMhelpstransformtraditionalsupplychainsfromlinear,sequentialprocessesintoopen,configurable,responsivesupplynetworks inwhichcustomer-centric,demand-drivencompaniescanmonitorandrespondmoresmartlyandquicklytodemandandsupplydynamicsacrossagloballydistributedenvironment.
SAP University Alliances–Programthatintroducesstudentstotheexcitingtechnologiesshapingbusinesstoday,anddesignedtoconnectstudentsaroundtheworldinterestedinSAPsolutions,careers,andresearchopportunities.Studentsparticipate in classroom sessions, app development, networking opportunities, events, and more.
SAP University Alliances community–PartofSAPCommunityNetwork,thisonlinecommunityprovidesconnectionsbetweenuniversityleadersandstudents,SAPcustomersandpartners,andSAPinternalexperts.Professorsandlecturersgainaccesstoup-to-dateSAP-relatedbusinessandITcoursematerials,resources,andpeer-to-peercontactwithmanyrenownedexperts.
SAP User Group Executive Network (SUGEN)–In2007, SAPinitiatedaprogramthatencouragedallSAPusergroupstosharetheirexpertiseandrecommendedpracticeswiththewideruser-groupcommunity.Itkindledsomevaluablediscus-sion,which,intheend,isgoodforallSAPstakeholders.Anumbrellaorganization,SUGENembraces12nationalSAPusergroupswiththesharedaimofdefiningprioritiesandagreeingonplansofactiontobringgreaterfocustothedialogbetweenSAPanditsusergroupsontheglobalplane.
SAP Ventures–Anindependentventurefirmspunoff fromSAP,providingtheagilityofastart-upwhileallowing companiestotapintoSAP’sglobalenterpriseecosystemofcustomersandpartners.Thefirmpartnerswithoutstanding entrepreneursandventurefirmsworldwidetobuild industry-leadingbusinesses.
SAP Web Channel Experience Management – An application thatSAPdevelopedtoaddresscompanies’needstodeliver anintegratedandconsistentcustomerexperienceovertheInternet.Thesoftwareallowsorganizationstodeploystate-of-the-artWebshops,fullyintegratedwiththeirback-endordermanagementandinventorysystems.Thisnextgeneratione-commercesolutionalsobringstogethere-marketing,sales,onlineself-service,andsocialcustomerconversationson asingleplatformtoprovideaone-stop,synchronizedWebcustomerexperience.FormerlySAPSybasePowerBuilder.
303Glossary
solution extensions–Developedbyindependentpartners,solutionextensionsintegrateeasilywithSAPsoftware,offeringcustomerscross-solutionandcross-industryfunctionsthatcomplementSAPsoftware.Theseselectthird-partyofferingsarebrandedwith“SAP,”andsoldandsupportedbySAPandpartners.
solution portfolio–Collectionofgeneral-purposeandindustry-specificapplications,servicessuchasconsulting,and supportforindustrybestpractices.SAPofferssolutionportfoliosthatservetheneedsoforganizationsinmorethan25majorindustries.Customerschoosefromamongtheofferingsto assembleorbuildtheirSAPsolutionstomeettheirrequirements. Eachofferingintheportfolioispricedandavailableforindividualpurchase.
specification–Documentthatdetailsthebusinessandfunctionalrequirementsofaparticularproductorproject.
stakeholder–Individualorgroupthecorporationisresponsibletobecausetheyareaffectedbyorcanaffectthecompany’sbusiness.Besidesthetraditionalstockholder,SAP’sstake-holdersinclude,forexample,employees,customers,partners,suppliers,analysts,andsociety.
stand-alone release–SAPapplicationreleasethatcanbedeployedindependentlyofotherapplicationreleases.
standard-related custom development project (SCDP) – Customer-specificdevelopmentwithacontractuallybindingcommitmentforatleastapartialretrofit.
SuccessFactors Compensation–AspartofSuccessFactorsHCMSuite,thissolutionhelpscompaniescreateamoresimplifiedcompensationplanmanagementwithmoreaccuratebudgetingandreducedrisk.Withperformancedataiscalibratedacrossthecompanytoensurefairnessandemployeeretention,insightfortotalemployeecompensationanalysisandassurancethatbudgetsareusedwisely,companiescanretaintopperformers.Riskcanbesignificantlyreducedwithimprovedauditcompliance.
Scope 1 (emissions)–Directgreenhousegasemissions fromsourcesthatareownedorcontrolledbythereportingcompany,forexample,fuelburnedincorporatecars.
Scope 2 (emissions)–Indirectgreenhousegasemissionsfromconsumptionofpurchasedelectricity,heat,orsteam.
Scope 3 (emissions)–Indirectemissionsthatarea consequenceoftheactivitiesofthereportingcompany,butoccur fromsourcesownedorcontrolledbyanothercompany,suchasbusinessflights.
software and software-related services (SSRS) – SAP reports revenuesinsoftwareandsoftware-relatedservices(SSRS),whichencompassessoftware,support,subscription,andothersoftware-relatedservicerevenue.
software as a service (SaaS)–Softwarethatisprovided literally“asaservice.”SoftwareapplicationsaredeliveredandmanagedremotelyoverasecureInternetconnectionandastandardWebbrowser.Accessischargedonasubscriptionbasisatafixedpriceperuser,usuallyonamonthlybasis,andusersonlypayforapplicationstheyactuallyuse.See“cloudcomputing.”
solution – SAP solutions enable a customer to meet a challengeortakeadvantageofanopportunityandarebuiltorassembledbyflexiblycombiningSAPapplicationsandotherSAPsoftware.Thesolutionsmayincludesupportforbestbusinesspracticesandbeaidedbyconsultingandongoingsupport.TheymayalsobeenhancedorextendedbySAPpartnerapplicationsandservices.OrganizationscandeploySAP solutionstoperformindustry-specificbusinessprocessesand to addresstheirbusinessissuesinthewaythatbest meetstheirneeds.
solution area–Agroupofsolutionsthatsupportaspecificsubprocessofacompany’send-to-endprocess.
304 Additional Information
SuccessFactors Workforce Analytics – As part of SuccessFactorsHCMSuite,thissolutionhelpscompanies gettheinsightstheyneedtomakestrategicworkforce decisionsbyfindinganswerstokeyquestionsaboutworkforcechallengesandhowtosolvethem.
support package – Bundle of software corrections compiled periodicallyandavailableforABAPorJavaprogramming languages.
support release–Releaseofferedafterthebeginningof theunrestrictedshipmentphase–ifrequired–thatcontains acollectionofallpreviouslyavailablesupportpackages.
sustainability–ForSAP,sustainabilityistheabilitytomanageeconomic, social, and environmental risks and opportunities holisticallyforincreasedprofitability.Itcontributestoourvisiontohelptheworldrunbetterandimprovepeoples’lives.SAPiscommittedtofullyintegratingsustainabilityintoourstrategyandbusinessmodelandinthiswaythecompanypursuesacorporatestrategythatissustainableratherthanastand-alonesustainabilitystrategy.See“SAPsolutionsforsustainability.”
Sybase–SAPacquiredSybaseinlate2010,broadeningtheSAPportfolioforenterprisemobility,introducingacompletemobileplatformandmobilesolutionsthatenablecustomeraccesstodatastoredinSAPsoftwareandsystemsfromanywhereandfromanydevice.
Syclo–AcquiredbySAPin2012,Sycloisaleadingprovider ofenterprisemobileapplicationsandtechnologies.TheSyclofamilyofmobileappsextendSAPERPandSAPCRMformission-criticalworkonthegoandoutinthefield.Theyoffer aquick,flexible,reliablepathtomobilizingassetmanagement,fieldservice,inventory/warehouse,andsales,regardlessof language,usertype,deviceselection,orconnectivity.
SuccessFactors Employee Central–ThefoundationoftheSuccessFactorsHCMSuiteofsolutions,EmployeeCentralisanext-generationcoreHRsoftwaredeliveredsecurelyasaservicefromtheSuccessFactorscloud.Itoffersoneglobalsystemofrecord,completeworkforceoverviewcombiningHRandtalentdata,powerfulanalytics,andsocialcollaborationfine-tunedtomeetlocalneeds.Itiscurrentlyavailablein 10countries.Anadditionalofferingspecificallyforpayrollwaslaunchedin2013calledSAPSuccessFactorsEmployeeCentralPayroll.
SuccessFactors HCM Suite–SuiteofHRsolutionsfortalentmanagement,coreHR,collaboration,andworkforceanalytics.Thecloud-basedsuiteprovidessolutionstobridgethegapbetweenstrategyandexecutionwithtoolstohire,reward,anddeveloptherightpeoplewiththerightskillstogrowabusinesssustainably.FormerlycalledSuccessFactorsBusinessExecutionSuite(SuccessFactorsBizXSuite).
SuccessFactors Learning – As an integrated part of SuccessFactorsHCMSuite,thissolutionhelpscompaniestransformhowaworkforcelearnsbycombiningformal,social,andextendedlearningwithcontentmanagement,reporting,andanalytics,availablefromanofficeoronamobiledevice.
SuccessFactors Professional Edition–Acloud-basedsolutionthataddresses,andistailoredto,theperformanceandtalentmanagement essentials small businesses and midsize companies require.Applicationsincludeemployeeprofile,performancemanagement,goalmanagement,360-degreereview,andtheSAP Jam social collaboration platform.
305Glossary

system integrator (SI)–Companyfocusedonintegrating ITsystemsandprovidingrelatedconsulting.Thisisaclassicchannelusedbylargesoftwarevendors,largehardwarevendors,andoriginalequipmentmanufacturers.
T
technology platform–Thetechnicalfoundationforabusiness-drivensoftwarearchitecturethatincreasestheadaptability,flexibility,openness,andcost-efficiencyofIToperationsandenables organizations to become more agile in responding to change.See“SAPNetWeaver.”
total energy consumed–ThesumofallenergyconsumedthroughSAP’sownoperations,includingenergyfromrenew-able sources.
u
United Nations Global Compact (UN Global Compact) – Apolicyinitiativeforbusinessesthatarecommittedtoaligningtheiroperationsandstrategieswithtenuniversallyacceptedprinciplesintheareasofhumanrights,laborstandards, environment,andanti-corruption.
unrestricted shipment phase–Secondphaseofrelease delivery,duringwhichallcustomerscanobtaintherelease.Thephasefollowstherestrictedshipmentphase.
upgrade–Replacementofanexistingapplicationcomponentwithanewercomponentofthatsameapplication.
V
value-added reseller (VAR)–Partnerthatreceivesthemajorityofitsrevenuefromresellingavendor’shardwareorsoftwaresolutionsdirectlytoendusers.Additionally,VARsoftenprovideconsulting, implementation, postsales support, and training to theirowncustomers.VARsmaydevelopandselladd-onappli cationstomeettheneedsofverticalmarketsandmayexpandSAPproductfunctionality.
value map – A structural view of SAP solutions organized accordingtoindustry,businessresponsibility,andtechnologyarea.
vertical solution – A specialized application designed to meet theuniqueneedsofaparticularbusinessorindustry.
“visual enterprise”–Abilitytovisuallycommunicatepartsofthebusinesshelpsmaximizeproductivity,improveprocessefficiencyandquality,andreducecostandcycletime.Solutionsthatsupportthe“visualenterprise”unifyandsynchronizeproductinformationfrommultiplesystemsanddeliveritinrole-specificandworkflow-controlledprocessestopeople.TheSAP3-DVisualEnterpriseapplications,resultingfromtheRightHemisphereacquisition,enrichSAPBusinessSuitesoft-warewithnew3-Dvisualizationfeaturesthatintegratebusinessdata,whichwillsupportnewstandardstoincreasespeed,enhanceproductivity,andimprovequalityacrosstheentirevaluechain.
306 Additional Information

virtualization–Thedecouplingofphysicalandlogicalcomputerresources.Thisapproachcanbeimplementedondifferentlevelssuchasnetwork,storage,centralprocessingunit, server, and application.
W
Web service–DescribesasetoftechnicalfunctionalityusingWebServicesDescriptionLanguage(WSDL),enablinginteroperablemachine-to-machineinteractionoveranetwork.Typically,WebservicesaresimplyWebapplicationprogramminginterfaces(APIs)thatcanbeaccessedandexecutedbya consuming application.
“women in management”–Phraseusedtorefertothe percentage of women in management positions (managing teams,managingmanagers,executiveboards)ascompared tothetotalnumberofmanagers,expressedbythenumberofindividualsandnotfull-timeequivalents(FTEs).
works council–AsdictatedbytheGermanWorksCouncilConstitutionAct,aworkscouncilisalegalbodyforrepresentingemployees’intereststotheemployerandcodetermining theworksinprivatecompanies.OnJune21,2006,theSAPAGemployeesworkinginGermanyelecteditsfirstworkscouncil.AEuropeanworkscouncilwascreatedinthespringof2012.
307Glossary
Addresses
Formoreinformationaboutthemattersdiscussedinthisreport,contact:
Investor RelationsTel. +496227767336Fax [email protected]/investor
PressTel. +496227746315Fax [email protected]/press
GrOup hEADquArtErS
SAp AGDietmar-Hopp-Allee1669190 WalldorfGermany
Tel. +496227747474Fax [email protected]
Theaddressesofallourinternationalsubsidiaries and sales partners are available on our public Web site atwww.sap.com/directory/main.html.
308 Additional Information
Financial and Sustainability Publications
TheSAPIntegratedReportisavailableonlineonlyat www.sapintegratedreport.cominEnglish,orinGermanatwww.sapintegratedreport.de.
ThefollowingpublicationsareavailableinEnglishat www.sap.com/investor,orinGermanatwww.sap.de/investor,asindicatedbelow:–SAPGroupAnnualReport(IFRS,inEnglishandGerman)–AnnualReportonForm20-F(IFRS,inEnglish)–SAPAGStatutoryFinancialStatementsandReviewof Operations(HGB,inGerman)
–InterimReports(inEnglishandGerman)–SAPINVESTOR,SAP’squarterlyshareholdermagazine(onlineatwww.sap-investor.com,inEnglishandGerman)
You can also read SAP’s annual and interim reports on an iPad. ThefreeandinteractiveappPublicationsisnowavailableintheApp Store.
CompleteinformationonthegovernanceofSAPisavailableatwww.sap.com/corpgovernance.Materialsinclude:–Informationaboutthemanagementofthecompany, includingthedirectorsonthegoverningbodies
–Detailsofthedirectors’dealingsinSAPshares–Shareholdermeetingpapersandballotresults–ArticlesofIncorporation–GermanCodeofCorporateGovernance–DeclarationofImplementationpursuanttothe GermanStockCorporationAct,Section161
–CodeofBusinessConductforEmployees–CorporateGovernanceStatementpursuanttothe GermanCommercialCode,Section289a
–CorporateGovernanceReport
Additional SAP policies are made public at www.sap.com/corporate-en/sustainability:–SAPEnvironmentalPolicy–SAPHumanRightsCommitment–SAPGlobalHealthandSafetyManagementPolicy–SAPSupplierCodeofConduct–SAPPartnerCodeofConduct
309309Financial and Sustainability Publications
2015
January 21Preliminaryresultsforfiscalyear2014
May 20AnnualGeneralMeetingofShareholdersMannheim,Germany
May 21Dividendpayment
2014
March 21PublicationofSAPIntegratedReport
April 17Resultsforthefirstquarterof2014
May 21AnnualGeneralMeetingofShareholdersMannheim,Germany
May 22Dividendpayment
July 17Resultsforthesecondquarterof2014
October 20Resultsforthethirdquarterof2014
Financial Calendar
310310 ZusätzlicheInformationen
trADEmArkS©2014SAPAGoranSAPaffiliatecompany.Allrightsreserved.
NopartofthispublicationmaybereproducedortransmittedinanyformorforanypurposewithouttheexpresspermissionofSAPAGoranSAPaffiliatecompany.
SAPandotherSAPproductsandservicesmentionedhereinaswellastheirrespectivelogosaretrademarksorregisteredtrade-marksofSAPAG(oranSAPaffiliatecompany)inGermanyandothercountries.Pleaseseewww.sap.com/corporate-en/legal/copyrightforadditionaltrademarkinformationandnotices.
publIShErSAP AGInvestorRelations
COnCEpt AnD rEAlIZAtIOnKuhn,Kammann&KuhnGmbH,Cologne,Germany
phOtOGrAphy GlObAl mAnAGInG bOArD AnD COVErAndreasPohlmann,Munich,GermanySAPAG,Walldorf,Germany
PRINTINGABCDruck,Heidelberg,Germany
COpyrIGht© 2014 SAP AGDietmar-Hopp-Allee1669190 WalldorfGermany
Publication Details
carbon neutralnatureOffice.com | DE-135-899979
print production
311Publication Details

2013 An
nu
Al R
epoRt
Group Headquarters
SAP AGDietmar-Hopp-Allee 1669190 WalldorfGermanywww.sap.com www.sap.com/investor
50121673