Sample PowerPoint Presentation - IEEJeneken.ieej.or.jp/data/7461.pdfTitle Sample PowerPoint...
36
Ministry of Electricity & Renewable Energy (MOERE) IEEJ:July 2017 © IEEJ2017
Transcript of Sample PowerPoint Presentation - IEEJeneken.ieej.or.jp/data/7461.pdfTitle Sample PowerPoint...

Ministry of Electricity & Renewable Energy (MOERE)
IEEJ:July 2017 © IEEJ2017

Presentation of
Energy Policy (B)
July 2017
IEEJ:July 2017 © IEEJ2017

Prepared by
E-mail addresses
IEEJ:July 2017 © IEEJ2017
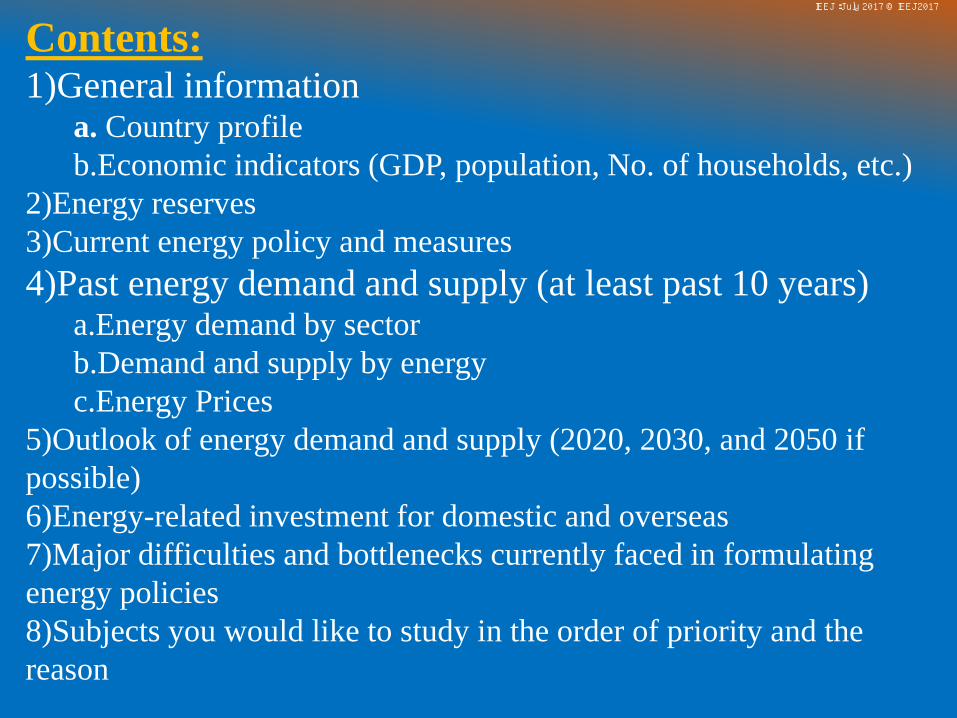
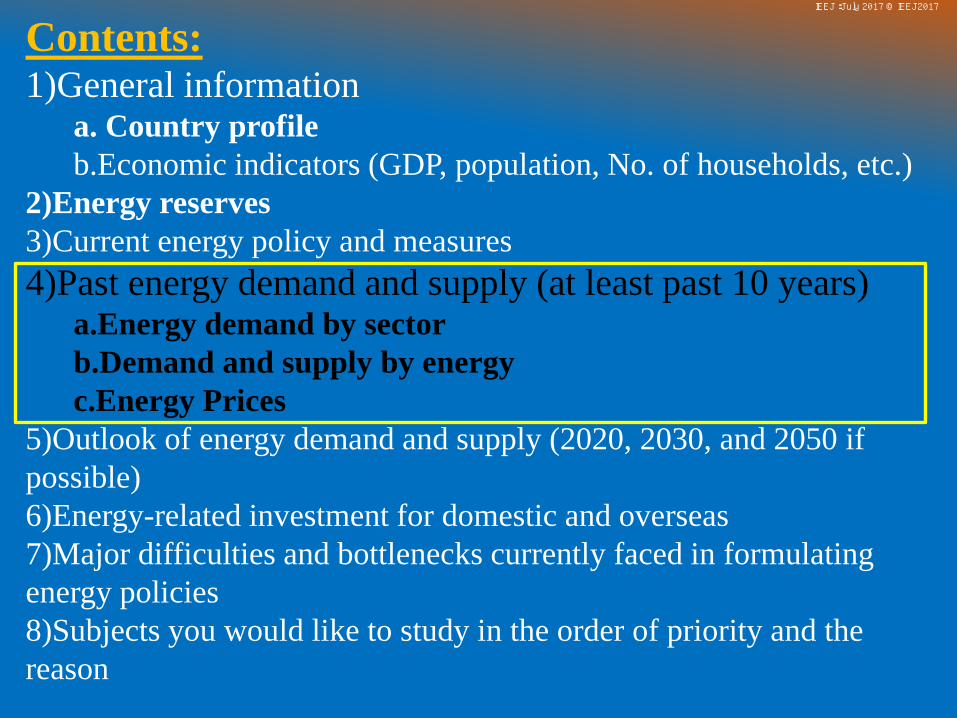
Contents: 1)General information
a. Country profile b.Economic indicators (GDP, population, No. of households, etc.)
2)Energy reserves 3)Current energy policy and measures 4)Past energy demand and supply (at least past 10 years)
a.Energy demand by sector b.Demand and supply by energy c.Energy Prices
5)Outlook of energy demand and supply (2020, 2030, and 2050 if possible) 6)Energy-related investment for domestic and overseas 7)Major difficulties and bottlenecks currently faced in formulating energy policies 8)Subjects you would like to study in the order of priority and the reason
IEEJ:July 2017 © IEEJ2017

EGYPT
The Gift of the Nile
IEEJ:July 2017 © IEEJ2017

Egypt Location : IEEJ:July 2017 © IEEJ2017
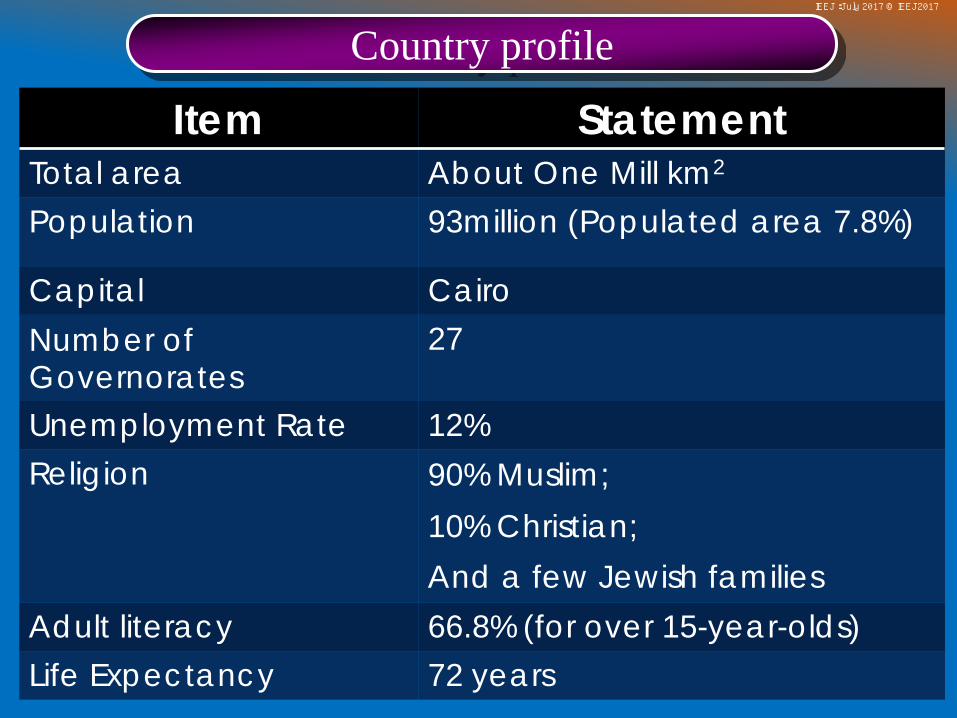
Country profile
Item Statement Total area About One Mill km2 Population 93million (Populated area 7.8%)
Capital Cairo Number of Governorates
27
Unemployment Rate 12% Religion 90% Muslim;
10% Christian; And a few Jewish families
Adult literacy 66.8% (for over 15-year-olds) Life Expectancy 72 years
IEEJ:July 2017 © IEEJ2017

Contents: 1)General information
a. Country profile b.Economic indicators (GDP, population, No. of households, etc.)
2)Energy reserves 3)Current energy policy and measures 4)Past energy demand and supply (at least past 10 years)
a.Energy demand by sector b.Demand and supply by energy c.Energy Prices
5)Outlook of energy demand and supply (2020, 2030, and 2050 if possible) 6)Energy-related investment for domestic and overseas 7)Major difficulties and bottlenecks currently faced in formulating energy policies 8)Subjects you would like to study in the order of priority and the reason
IEEJ:July 2017 © IEEJ2017

- GDP: 330.78 billion US$ in 2015 (Current US$) – “WB Statistics” -GDP per Capita: nearly 3595 US$ -Inflation rate: 14.5% in 2016 “Estimates of CAPMAS” -Fiscal Year: From 1 July to 30 June (for Governmental institutions) & From 1 Jan to 31 Dec ( for privet sector company's) -No. of households: about 22.3 million
Economic Indicators
∗ CAPMAS: Central Agency for Public Mobilization and Statistics
IEEJ:July 2017 © IEEJ2017

ORGANIZATION CHART OF MINISTRY OF ELECTRICITY & RENEWABLE ENERGY
Nuclear Materials Authority
Nuclear Power Plants Authority
Atomic Energy Authority
New & Renewable Energy Authority
Hydro Power Projects Execution Authority
Egyptian Electricity Holding
Company
IEEJ:July 2017 © IEEJ2017

The total installed capacity reached 38,857 GW in 2015/2016 compared to 35,220 GW in 2014/2015 with a percentage rate of increase about 10.3 %, Secured supply to 99% of the population. The installed capacities in 30/6/2016 are distributed by type as follows:
Current profile of the electricity Sector
Installed Capacities by Type (%)
Gas 20%
Steam 38%
Combined Cycle 32%
Hydro7%
Renewables 3%
IEEJ:July 2017 © IEEJ2017

The generated energy in year 2015/2016 (186320 GWH) is distributed by type and technology as follows:
Current profile of the electricity Sector (Cont.)
Generated energy by Type and Technology (%)
Thermal91.40%
IPPs & Isolated Plants, 0.10%
Hydro 7.30%
Renewables 1.20%
IEEJ:July 2017 © IEEJ2017

Contents: 1)General information
a. Country profile b.Economic indicators (GDP, population, No. of households, etc.)
2)Energy reserves 3)Current energy policy and measures 4)Past energy demand and supply (at least past 10 years)
a.Energy demand by sector b.Demand and supply by energy c.Energy Prices
5)Outlook of energy demand and supply (2020, 2030, and 2050 if possible) 6)Energy-related investment for domestic and overseas 7)Major difficulties and bottlenecks currently faced in formulating energy policies 8)Subjects you would like to study in the order of priority and the reason
IEEJ:July 2017 © IEEJ2017

SUMMER 2014 Summer 2015 IEEJ:July 2017 © IEEJ2017

Power reserve reached 5000 MW & Maximum load reaches about 25,300 GW at April 2017 “National Control Unit “.
Electrical Energy Reserves
IEEJ:July 2017 © IEEJ2017

Contents: 1)General information
a. Country profile b.Economic indicators (GDP, population, No. of households, etc.)
2)Energy reserves 3)Current energy policy and measures 4)Past energy demand and supply (at least past 10 years)
a.Energy demand by sector b.Demand and supply by energy c.Energy Prices
5)Outlook of energy demand and supply (2020, 2030, and 2050 if possible) 6)Energy-related investment for domestic and overseas 7)Major difficulties and bottlenecks currently faced in formulating energy policies 8)Subjects you would like to study in the order of priority and the reason
IEEJ:July 2017 © IEEJ2017

Current energy policy and measures
• The strategic vision of the electricity and renewable energy sector aims to develop the energy system which must be characterized by institutional efficiency and technological progress, be able to provide energy at competitive prices and environmental sustainability to improve the standard of living of the Egyptian people, leading to the provision of energy requirements and increasing the contribution of energy to economic growth.
IEEJ:July 2017 © IEEJ2017

Current energy policy and measures (Cont.)
• The overall polices of this strategy are: 1. Energy efficiency Improvement 2. Diversify sources of energy supply (Natural gas,
nuclear power, coal & Renewable Energy resources,…..).
3. Energy infrastructure development, transmission network, smart grid, Land, market.
4. Encourage private sector participation in power supply
IEEJ:July 2017 © IEEJ2017
Contents: 1)General information
a. Country profile b.Economic indicators (GDP, population, No. of households, etc.)
2)Energy reserves 3)Current energy policy and measures 4)Past energy demand and supply (at least past 10 years)
a.Energy demand by sector b.Demand and supply by energy c.Energy Prices
5)Outlook of energy demand and supply (2020, 2030, and 2050 if possible) 6)Energy-related investment for domestic and overseas 7)Major difficulties and bottlenecks currently faced in formulating energy policies 8)Subjects you would like to study in the order of priority and the reason
IEEJ:July 2017 © IEEJ2017
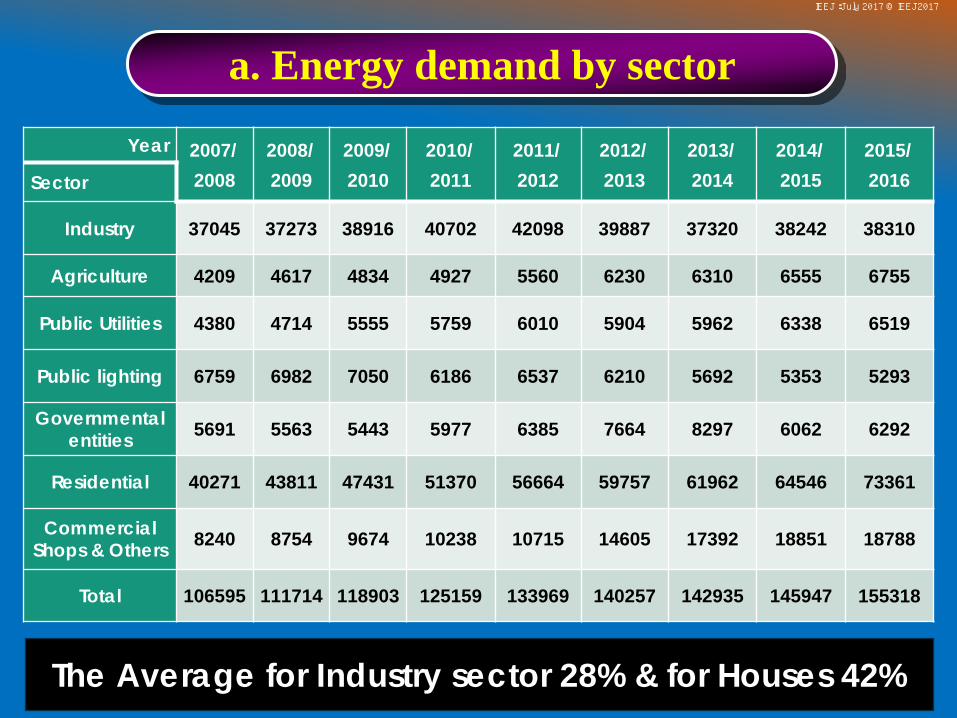
a. Energy demand by sector
Year 2007/ 2008
2008/ 2009
2009/ 2010
2010/ 2011
2011/ 2012
2012/ 2013
2013/ 2014
2014/ 2015
2015/ 2016 Sector
Industry 37045 37273 38916 40702 42098 39887 37320 38242 38310
Agriculture 4209 4617 4834 4927 5560 6230 6310 6555 6755
Public Utilities 4380 4714 5555 5759 6010 5904 5962 6338 6519
Public lighting 6759 6982 7050 6186 6537 6210 5692 5353 5293
Governmental entities 5691 5563 5443 5977 6385 7664 8297 6062 6292
Residential 40271 43811 47431 51370 56664 59757 61962 64546 73361
Commercial Shops & Others 8240 8754 9674 10238 10715 14605 17392 18851 18788
Total 106595 111714 118903 125159 133969 140257 142935 145947 155318
The Average for Industry sector 28% & for Houses 42%
IEEJ:July 2017 © IEEJ2017

b. Demand and supply by energy Year Demand
GWh Supply GWh
2005/2006 92085 108690 2006/2007 98443 115407 2007/2008 106595 125129 2008/2009 111714 131040 2009/2010 118903 139000 2010/2011 125159 145224 2011/2012 133969 156413 2012/2013 140252 162785 2013/2014 142935 168050 2014/2015 145946 174875 2015/2016 155318 186343
The Average for Demand increase= 5% & for Supply = 6%
IEEJ:July 2017 © IEEJ2017
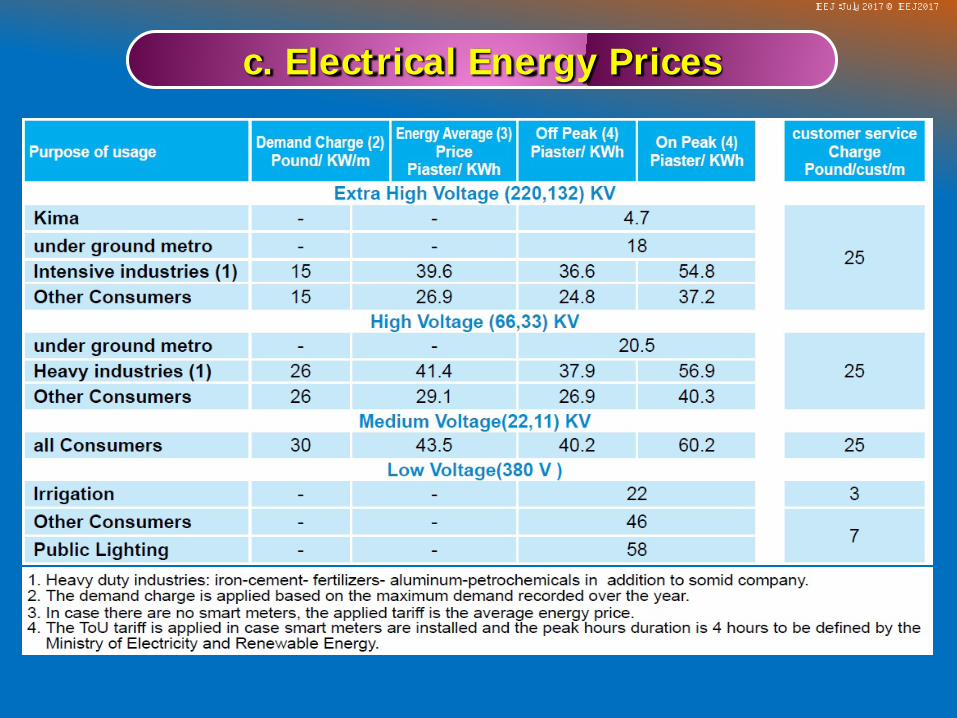
c. Electrical Energy Prices
IEEJ:July 2017 © IEEJ2017

Electrical Energy Prices (cont.)
IEEJ:July 2017 © IEEJ2017

Year Price/KWh ( EGP Cent ) % 2001/2002 25 --- 2002/2003 26 4% 2003/2004 25 -4% 2004/2005 25 0% 2005/2006 21 -16% 2006/2007 21 0% 2007/2008 38 81% 2008/2009 48 26% 2009/2010 48 0% 2010/2011 48 0% 2011/2012 57 19% 2012/2013 67 18% 2013/2014 70 4% 2014/2015 74 6% 2015/2016 78 5%
Energy Prices ( More than 1000KWh ): IEEJ:July 2017 © IEEJ2017

Contents: 1)General information
a. Country profile b.Economic indicators (GDP, population, No. of households, etc.)
2)Energy reserves 3)Current energy policy and measures 4)Past energy demand and supply (at least past 10 years)
a.Energy demand by sector b.Demand and supply by energy c.Energy Prices
5)Outlook of energy demand and supply (2020, 2030, and 2050 if possible) 6)Energy-related investment for domestic and overseas 7)Major difficulties and bottlenecks currently faced in formulating energy policies 8)Subjects you would like to study in the order of priority and the reason
IEEJ:July 2017 © IEEJ2017

Year Demand – GWh Supply – GWh
2016/2017 199995 214978 2017/2018 214535 230456 2018/2019 230131 247049 2019/2020 246862 264837 2020/2021 264809 283905 2021/2022 284061 304346 2022/2023 3044712 326259 2023/2024 326864 349749 2024/2025 350627 374931 2025/2026 376118 401926 2026/2027 403462 430865 2027/2028 432793 461887 2028/2029 464257 495143 2029/2030 498009 530794 2030/2031 534214 569011 2031/2032 573052 609980 2032/2033 614712 653898 2033/2034 659402 700979 2034/2035 707341 751449 2035/2036 758764 805554 2036/2037 813926 863553 2037/2038 873099 925729 2038/2039 926573 991382 2039/2040 100466 1093833 2040/2041 107770 1140429 2041/2042 115605 1222540 2042/2043 124009 1310563 2043/2044 133024 1404928 2044/2045 142695 1506078 2045/2046 153069 1614516 2046/2047 164198 1730761 2047/2048 176135 1855376 2048/2049 188940 1988963 2049/2050 202676 2132168
5. Outlook of energy demand and supply (2050) IEEJ:July 2017 © IEEJ2017

The Average for Demand & Supply increase= 7%
5. Outlook of energy demand and supply (2050) (Cont.)
IEEJ:July 2017 © IEEJ2017

Contents: 1)General information
a. Country profile b.Economic indicators (GDP, population, No. of households, etc.)
2)Energy reserves 3)Current energy policy and measures 4)Past energy demand and supply (at least past 10 years)
a.Energy demand by sector b.Demand and supply by energy c.Energy Prices
5)Outlook of energy demand and supply (2020, 2030, and 2050 if possible) 6)Energy-related investment for domestic and overseas 7)Major difficulties and bottlenecks currently faced in formulating energy policies 8)Subjects you would like to study in the order of priority and the reason
IEEJ:July 2017 © IEEJ2017

Total direct target investments to the electricity sector and renewable energy plan 2016/2017:
Sector Amount - MILL EGP
Government agency 958.7
Economic Entities 6859.5
Public companies 55511.1
Private sector 35
Total 63364.3
6. Energy-related investment for domestic and overseas: IEEJ:July 2017 © IEEJ2017

Government and economic entities target investments at the electricity and renewable energy sector 2016/2017 according to sources of funding:
Type Amount % Foreign Loans 1948.9 24.93%
Reserves and provisions - local 972.7 12.44%
National Investment Bank - Local 198.3 2.54%
State Treasury – Local 690 8.83%
Local Loans 271.5 3.47%
Other sources 3736.8 47.80%
Total 7818.2 100.00%
6. Energy-related investment for domestic and overseas: IEEJ:July 2017 © IEEJ2017

Contents: 1)General information
a. Country profile b.Economic indicators (GDP, population, No. of households, etc.)
2)Energy reserves 3)Current energy policy and measures 4)Past energy demand and supply (at least past 10 years)
a.Energy demand by sector b.Demand and supply by energy c.Energy Prices
5)Outlook of energy demand and supply (2020, 2030, and 2050 if possible) 6)Energy-related investment for domestic and overseas 7)Major difficulties and bottlenecks currently faced in formulating energy policies 8)Subjects you would like to study in the order of priority and the reason
IEEJ:July 2017 © IEEJ2017

• Non-standardization of data published by working entities in the energy sector.
• Lack of historical data sufficient to analyze the situation and understand the problems and predict what will happen in the future.
• Increase the interest rates, especially for domestic loans, raises the investment cost of the projects.
• Lack of local manufacturing, which increases the percentage of foreign loans.
• Non-participation of the private sector as planned • Lack of open market mechanisms for selling energy. • Weak infrastructure, Leads to increase the financial cost of the plan. • Lack of required coordination between the parties which working in
the field of energy strategy implementation & follow up process. • Lack of plan follow up mechanism and develop solutions to avoid
expected problems.
7. Major difficulties and bottlenecks currently faced in formulating energy policies:
IEEJ:July 2017 © IEEJ2017

Contents: 1)General information
a. Country profile b.Economic indicators (GDP, population, No. of households, etc.)
2)Energy reserves 3)Current energy policy and measures 4)Past energy demand and supply (at least past 10 years)
a.Energy demand by sector b.Demand and supply by energy c.Energy Prices
5)Outlook of energy demand and supply (2020, 2030, and 2050 if possible) 6)Energy-related investment for domestic and overseas 7)Major difficulties and bottlenecks currently faced in formulating energy policies 8)Subjects you would like to study in the order of priority and the reason
IEEJ:July 2017 © IEEJ2017

• Plan follows up mechanisms, Scenarios to avoid future problems.
• Process to encourage private sector to participate in the implementation of the planned projects.
• Finance average cost for energy projects in Japan & other world country.
• Is it better to have one Entity for all energy projects (gas, carbon, nuclear… and renewable energy)?
• Learn about Japanese success experience.
8. Subjects we would like to study in the order of priority and the reason
IEEJ:July 2017 © IEEJ2017


![Scanned by CamScanner - library.stou.ac.th2).pdf · 7461 - 2 2559 Focus Group E-mail E-mail Focus Group tuäuÿl 22 n.q. 2559 09.30- 11.30 u] 13.30-15.30 u. cu 3106 1 7461-2/Th% amphorn.ura@stou.ac.th](https://static.fdocuments.in/doc/165x107/605ae0588d29855817149de8/scanned-by-camscanner-2pdf-7461-2-2559-focus-group-e-mail-e-mail-focus-group.jpg)