ASIA PACIFIC ENERGY RESEARCH CENTRE - IEEJeneken.ieej.or.jp/data/pdf/499.pdfPAGE II Published by...
252
Transcript of ASIA PACIFIC ENERGY RESEARCH CENTRE - IEEJeneken.ieej.or.jp/data/pdf/499.pdfPAGE II Published by...
A S I A P A C I F I C E N E R G Y R E S E A R C H C E N T R E
APEC ENERGY DEMAND AND SUPPLY
OUTLOOK 2002
2002
PAGE II
Published by
Asia Pacific Energy Research Centre Institute of Energy Economics, Japan Shuwa-Kamiyacho Building, 4-3-13 Toranomon Minato-ku, Tokyo 105-0001 Japan Tel: (813) 5401-4551 Fax: (813) 5401-4555 Email: [email protected] (administration) 2002 Asia Pacific Energy Research Centre APEC #202-RE-01.4 ISBN 4-931482-16-3
Printed in Japan
PAGE III
FOREWORD
This APEC Energy Demand and Supply Outlook (�APEC Energy Outlook 2002�) is the second outlook by the Asia Pacific Energy Research Centre since 1998. During the past four years there have been many policy developments and market evolutions in the energy sector in the APEC region, as well as in the world as a whole. More recently, perceptions of global economic development have been affected by the events of September 11th, and a sense of uncertainty prevails.
APERC believes that the time is ripe to produce a new energy outlook taking these elements into account. This outlook is also the first to include Peru, Russia and Viet Nam, which joined APEC in November 1998. It analyses APEC at large as well as looking in turn at each of its 21 member economies, which in itself is very challenging. This approach is different from that of other organisations, which normally cover the world by regions.
This new publication also extends the outlook period to 2020. An effort has been made to be as objective as possible. It should be noted that the longer the outlook period, the greater the degree of uncertainty. This outlook is not meant to say what will happen but rather to present a scenario of what could happen given a set of assumptions and circumstances. The main purpose is to help policy-makers and business leaders develop energy policies and business strategies towards the future.
I wish to express my sincere appreciation to all those who have been involved in the challenging task of producing the outlook for their patient efforts and valuable contributions, including the staff at APERC, both professional and administrative, and many others who have provided useful comment and inputs.
This work is published under my authority as president of APERC and does not necessarily reflect the views of APEC members.
Tatsuo Masuda President Asia Pacific Energy Research Centre
PAGE IV
ACKNOWLEDGEMENTS
The development of the APEC Outlook 2002 could not have been accomplished without the contributions of many individuals and organisations. We would like to thank all those whose efforts made this Outlook possible, in particular those named below.
PROJECT MANAGER
Yonghun Jung
MAIN CONTRIBUTORS
Modelling: Yonghun Jung (manager), Edito Barcelona, Shane Bush and Carolyn Ramsun
Industrial demand: Gary Eng (manager), Edito Barcelona and Naoko Doi
Transport demand: Iván Jaques (manager) and Carolyn Ramsun
Residential and commercial demand: Satya Zulfanitra (manager) and Naoko Doi
Oil supply: Gary Eng
Natural gas supply: Ki-Joong Kim and Shiro Konishi
Coal supply: Shane Bush and Shixian Gao
Nuclear energy supply: Yonghun Jung
New and renewable energy supply: Jaya Singam Rajoo
Electricity generation: Edito Barcelona
Investment: Juan Ramón Mota and Yonghun Jung
OTHER CONTRIBUTORS
Martin Bonou, David Cope, Ahmad Bin Haji Mohamad, Hassan Ibrahim, Marc LaFrance, Binh Nguyen, Oleg Sinyugin and Charng-her Yu
EDITOR
Michael Watson
PUBLICATION
Iván Jaques (manager), Naoko Doi, Gary Eng and Shiro Konishi
ADMINISTRATIVE SUPPORT
Sutemi Arikawa, Shohei Okano, Sachi Goto, Emi Tomita and Tsumugi Ota
In producing this work, the Centre has also benefited greatly from consultations with and/or the use of work produced by the following institutions and individuals:
EGEDA representatives, APERC Advisory Board members, participants at the APERC Mid-Year Workshop 2001 and Annual Conference 2002, Energy Ministries of APEC member economies, Institute of Energy Economics Japan (Japan), Energy Data and Modelling Center (Japan), Ministry of Economy, Trade and Industry (Japan), Japan Bank of International Cooperation (Japan), Development Bank of Japan (Japan), International Energy Agency (France), Energy Information Administration (USA).
PAGE V
CONTENTS
Foreword ..........................................................................................................................................iii
Acknowledgements............................................................................................................................ iv
List of Tables ................................................................................................................................... vi
List of Figures ................................................................................................................................. vii
List of Abbreviations........................................................................................................................ix
Executive Summary......................................................................................................................1
Chapter 1 Introduction...................................................................................................7
Chapter 2 Economic Activity and Energy Demand................................................15
Chapter 3 Energy Supply .............................................................................................51
Chapter 4 Electricity .....................................................................................................85
Chapter 5 Investment ...................................................................................................99
Chapter 6 Conclusions .............................................................................................. 115
References .................................................................................................................... 119
Appendix Economy Reviews ................................................................................... 123
Note: The Energy Balance Tables (by Economy and Region) can be found on the APERC website: http://www.ieej.or.jp/aperc/
PAGE VI
LIST OF TABLES
Table 1 Regional grouping.....................................................................................................7 Table 2 Income grouping.......................................................................................................8 Table 3 An example of energy balance table format, APEC 1999 ................................9 Table 4 GDP by regional groupings ..................................................................................11 Table 5 Population by regional groupings ........................................................................13 Table 6 Final energy demand by region and economy ...................................................15 Table 7 Industrial energy demand ......................................................................................20 Table 8 Industrial energy demand by type and share ......................................................25 Table 9 Transport sector energy consumption by income grouping and economy...29 Table 10 ResCom sector energy consumption by economy............................................39 Table 11 ResCom energy mix, Group A .............................................................................43 Table 12 ResCom energy mix, Group B .............................................................................45 Table 13 ResCom energy mix, Group C .............................................................................46 Table 14 ResCom energy mix in China ...............................................................................48 Table 15 ResCom energy mix in Russia ..............................................................................49 Table 16 Primary energy supply by fuel (Mtoe) .................................................................52 Table 17 Oil production and consumption in APEC economies, 1999 and 2020.......56 Table 18 Oil demand (ktonnes) ............................................................................................57 Table 19 Oil production (ktonnes).......................................................................................58 Table 20 (Net) Oil Imports (>0) and (Net) Exports (<0) (ktonnes)..............................59 Table 21 World oil production (1,000 bpd) ........................................................................60 Table 22 Oil reserves and production..................................................................................61 Table 23 Proven coal reserves and production in the APEC region..............................72 Table 24 Electricity demand forecast by economy and economy groups, in GWh.....86 Table 25 Fuel inputs to power generation per economy, in percent ..............................91 Table 26 Share of mining, petroleum products, chemical and electricity
industries in total FDI (%) ................................................................................. 101 Table 27 Share of energy in total private investment (%).............................................. 102 Table 28 Fraction of loans used in energy infrastructure, Latin America................... 102 Table 29 Loans for energy projects made by the Asian Development Bank ............. 102 Table 30 One percent of projected GDP in APEC economies, 2000-2020,
1999 US$ billion................................................................................................... 103 Table 31 Estimated costs of major energy infrastructure, APEC, 1999 US$ billion 105 Table 32 Energy investment for major infrastructure required in APEC
economies in 2020 ............................................................................................... 106 Table 33 Central bank discount rates in selected APEC member economies ........... 112
PAGE VII
LIST OF FIGURES
Figure 1 Breakdown of sectoral coverage...........................................................................10 Figure 2 GDP by regional grouping....................................................................................11 Figure 3 Crude oil price forecast (2001 US$/bbl).............................................................12 Figure 4 Population by regional groupings ........................................................................13 Figure 5 Final energy demand by region (Mtoe) ...............................................................16 Figure 6 Final energy demand by sector in APEC (Mtoe)...............................................17 Figure 7 Final energy demand by energy type in APEC (Mtoe).....................................18 Figure 8 Industrial energy intensity (Group A) .................................................................21 Figure 9 Industrial energy intensity (Group B)..................................................................22 Figure 10 Industrial energy intensity (Group C) .................................................................23 Figure 11 Industrial energy demand by energy type...........................................................24 Figure 12 Shares of industrial energy demand by energy type..........................................27 Figure 13 Transport energy consumption by grouping .....................................................30 Figure 14 Transport energy consumption per capita by grouping...................................31 Figure 15 Transport energy intensity by economy in 1999 ...............................................31 Figure 16 Transport energy intensity by grouping..............................................................32 Figure 17 Residential and commercial sector energy demand per capita
by income group (1992 �2020) ............................................................................37 Figure 18 Urban population and ResCom energy demand in selected economies
of Groups B and C (1980-2020) ..........................................................................38 Figure 19 ResCom energy demand by fuel type..................................................................40 Figure 20 ResCom energy consumption per capita by economy (Group A),
historical and projections (1971-2020)................................................................41 Figure 21 ResCom energy consumption per capita by economy (Group B),
historical and projections (1971-2020)................................................................41 Figure 22 ResCom energy consumption per capita by
economy (Group C+China), historical and projections (1971-2020)............42 Figure 23 ResCom energy demand by energy type, Group A ..........................................44 Figure 24 ResCom energy demand by energy type, Group B...........................................45 Figure 25 ResCom energy demand by energy type, Group C ..........................................47 Figure 26 ResCom energy demand by energy type in China and Russia ........................48 Figure 27 Primary energy supply by fuel type in APEC (Mtoe) .......................................52 Figure 28 Primary energy supply by regions (Mtoe)...........................................................53 Figure 29 Primary energy supply per capita by region, (1980-2020)................................54 Figure 30 Primary energy intensity by region (1980-2020)................................................55 Figure 31 Natural gas demand in APEC ..............................................................................63
PAGE VIII
Figure 32 Regional and sectoral contributions to incremental natural gas demand, 1999-2020 ................................................................................................................63
Figure 33 Cost reductions in liquefaction and shipping ....................................................68 Figure 34 Coal production trends in APEC, 1980-2020....................................................73 Figure 35 Coal exports and imports by economy...............................................................74 Figure 36 Total installed nuclear power generation capacity (MW).................................79 Figure 37 Driving forces of nuclear programme in the APEC region ............................80 Figure 38 A forecast on the power generation capacity.....................................................84 Figure 39 APEC sectoral electricity demand .......................................................................87 Figure 40 APEC installed generating capacity (1999-2020) ..............................................88 Figure 41 APEC electricity generation (1999-2020) ...........................................................89 Figure 42 Energy inputs for electricity generation (Mtoe) ................................................90 Figure 43 Comparison of APEC reference and reduced electricity demand .................96 Figure 44 Fuel inputs comparisons for APEC, Reference vs. Alternative Case............98 Figure 45 APEC CO2 emissions, Reference vs. Alternative Case....................................98 Figure 46 Correlation between GDP and FDI ................................................................ 109 Figure 47 Net long-term resource flow to Developing Economies ............................. 110 Figure 48 Exchange rates of different groups of APEC economies ............................ 113
PAGE IX
LIST OF ABBREVIATIONS
ABARE Australian Bureau of Agriculture and Resource Economics APEC Asia Pacific Economic Cooperation APERC Asia Pacific Energy Research Centre ASEAN Association of Southeast Asian Nations AUS Australia BCM billion cubic metres BD Brunei Darussalam CCGT combined cycle gas turbine CDA Canada CEDIGAZ International Centre for Information on Natural Gas (Paris-based gas
industry information agency) CHL Chile CNG compressed natural gas CO2 carbon dioxide CT Chinese Taipei DME dimethyl ether DOE Department of Energy (USA) DOE (PH) Department of Energy (the Philippines) DRI-WEFA Data Resources, Inc. Wharton Econometric Forecasting Associates DSM demand-side management EDMC Energy Data and Modelling Center (Japan) EIA Energy Information Administration (USA) EWG Energy Working Group (APEC) FEC final energy consumption FED final energy demand FDI foreign direct investment FPI foreign portfolio investment FSU Former Soviet Union FT Fischer-Tropsch technology GDP gross domestic product GHG greenhouse gases g/kWh grams per kilowatt-hour (used to measure the emissions caused by the
generation of one unit of electricity) GNP gross national product GTL gas to liquids GW gigawatt GWh gigawatt-hour GWP gross world product HKC Hong Kong, China IEA International Energy Agency IEEJ Institute of Energy Economics, Japan INA Indonesia

PAGE X
IPP independent power producers JPN Japan ktoe thousand tonnes of oil equivalent LHV lower heating value LNG liquefied natural gas LPG liquefied petroleum gas MAS Malaysia mbd million barrels per day MCM million cubic metres MEX Mexico Mt megatonne MTBE methyl tertiary-butyl ether Mtoe million tonnes of oil equivalent NGV natural gas vehicle NRE new and renewable energy NZ New Zealand PE Peru PNG Papua New Guinea PPP purchasing power parity PRC People�s Republic of China R&D research and development ROK Republic of Korea RP the Republic of the Philippines R/P reserves-to-production ratio RUS the Russian Federation SIN Singapore tcf trillion cubic feet toe tonnes of oil equivalent TPES total primary energy supply TWh terawatt hours US or USA United States of America VN Viet Nam
APEC EN ERGY DEMAND AN D SUPP LY OUTLOOK EXECUTI VE SUMMARY
PAGE 1
E X E C U T I V E S U M M A RY
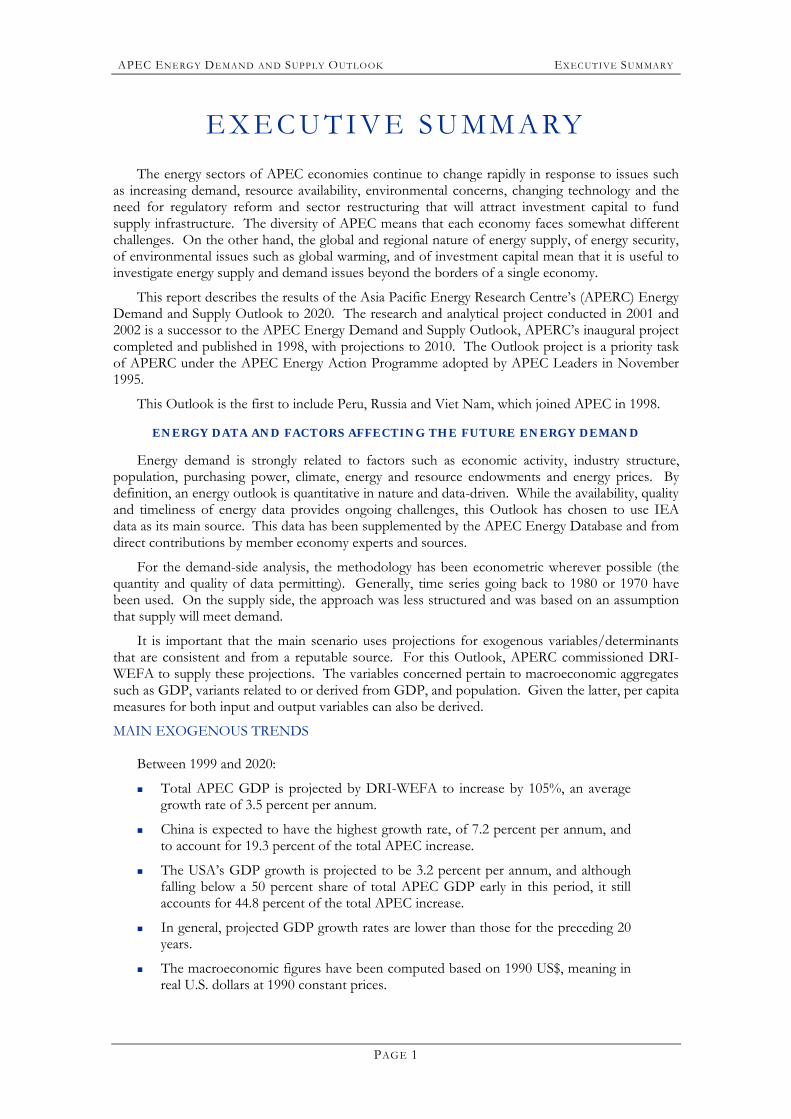
The energy sectors of APEC economies continue to change rapidly in response to issues such as increasing demand, resource availability, environmental concerns, changing technology and the need for regulatory reform and sector restructuring that will attract investment capital to fund supply infrastructure. The diversity of APEC means that each economy faces somewhat different challenges. On the other hand, the global and regional nature of energy supply, of energy security, of environmental issues such as global warming, and of investment capital mean that it is useful to investigate energy supply and demand issues beyond the borders of a single economy.
This report describes the results of the Asia Pacific Energy Research Centre�s (APERC) Energy Demand and Supply Outlook to 2020. The research and analytical project conducted in 2001 and 2002 is a successor to the APEC Energy Demand and Supply Outlook, APERC�s inaugural project completed and published in 1998, with projections to 2010. The Outlook project is a priority task of APERC under the APEC Energy Action Programme adopted by APEC Leaders in November 1995.
This Outlook is the first to include Peru, Russia and Viet Nam, which joined APEC in 1998.
ENERGY DATA AND FACTORS AFFECTING THE FUTURE ENERGY DEMAND
Energy demand is strongly related to factors such as economic activity, industry structure, population, purchasing power, climate, energy and resource endowments and energy prices. By definition, an energy outlook is quantitative in nature and data-driven. While the availability, quality and timeliness of energy data provides ongoing challenges, this Outlook has chosen to use IEA data as its main source. This data has been supplemented by the APEC Energy Database and from direct contributions by member economy experts and sources.
For the demand-side analysis, the methodology has been econometric wherever possible (the quantity and quality of data permitting). Generally, time series going back to 1980 or 1970 have been used. On the supply side, the approach was less structured and was based on an assumption that supply will meet demand.
It is important that the main scenario uses projections for exogenous variables/determinants that are consistent and from a reputable source. For this Outlook, APERC commissioned DRI-WEFA to supply these projections. The variables concerned pertain to macroeconomic aggregates such as GDP, variants related to or derived from GDP, and population. Given the latter, per capita measures for both input and output variables can also be derived.
MAIN EXOGENOUS TRENDS
Between 1999 and 2020:
! Total APEC GDP is projected by DRI-WEFA to increase by 105%, an average growth rate of 3.5 percent per annum.
! China is expected to have the highest growth rate, of 7.2 percent per annum, and to account for 19.3 percent of the total APEC increase.
! The USA�s GDP growth is projected to be 3.2 percent per annum, and although falling below a 50 percent share of total APEC GDP early in this period, it still accounts for 44.8 percent of the total APEC increase.
! In general, projected GDP growth rates are lower than those for the preceding 20 years.
! The macroeconomic figures have been computed based on 1990 US$, meaning in real U.S. dollars at 1990 constant prices.
APEC EN ERGY DEMAND AN D SUPP LY OUTLOOK EXECUTI VE SUMMARY
PAGE 2
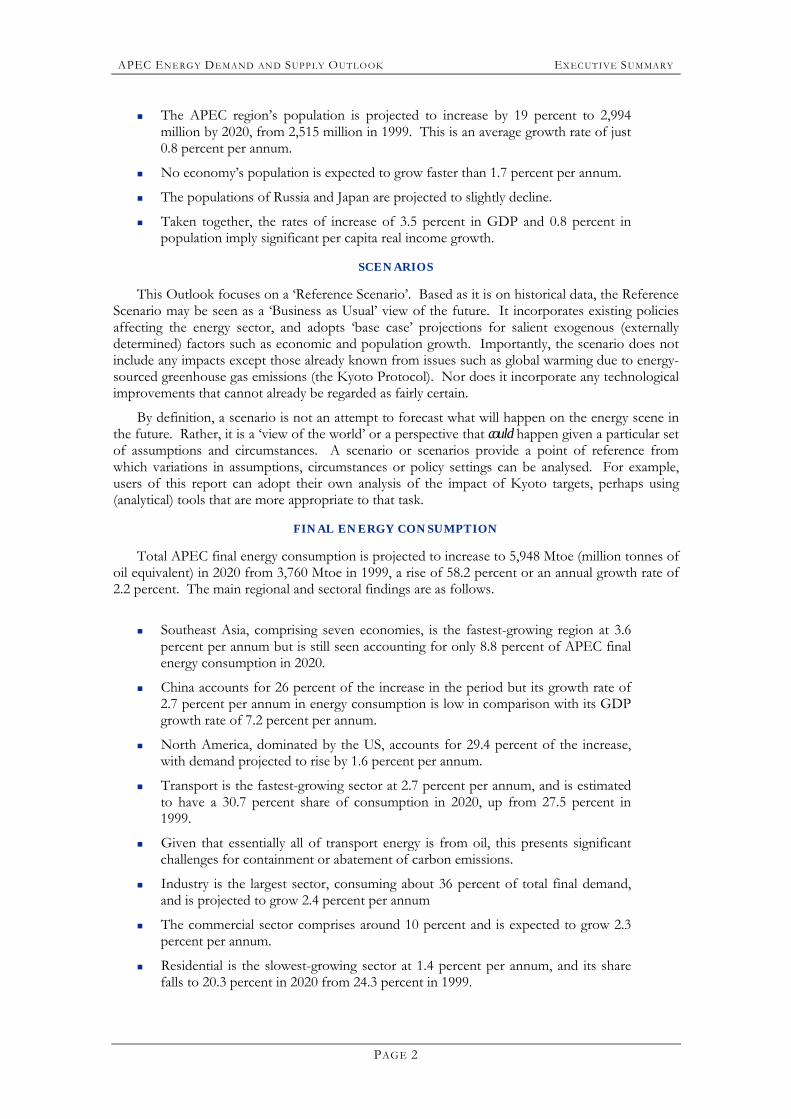
! The APEC region�s population is projected to increase by 19 percent to 2,994 million by 2020, from 2,515 million in 1999. This is an average growth rate of just 0.8 percent per annum.
! No economy�s population is expected to grow faster than 1.7 percent per annum.
! The populations of Russia and Japan are projected to slightly decline.
! Taken together, the rates of increase of 3.5 percent in GDP and 0.8 percent in population imply significant per capita real income growth.
SCENARIOS
This Outlook focuses on a �Reference Scenario�. Based as it is on historical data, the Reference Scenario may be seen as a �Business as Usual� view of the future. It incorporates existing policies affecting the energy sector, and adopts �base case� projections for salient exogenous (externally determined) factors such as economic and population growth. Importantly, the scenario does not include any impacts except those already known from issues such as global warming due to energy-sourced greenhouse gas emissions (the Kyoto Protocol). Nor does it incorporate any technological improvements that cannot already be regarded as fairly certain.
By definition, a scenario is not an attempt to forecast what will happen on the energy scene in the future. Rather, it is a �view of the world� or a perspective that could happen given a particular set of assumptions and circumstances. A scenario or scenarios provide a point of reference from which variations in assumptions, circumstances or policy settings can be analysed. For example, users of this report can adopt their own analysis of the impact of Kyoto targets, perhaps using (analytical) tools that are more appropriate to that task.
FINAL ENERGY CONSUMPTION
Total APEC final energy consumption is projected to increase to 5,948 Mtoe (million tonnes of oil equivalent) in 2020 from 3,760 Mtoe in 1999, a rise of 58.2 percent or an annual growth rate of 2.2 percent. The main regional and sectoral findings are as follows.
! Southeast Asia, comprising seven economies, is the fastest-growing region at 3.6
percent per annum but is still seen accounting for only 8.8 percent of APEC final energy consumption in 2020.
! China accounts for 26 percent of the increase in the period but its growth rate of 2.7 percent per annum in energy consumption is low in comparison with its GDP growth rate of 7.2 percent per annum.
! North America, dominated by the US, accounts for 29.4 percent of the increase, with demand projected to rise by 1.6 percent per annum.
! Transport is the fastest-growing sector at 2.7 percent per annum, and is estimated to have a 30.7 percent share of consumption in 2020, up from 27.5 percent in 1999.
! Given that essentially all of transport energy is from oil, this presents significant challenges for containment or abatement of carbon emissions.
! Industry is the largest sector, consuming about 36 percent of total final demand, and is projected to grow 2.4 percent per annum
! The commercial sector comprises around 10 percent and is expected to grow 2.3 percent per annum.
! Residential is the slowest-growing sector at 1.4 percent per annum, and its share falls to 20.3 percent in 2020 from 24.3 percent in 1999.
APEC EN ERGY DEMAND AN D SUPP LY OUTLOOK EXECUTI VE SUMMARY
PAGE 3
! Electricity at 3.2 percent per annum is the fastest-growing energy, mainly reflecting increasing electrification in developing economies. Its share increases to 20.5 percent in 2020 from 16.9 percent in 1999.
! Oil�s share of final consumption in 1999 is 45.3 percent. This rises to 47.2 percent by 2020, due almost entirely to strong growth in the transport sector. Coal�s share falls to 7.6 percent from 9.7 percent, while that of gas falls to 13 percent from 13.8 percent.
PRIMARY ENERGY SUPPLY
Primary energy supply to the APEC region is projected to increase by 55.5 percent between 1999 and 2020, to 8,777 Mtoe from 5,659 Mtoe, a growth rate of 2.1 percent per annum. This is commensurate with an expected 58.2 percent increase in final energy consumption. The following are the main observations:
! The primary supply of oil is projected to increase by 53.5 percent, from 2,023
Mtoe in 1999 to 3,107 Mtoe in 2020.
! APEC oil production is projected to increase by only 10.2 percent between 1999 and 2020, from 26.0 mbd to 28.7 mbd.
! As a result, net oil imports are projected to increase by 131 percent, a growth rate of 4.1 percent per annum.
! Current exporters Malaysia, Indonesia and Papua New Guinea could become net importers between 2010 and 2020.
! Coal supply is projected to increase from 1,540 Mtoe in 1999 to 2,402 Mtoe in 2020, a rate of increase of 2.1 percent per annum. Of the increased supply, 83 percent will be to meet power generation demand.
! Gas is the fastest-growing primary energy source, with a 2.6 percent per annum growth rate, increasing from 1,135 Mtoe in 1999 to 1,951 Mtoe in 2020. Of this increase, around 67 percent is for power generation.
! For APEC as a whole, primary energy shares are quite stable, with coal at 27.4 percent and oil 35.5 percent in 2020, almost unchanged since 1999, and gas increasing its share from 20.1 percent to 22.2 percent over the Outlook period.
ELECTRICITY
Electricity generation is projected to increase by 82.4 percent, or a rate of 2.9 percent per annum, between 1999 and 2020. This is a lower growth rate than the 3.2 percent per annum for final demand, as transmission and distribution losses are projected to fall from 17.1 percent of generation in 1999 to 12.8 percent in 2020.
! Installed capacity is projected to increase by 1,252 gigawatts (GW), a 62 percent
increase between 1999 and 2020. Together with the projected increase in generation, this implies that capacity utilisation will increase from 50.4 percent in 1999 to 56.7 percent in 2020.
! All developing economies with the exceptions of Russia (3.8 percent) and Papua New Guinea (2.7 percent) are projected to increase their consumption at rates in excess of four percent per annum between 1999 and 2020.
! China is expected to account for 30 percent of the increase in demand, with the US accounting for 24.2 percent. Russia is projected to account for 9.9 percent of the increase and may compete with Japan as the third-largest electricity consuming economy in APEC by 2020.
APEC EN ERGY DEMAND AN D SUPP LY OUTLOOK EXECUTI VE SUMMARY
PAGE 4
! The combined cycle gas turbine is the favoured technology, with gas-fuelled capacity more than doubling from 402.5 GW in 1999 to 839.3 GW in 2020, a growth rate of 3.6 percent per annum. Generation from gas is expected to almost triple between 1999 and 2020, increasing from 1,514 terawatt hours (TWh) in 1999 to 4,399 TWh in 2020, a growth rate of 5.2 percent per annum. Its share of generation increases from 17 percent in 1999 to 27.1 percent in 2020. This is at the expense of all other main generation sources.
! Incremental coal capacity is almost as great, increasing by 400.8 GW from 1999 to reach 1,113.6 GW in 2020. Projected coal generation increases by the largest amount, from 3,924 TWh in 1999 to 6,855 TWh in 2020, a growth rate of 2.7 percent per annum.
! Capacity of renewable sources of energy such as solar and wind power is projected to increase rapidly. Hydroelectric power should expand from 374.4 GW in 1999 to 611.7 GW in 2020, a growth rate of 2.4 percent per annum. New and renewable capacity is projected to increase almost eight-fold, from 5,249 megawatts (MW) in 1999 to 39,948 MW in 2020, a rate of increase of 10.1 percent per annum but still representing only 1.2 percent of total capacity in 2020.
! Nuclear capacity is projected to increase from 203.3 GW in 1999 to 278.2 GW in 2020, an average growth rate of 1.5 percent per annum.
! Electricity generation is projected to use 69 percent of coal supply and 45 percent of gas supply in 2020.
! Natural gas should become the fuel of choice for electricity generation, given a combination of price, thermal efficiency and environmental considerations. It increases from 373.4 Mtoe (million tonnes of oil equivalent) in 1999 to 873.4 Mtoe in 2020, a growth rate of 4.1 percent per annum. Its fuel share is projected to increase from 17.8 percent in 1999 to 24.8 percent in 2020, at the expense of nuclear and oil.
! Coal�s fuel share should remain stable at just over 47 percent. In many economies it is the preferred fuel based on price and availability. It has the largest absolute increase in input energy, increasing from 989.1 Mtoe in 1999 to 1,658.8 Mtoe in 2020.
ENERGY IMPORTS AND ENERGY SECURITY
APEC is a net importer of energy, with an import dependency ratio in 1999 of around 10 percent. This Outlook expects that dependency to rise sharply in the decade 2010-20, and reach around 18.6 percent in 2020. However, the situation varies among economies and regions due to differences in the energy resources with which they are endowed.
! APEC currently produces around 38 percent of the world�s oil supply but
accounts for around 58 percent of world demand.
! Given that APEC oil production is projected to increase by only 10.2 percent between 1999 and 2020, and that primary demand is projected to increase by 53.5 percent, import requirements will increase substantially.
! APEC�s oil import dependency is around 36 percent, and this is projected to increase to around 54 percent by 2020. The dependency ratio is even larger if APEC�s largest exporter, Russia, is excluded from the analysis, bearing in mind that it sends most of its exports to non-APEC economies.
! This situation is of particular concern to APEC economies in Asia, whose oil import dependency will increase from around 60 percent now to almost 80 percent in 2020.
APEC EN ERGY DEMAND AN D SUPP LY OUTLOOK EXECUTI VE SUMMARY
PAGE 5
! The majority of their imports currently come from the Middle East. This Asian dependence on imports from the Middle East is expected to increase. Developments in areas such as Central Asia and East Russia will contribute to supply diversification, though in a small way.
! Thus supply risks, including those concerning shipping choke points such as the Straits of Malacca and Singapore, are likely to increase.
! The APEC region as a whole is a net gas exporter. However, as with oil, Russia exports almost all of its gas to non-APEC economies, mainly in Europe. The remainder of APEC is marginally a net importer of gas, and imports could potentially increase sharply in the 2010-20 period. With a significant amount of intra-APEC trade, the balance is supplied mostly by Middle East producers by way of LNG.
! APEC possesses over 60 percent of the world�s coal reserves. The region produces around 70 percent of the world�s supplies and is marginally a net exporter. Intra-APEC trade dominates flows between exporters and importers.
ENERGY INFRASTRUCTURE AND INVESTMENT REQUIREMENTS
Increases in energy demand indicated in this Outlook will require substantial infrastructure to extract, transport and receive the energy and process it into a consumable form. This requires large investments. Governments and the private sector will need to ensure that investment and regulatory environments are equitable and transparent in order for this needed investment to be realised. Energy supply at levels demanded will not be sustainable without massive investments.
! Total investment needed in energy infrastructure between 2000 and 2020 is
estimated to be roughly in the range of $2.2-2.8 trillion. By 2020, this represents an annual requirement of $130-170 billion. To put this in context, the aggregate APEC GDP in 1999 is estimated to have been $15.3 trillion, and is projected to rise to $31.4 trillion by 2020.
! Electricity generation capacity to meet increasing demand is projected to be around 1,252 GW over 1999-2020. This represents a capital requirement of between $1.35 trillion and $1.42 trillion, equivalent to approximately $90 billion in 2020. Local distribution infrastructure and replacement capacity represent additional requirements.
! APEC oil demand is projected to increase by 21.8 million barrels per day (mbd) between 1999 and 2020, while projected primary gas demand in 2020 is 816 Mtoe, 72 percent more than in 1999. This translates into an investment requirement of between $500 billion and $1,100 billion in oil and gas production, processing, refining and petrochemical installations, and $290-320 billion in oil tankers, pipelines and LNG facilities for international trade. The combined annual investment needed by 2020 is estimated at $40-75 billion. Domestic distribution network pipelines are not included in these figures.
! For coal, facilities are required to extract and deliver an additional 863 Mtoe per annum in 2020 compared with 1999. The estimated investment requirement is $16-21 billion, or $900 million to $1.2 billion per year by 2020.
ENERGY INTENSITY
With APEC�s aggregate GDP growth averaging 3.5 percent per annum and primary energy growing at 2.1 percent per annum, the region is projected to become less energy intensive on a GDP basis.
APEC EN ERGY DEMAND AN D SUPP LY OUTLOOK EXECUTI VE SUMMARY
PAGE 6
! With the exception of Brunei Darussalam, every APEC economy is projected to reduce its energy intensity, some more drastically than others.
! With relatively low population growth and rising per capita incomes, however, every APEC economy is projected to increase its energy consumption on a per capita basis.
CARBON EMISSIONS
The APEC region�s carbon emissions from energy are estimated to have increased by 37.6 percent between 1990 and 1999. Reference Case projections are for emissions to rise a further 27 percent between 1999 and 2010, and by 60 percent between 1999 and 2020.
MAIN FINDINGS AND IMPLICATIONS
This Outlook analysis to 2020 identifies many challenges to energy policy and to business leaders to ensure sustainable energy supplies. Some challenges are common throughout APEC and the world, while others apply to specific regions.
! Energy consumption within APEC is projected to rise almost 60 percent between
1999 and 2020, a rate slightly above two percent per annum.
! Electricity demand is projected to rise at a rate of 3.2 percent per annum, mainly driven by rising incomes and increasing electrification in developing economies.
! Similarly, rising incomes and improving standards of living will result in rapid increases in transport and transport energy demand, projected to grow at 2.7 percent per annum.
! The APEC region is self-sufficient, or almost so, in all types of energy except for oil. Increasing demand for oil (2.4 percent per annum) is not likely to be met by increased production within APEC (projected to be only 0.5 percent per annum), and dependence on imports is seen increasing from around 36 percent now to 54 percent in 2020.
! More notably, the dependence on imports of APEC economies in Asia, now around 60 percent, is seen rising to almost 80 percent by 2020. This, together with a likely increase in dependence on supplies from the Middle East, raises significant issues of security of supply for the APEC Asian economies in particular.
! Projected increases in demand for electricity and gas, and to a lesser extent oil and coal, present significant challenges to both governments and the private sector in respect of the huge investment needed in energy infrastructure, estimated at $2.2-2.8 trillion in the next two decades
! Greater demand will also present huge challenges in respect of environmental sustainability, particularly concerning carbon emissions and (urban) living conditions, a situation in which the better living standards that result from increased energy consumption may be adversely affected by deteriorating environmental conditions.
APEC ENERG Y DEMAND AN D SUPP LY OUTLOOK CHAPT ER 1
PAGE 7
C H A P T E R 1 INTRODUCTION
The first major project undertaken by APERC after its establishment was the 1998 APEC Energy Demand and Supply Outlook. The Asian financial crisis occurred during the preparation of the report, so a prompt revision of the projections was undertaken. The revised version was completed and published in September 1998. An updated APEC Energy Demand and Supply Outlook is presented here, taking into consideration the changes that have occurred since the 1998 publication.
This Outlook covers the period from 1999 to 2020 and is intended to foster member economies� understanding of energy demand and supply trends and developments in the region, thereby helping them formulate their energy policies.
It is the result of joint efforts of researchers from almost all the APEC member economies. A large number of other experts from the government, business and research sectors also contributed to the study through two workshops, in 2001 and early 2002, to discuss key data, methodology and policy issues.
COVERAGE AND SCOPE
The Outlook covers all 21 APEC member economies. These are: Australia; Brunei Darussalam; Canada; Chile; the People�s Republic of China; Hong Kong, China; Indonesia; Japan; the Republic of Korea; Malaysia; Mexico; New Zealand; Papua New Guinea; the Republic of the Philippines; Peru; the Russian Federation; Singapore; Chinese Taipei; Thailand; the United States; and Viet Nam.
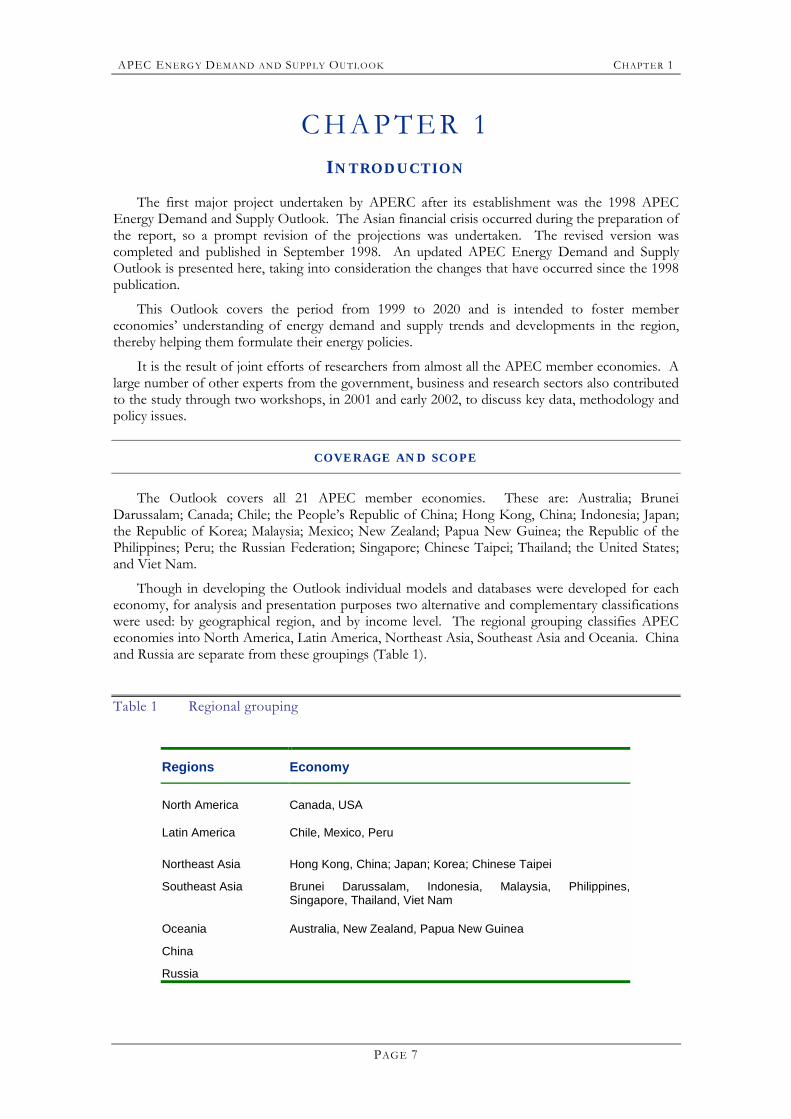
Though in developing the Outlook individual models and databases were developed for each economy, for analysis and presentation purposes two alternative and complementary classifications were used: by geographical region, and by income level. The regional grouping classifies APEC economies into North America, Latin America, Northeast Asia, Southeast Asia and Oceania. China and Russia are separate from these groupings (Table 1).
Table 1 Regional grouping
Regions Economy
North America Canada, USA
Latin America Chile, Mexico, Peru
Northeast Asia Hong Kong, China; Japan; Korea; Chinese Taipei
Southeast Asia Brunei Darussalam, Indonesia, Malaysia, Philippines, Singapore, Thailand, Viet Nam
Oceania Australia, New Zealand, Papua New Guinea
China
Russia
APEC ENERG Y DEMAND AN D SUPP LY OUTLOOK CHAPT ER 1
PAGE 8
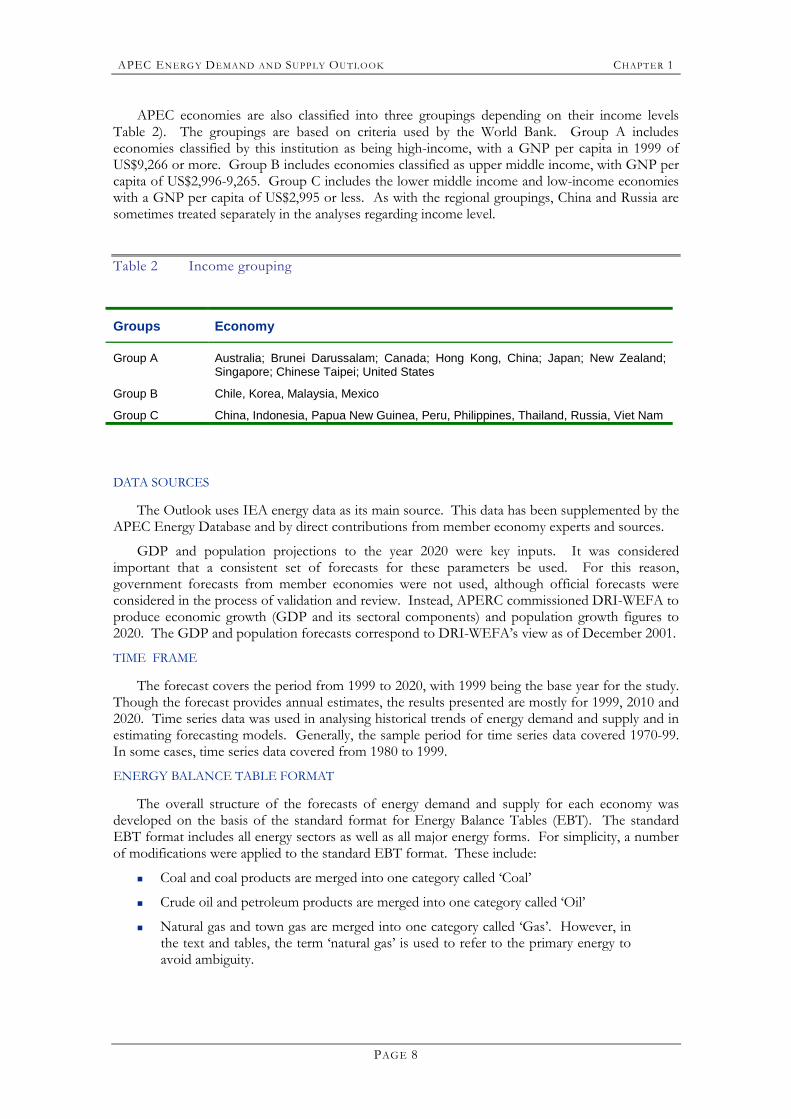
APEC economies are also classified into three groupings depending on their income levels Table 2). The groupings are based on criteria used by the World Bank. Group A includes economies classified by this institution as being high-income, with a GNP per capita in 1999 of US$9,266 or more. Group B includes economies classified as upper middle income, with GNP per capita of US$2,996-9,265. Group C includes the lower middle income and low-income economies with a GNP per capita of US$2,995 or less. As with the regional groupings, China and Russia are sometimes treated separately in the analyses regarding income level.
Table 2 Income grouping
Groups Economy
Group A Australia; Brunei Darussalam; Canada; Hong Kong, China; Japan; New Zealand; Singapore; Chinese Taipei; United States
Group B Chile, Korea, Malaysia, Mexico
Group C China, Indonesia, Papua New Guinea, Peru, Philippines, Thailand, Russia, Viet Nam
DATA SOURCES
The Outlook uses IEA energy data as its main source. This data has been supplemented by the APEC Energy Database and by direct contributions from member economy experts and sources.
GDP and population projections to the year 2020 were key inputs. It was considered important that a consistent set of forecasts for these parameters be used. For this reason, government forecasts from member economies were not used, although official forecasts were considered in the process of validation and review. Instead, APERC commissioned DRI-WEFA to produce economic growth (GDP and its sectoral components) and population growth figures to 2020. The GDP and population forecasts correspond to DRI-WEFA�s view as of December 2001.
TIME FRAME
The forecast covers the period from 1999 to 2020, with 1999 being the base year for the study. Though the forecast provides annual estimates, the results presented are mostly for 1999, 2010 and 2020. Time series data was used in analysing historical trends of energy demand and supply and in estimating forecasting models. Generally, the sample period for time series data covered 1970-99. In some cases, time series data covered from 1980 to 1999.
ENERGY BALANCE TABLE FORMAT
The overall structure of the forecasts of energy demand and supply for each economy was developed on the basis of the standard format for Energy Balance Tables (EBT). The standard EBT format includes all energy sectors as well as all major energy forms. For simplicity, a number of modifications were applied to the standard EBT format. These include:
! Coal and coal products are merged into one category called �Coal�
! Crude oil and petroleum products are merged into one category called �Oil�
! Natural gas and town gas are merged into one category called �Gas�. However, in the text and tables, the term �natural gas� is used to refer to the primary energy to avoid ambiguity.
APEC ENERG Y DEMAND AN D SUPP LY OUTLOOK CHAPT ER 1
PAGE 9
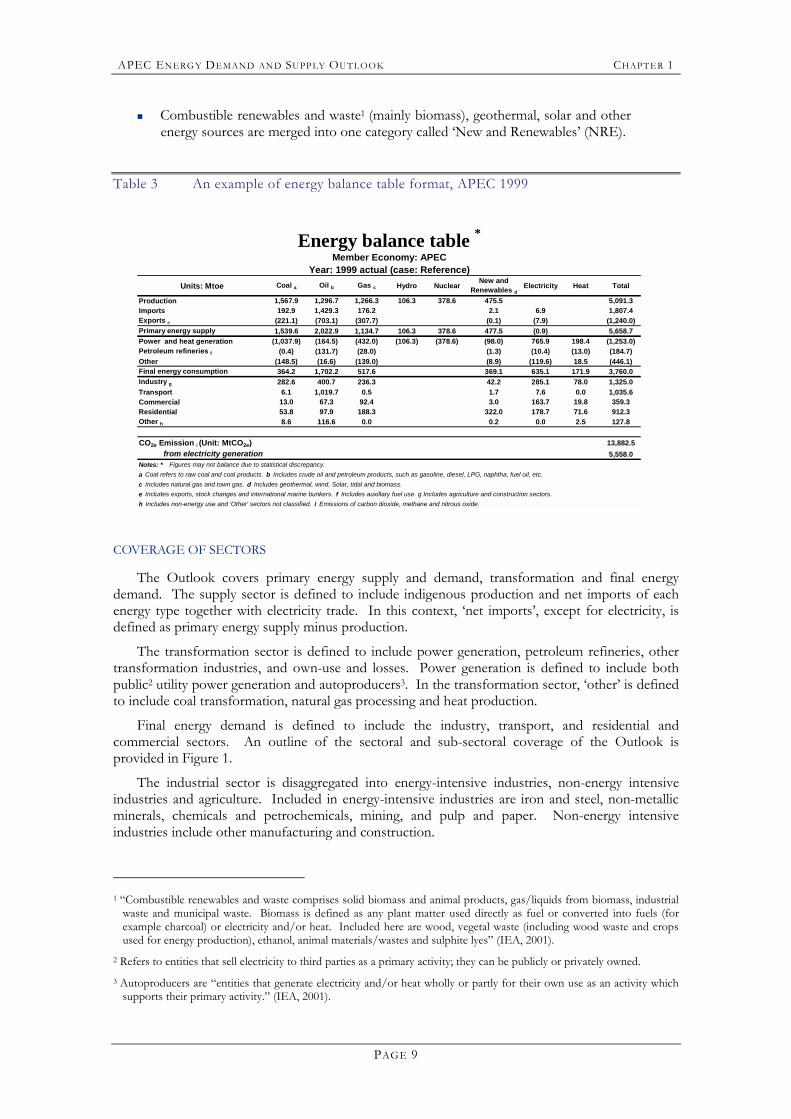
! Combustible renewables and waste1 (mainly biomass), geothermal, solar and other energy sources are merged into one category called �New and Renewables� (NRE).
Table 3 An example of energy balance table format, APEC 1999
Energy balance table *Member Economy: APEC
Year: 1999 actual (case: Reference)Units: Mtoe Coal a Oil b Gas c Hydro Nuclear
New andRenewables d
Electricity Heat Total
Production 1,567.9 1,296.7 1,266.3 106.3 378.6 475.5 5,091.3Imports 192.9 1,429.3 176.2 2.1 6.9 1,807.4Exports e (221.1) (703.1) (307.7) (0.1) (7.9) (1,240.0)Primary energy supply 1,539.6 2,022.9 1,134.7 106.3 378.6 477.5 (0.9) 5,658.7Power and heat generation (1,037.9) (164.5) (432.0) (106.3) (378.6) (98.0) 765.9 198.4 (1,253.0)Petroleum refineries f (0.4) (131.7) (28.0) (1.3) (10.4) (13.0) (184.7)Other (148.5) (16.6) (139.0) (8.9) (119.6) 18.5 (446.1)Final energy consumption 364.2 1,702.2 517.6 369.1 635.1 171.9 3,760.0Industry g 282.6 400.7 236.3 42.2 285.1 78.0 1,325.0Transport 6.1 1,019.7 0.5 1.7 7.6 0.0 1,035.6Commercial 13.0 67.3 92.4 3.0 163.7 19.8 359.3Residential 53.8 97.9 188.3 322.0 178.7 71.6 912.3Other h 8.6 116.6 0.0 0.2 0.0 2.5 127.8
CO2e Emission i (Unit: MtCO2e) 13,882.5from electricity generation 5,558.0
Notes: * Figures may not balance due to statistical discrepancy.a Coal refers to raw coal and coal products. b Includes crude oil and petroleum products, such as gasoline, diesel, LPG, naphtha, fuel oil, etc.c Includes natural gas and town gas. d Includes geothermal, wind, Solar, tidal and biomass.e Includes exports, stock changes and international marine bunkers. f Includes auxillary fuel use. g Includes agriculture and construction sectors.h Includes non-energy use and 'Other' sectors not classified. i Emissions of carbon dioxide, methane and nitrous oxide.
COVERAGE OF SECTORS
The Outlook covers primary energy supply and demand, transformation and final energy demand. The supply sector is defined to include indigenous production and net imports of each energy type together with electricity trade. In this context, �net imports�, except for electricity, is defined as primary energy supply minus production.
The transformation sector is defined to include power generation, petroleum refineries, other transformation industries, and own-use and losses. Power generation is defined to include both public2 utility power generation and autoproducers3. In the transformation sector, �other� is defined to include coal transformation, natural gas processing and heat production.
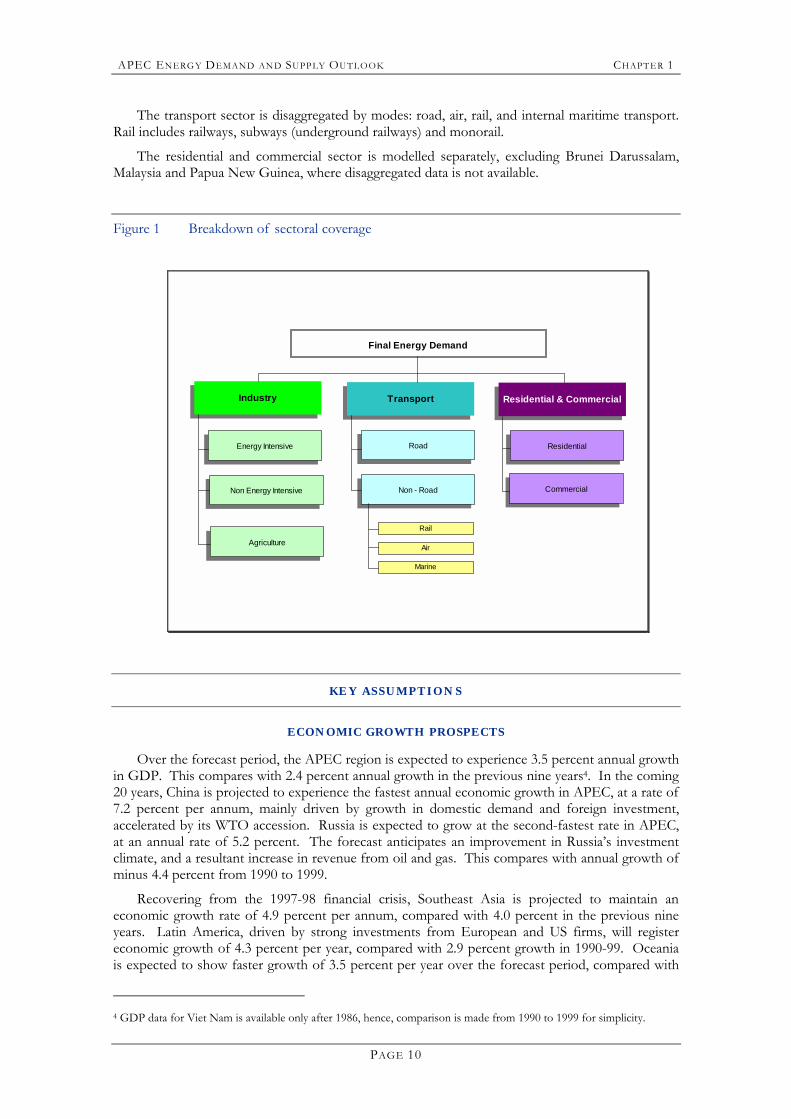
Final energy demand is defined to include the industry, transport, and residential and commercial sectors. An outline of the sectoral and sub-sectoral coverage of the Outlook is provided in Figure 1.
The industrial sector is disaggregated into energy-intensive industries, non-energy intensive industries and agriculture. Included in energy-intensive industries are iron and steel, non-metallic minerals, chemicals and petrochemicals, mining, and pulp and paper. Non-energy intensive industries include other manufacturing and construction.
1 �Combustible renewables and waste comprises solid biomass and animal products, gas/liquids from biomass, industrial
waste and municipal waste. Biomass is defined as any plant matter used directly as fuel or converted into fuels (for example charcoal) or electricity and/or heat. Included here are wood, vegetal waste (including wood waste and crops used for energy production), ethanol, animal materials/wastes and sulphite lyes� (IEA, 2001).
2 Refers to entities that sell electricity to third parties as a primary activity; they can be publicly or privately owned. 3 Autoproducers are �entities that generate electricity and/or heat wholly or partly for their own use as an activity which
supports their primary activity.� (IEA, 2001).
APEC ENERG Y DEMAND AN D SUPP LY OUTLOOK CHAPT ER 1
PAGE 10
The transport sector is disaggregated by modes: road, air, rail, and internal maritime transport. Rail includes railways, subways (underground railways) and monorail.
The residential and commercial sector is modelled separately, excluding Brunei Darussalam, Malaysia and Papua New Guinea, where disaggregated data is not available.
Figure 1 Breakdown of sectoral coverage
Industry Transport Residential & Commercial
Energy Intensive
Non Energy Intensive
Agriculture
Road
Non - Road
Rail
Air
Marine
Residential
Commercial
Final Energy Demand
KEY ASSUMPTIONS
ECONOMIC GROWTH PROSPECTS
Over the forecast period, the APEC region is expected to experience 3.5 percent annual growth in GDP. This compares with 2.4 percent annual growth in the previous nine years4. In the coming 20 years, China is projected to experience the fastest annual economic growth in APEC, at a rate of 7.2 percent per annum, mainly driven by growth in domestic demand and foreign investment, accelerated by its WTO accession. Russia is expected to grow at the second-fastest rate in APEC, at an annual rate of 5.2 percent. The forecast anticipates an improvement in Russia�s investment climate, and a resultant increase in revenue from oil and gas. This compares with annual growth of minus 4.4 percent from 1990 to 1999.
Recovering from the 1997-98 financial crisis, Southeast Asia is projected to maintain an economic growth rate of 4.9 percent per annum, compared with 4.0 percent in the previous nine years. Latin America, driven by strong investments from European and US firms, will register economic growth of 4.3 percent per year, compared with 2.9 percent growth in 1990-99. Oceania is expected to show faster growth of 3.5 percent per year over the forecast period, compared with
4 GDP data for Viet Nam is available only after 1986, hence, comparison is made from 1990 to 1999 for simplicity.

APEC ENERG Y DEMAND AN D SUPP LY OUTLOOK CHAPT ER 1
PAGE 11
2.8 percent in the previous nine years. North America�s economy is expected to expand at an annual rate of 3.2 percent, recovering from its current slowdown in a matter of one or two years. Northeast Asia is projected to see economic growth of 2.3 percent annually over the period, reflecting mainly continued strong growth in Korea and slow growth in Japan.
Table 4 GDP by regional groupings
Region GDP (1990 US$ billion) Annual Average Growth Rate (%)
1990 1999 2010 2020 1990-1999
1999-2010
2010-2020
1999-2020
North America 6,388 8,397 11,592 16,209 2.5 3.0 3.4 3.2
Latin America 319 436 742 1,057 2.9 5.0 3.6 4.3
Northeast Asia 3,538 4,243 5,407 6,889 1.7 2.2 2.5 2.3
Southeast Asia 338 519 866 1,422 4.0 4.8 5.1 4.9
Oceania 352 477 692 979 2.8 3.4 3.5 3.5
China 388 943 2,111 4,049 8.4 7.6 6.7 7.2
Russia 454 275 492 803 -4.4 5.4 5.0 5.2
APEC Total 11,777 15,291 21,901 31,409 2.4 3.3 3.7 3.5 Source: DRI-WEFA (2001)
Figure 2 GDP by regional grouping
0
5000
10000
15000
20000
25000
30000
35000
1980 1990 1999 2010 2020
Bill
ions
of 1
990
US$
North America Latin AmericaNortheast Asia Southeast AsiaOceania ChinaRussia
Source: DRI-WEFA (2001)
APEC ENERG Y DEMAND AN D SUPP LY OUTLOOK CHAPT ER 1
PAGE 12
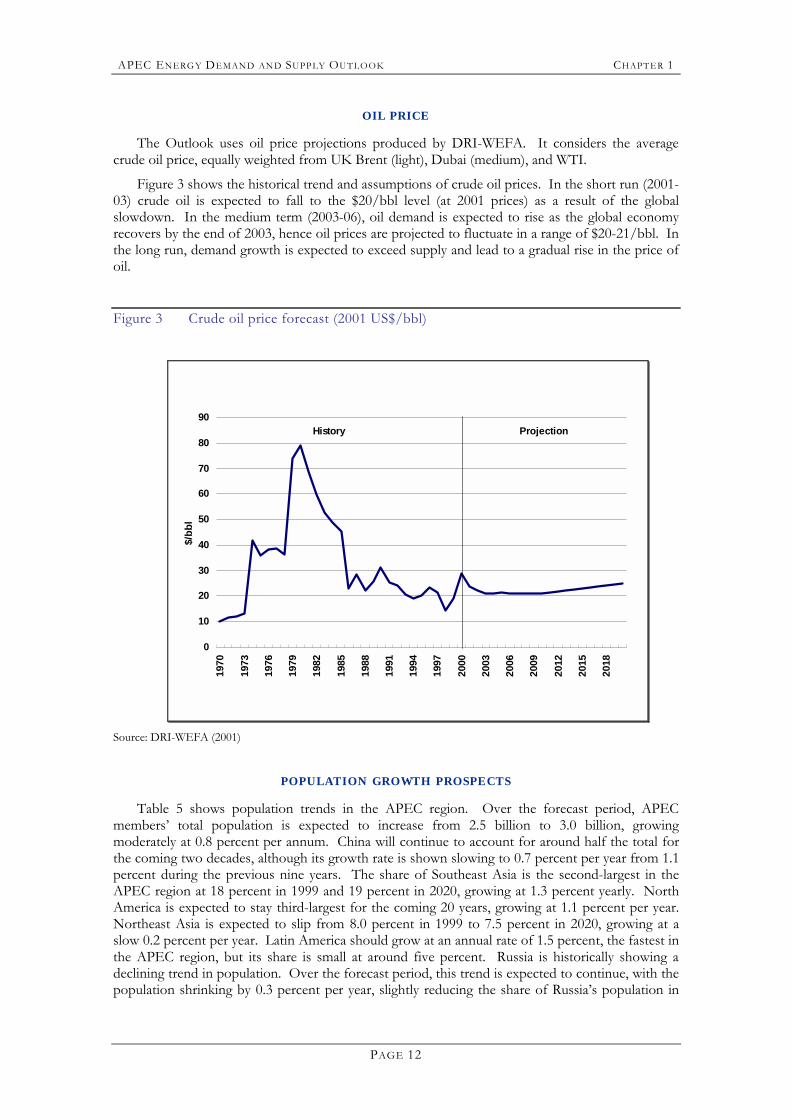
OIL PRICE
The Outlook uses oil price projections produced by DRI-WEFA. It considers the average crude oil price, equally weighted from UK Brent (light), Dubai (medium), and WTI.
Figure 3 shows the historical trend and assumptions of crude oil prices. In the short run (2001-03) crude oil is expected to fall to the $20/bbl level (at 2001 prices) as a result of the global slowdown. In the medium term (2003-06), oil demand is expected to rise as the global economy recovers by the end of 2003, hence oil prices are projected to fluctuate in a range of $20-21/bbl. In the long run, demand growth is expected to exceed supply and lead to a gradual rise in the price of oil.
Figure 3 Crude oil price forecast (2001 US$/bbl)
0
10
20
30
40
50
60
70
80
90
1970
1973
1976
1979
1982
1985
1988
1991
1994
1997
2000
2003
2006
2009
2012
2015
2018
$/bb
l
ProjectionHistory
Source: DRI-WEFA (2001)
POPULATION GROWTH PROSPECTS
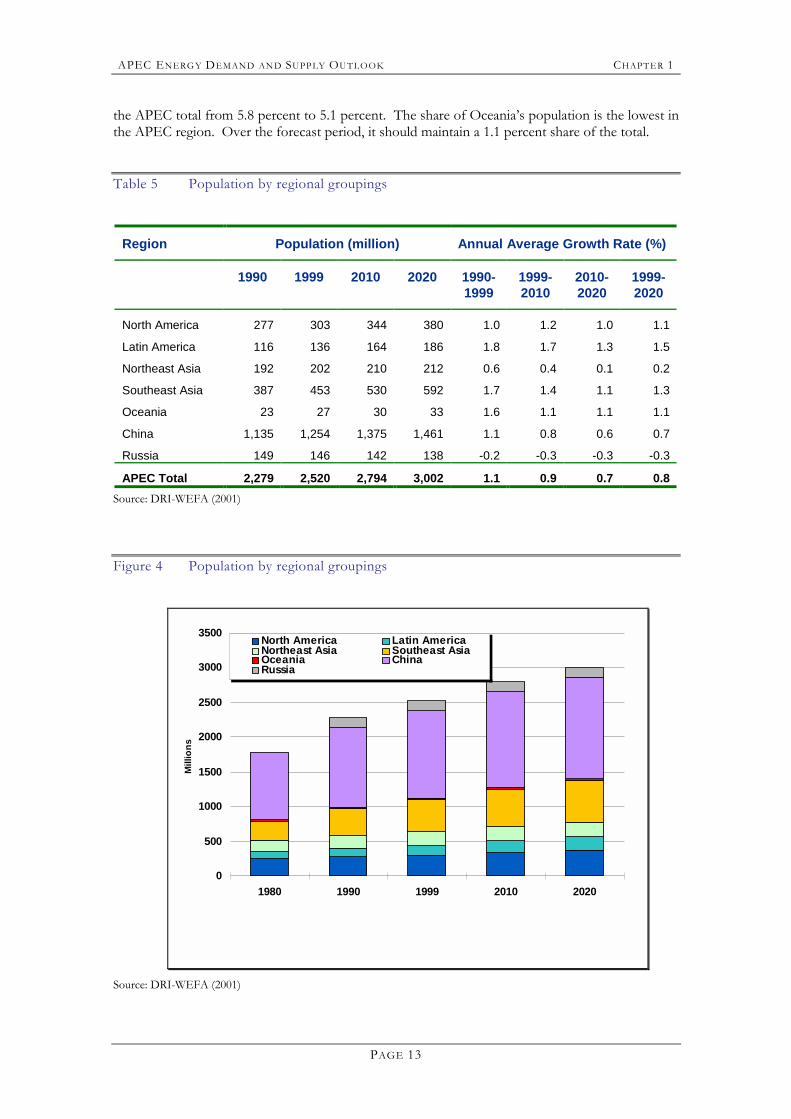
Table 5 shows population trends in the APEC region. Over the forecast period, APEC members� total population is expected to increase from 2.5 billion to 3.0 billion, growing moderately at 0.8 percent per annum. China will continue to account for around half the total for the coming two decades, although its growth rate is shown slowing to 0.7 percent per year from 1.1 percent during the previous nine years. The share of Southeast Asia is the second-largest in the APEC region at 18 percent in 1999 and 19 percent in 2020, growing at 1.3 percent yearly. North America is expected to stay third-largest for the coming 20 years, growing at 1.1 percent per year. Northeast Asia is expected to slip from 8.0 percent in 1999 to 7.5 percent in 2020, growing at a slow 0.2 percent per year. Latin America should grow at an annual rate of 1.5 percent, the fastest in the APEC region, but its share is small at around five percent. Russia is historically showing a declining trend in population. Over the forecast period, this trend is expected to continue, with the population shrinking by 0.3 percent per year, slightly reducing the share of Russia�s population in
APEC ENERG Y DEMAND AN D SUPP LY OUTLOOK CHAPT ER 1
PAGE 13
the APEC total from 5.8 percent to 5.1 percent. The share of Oceania�s population is the lowest in the APEC region. Over the forecast period, it should maintain a 1.1 percent share of the total.
Table 5 Population by regional groupings
Region Population (million) Annual Average Growth Rate (%)
1990 1999 2010 2020 1990-1999
1999-2010
2010-2020
1999-2020
North America 277 303 344 380 1.0 1.2 1.0 1.1
Latin America 116 136 164 186 1.8 1.7 1.3 1.5
Northeast Asia 192 202 210 212 0.6 0.4 0.1 0.2
Southeast Asia 387 453 530 592 1.7 1.4 1.1 1.3
Oceania 23 27 30 33 1.6 1.1 1.1 1.1
China 1,135 1,254 1,375 1,461 1.1 0.8 0.6 0.7
Russia 149 146 142 138 -0.2 -0.3 -0.3 -0.3
APEC Total 2,279 2,520 2,794 3,002 1.1 0.9 0.7 0.8 Source: DRI-WEFA (2001)
Figure 4 Population by regional groupings
0
500
1000
1500
2000
2500
3000
3500
1980 1990 1999 2010 2020
Mill
ions
North America Latin AmericaNortheast Asia Southeast AsiaOceania ChinaRussia
Source: DRI-WEFA (2001)

APEC ENERG Y DEMAND AN D SUPP LY OUTLOOK CHAPT ER 1
PAGE 14
APEC ENERG Y DEMAND AN D SUPP LY OUTLOOK CHAPT ER 2
PAGE 15
C H A P T E R 2 ECONOMIC ACTIVITY AND ENERGY DEMAND
This chapter examines the energy required to sustain the projected growth of the APEC economies, which are among the most rapidly growing in the world. In the first section, the total final energy demand forecasts are presented, followed by industrial energy demand and transport energy demand. Finally, forecasts for residential and commercial energy demand are presented.
FINAL ENERGY DEMAND
THE REGIONS
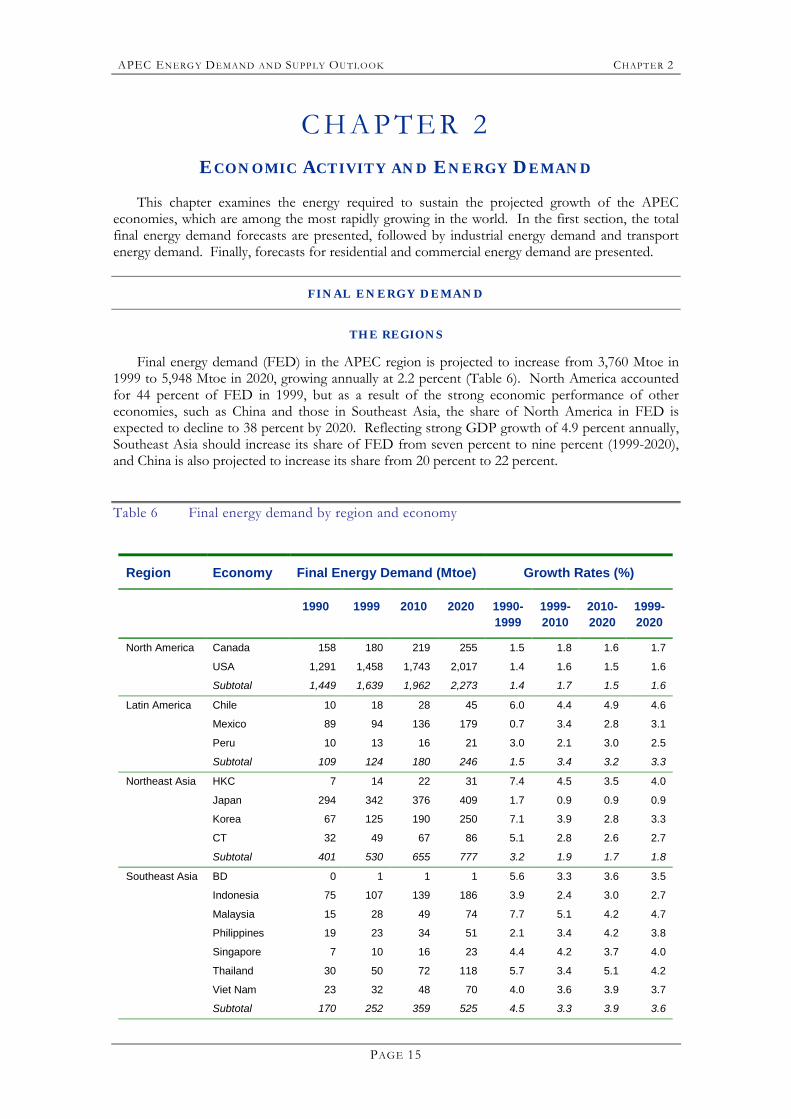
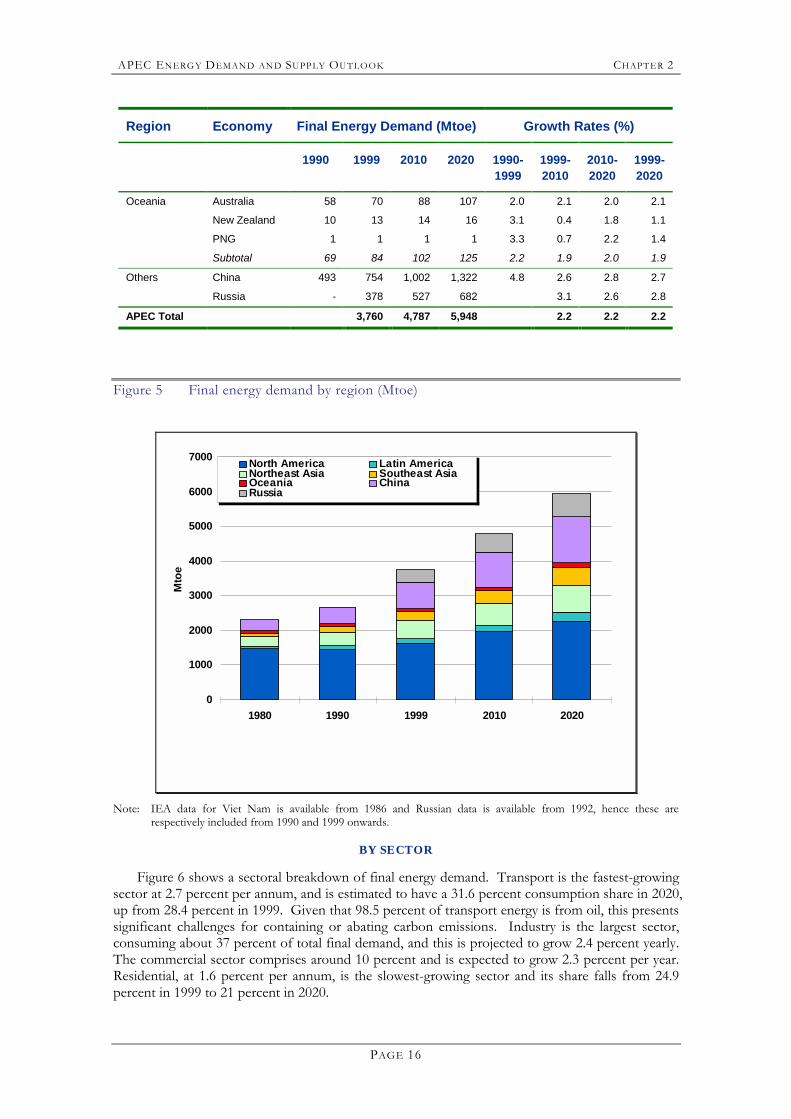
Final energy demand (FED) in the APEC region is projected to increase from 3,760 Mtoe in 1999 to 5,948 Mtoe in 2020, growing annually at 2.2 percent (Table 6). North America accounted for 44 percent of FED in 1999, but as a result of the strong economic performance of other economies, such as China and those in Southeast Asia, the share of North America in FED is expected to decline to 38 percent by 2020. Reflecting strong GDP growth of 4.9 percent annually, Southeast Asia should increase its share of FED from seven percent to nine percent (1999-2020), and China is also projected to increase its share from 20 percent to 22 percent.
Table 6 Final energy demand by region and economy
Region Economy Final Energy Demand (Mtoe) Growth Rates (%)
1990 1999 2010 2020 1990-1999
1999-2010
2010-2020
1999-2020
North America Canada 158 180 219 255 1.5 1.8 1.6 1.7
USA 1,291 1,458 1,743 2,017 1.4 1.6 1.5 1.6
Subtotal 1,449 1,639 1,962 2,273 1.4 1.7 1.5 1.6
Latin America Chile 10 18 28 45 6.0 4.4 4.9 4.6
Mexico 89 94 136 179 0.7 3.4 2.8 3.1
Peru 10 13 16 21 3.0 2.1 3.0 2.5
Subtotal 109 124 180 246 1.5 3.4 3.2 3.3
Northeast Asia HKC 7 14 22 31 7.4 4.5 3.5 4.0
Japan 294 342 376 409 1.7 0.9 0.9 0.9
Korea 67 125 190 250 7.1 3.9 2.8 3.3
CT 32 49 67 86 5.1 2.8 2.6 2.7
Subtotal 401 530 655 777 3.2 1.9 1.7 1.8
Southeast Asia BD 0 1 1 1 5.6 3.3 3.6 3.5
Indonesia 75 107 139 186 3.9 2.4 3.0 2.7
Malaysia 15 28 49 74 7.7 5.1 4.2 4.7
Philippines 19 23 34 51 2.1 3.4 4.2 3.8
Singapore 7 10 16 23 4.4 4.2 3.7 4.0
Thailand 30 50 72 118 5.7 3.4 5.1 4.2
Viet Nam 23 32 48 70 4.0 3.6 3.9 3.7
Subtotal 170 252 359 525 4.5 3.3 3.9 3.6
APEC ENERG Y DEMAND AN D SUPP LY OUTLOOK CHAPT ER 2
PAGE 16
Region Economy Final Energy Demand (Mtoe) Growth Rates (%)
1990 1999 2010 2020 1990-1999
1999-2010
2010-2020
1999-2020
Oceania Australia 58 70 88 107 2.0 2.1 2.0 2.1
New Zealand 10 13 14 16 3.1 0.4 1.8 1.1
PNG 1 1 1 1 3.3 0.7 2.2 1.4
Subtotal 69 84 102 125 2.2 1.9 2.0 1.9
Others China 493 754 1,002 1,322 4.8 2.6 2.8 2.7
Russia - 378 527 682 3.1 2.6 2.8
APEC Total 3,760 4,787 5,948 2.2 2.2 2.2
Figure 5 Final energy demand by region (Mtoe)
0
1000
2000
3000
4000
5000
6000
7000
1980 1990 1999 2010 2020
Mto
e
North America Latin AmericaNortheast Asia Southeast AsiaOceania ChinaRussia
Note: IEA data for Viet Nam is available from 1986 and Russian data is available from 1992, hence these are
respectively included from 1990 and 1999 onwards.
BY SECTOR
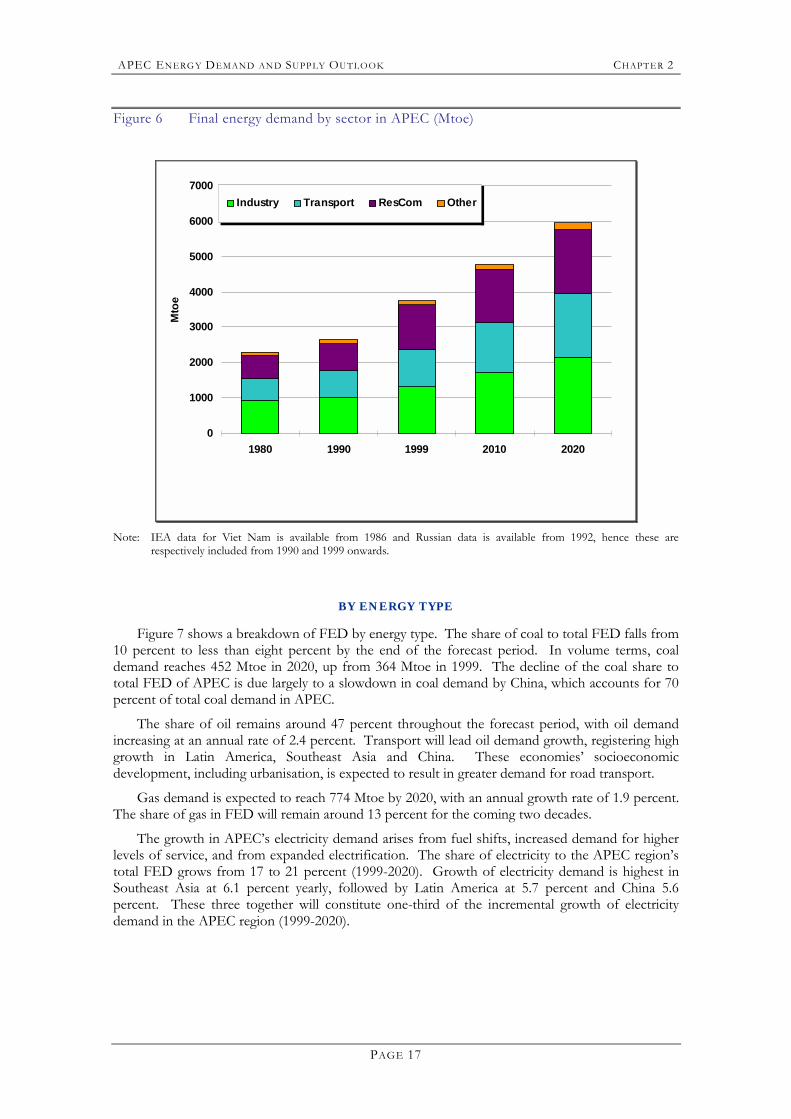
Figure 6 shows a sectoral breakdown of final energy demand. Transport is the fastest-growing sector at 2.7 percent per annum, and is estimated to have a 31.6 percent consumption share in 2020, up from 28.4 percent in 1999. Given that 98.5 percent of transport energy is from oil, this presents significant challenges for containing or abating carbon emissions. Industry is the largest sector, consuming about 37 percent of total final demand, and this is projected to grow 2.4 percent yearly. The commercial sector comprises around 10 percent and is expected to grow 2.3 percent per year. Residential, at 1.6 percent per annum, is the slowest-growing sector and its share falls from 24.9 percent in 1999 to 21 percent in 2020.
APEC ENERG Y DEMAND AN D SUPP LY OUTLOOK CHAPT ER 2
PAGE 17
Figure 6 Final energy demand by sector in APEC (Mtoe)
0
1000
2000
3000
4000
5000
6000
7000
1980 1990 1999 2010 2020
Mto
e
Industry Transport ResCom Other
Note: IEA data for Viet Nam is available from 1986 and Russian data is available from 1992, hence these are
respectively included from 1990 and 1999 onwards.
BY ENERGY TYPE
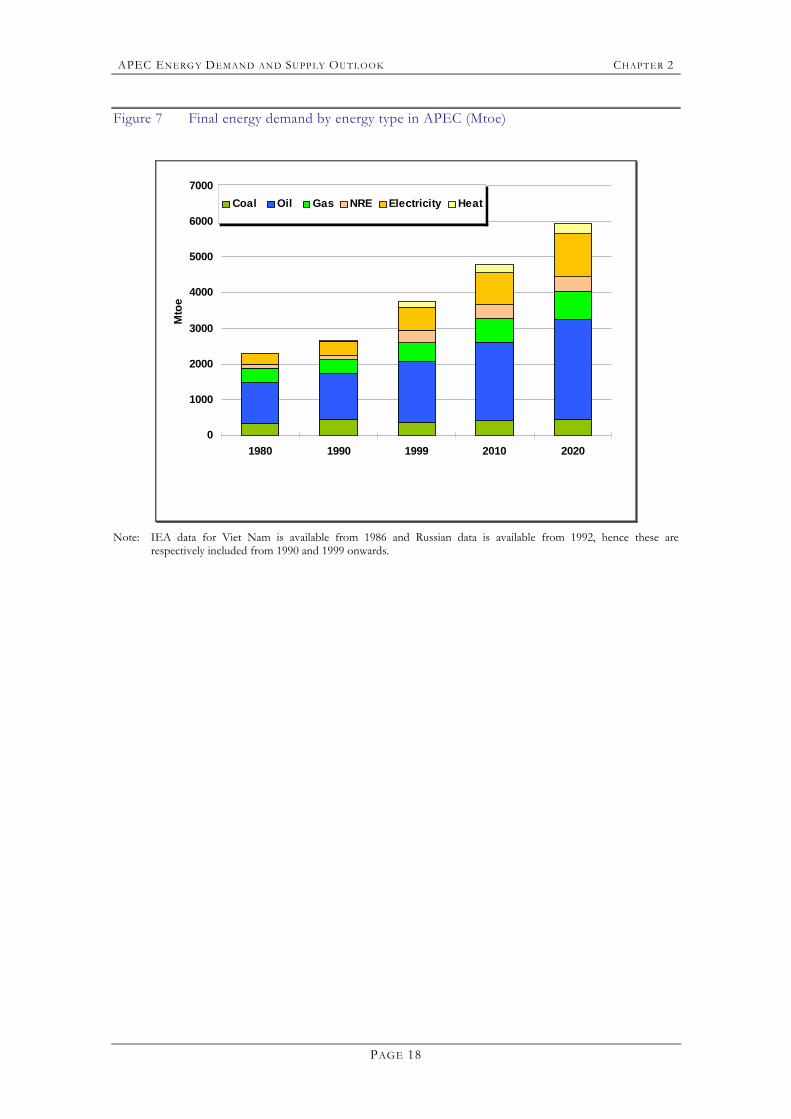
Figure 7 shows a breakdown of FED by energy type. The share of coal to total FED falls from 10 percent to less than eight percent by the end of the forecast period. In volume terms, coal demand reaches 452 Mtoe in 2020, up from 364 Mtoe in 1999. The decline of the coal share to total FED of APEC is due largely to a slowdown in coal demand by China, which accounts for 70 percent of total coal demand in APEC.
The share of oil remains around 47 percent throughout the forecast period, with oil demand increasing at an annual rate of 2.4 percent. Transport will lead oil demand growth, registering high growth in Latin America, Southeast Asia and China. These economies� socioeconomic development, including urbanisation, is expected to result in greater demand for road transport.
Gas demand is expected to reach 774 Mtoe by 2020, with an annual growth rate of 1.9 percent. The share of gas in FED will remain around 13 percent for the coming two decades.
The growth in APEC�s electricity demand arises from fuel shifts, increased demand for higher levels of service, and from expanded electrification. The share of electricity to the APEC region�s total FED grows from 17 to 21 percent (1999-2020). Growth of electricity demand is highest in Southeast Asia at 6.1 percent yearly, followed by Latin America at 5.7 percent and China 5.6 percent. These three together will constitute one-third of the incremental growth of electricity demand in the APEC region (1999-2020).
APEC ENERG Y DEMAND AN D SUPP LY OUTLOOK CHAPT ER 2
PAGE 18
Figure 7 Final energy demand by energy type in APEC (Mtoe)
0
1000
2000
3000
4000
5000
6000
7000
1980 1990 1999 2010 2020
Mto
e
Coal Oil Gas NRE Electricity Heat
Note: IEA data for Viet Nam is available from 1986 and Russian data is available from 1992, hence these are
respectively included from 1990 and 1999 onwards.
APEC ENERG Y DEMAND AN D SUPP LY OUTLOOK CHAPT ER 2
PAGE 19
THE IND UST RIAL SECTOR
INTRODUCTION
Energy demand in APEC�s industrial sector rose from 937 Mtoe in 19805 to 1,329 Mtoe in 1999. During this period, the energy consumption of APEC�s nine high-income economies remained unchanged in aggregate, being 660 Mtoe in 1980 and 655 Mtoe in 1999. However, all the economies in this group except the USA increased consumption during the period. The aggregate figure�s stability is entirely due to a decline of 76 Mtoe in the US�s consumption between 1980 and 1999. All other economies in this group increased their consumption, from 213 Mtoe in 1980 to 284 Mtoe in 1999, a growth rate of 1.5 percent per annum. In contrast, the 11 medium- and low-income economies (excluding Russia) saw their energy consumption almost double from 277 Mtoe in 1980 to 522 Mtoe in 1999, a growth rate of 3.4 percent per annum. Russia�s energy consumption is known to have fallen between 1980 and 1999.6
Industrial energy demand is projected in this Outlook to increase from 1,329 Mtoe to 2,155 Mtoe between 1999 and 2020, an average growth rate of 2.3 percent per annum. Virtually every APEC economy is expected to increase its energy consumption. This growth rate is higher than the approximately 0.8 percent per annum7 experienced between 1980 and 1999, when consumption fell in the two large energy-consuming economies, Russia and the US. Summary results by economy and grouping are shown in Table 7.
THE GROUPINGS
The �A� grouping, comprising nine higher-income economies, is projected to increase its energy consumption from 655 Mtoe in 1999 to 832 Mtoe in 2020, a growth rate of just 1.1 percent per annum. All economies in this group are expected to increase consumption, except for New Zealand, where the decline results from the anticipated closure of a single feedstock industry in a small economy. In line with observed energy consumption trends where more developed economies make the transition from industrial economies to ones based more on service industries, and also where development and use of advanced technologies brings higher energy efficiencies, this grouping is expected to account for a declining share of industrial energy consumption within APEC. This share, which was 58.1 percent in 1980, fell to 49.3 percent by 1999 and is projected to fall to 38.6 percent in 2020. In part, this is also a result of these more �mature� economies having lower projected economic growth rates compared with developing economies.
The �B� grouping of middle-income economies − Chile, Korea, Malaysia and Mexico � saw their combined industrial energy consumption more than double between 1980 and 1999, increasing at an average rate of 4.7 percent per annum, from 47 Mtoe to 112 Mtoe. In the next two decades, the grouping�s energy consumption is projected to more than double again, though rising at a lower rate of 3.6 percent per annum. Their share of APEC consumption has doubled from 4.2 percent in 1980 to 8.4 percent in 1999 and is projected to increase to 11 percent in 2020.
The �C� economies� combined energy consumption by industry almost tripled between 1980 and 1999, up from 23 Mtoe to 64 Mtoe, a growth rate of 5.6 percent per annum. Energy consumption growth in this group is also expected to slow in the forecast period, to 3.7 percent per annum, a similar rate to the �B� group. The group�s share within APEC increased by 140 percent between 1980 and 1999, from two percent to 4.8 percent, but is projected to rise by only one-third, to 6.4 percent, by 2020.
5 This figure does not include Russia, as data for this economy is not available until 1992 when its energy consumption is
estimated to have been around 240-250 Mtoe. 6 It would have been around 200 Mtoe if the average growth rate was 2 percent per annum between 1980 and 1992. 7 For illustrative purposes, Russia is assumed to have consumed the abovementioned 200 Mtoe in 1980.
APEC ENERG Y DEMAND AN D SUPP LY OUTLOOK CHAPT ER 2
PAGE 20
Table 7 Industrial energy demand
Energy Consumption (ktoe) Growth Rates (%)
Share of Industrial Sector Energy (%)
1980 1999 2020 1980-1999
1999-2020
1980 1999 2020
Group A
Australia 19,342 25,760 38,381 1.5 1.9 1.7 1.9 1.8
BD 53 83 145 2.4 2.7 0.0 0.0 0.0
Canada 60,824 75,408 116,682 1.1 2.1 5.4 5.7 5.4
HKC 1,054 2,301 4,453 4.2 3.2 0.1 0.2 0.2
Japan 116,173 145,040 151,910 1.2 0.2 10.2 10.9 7.0
NZ 2,680 5,578 4,985 3.9 -0.5 0.2 0.4 0.2
Singapore 488 3,992 12,374 11.7 5.5 0.0 0.3 0.6
CT 12,231 25,414 41,032 3.9 2.3 1.1 1.9 1.9
US 447,042 371,305 461,561 -1.0 1.0 39.3 27.9 21.4
Subtotal 659,887 654,881 831,523 0.0 1.1 58.1 49.3 38.6
Group B
Chile 2,683 6,444 16,933 4.7 4.7 0.2 0.5 0.8
Korea 14,041 58,336 99,306 7.8 2.6 1.2 4.4 4.6
Malaysia 2,930 11,364 31,875 7.4 5.0 0.3 0.9 1.5
Mexico 27,593 36,083 88,040 1.4 4.3 2.4 2.7 4.1
Subtotal 47,248 112,227 236,154 4.7 3.6 4.2 8.4 11.0
Group C
Indonesia 8,239 25,103 43,557 6.0 2.7 0.7 1.9 2.0
PNG 190 457 457 4.7 0.0 0.0 0.0 0.0
Peru 2,763 3,641 9,046 1.5 4.4 0.2 0.3 0.4
Philippines 4,833 10,712 23,241 4.3 3.8 0.4 0.8 1.1
Thailand 5,109 20,652 49,526 7.6 4.3 0.4 1.6 2.3
Viet Nam 1,645 3,838 12,975 4.6 6.0 0.1 0.3 0.6
Subtotal 22,779 64,403 138,802 5.6 3.7 2.0 4.8 6.4
Others
China 206,756 345,024 600,669 2.7 2.7 18.2 26.0 27.9
Russia 200,000 152,726 347,968 4.0 17.6 11.5 16.1
APEC Total 1,136,670 1,329,261 2,155,115 0.8 2.3
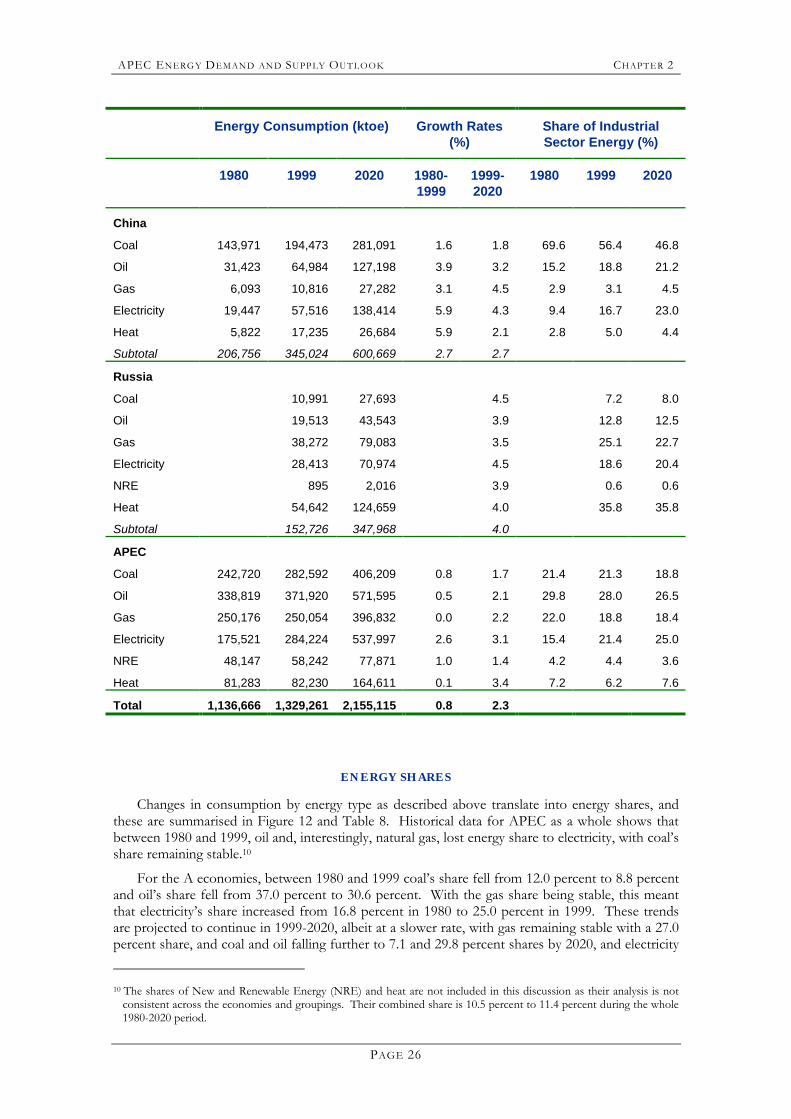
China�s broad energy growth is expected to remain steady in the forecast period at around 2.7 percent per annum, similar to that in the earlier period. In 2000 or 2001, China�s industrial sector surpassed that of the US as the world�s largest energy consumer. Its industrial sector is projected to consume around 601 Mtoe in 2020 compared with 207 Mtoe in 1980 and 345 Mtoe in 1999. Its
APEC ENERG Y DEMAND AN D SUPP LY OUTLOOK CHAPT ER 2
PAGE 21
share within APEC in 2020 will be around 27.9 percent, up from 18.2 percent in 1980 but only a slight gain from 26 percent in 1999.
Although no data is available for Russia�s industrial energy consumption in 1980, it is thought to have been higher than in 1999. The 1999 consumption level of 153 Mtoe is 64 percent of the 1993 level � the earliest year for which comparable data is available. Russia�s industrial energy consumption is projected to grow robustly at a rate of four percent per annum and reach a total of 348 Mtoe in 2020. At 16.1 percent of the APEC total, this is much higher than the 11.5 percent share in 1999.
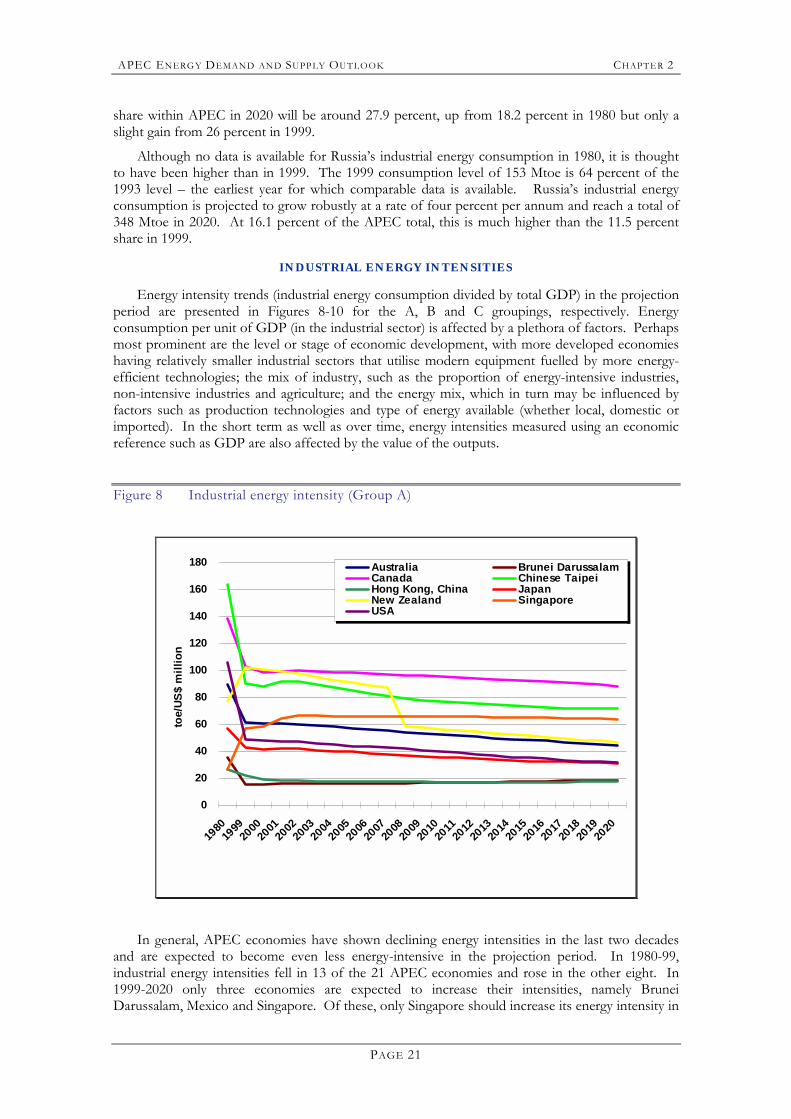
INDUSTRIAL ENERGY INTENSITIES
Energy intensity trends (industrial energy consumption divided by total GDP) in the projection period are presented in Figures 8-10 for the A, B and C groupings, respectively. Energy consumption per unit of GDP (in the industrial sector) is affected by a plethora of factors. Perhaps most prominent are the level or stage of economic development, with more developed economies having relatively smaller industrial sectors that utilise modern equipment fuelled by more energy-efficient technologies; the mix of industry, such as the proportion of energy-intensive industries, non-intensive industries and agriculture; and the energy mix, which in turn may be influenced by factors such as production technologies and type of energy available (whether local, domestic or imported). In the short term as well as over time, energy intensities measured using an economic reference such as GDP are also affected by the value of the outputs.
Figure 8 Industrial energy intensity (Group A)
0
20
40
60
80
100
120
140
160
180
1980
1999
2000
2001
2002
2003
2004
2005
2006
2007
2008
2009
2010
2011
2012
2013
2014
2015
2016
2017
2018
2019
2020
toe/
US$
mill
ion
Australia Brunei DarussalamCanada Chinese TaipeiHong Kong, China JapanNew Zealand SingaporeUSA
In general, APEC economies have shown declining energy intensities in the last two decades and are expected to become even less energy-intensive in the projection period. In 1980-99, industrial energy intensities fell in 13 of the 21 APEC economies and rose in the other eight. In 1999-2020 only three economies are expected to increase their intensities, namely Brunei Darussalam, Mexico and Singapore. Of these, only Singapore should increase its energy intensity in
APEC ENERG Y DEMAND AN D SUPP LY OUTLOOK CHAPT ER 2
PAGE 22
both periods, albeit at a slower rate in the future. Singapore is perhaps unique, though, with its industrial sector dominated by it being a city-state and a major oil refining centre.
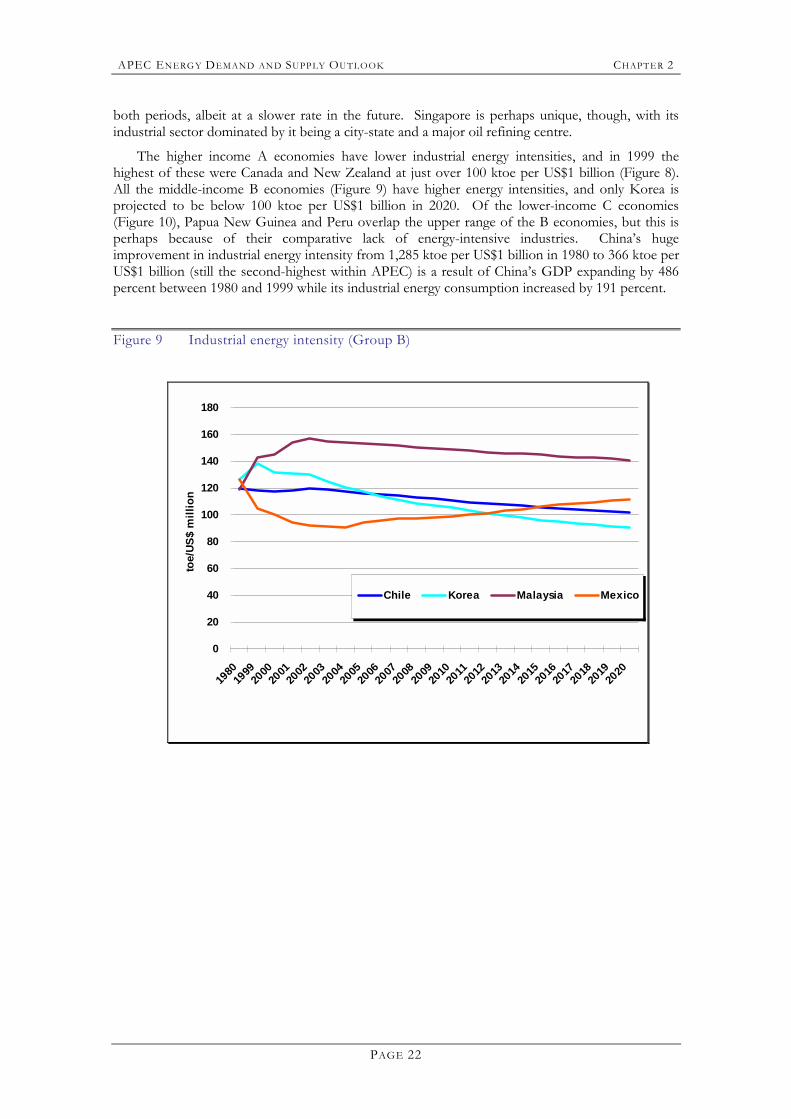
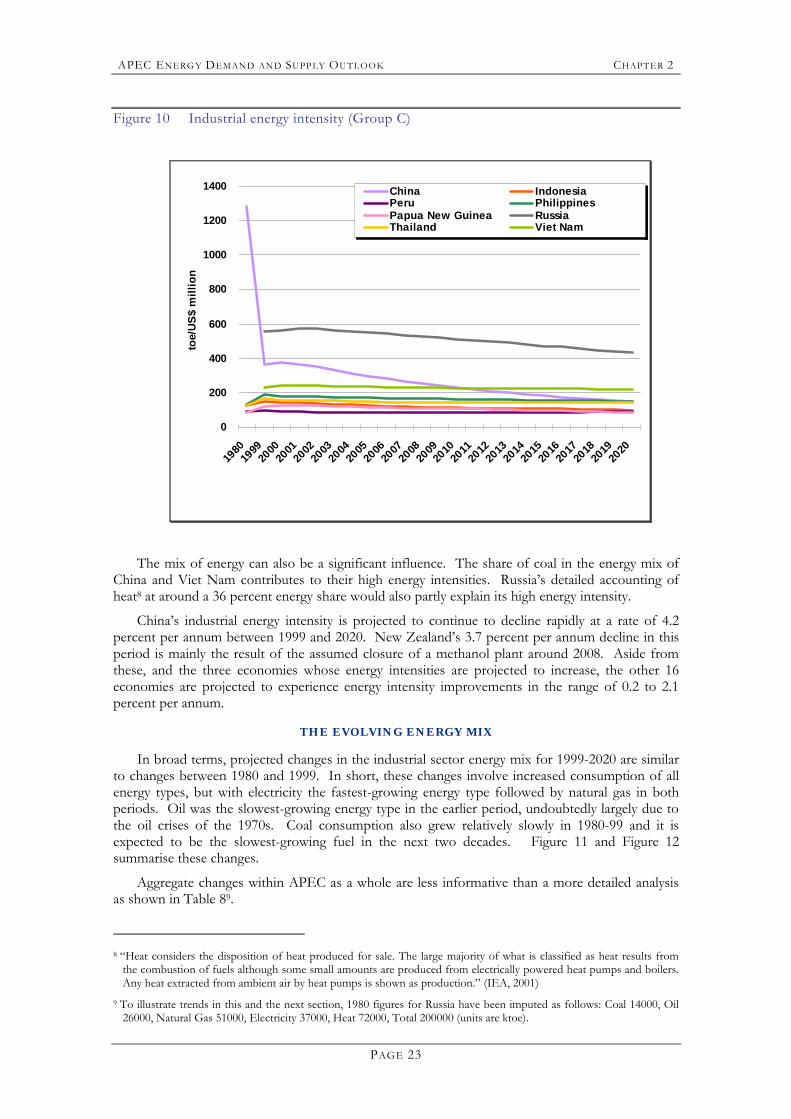
The higher income A economies have lower industrial energy intensities, and in 1999 the highest of these were Canada and New Zealand at just over 100 ktoe per US$1 billion (Figure 8). All the middle-income B economies (Figure 9) have higher energy intensities, and only Korea is projected to be below 100 ktoe per US$1 billion in 2020. Of the lower-income C economies (Figure 10), Papua New Guinea and Peru overlap the upper range of the B economies, but this is perhaps because of their comparative lack of energy-intensive industries. China�s huge improvement in industrial energy intensity from 1,285 ktoe per US$1 billion in 1980 to 366 ktoe per US$1 billion (still the second-highest within APEC) is a result of China�s GDP expanding by 486 percent between 1980 and 1999 while its industrial energy consumption increased by 191 percent.
Figure 9 Industrial energy intensity (Group B)
0
20
40
60
80
100
120
140
160
180
1980
1999
2000
2001
2002
2003
2004
2005
2006
2007
2008
2009
2010
2011
2012
2013
2014
2015
2016
2017
2018
2019
2020
toe/
US$
mill
ion
Chile Korea Malaysia Mexico
APEC ENERG Y DEMAND AN D SUPP LY OUTLOOK CHAPT ER 2
PAGE 23
Figure 10 Industrial energy intensity (Group C)
0
200
400
600
800
1000
1200
1400
1980
1999
2000
2001
2002
2003
2004
2005
2006
2007
2008
2009
2010
2011
2012
2013
2014
2015
2016
2017
2018
2019
2020
toe/
US$
mill
ion
China IndonesiaPeru PhilippinesPapua New Guinea RussiaThailand Viet Nam
The mix of energy can also be a significant influence. The share of coal in the energy mix of China and Viet Nam contributes to their high energy intensities. Russia�s detailed accounting of heat8 at around a 36 percent energy share would also partly explain its high energy intensity.
China�s industrial energy intensity is projected to continue to decline rapidly at a rate of 4.2 percent per annum between 1999 and 2020. New Zealand�s 3.7 percent per annum decline in this period is mainly the result of the assumed closure of a methanol plant around 2008. Aside from these, and the three economies whose energy intensities are projected to increase, the other 16 economies are projected to experience energy intensity improvements in the range of 0.2 to 2.1 percent per annum.
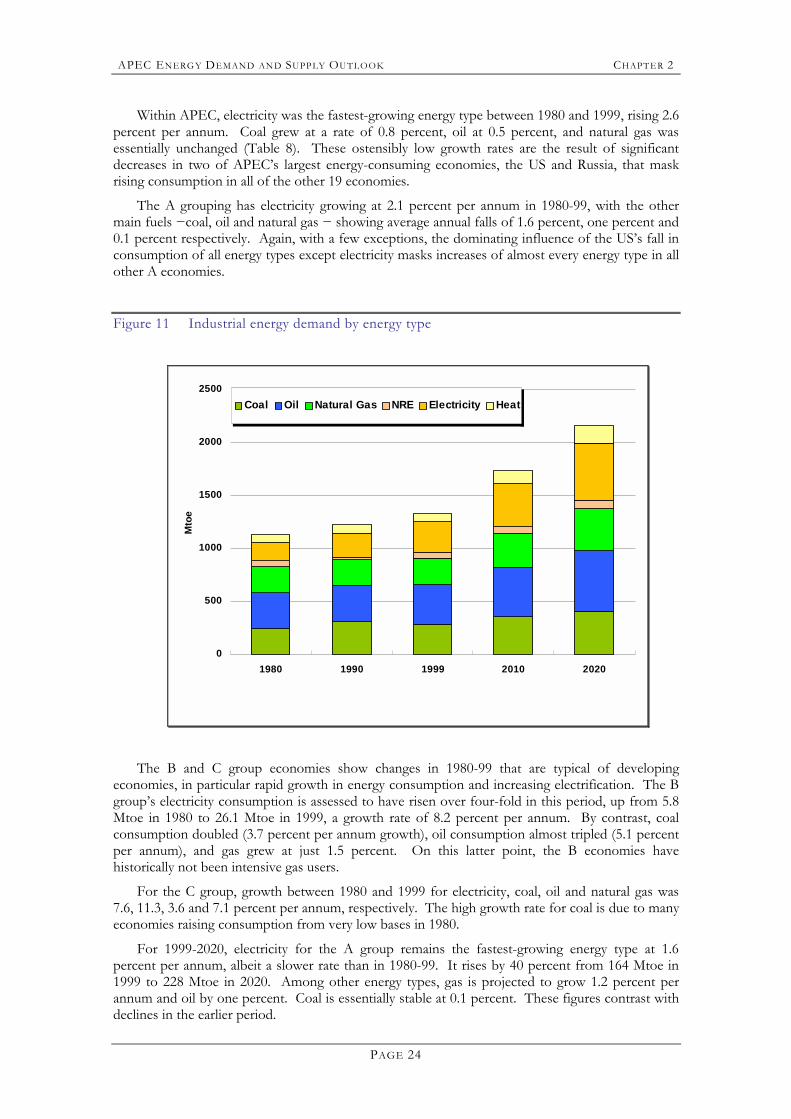
THE EVOLVING ENERGY MIX
In broad terms, projected changes in the industrial sector energy mix for 1999-2020 are similar to changes between 1980 and 1999. In short, these changes involve increased consumption of all energy types, but with electricity the fastest-growing energy type followed by natural gas in both periods. Oil was the slowest-growing energy type in the earlier period, undoubtedly largely due to the oil crises of the 1970s. Coal consumption also grew relatively slowly in 1980-99 and it is expected to be the slowest-growing fuel in the next two decades. Figure 11 and Figure 12 summarise these changes.
Aggregate changes within APEC as a whole are less informative than a more detailed analysis as shown in Table 89.
8 �Heat considers the disposition of heat produced for sale. The large majority of what is classified as heat results from
the combustion of fuels although some small amounts are produced from electrically powered heat pumps and boilers. Any heat extracted from ambient air by heat pumps is shown as production.� (IEA, 2001)
9 To illustrate trends in this and the next section, 1980 figures for Russia have been imputed as follows: Coal 14000, Oil 26000, Natural Gas 51000, Electricity 37000, Heat 72000, Total 200000 (units are ktoe).
APEC ENERG Y DEMAND AN D SUPP LY OUTLOOK CHAPT ER 2
PAGE 24
Within APEC, electricity was the fastest-growing energy type between 1980 and 1999, rising 2.6 percent per annum. Coal grew at a rate of 0.8 percent, oil at 0.5 percent, and natural gas was essentially unchanged (Table 8). These ostensibly low growth rates are the result of significant decreases in two of APEC�s largest energy-consuming economies, the US and Russia, that mask rising consumption in all of the other 19 economies.
The A grouping has electricity growing at 2.1 percent per annum in 1980-99, with the other main fuels −coal, oil and natural gas − showing average annual falls of 1.6 percent, one percent and 0.1 percent respectively. Again, with a few exceptions, the dominating influence of the US�s fall in consumption of all energy types except electricity masks increases of almost every energy type in all other A economies.
Figure 11 Industrial energy demand by energy type
0
500
1000
1500
2000
2500
1980 1990 1999 2010 2020
Mto
e
Coal Oil Natural Gas NRE Electricity Heat
The B and C group economies show changes in 1980-99 that are typical of developing economies, in particular rapid growth in energy consumption and increasing electrification. The B group�s electricity consumption is assessed to have risen over four-fold in this period, up from 5.8 Mtoe in 1980 to 26.1 Mtoe in 1999, a growth rate of 8.2 percent per annum. By contrast, coal consumption doubled (3.7 percent per annum growth), oil consumption almost tripled (5.1 percent per annum), and gas grew at just 1.5 percent. On this latter point, the B economies have historically not been intensive gas users.
For the C group, growth between 1980 and 1999 for electricity, coal, oil and natural gas was 7.6, 11.3, 3.6 and 7.1 percent per annum, respectively. The high growth rate for coal is due to many economies raising consumption from very low bases in 1980.
For 1999-2020, electricity for the A group remains the fastest-growing energy type at 1.6 percent per annum, albeit a slower rate than in 1980-99. It rises by 40 percent from 164 Mtoe in 1999 to 228 Mtoe in 2020. Among other energy types, gas is projected to grow 1.2 percent per annum and oil by one percent. Coal is essentially stable at 0.1 percent. These figures contrast with declines in the earlier period.
APEC ENERG Y DEMAND AN D SUPP LY OUTLOOK CHAPT ER 2
PAGE 25
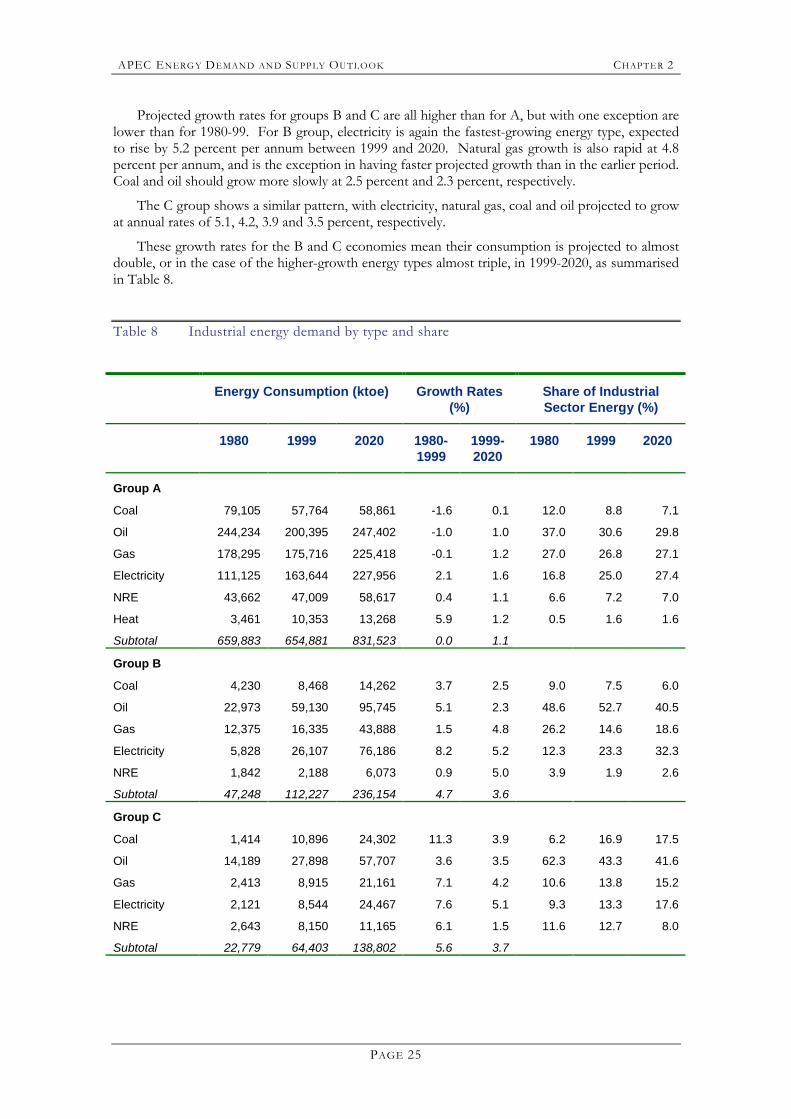
Projected growth rates for groups B and C are all higher than for A, but with one exception are lower than for 1980-99. For B group, electricity is again the fastest-growing energy type, expected to rise by 5.2 percent per annum between 1999 and 2020. Natural gas growth is also rapid at 4.8 percent per annum, and is the exception in having faster projected growth than in the earlier period. Coal and oil should grow more slowly at 2.5 percent and 2.3 percent, respectively.
The C group shows a similar pattern, with electricity, natural gas, coal and oil projected to grow at annual rates of 5.1, 4.2, 3.9 and 3.5 percent, respectively.
These growth rates for the B and C economies mean their consumption is projected to almost double, or in the case of the higher-growth energy types almost triple, in 1999-2020, as summarised in Table 8.
Table 8 Industrial energy demand by type and share
Energy Consumption (ktoe) Growth Rates (%)
Share of Industrial Sector Energy (%)
1980 1999 2020 1980-1999
1999-2020
1980 1999 2020
Group A
Coal 79,105 57,764 58,861 -1.6 0.1 12.0 8.8 7.1
Oil 244,234 200,395 247,402 -1.0 1.0 37.0 30.6 29.8
Gas 178,295 175,716 225,418 -0.1 1.2 27.0 26.8 27.1
Electricity 111,125 163,644 227,956 2.1 1.6 16.8 25.0 27.4
NRE 43,662 47,009 58,617 0.4 1.1 6.6 7.2 7.0
Heat 3,461 10,353 13,268 5.9 1.2 0.5 1.6 1.6
Subtotal 659,883 654,881 831,523 0.0 1.1
Group B
Coal 4,230 8,468 14,262 3.7 2.5 9.0 7.5 6.0
Oil 22,973 59,130 95,745 5.1 2.3 48.6 52.7 40.5
Gas 12,375 16,335 43,888 1.5 4.8 26.2 14.6 18.6
Electricity 5,828 26,107 76,186 8.2 5.2 12.3 23.3 32.3
NRE 1,842 2,188 6,073 0.9 5.0 3.9 1.9 2.6
Subtotal 47,248 112,227 236,154 4.7 3.6
Group C
Coal 1,414 10,896 24,302 11.3 3.9 6.2 16.9 17.5
Oil 14,189 27,898 57,707 3.6 3.5 62.3 43.3 41.6
Gas 2,413 8,915 21,161 7.1 4.2 10.6 13.8 15.2
Electricity 2,121 8,544 24,467 7.6 5.1 9.3 13.3 17.6
NRE 2,643 8,150 11,165 6.1 1.5 11.6 12.7 8.0
Subtotal 22,779 64,403 138,802 5.6 3.7
APEC ENERG Y DEMAND AN D SUPP LY OUTLOOK CHAPT ER 2
PAGE 26
Energy Consumption (ktoe) Growth Rates (%)
Share of Industrial Sector Energy (%)
1980 1999 2020 1980-1999
1999-2020
1980 1999 2020
China
Coal 143,971 194,473 281,091 1.6 1.8 69.6 56.4 46.8
Oil 31,423 64,984 127,198 3.9 3.2 15.2 18.8 21.2
Gas 6,093 10,816 27,282 3.1 4.5 2.9 3.1 4.5
Electricity 19,447 57,516 138,414 5.9 4.3 9.4 16.7 23.0
Heat 5,822 17,235 26,684 5.9 2.1 2.8 5.0 4.4
Subtotal 206,756 345,024 600,669 2.7 2.7
Russia
Coal 10,991 27,693 4.5 7.2 8.0
Oil 19,513 43,543 3.9 12.8 12.5
Gas 38,272 79,083 3.5 25.1 22.7
Electricity 28,413 70,974 4.5 18.6 20.4
NRE 895 2,016 3.9 0.6 0.6
Heat 54,642 124,659 4.0 35.8 35.8
Subtotal 152,726 347,968 4.0
APEC
Coal 242,720 282,592 406,209 0.8 1.7 21.4 21.3 18.8
Oil 338,819 371,920 571,595 0.5 2.1 29.8 28.0 26.5
Gas 250,176 250,054 396,832 0.0 2.2 22.0 18.8 18.4
Electricity 175,521 284,224 537,997 2.6 3.1 15.4 21.4 25.0
NRE 48,147 58,242 77,871 1.0 1.4 4.2 4.4 3.6
Heat 81,283 82,230 164,611 0.1 3.4 7.2 6.2 7.6
Total 1,136,666 1,329,261 2,155,115 0.8 2.3
ENERGY SHARES
Changes in consumption by energy type as described above translate into energy shares, and these are summarised in Figure 12 and Table 8. Historical data for APEC as a whole shows that between 1980 and 1999, oil and, interestingly, natural gas, lost energy share to electricity, with coal�s share remaining stable.10
For the A economies, between 1980 and 1999 coal�s share fell from 12.0 percent to 8.8 percent and oil�s share fell from 37.0 percent to 30.6 percent. With the gas share being stable, this meant that electricity�s share increased from 16.8 percent in 1980 to 25.0 percent in 1999. These trends are projected to continue in 1999-2020, albeit at a slower rate, with gas remaining stable with a 27.0 percent share, and coal and oil falling further to 7.1 and 29.8 percent shares by 2020, and electricity
10 The shares of New and Renewable Energy (NRE) and heat are not included in this discussion as their analysis is not
consistent across the economies and groupings. Their combined share is 10.5 percent to 11.4 percent during the whole 1980-2020 period.
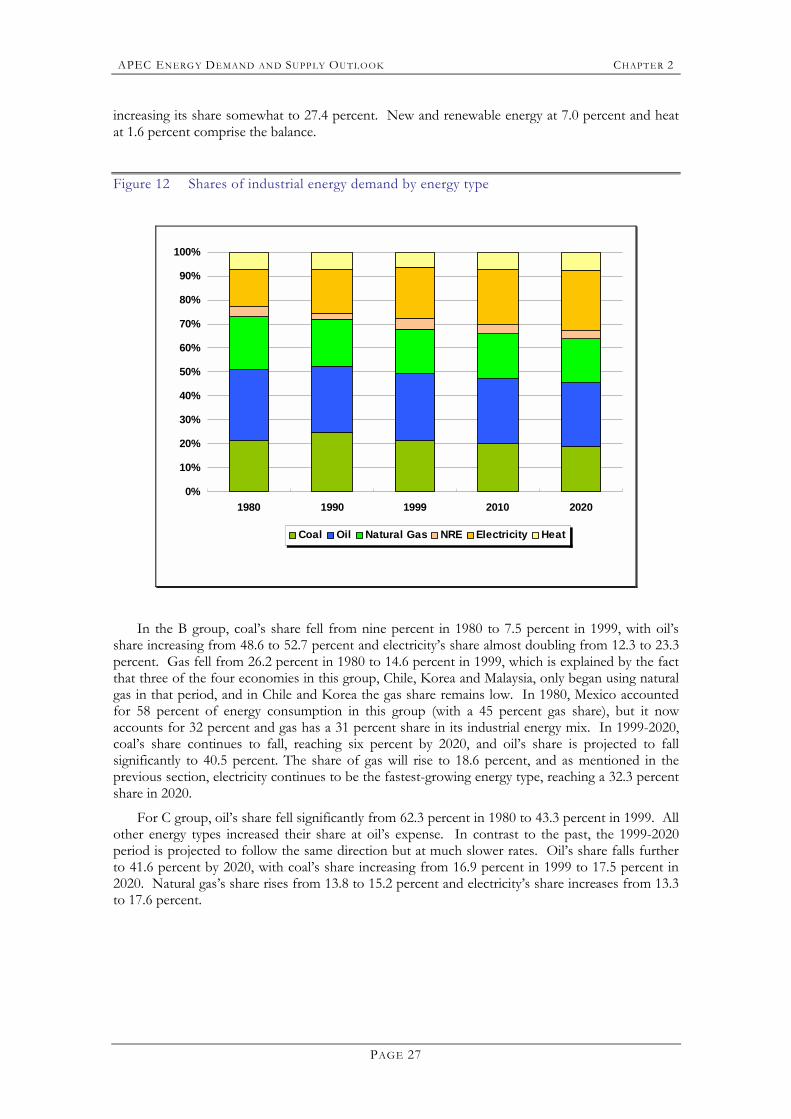
APEC ENERG Y DEMAND AN D SUPP LY OUTLOOK CHAPT ER 2
PAGE 27
increasing its share somewhat to 27.4 percent. New and renewable energy at 7.0 percent and heat at 1.6 percent comprise the balance.
Figure 12 Shares of industrial energy demand by energy type
0%
10%
20%
30%
40%
50%
60%
70%
80%
90%
100%
1980 1990 1999 2010 2020
Coal Oil Natural Gas NRE Electricity Heat
In the B group, coal�s share fell from nine percent in 1980 to 7.5 percent in 1999, with oil�s share increasing from 48.6 to 52.7 percent and electricity�s share almost doubling from 12.3 to 23.3 percent. Gas fell from 26.2 percent in 1980 to 14.6 percent in 1999, which is explained by the fact that three of the four economies in this group, Chile, Korea and Malaysia, only began using natural gas in that period, and in Chile and Korea the gas share remains low. In 1980, Mexico accounted for 58 percent of energy consumption in this group (with a 45 percent gas share), but it now accounts for 32 percent and gas has a 31 percent share in its industrial energy mix. In 1999-2020, coal�s share continues to fall, reaching six percent by 2020, and oil�s share is projected to fall significantly to 40.5 percent. The share of gas will rise to 18.6 percent, and as mentioned in the previous section, electricity continues to be the fastest-growing energy type, reaching a 32.3 percent share in 2020.
For C group, oil�s share fell significantly from 62.3 percent in 1980 to 43.3 percent in 1999. All other energy types increased their share at oil�s expense. In contrast to the past, the 1999-2020 period is projected to follow the same direction but at much slower rates. Oil�s share falls further to 41.6 percent by 2020, with coal�s share increasing from 16.9 percent in 1999 to 17.5 percent in 2020. Natural gas�s share rises from 13.8 to 15.2 percent and electricity�s share increases from 13.3 to 17.6 percent.
APEC ENERG Y DEMAND AN D SUPP LY OUTLOOK CHAPT ER 2
PAGE 28
TRANSPORT SECTOR
In 1999, APEC�s transport sector consumed 1,035 Mtoe, equivalent to nearly 60 percent of world transport energy demand and 15 percent of world total final energy demand. In that year, transport accounted for 28.5 percent of APEC�s final energy consumption, second after industry.
Transport is forecast to be the fastest-growing end-use sector in the APEC region, and will account for 72 percent of incremental oil demand during 1999-2020. Energy consumption is estimated to reach 1,824 Mtoe by 2020, an increase of 76.1 percent or 2.7 percent per annum over the 1999 level. This rate is slightly higher than in 1980-99, which reached 2.5 percent per annum on average (excluding Russia). Table 9 presents an overview of historical and forecast energy consumption in the transport sector, by income grouping and economy, over the period 1980-2020. Trends in energy consumption by income grouping over the same period are also illustrated in Figure 13. Though Group A will continue to account for the majority of APEC�s transport energy consumption during the forecast period, its share will fall from 75.7 percent to 65.4 percent. The biggest increase in share will be by Group C (including China and Russia), which will grow from 16.4 to 24.0 percent during the same period. Group B will also increase its share, albeit by a smaller amount, from 7.9 to 10.7 percent.
Oil products will continue to account for most of the energy consumed by the transport sector during the forecast period. Their share will fall slightly from 98.5 percent in 1999 to 98.4 percent in 2020. This is due to a rising trend of substituting oil products with alternative fuels such as natural gas and ethanol (used for blending with gasoline) due to environmental and energy security concerns, as well as an increase in the use of electricity in railroads and subways. Natural gas is expected to increase its share from 0.05 percent in 1999 to 0.29 percent by 2020. The share of electricity is forecast to fall from 0.74 to 0.65 percent during the same period. Coal is expected to have a negligible share by 2020, especially due to its phasing out in China during the first years of the forecast period.
Perhaps the biggest change expected in the transport sector, namely the replacement of the internal combustion engine by electric motors powered by hydrogen-fed fuel cells, does not show a significant effect in this Outlook. One of the reasons � according to major automakers � is that the commercial introduction of fuel cell vehicles on a large scale is not expected to begin until after 2010, so penetration rates by the end of the forecast period will still be low. Secondly, the investment needed to put in place a hydrogen supply infrastructure, especially in distribution, is of such a magnitude that it makes the large-scale introduction of these vehicles unfeasible in the short and medium term. Rather, alternatives such as using the existing gasoline distribution infrastructure, coupled with on-board reformer devices, which extract hydrogen needed for the fuel cells from gasoline, seem most likely during this period. As a consequence, during the forecast period vehicle efficiency improvements may not be as high as if hydrogen and not gasoline were pumped to the car, and oil products will continue to have a significant share in transport energy consumption.
Energy consumption in road transport is projected to increase at an annual rate of 2.5 percent during the forecast period, slightly below the average for the sector. Thus, its share of total transport energy consumption is expected to decrease from 81 percent in 1999 to 78 percent by 2020. Air transport is expected to account for this difference, as its share is forecast to increase from 13 to 16 percent during the period. Energy consumption in the air transport subsector is projected to increase at an annual rate of 3.5 percent. Marine transport is forecast to have the fastest growth rate among transport modes, at 4.2 percent per annum, reaching a three percent share in total transport energy consumption by 2020. This growth will take place mainly in Asia. Energy consumption in rail transport is expected to decline in 1999-2005, recovering after that, resulting in an average growth of 2.8 percent for the whole period. By 2020, rail will account for approximately three percent of transport energy consumption. Of incremental energy demand during the forecast period, road transport will account for 73.5 percent, air 18.9 percent, marine 4.3 percent and rail 3.3 percent.
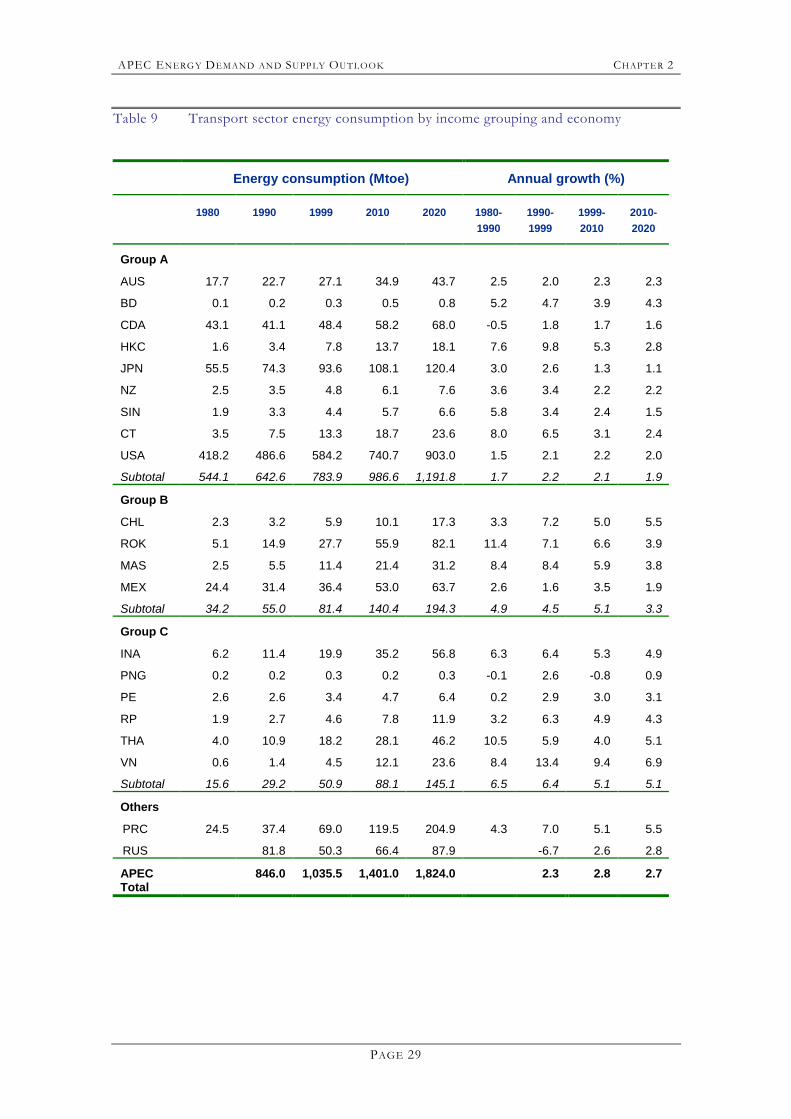
APEC ENERG Y DEMAND AN D SUPP LY OUTLOOK CHAPT ER 2
PAGE 29
Table 9 Transport sector energy consumption by income grouping and economy
Energy consumption (Mtoe) Annual growth (%)
1980 1990 1999 2010 2020 1980-1990
1990-1999
1999-2010
2010-2020
Group A
AUS 17.7 22.7 27.1 34.9 43.7 2.5 2.0 2.3 2.3
BD 0.1 0.2 0.3 0.5 0.8 5.2 4.7 3.9 4.3
CDA 43.1 41.1 48.4 58.2 68.0 -0.5 1.8 1.7 1.6
HKC 1.6 3.4 7.8 13.7 18.1 7.6 9.8 5.3 2.8
JPN 55.5 74.3 93.6 108.1 120.4 3.0 2.6 1.3 1.1
NZ 2.5 3.5 4.8 6.1 7.6 3.6 3.4 2.2 2.2
SIN 1.9 3.3 4.4 5.7 6.6 5.8 3.4 2.4 1.5
CT 3.5 7.5 13.3 18.7 23.6 8.0 6.5 3.1 2.4
USA 418.2 486.6 584.2 740.7 903.0 1.5 2.1 2.2 2.0
Subtotal 544.1 642.6 783.9 986.6 1,191.8 1.7 2.2 2.1 1.9
Group B
CHL 2.3 3.2 5.9 10.1 17.3 3.3 7.2 5.0 5.5
ROK 5.1 14.9 27.7 55.9 82.1 11.4 7.1 6.6 3.9
MAS 2.5 5.5 11.4 21.4 31.2 8.4 8.4 5.9 3.8
MEX 24.4 31.4 36.4 53.0 63.7 2.6 1.6 3.5 1.9
Subtotal 34.2 55.0 81.4 140.4 194.3 4.9 4.5 5.1 3.3
Group C
INA 6.2 11.4 19.9 35.2 56.8 6.3 6.4 5.3 4.9
PNG 0.2 0.2 0.3 0.2 0.3 -0.1 2.6 -0.8 0.9
PE 2.6 2.6 3.4 4.7 6.4 0.2 2.9 3.0 3.1
RP 1.9 2.7 4.6 7.8 11.9 3.2 6.3 4.9 4.3
THA 4.0 10.9 18.2 28.1 46.2 10.5 5.9 4.0 5.1
VN 0.6 1.4 4.5 12.1 23.6 8.4 13.4 9.4 6.9
Subtotal 15.6 29.2 50.9 88.1 145.1 6.5 6.4 5.1 5.1
Others
PRC 24.5 37.4 69.0 119.5 204.9 4.3 7.0 5.1 5.5
RUS 81.8 50.3 66.4 87.9 -6.7 2.6 2.8
APEC Total
846.0 1,035.5 1,401.0 1,824.0 2.3 2.8 2.7
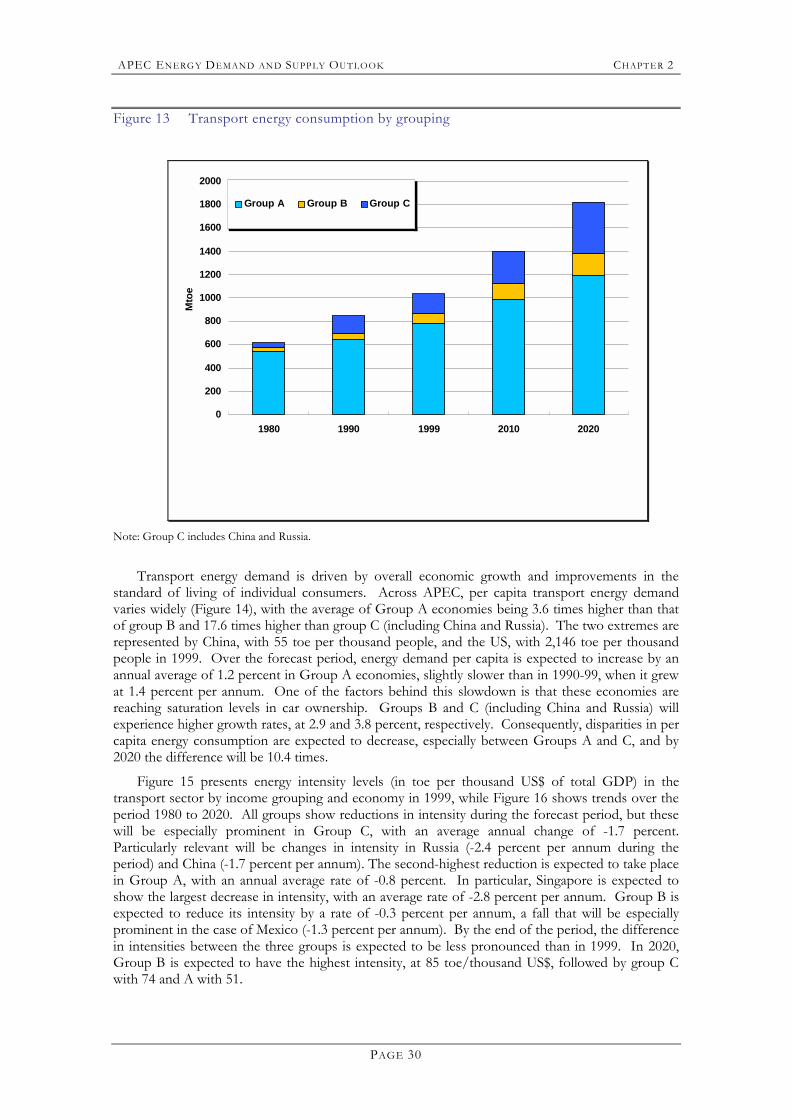
APEC ENERG Y DEMAND AN D SUPP LY OUTLOOK CHAPT ER 2
PAGE 30
Figure 13 Transport energy consumption by grouping
0
200
400
600
800
1000
1200
1400
1600
1800
2000
1980 1990 1999 2010 2020
Mto
eGroup A Group B Group C
Note: Group C includes China and Russia.
Transport energy demand is driven by overall economic growth and improvements in the standard of living of individual consumers. Across APEC, per capita transport energy demand varies widely (Figure 14), with the average of Group A economies being 3.6 times higher than that of group B and 17.6 times higher than group C (including China and Russia). The two extremes are represented by China, with 55 toe per thousand people, and the US, with 2,146 toe per thousand people in 1999. Over the forecast period, energy demand per capita is expected to increase by an annual average of 1.2 percent in Group A economies, slightly slower than in 1990-99, when it grew at 1.4 percent per annum. One of the factors behind this slowdown is that these economies are reaching saturation levels in car ownership. Groups B and C (including China and Russia) will experience higher growth rates, at 2.9 and 3.8 percent, respectively. Consequently, disparities in per capita energy consumption are expected to decrease, especially between Groups A and C, and by 2020 the difference will be 10.4 times.
Figure 15 presents energy intensity levels (in toe per thousand US$ of total GDP) in the transport sector by income grouping and economy in 1999, while Figure 16 shows trends over the period 1980 to 2020. All groups show reductions in intensity during the forecast period, but these will be especially prominent in Group C, with an average annual change of -1.7 percent. Particularly relevant will be changes in intensity in Russia (-2.4 percent per annum during the period) and China (-1.7 percent per annum). The second-highest reduction is expected to take place in Group A, with an annual average rate of -0.8 percent. In particular, Singapore is expected to show the largest decrease in intensity, with an average rate of -2.8 percent per annum. Group B is expected to reduce its intensity by a rate of -0.3 percent per annum, a fall that will be especially prominent in the case of Mexico (-1.3 percent per annum). By the end of the period, the difference in intensities between the three groups is expected to be less pronounced than in 1999. In 2020, Group B is expected to have the highest intensity, at 85 toe/thousand US$, followed by group C with 74 and A with 51.
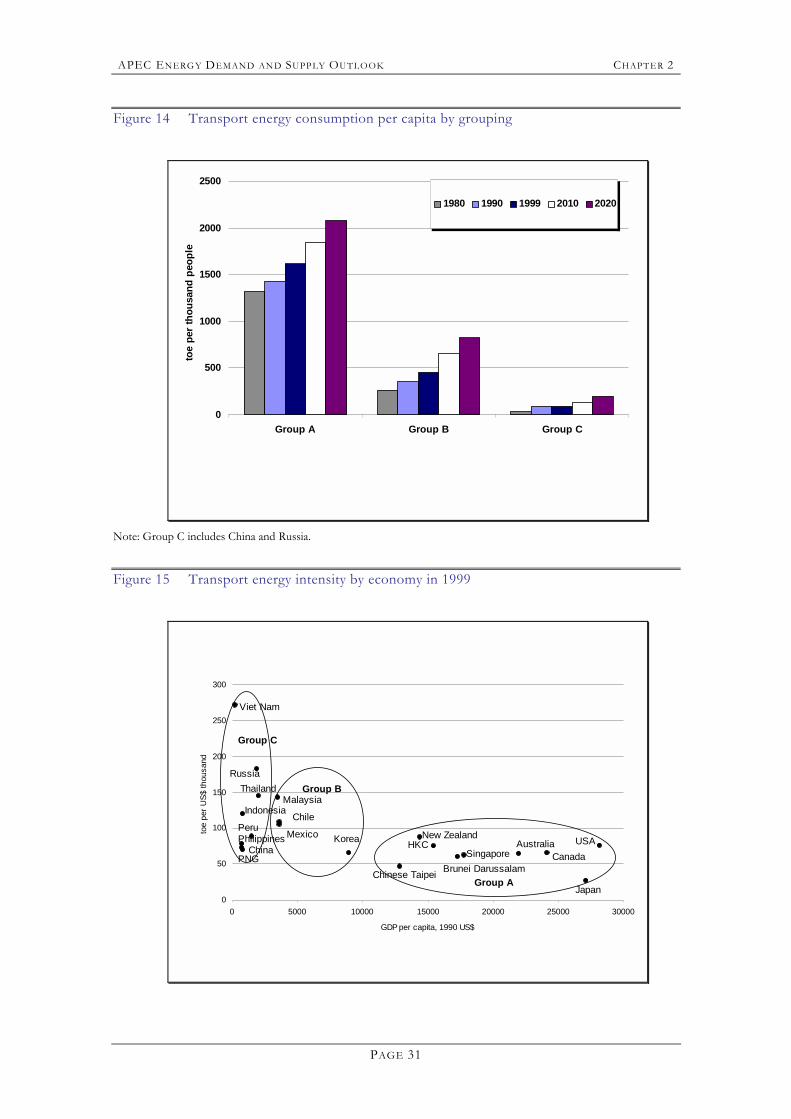
APEC ENERG Y DEMAND AN D SUPP LY OUTLOOK CHAPT ER 2
PAGE 31
Figure 14 Transport energy consumption per capita by grouping
0
500
1000
1500
2000
2500
Group A Group B Group C
toe
per t
hous
and
peop
le1980 1990 1999 2010 2020
Note: Group C includes China and Russia.
Figure 15 Transport energy intensity by economy in 1999
0
50
100
150
200
250
300
0 5000 10000 15000 20000 25000 30000
GDP per capita, 1990 US$
toe
per U
S$ th
ousa
nd
Viet Nam
ThailandRussia
MalaysiaIndonesia
Mexico
ChilePeruPhilippines
ChinaPNG
Korea
Chinese Taipei
New ZealandHKC USA
Japan
CanadaAustralia
Brunei DarussalamSingapore
Group A
Group B
Group C
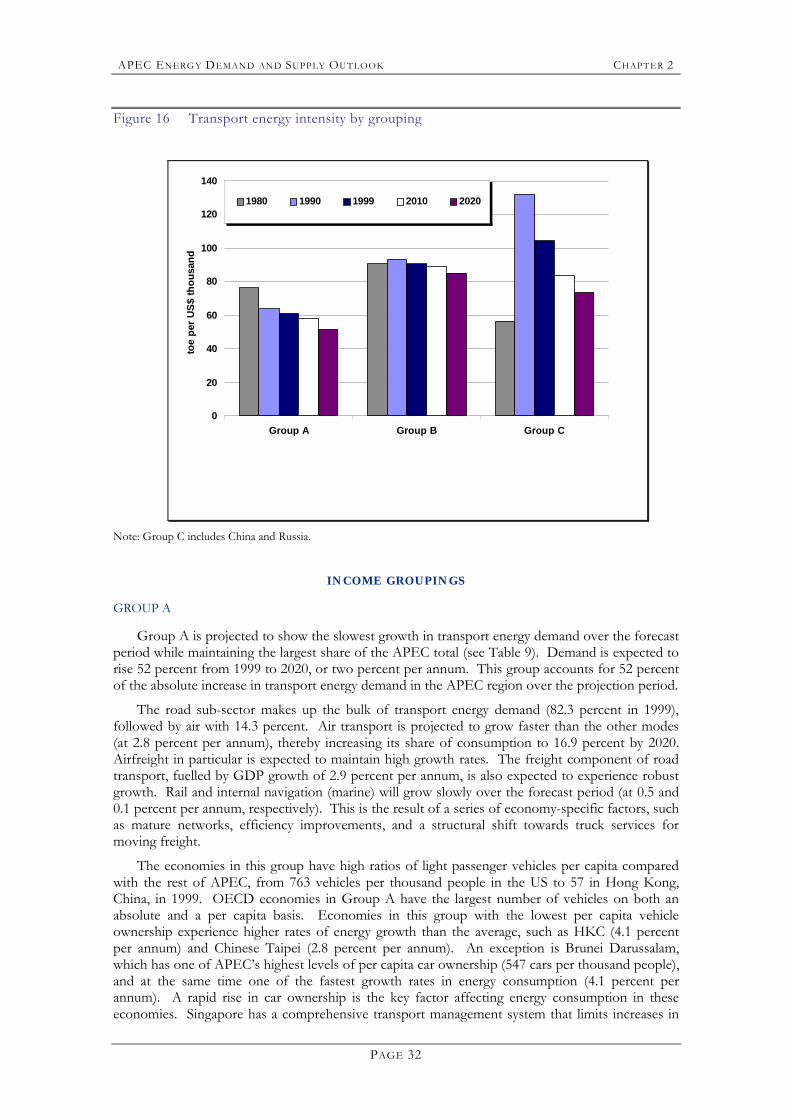
APEC ENERG Y DEMAND AN D SUPP LY OUTLOOK CHAPT ER 2
PAGE 32
Figure 16 Transport energy intensity by grouping
0
20
40
60
80
100
120
140
Group A Group B Group C
toe
per U
S$ th
ousa
nd1980 1990 1999 2010 2020
Note: Group C includes China and Russia.
INCOME GROUPINGS
GROUP A
Group A is projected to show the slowest growth in transport energy demand over the forecast period while maintaining the largest share of the APEC total (see Table 9). Demand is expected to rise 52 percent from 1999 to 2020, or two percent per annum. This group accounts for 52 percent of the absolute increase in transport energy demand in the APEC region over the projection period.
The road sub-sector makes up the bulk of transport energy demand (82.3 percent in 1999), followed by air with 14.3 percent. Air transport is projected to grow faster than the other modes (at 2.8 percent per annum), thereby increasing its share of consumption to 16.9 percent by 2020. Airfreight in particular is expected to maintain high growth rates. The freight component of road transport, fuelled by GDP growth of 2.9 percent per annum, is also expected to experience robust growth. Rail and internal navigation (marine) will grow slowly over the forecast period (at 0.5 and 0.1 percent per annum, respectively). This is the result of a series of economy-specific factors, such as mature networks, efficiency improvements, and a structural shift towards truck services for moving freight.
The economies in this group have high ratios of light passenger vehicles per capita compared with the rest of APEC, from 763 vehicles per thousand people in the US to 57 in Hong Kong, China, in 1999. OECD economies in Group A have the largest number of vehicles on both an absolute and a per capita basis. Economies in this group with the lowest per capita vehicle ownership experience higher rates of energy growth than the average, such as HKC (4.1 percent per annum) and Chinese Taipei (2.8 percent per annum). An exception is Brunei Darussalam, which has one of APEC�s highest levels of per capita car ownership (547 cars per thousand people), and at the same time one of the fastest growth rates in energy consumption (4.1 percent per annum). A rapid rise in car ownership is the key factor affecting energy consumption in these economies. Singapore has a comprehensive transport management system that limits increases in
APEC ENERG Y DEMAND AN D SUPP LY OUTLOOK CHAPT ER 2
PAGE 33
the number of vehicles to three percent per annum and requires residents to bid for permission to own a car. This programme has been very effective and is expected to severely dampen Singapore�s energy demand growth for transport (1.9 percent per annum) over the forecast period.
In OECD economies in Group A, rising per capita vehicle ownership is also a factor behind transport energy consumption growth to 2010, but other issues come into play. In the 1990s, in Australia, Canada, New Zealand and the United States, consumers indulged a penchant for bigger, more powerful vehicles. So despite advances in technology, there has been little progress in improving fuel economy for light passenger vehicles. Since the 1990s, many consumers have opted for vehicles such as minivans and sport utility vehicles/all terrain wagons instead of cars. Given that these vehicles consume more fuel and that it takes about a decade for current trends in sales to be fully reflected in the composition of the passenger vehicle stock, there should be strong upward pressure on energy consumption for road transport in these economies to 2010. In Japan, however, except for increases in car ownership, most factors point to lower growth in energy consumption than in the previous decade � about 1.2 percent growth per annum to 2020, compared with 2.6 percent in 1990-99. The popularity of inexpensive light cars (with 660 cc engines), a declining population after 2007, the ageing of the population (older drivers tend to drive less) and stricter fuel economy standards for new vehicles after 2005, will all contribute to slower growth in energy consumption.
Advanced technology vehicles, particularly hybrid-electric and fuel cell vehicles, are expected to moderate energy consumption demand in Group A economies, especially after 2010. Steady uptake of hybrids is expected in Japan, Singapore and the United States due to a combination of regulations (such as California�s zero-emission programme and Japan�s higher fuel efficiency standards on new cars) and tax incentives. But any reductions in growth of energy consumption are expected to be modest compared with what they might be if more hybrids and fuel cell vehicles were in use. Such vehicles are expected to account for only a small percentage of the total by the end of the forecast period. Their penetration rates in the US could increase significantly, however, if fuel prices rose.
To fight pollution and traffic congestion, which are major problems particularly in Asia, economies such as HKC, Singapore and Chinese Taipei are encouraging the use of LPG and natural gas for fleet vehicles such as taxis and buses, as well as investing in public transport infrastructure such as rail and subway systems. Despite efforts to promote alternative fuels through mandatory and incentive-based measures, however, the picture changes very little over the forecast period. Oil share in Group A is expected to decline slightly, from 99.4 percent in 1999 to 98.6 percent in 2020. Though natural gas and electricity use increase, the only fuel that makes noticeable inroads is ethanol, with its share rising from 0.2 percent in 1999 to 1.0 percent in 2020. Ethanol use for mixing with gasoline is expected to grow quickly in the US due to bans on MTBE (methyl tertiary-butyl ether) in some states and a proposed renewable fuels standard; and in Australia due to incentive programmes and subsidies to promote ethanol production.
Reduction of greenhouse gases (GHG) and energy security are also issues for economies in this group. While transport energy consumption growth rates of Group A economies are much lower than those of groups B and C, they are still higher than those of the rest of their demand sectors. In fact, while other demand sectors have shown considerable advances in efficiency, improvements in fuel economy and the energy efficiency of cars has been offset by consumers� demands for vehicles with enhanced size and power. The outlook shows that oil products will continue to account for almost all of the energy consumed in the transport sector. The two major implications of this for Group A economies are: 1) the transport sector represents the main source of incremental GHG emissions, so for those economies that have ratified the Kyoto Protocol (currently only Japan in APEC) or plan to do so (such as New Zealand), this sector will pose a major challenge in their compliance efforts; and 2) for oil importing economies, growth in transport energy consumption is directly linked to energy dependency and energy security issues.
APEC ENERG Y DEMAND AN D SUPP LY OUTLOOK CHAPT ER 2
PAGE 34
GROUP B
Energy consumption in the transport sector of Group B economies is forecast to grow at an average annual rate of 4.2 percent during 1999-2020, reaching 194.3 Mtoe. This group accounts for 14 percent of APEC�s incremental growth in transport energy demand. Korea is expected to account for nearly half of this amount, exhibiting the fastest growth in this group, at 5.3 percent per annum on average. Chile is also expected to grow at 5.3 percent per annum, while Malaysia will grow at 4.9 percent per annum. These three economies will experience lower growth during the forecast period as compared to the average during 1990-99. Mexico�s transport sector is expected to grow the slowest, at 2.7 percent per year. In contrast with the other economies of this group, this rate is higher than in 1990-99, when it reached 1.6 percent per annum.
The air and marine sub-sectors are expected to grow the fastest, at 5.5 and 5.4 percent per annum, respectively. The road sub-sector is forecast to grow more slowly, at 4.0 percent per annum, thus decreasing its share in the total transport energy consumption of this group from 84 to 80 percent during the forecast period. Energy consumption in rail is expected to grow the least, both in absolute and in relative terms, at an annual rate of 1.5 percent on average. In all sub-sectors, higher growth rates are expected for the first half of the forecast period.
Growth in income is expected to drive a rise in car ownership levels, one of the main factors explaining the above growth figures. Incomes in this group (approximately US$3,590-8,960 in 1999) are in a range which equates with rapidly increasing levels of car ownership. Commuters who previously used public transport can now afford to buy a car, and those with higher incomes can buy a second car. Car ownership in this group is in the range of 100 to 170 cars per thousand people. During 1990-99, Korea experienced the fastest growth rate in this indicator, at 15 percent per annum. Chile and Malaysia also had high growth of six percent per annum, while Mexico showed the slowest growth of two percent per annum. During the forecast period, this indicator is expected to grow more slowly than the above figures, especially for Korea.
Rapidly increasing vehicle stocks in these economies have resulted in serious traffic congestion and air pollution problems, not only in the capital cities such as Mexico City and Santiago de Chile, but also in other urban centres. Measures taken to tackle this include restricting use of cars on certain days, making catalytic converters mandatory while phasing out leaded gasoline, more stringent emissions requirements, traffic management, and extensions of subway lines. The use of CNG (compressed natural gas) and LPG or liquefied petroleum gas (propane) in vehicles has also been encouraged, but these still have a low penetration. In spite of this, current congestion and pollution levels are considered far from acceptable, and as energy consumption is forecast to increase 2.3 times by 2020, these challenges will continue to influence policies in the sub-sector.
The four economies in this group are forecast to have strong growth in air transport, ranging from 4.5 percent per annum for Mexico to 6.8 percent for Chile. Important drivers behind this growth are rising incomes, tourism and trade. Korea, for example, plans to increase its role as a major air transport hub in Asia.
Korea, which is expected to account for virtually all of the increase in marine energy consumption of this group, is heavily dependent on overseas raw materials and export markets, so this sub-sector will continue to play a crucial role in this economy�s development.
Rail freight in Chile and Mexico is expected to maintain and consolidate the revival experienced after privatisation during the 1990s. Passenger travel on ordinary railways may continue to decline, though for subways an important expansion is expected. In Korea, passenger travel by rail will experience a boost with the new Korea Train eXpress (KTX), a high-speed train that will connect Seoul with Pusan starting in 2004.
GROUP C
Energy consumption in Group C is expected to reach 145.1 Mtoe by 2020, nearly tripling during the forecast period. Its growth rate of 5.1 percent per annum is the fastest among the three
APEC ENERG Y DEMAND AN D SUPP LY OUTLOOK CHAPT ER 2
PAGE 35
groups. This group accounts for nearly 12 percent of incremental transport energy demand in the APEC region over the projection period; most of this increment will be in Indonesia, Thailand and Viet Nam. Viet Nam is forecast to have the fastest growth rate in transport energy consumption of any APEC economy, at 8.2 percent per annum.
The rail sub-sector is forecast to grow at the fastest rate (5.4 percent per annum), followed by marine (5.2 percent). By 2020 however, their share in this group�s total transport energy consumption will continue to be the lowest among transport modes, rail at 0.2 percent and marine at 4.8 percent. Road transport is forecast to grow at an annual rate of 5.1 percent, maintaining its share in this group�s transport energy consumption at 86 percent. This sub-sector will account for 84 percent of the incremental transport energy demand of Group C economies. Air transport is expected to grow at 4.8 percent per annum, maintaining a share of about nine percent of total transport consumption during the forecast period.
Several factors help explain the high growth potential in energy consumption of this group. Car ownership levels are among the lowest in APEC. Most personal travel is by public transport, but many journeys are by bicycle or on foot. Mopeds and other motorised two-wheelers are also common. As incomes rise, people who previously walked or went by bicycle can afford to use public transport or mopeds. Further rises in income enable them to acquire automobiles. Each of these transitions entails significant increases in per capita transport energy consumption. Migrations from rural areas or small towns � where daily journeys are comparatively short and a high percentage do not use motorised transport � to large urban centres � where the opposite is usually the norm � can also play a role in increasing energy consumption levels. Infrastructure development in roads, railways, airports and maritime ports is also relevant, permitting latent transport demand to materialise. Though the situation varies among these economies, many are starting from a low service base, and plan significant expansions during the forecast period. This responds to high GDP growth rates, which translate into increased movement of goods and people.
Reduction of congestion and air pollution levels while facing increasing demand for transport will continue to be major challenges for these economies, especially considering the high growth potential in car ownership levels. The significant investment in infrastructure required to support high growth in energy consumption will likely be another major issue for these economies.
Many of the cities in Group C economies, such as Bangkok and Jakarta, already face unacceptable levels of congestion and air pollution. Among measures being implemented to improve this situation are alternative-fuelled vehicles using LPG or CNG, the phasing out of leaded gasoline, reduction of fuel subsidies and transport management.
CHINA
China will probably move to centre stage of the transport sector in APEC, given its size, growth rate and changes that are forecast during the outlook period.
Energy consumption in China�s transport sector is expected to reach 205 Mtoe by 2020, nearly tripling during the forecast period. This is equivalent to an annual average growth rate of 5.3 percent, the second-highest among APEC economies after Viet Nam. At this rate, it is expected that China will surpass Japan by 2008 to become APEC�s second-largest transport energy consumer. In the forecast period, China�s share in APEC transport energy demand is expected to rise from 6.7 percent in 1999 to 11.2 percent by 2020. Energy consumption in road transport, which is forecast to grow at an average annual rate of 4.9 percent, will account for 55 percent of the incremental demand in China�s transport sector. Air transport energy consumption is forecast to have the fastest growth rate among transport modes, with an average of 7.8 percent per annum for the period. Growth in marine transport is also expected to be high, at 6.8 percent per annum. Rail transport will show the slowest growth rate at 4.7 percent per annum. During the forecast period, the share of road transport in transport energy consumption is expected to fall to 58 from 63
APEC ENERG Y DEMAND AN D SUPP LY OUTLOOK CHAPT ER 2
PAGE 36
percent and rail will decrease to 18 from 20 percent. But the share of marine transport will rise to 12 from nine percent, and air transport will increase to 12 from seven percent.
Several factors are expected to shape China�s transport sector during the forecast period. Car ownership is seen rising substantially from its level in 1999 of about 10 cars per thousand people, one of the lowest in APEC, though public transport will continue to be dominant. China�s car market is expected to become one of the world�s largest and fastest-growing. Rising personal incomes will be one of the main drivers behind this increase. In addition, greater competition in the automobile industry, following China�s entry into the World Trade Organisation (WTO), is expected to lower car prices, increase model availability and expand financing options. The increase in car stocks will pose a serious challenge in terms of air pollution, traffic congestion and accidents, as well as the investment requirements in road and fuel supply infrastructure.
China�s increasing participation in world commerce, as well as rising incomes, will be important drivers behind the increase in marine, road freight and air transport energy consumption. China�s airports could become major hubs in Asia.
Environmental protection will be the main driver behind the increase in the number of alternative-fuelled vehicles, especially compressed natural gas buses and taxis in the main cities. Other measures such as regulations for emissions and fuel quality will likely shape the composition and characteristics of the gasoline and diesel vehicle stock, as well as influencing refinery infrastructure and processes.
In the rail sector, China will score a world first by putting a magnetic levitation (maglev) train into commercial service, between the city of Shanghai and its airport. It is due to begin operations in 2003. There are plans to use the same technology to connect Beijing and Shanghai.
RUSSIA
As with Russia�s other end-use sectors, transport energy consumption declined from 1992 to 1997. However, for the forecast period it is expected to rise at an average rate of 2.7 percent per annum, reaching 87.9 Mtoe by 2020. This rate is similar to the average growth rate of APEC�s total transport energy consumption for the period, and thus Russia will maintain a share of approximately 4.8 percent in the total. During the forecast period, Russia is expected to remain APEC�s fourth-largest transport energy consumer, after the US, China and Japan.
Air transport is forecast to be Russia�s fastest-growing transport sub-sector, at 5.2 percent per annum, accounting for nearly 45 percent of incremental transport demand. Its share in transport demand is expected to rise from 17.7 percent in 1999 to 29.5 percent by 2020. Marine transport will be the second-fastest at 3.4 percent per annum, though its share in total consumption will remain low at 2.3 percent by 2020. Road transport energy consumption is forecast to rise at an annual rate of 2.0 percent and account for 48 percent of incremental transport energy demand during the forecast period. Rail is forecast to grow at 1.5 percent per annum, reducing its share of total transport consumption from 8.5 percent in 1999 to 6.7 percent by 2020.
Natural gas consumption could see a reversal in the declining trend it has experienced since 1992, and be the fastest-growing fuel during the forecast period. There are plans to triple the number of natural gas vehicles by the end of this decade, as well as to construct corridors and natural gas filling stations as part of the Blue Corridor Project, linking Russia with other European countries. This project has received support from Gazprom, Russian government ministries, the United Nations and several other organisations. Another project, formed by a consortium of Russian, Polish and US companies, plans to boost Russia�s alternative fuel vehicle infrastructure (CNG and LPG), with the aim of reducing air pollution.
By 2020, transport intensity (in toe/US$ of GDP) is expected to be 60 percent of the level in 1999. One of the main policy tools being considered is an increase in energy prices. In particular, by 2010 electricity is forecast to cost more than three times what it does now.

APEC ENERG Y DEMAND AN D SUPP LY OUTLOOK CHAPT ER 2
PAGE 37
RESIDENTIAL AND COMMERCIAL SECTOR
Energy demand in the residential and commercial sector (ResCom) is mainly determined by the level of income (economic growth). Figure 17 shows the trend of energy demand per capita in relation to per capita GDP growth by income groups. As the figure shows, energy demand per capita is expected to rise along with income growth. There is a wide range of growth, however, in terms of per capita energy demand. Higher-income group economies that belong to Group A are expected to show moderate growth of 1.4 percent per year (1999-2020), since their level of energy demand in ResCom is already nearing saturation point. In contrast, Group B and C economies are expected to experience faster growth of 2.6 and 1.9 percent per year, respectively (1999-2020).
Figure 17 Residential and commercial sector energy demand per capita by income group (1992 �2020)
0.0
0.2
0.4
0.6
0.8
1.0
1.2
1.4
1.6
1.8
0 5000 10000 15000 20000 25000 30000 35000 40000 45000
toe
per c
apita
Group A Group B Group C China Russia APEC
GDP per capita (1990 US$)
Group A
Group B
APEC
Russia
China
Group C
Climate is another important factor that affects energy demand in the ResCom sector and explains, for example, why Russia and Canada have significantly higher per capita energy consumption than other economies. The degree of urbanisation also plays an important role, especially for Group C economies. Figure 18 shows the history and projection of urban population and ResCom energy demand for selected APEC economies in groups B and C.11
11 Chile, China, Indonesia, Malaysia, Mexico, Papua New Guinea, Peru, the Philippines, Thailand, and Viet Nam
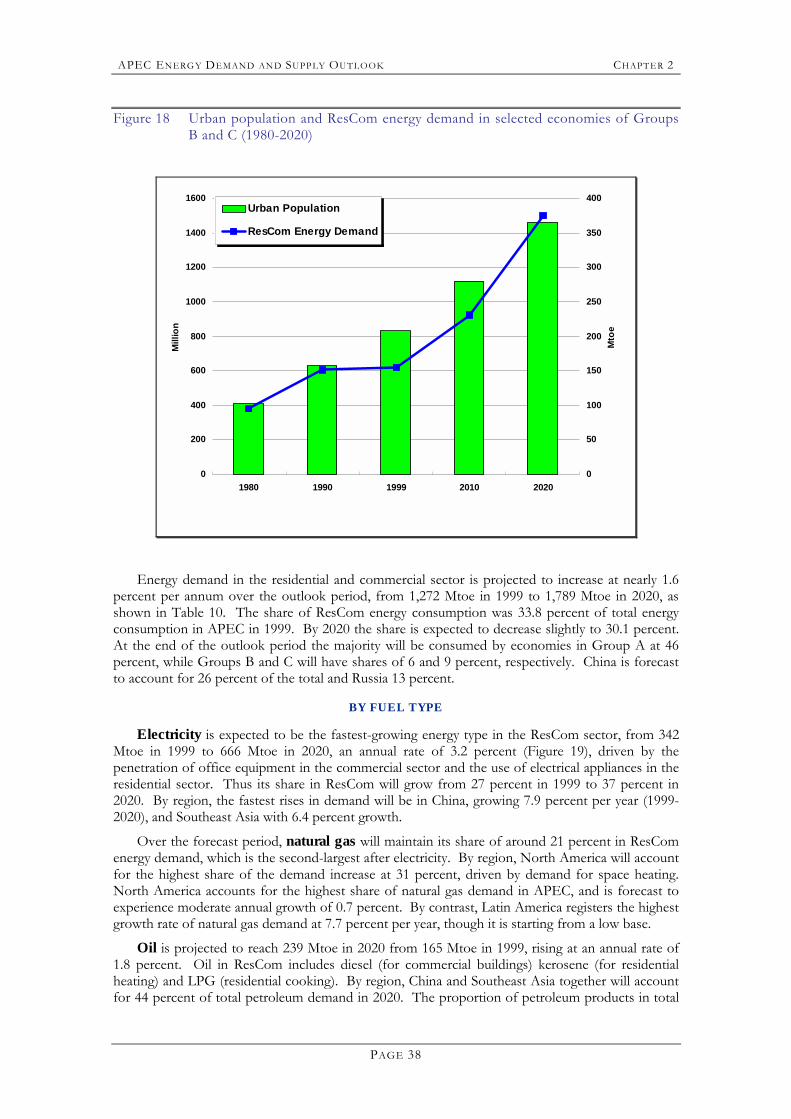
APEC ENERG Y DEMAND AN D SUPP LY OUTLOOK CHAPT ER 2
PAGE 38
Figure 18 Urban population and ResCom energy demand in selected economies of Groups B and C (1980-2020)
0
200
400
600
800
1000
1200
1400
1600
1980 1990 1999 2010 2020
Mill
ion
0
50
100
150
200
250
300
350
400
Mto
e
Urban Population
ResCom Energy Demand
Energy demand in the residential and commercial sector is projected to increase at nearly 1.6 percent per annum over the outlook period, from 1,272 Mtoe in 1999 to 1,789 Mtoe in 2020, as shown in Table 10. The share of ResCom energy consumption was 33.8 percent of total energy consumption in APEC in 1999. By 2020 the share is expected to decrease slightly to 30.1 percent. At the end of the outlook period the majority will be consumed by economies in Group A at 46 percent, while Groups B and C will have shares of 6 and 9 percent, respectively. China is forecast to account for 26 percent of the total and Russia 13 percent.
BY FUEL TYPE
Electricity is expected to be the fastest-growing energy type in the ResCom sector, from 342 Mtoe in 1999 to 666 Mtoe in 2020, an annual rate of 3.2 percent (Figure 19), driven by the penetration of office equipment in the commercial sector and the use of electrical appliances in the residential sector. Thus its share in ResCom will grow from 27 percent in 1999 to 37 percent in 2020. By region, the fastest rises in demand will be in China, growing 7.9 percent per year (1999-2020), and Southeast Asia with 6.4 percent growth.
Over the forecast period, natural gas will maintain its share of around 21 percent in ResCom energy demand, which is the second-largest after electricity. By region, North America will account for the highest share of the demand increase at 31 percent, driven by demand for space heating. North America accounts for the highest share of natural gas demand in APEC, and is forecast to experience moderate annual growth of 0.7 percent. By contrast, Latin America registers the highest growth rate of natural gas demand at 7.7 percent per year, though it is starting from a low base.
Oil is projected to reach 239 Mtoe in 2020 from 165 Mtoe in 1999, rising at an annual rate of 1.8 percent. Oil in ResCom includes diesel (for commercial buildings) kerosene (for residential heating) and LPG (residential cooking). By region, China and Southeast Asia together will account for 44 percent of total petroleum demand in 2020. The proportion of petroleum products in total
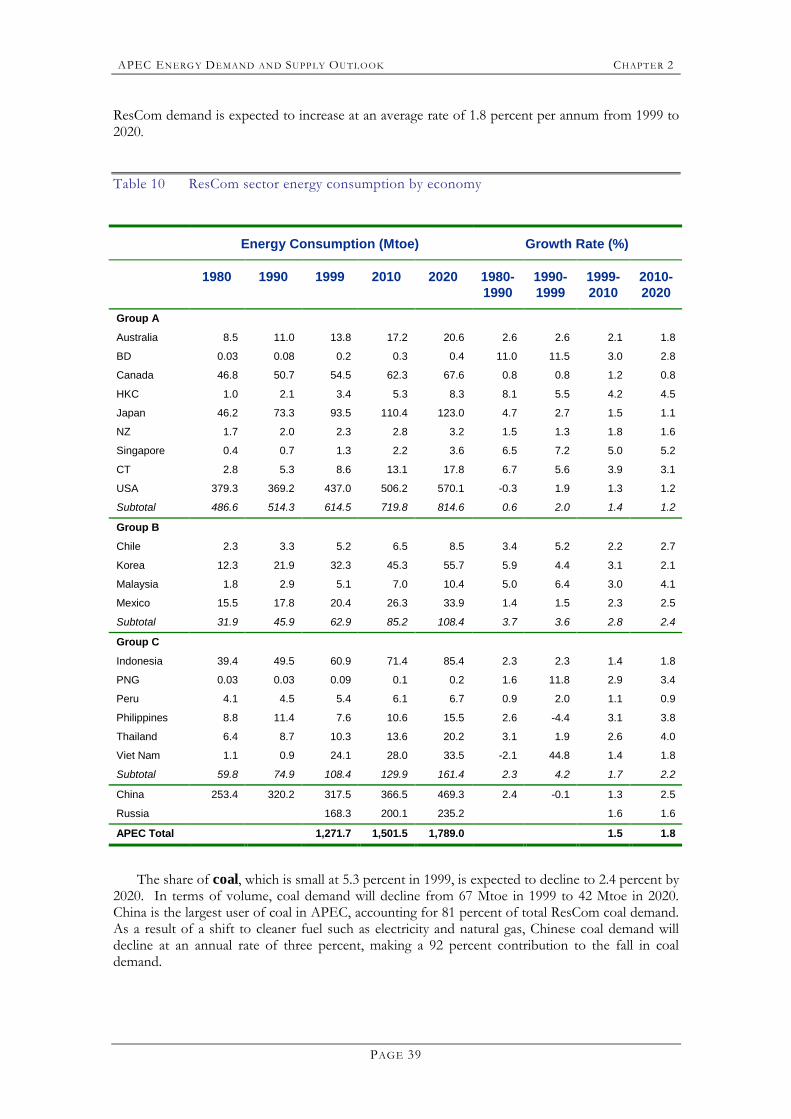
APEC ENERG Y DEMAND AN D SUPP LY OUTLOOK CHAPT ER 2
PAGE 39
ResCom demand is expected to increase at an average rate of 1.8 percent per annum from 1999 to 2020.
Table 10 ResCom sector energy consumption by economy
Energy Consumption (Mtoe) Growth Rate (%)
1980 1990 1999 2010 2020 1980-1990
1990-1999
1999-2010
2010-2020
Group A
Australia 8.5 11.0 13.8 17.2 20.6 2.6 2.6 2.1 1.8
BD 0.03 0.08 0.2 0.3 0.4 11.0 11.5 3.0 2.8
Canada 46.8 50.7 54.5 62.3 67.6 0.8 0.8 1.2 0.8
HKC 1.0 2.1 3.4 5.3 8.3 8.1 5.5 4.2 4.5
Japan 46.2 73.3 93.5 110.4 123.0 4.7 2.7 1.5 1.1
NZ 1.7 2.0 2.3 2.8 3.2 1.5 1.3 1.8 1.6
Singapore 0.4 0.7 1.3 2.2 3.6 6.5 7.2 5.0 5.2
CT 2.8 5.3 8.6 13.1 17.8 6.7 5.6 3.9 3.1
USA 379.3 369.2 437.0 506.2 570.1 -0.3 1.9 1.3 1.2
Subtotal 486.6 514.3 614.5 719.8 814.6 0.6 2.0 1.4 1.2
Group B
Chile 2.3 3.3 5.2 6.5 8.5 3.4 5.2 2.2 2.7
Korea 12.3 21.9 32.3 45.3 55.7 5.9 4.4 3.1 2.1
Malaysia 1.8 2.9 5.1 7.0 10.4 5.0 6.4 3.0 4.1
Mexico 15.5 17.8 20.4 26.3 33.9 1.4 1.5 2.3 2.5
Subtotal 31.9 45.9 62.9 85.2 108.4 3.7 3.6 2.8 2.4
Group C
Indonesia 39.4 49.5 60.9 71.4 85.4 2.3 2.3 1.4 1.8
PNG 0.03 0.03 0.09 0.1 0.2 1.6 11.8 2.9 3.4
Peru 4.1 4.5 5.4 6.1 6.7 0.9 2.0 1.1 0.9
Philippines 8.8 11.4 7.6 10.6 15.5 2.6 -4.4 3.1 3.8
Thailand 6.4 8.7 10.3 13.6 20.2 3.1 1.9 2.6 4.0
Viet Nam 1.1 0.9 24.1 28.0 33.5 -2.1 44.8 1.4 1.8
Subtotal 59.8 74.9 108.4 129.9 161.4 2.3 4.2 1.7 2.2
China 253.4 320.2 317.5 366.5 469.3 2.4 -0.1 1.3 2.5
Russia 168.3 200.1 235.2 1.6 1.6
APEC Total 1,271.7 1,501.5 1,789.0 1.5 1.8
The share of coal, which is small at 5.3 percent in 1999, is expected to decline to 2.4 percent by 2020. In terms of volume, coal demand will decline from 67 Mtoe in 1999 to 42 Mtoe in 2020. China is the largest user of coal in APEC, accounting for 81 percent of total ResCom coal demand. As a result of a shift to cleaner fuel such as electricity and natural gas, Chinese coal demand will decline at an annual rate of three percent, making a 92 percent contribution to the fall in coal demand.
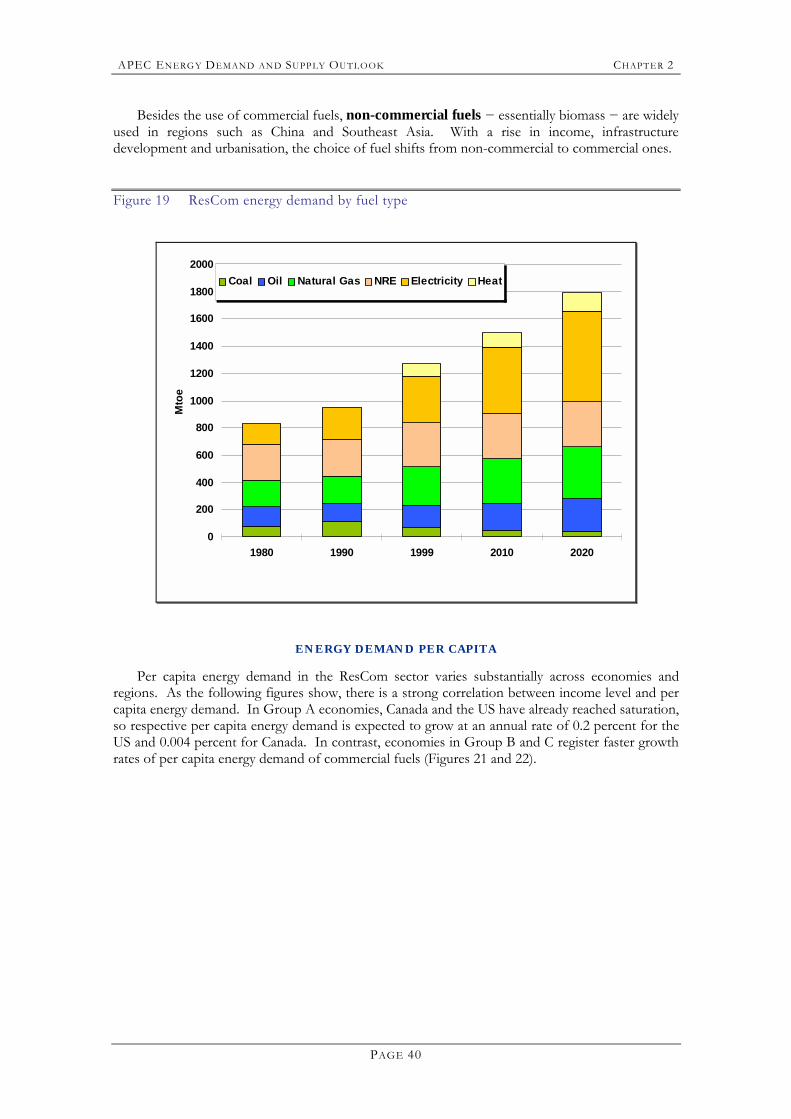
APEC ENERG Y DEMAND AN D SUPP LY OUTLOOK CHAPT ER 2
PAGE 40
Besides the use of commercial fuels, non-commercial fuels − essentially biomass − are widely used in regions such as China and Southeast Asia. With a rise in income, infrastructure development and urbanisation, the choice of fuel shifts from non-commercial to commercial ones.
Figure 19 ResCom energy demand by fuel type
0
200
400
600
800
1000
1200
1400
1600
1800
2000
1980 1990 1999 2010 2020
Mto
e
Coal Oil Natural Gas NRE Electricity Heat
ENERGY DEMAND PER CAPITA
Per capita energy demand in the ResCom sector varies substantially across economies and regions. As the following figures show, there is a strong correlation between income level and per capita energy demand. In Group A economies, Canada and the US have already reached saturation, so respective per capita energy demand is expected to grow at an annual rate of 0.2 percent for the US and 0.004 percent for Canada. In contrast, economies in Group B and C register faster growth rates of per capita energy demand of commercial fuels (Figures 21 and 22).
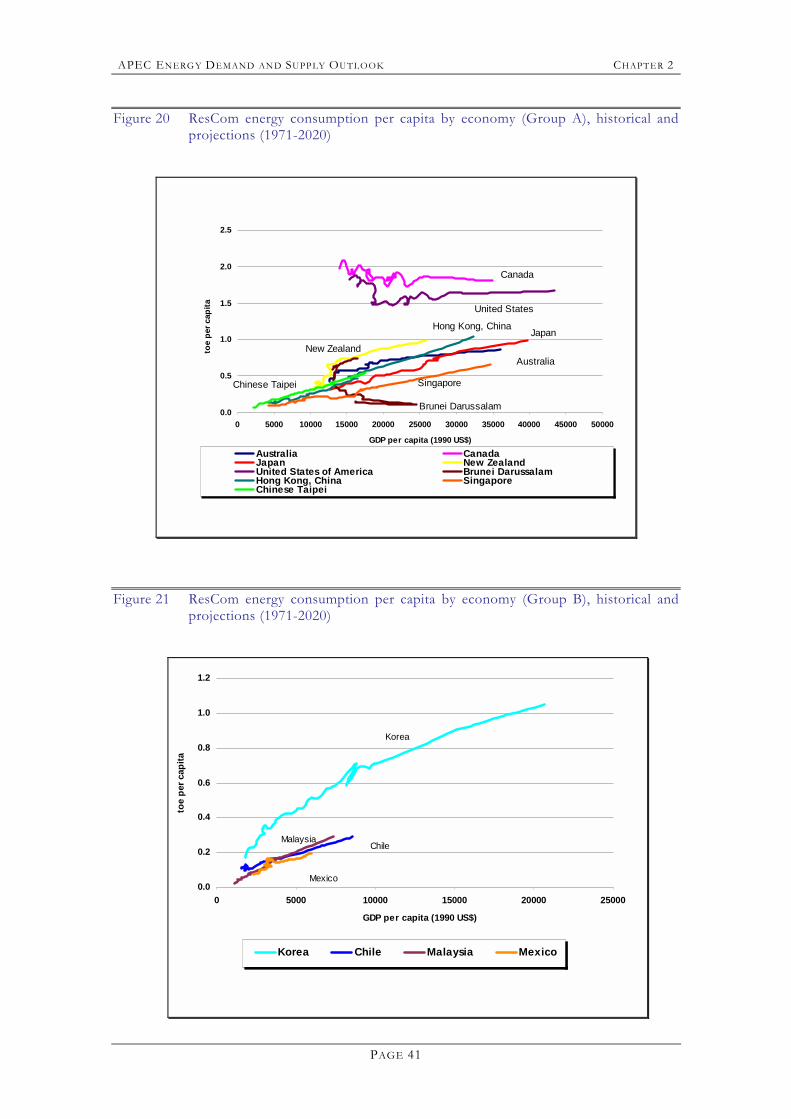
APEC ENERG Y DEMAND AN D SUPP LY OUTLOOK CHAPT ER 2
PAGE 41
Figure 20 ResCom energy consumption per capita by economy (Group A), historical and projections (1971-2020)
0.0
0.5
1.0
1.5
2.0
2.5
0 5000 10000 15000 20000 25000 30000 35000 40000 45000 50000
GDP per capita (1990 US$)
toe
per c
apita
Australia CanadaJapan New ZealandUnited States of America Brunei DarussalamHong Kong, China SingaporeChinese Taipei
Singapore
Australia
JapanHong Kong, China
New Zealand
Chinese Taipei
Canada
United States
Brunei Darussalam
Figure 21 ResCom energy consumption per capita by economy (Group B), historical and projections (1971-2020)
0.0
0.2
0.4
0.6
0.8
1.0
1.2
0 5000 10000 15000 20000 25000
GDP per capita (1990 US$)
toe
per c
apita
Korea Chile Malaysia Mexico
ChileMalaysia
Korea
Mexico
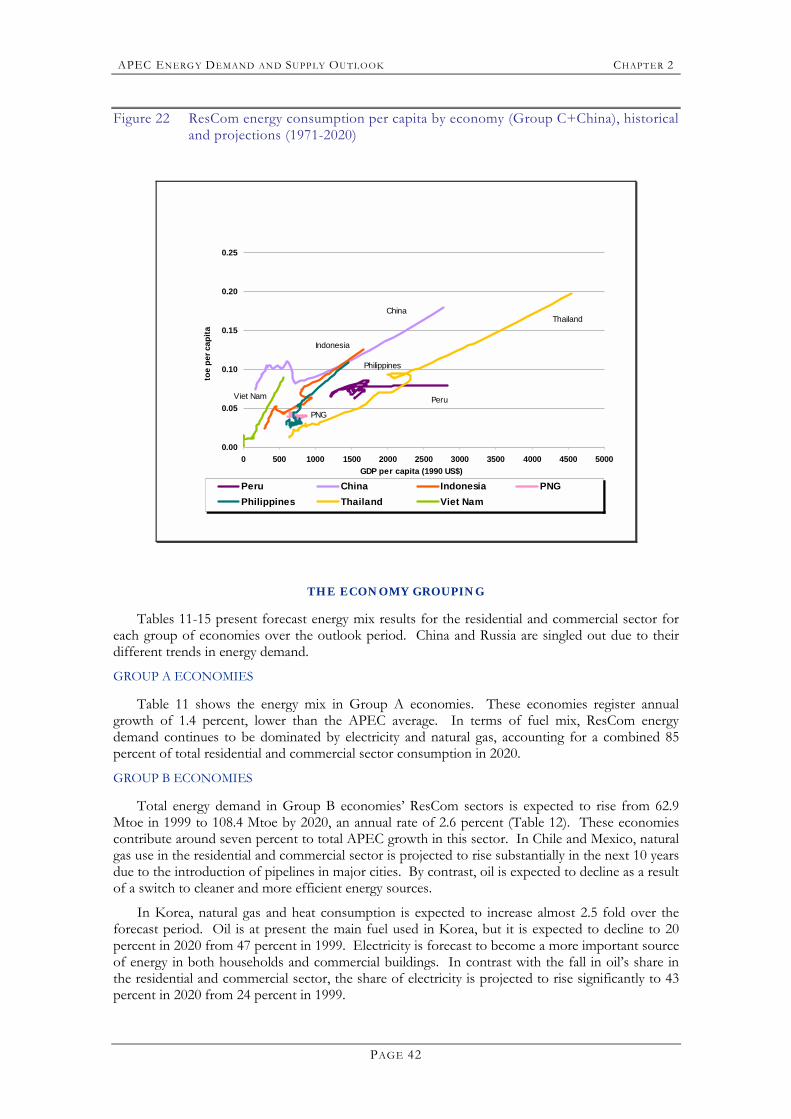
APEC ENERG Y DEMAND AN D SUPP LY OUTLOOK CHAPT ER 2
PAGE 42
Figure 22 ResCom energy consumption per capita by economy (Group C+China), historical and projections (1971-2020)
0.00
0.05
0.10
0.15
0.20
0.25
0 500 1000 1500 2000 2500 3000 3500 4000 4500 5000GDP per capita (1990 US$)
toe
per c
apita
Peru China Indonesia PNGPhilippines Thailand Viet Nam
ThailandChina
Philippines
Viet Nam
Indonesia
Peru
PNG
THE ECONOMY GROUPING
Tables 11-15 present forecast energy mix results for the residential and commercial sector for each group of economies over the outlook period. China and Russia are singled out due to their different trends in energy demand.
GROUP A ECONOMIES
Table 11 shows the energy mix in Group A economies. These economies register annual growth of 1.4 percent, lower than the APEC average. In terms of fuel mix, ResCom energy demand continues to be dominated by electricity and natural gas, accounting for a combined 85 percent of total residential and commercial sector consumption in 2020.
GROUP B ECONOMIES
Total energy demand in Group B economies� ResCom sectors is expected to rise from 62.9 Mtoe in 1999 to 108.4 Mtoe by 2020, an annual rate of 2.6 percent (Table 12). These economies contribute around seven percent to total APEC growth in this sector. In Chile and Mexico, natural gas use in the residential and commercial sector is projected to rise substantially in the next 10 years due to the introduction of pipelines in major cities. By contrast, oil is expected to decline as a result of a switch to cleaner and more efficient energy sources.
In Korea, natural gas and heat consumption is expected to increase almost 2.5 fold over the forecast period. Oil is at present the main fuel used in Korea, but it is expected to decline to 20 percent in 2020 from 47 percent in 1999. Electricity is forecast to become a more important source of energy in both households and commercial buildings. In contrast with the fall in oil�s share in the residential and commercial sector, the share of electricity is projected to rise significantly to 43 percent in 2020 from 24 percent in 1999.
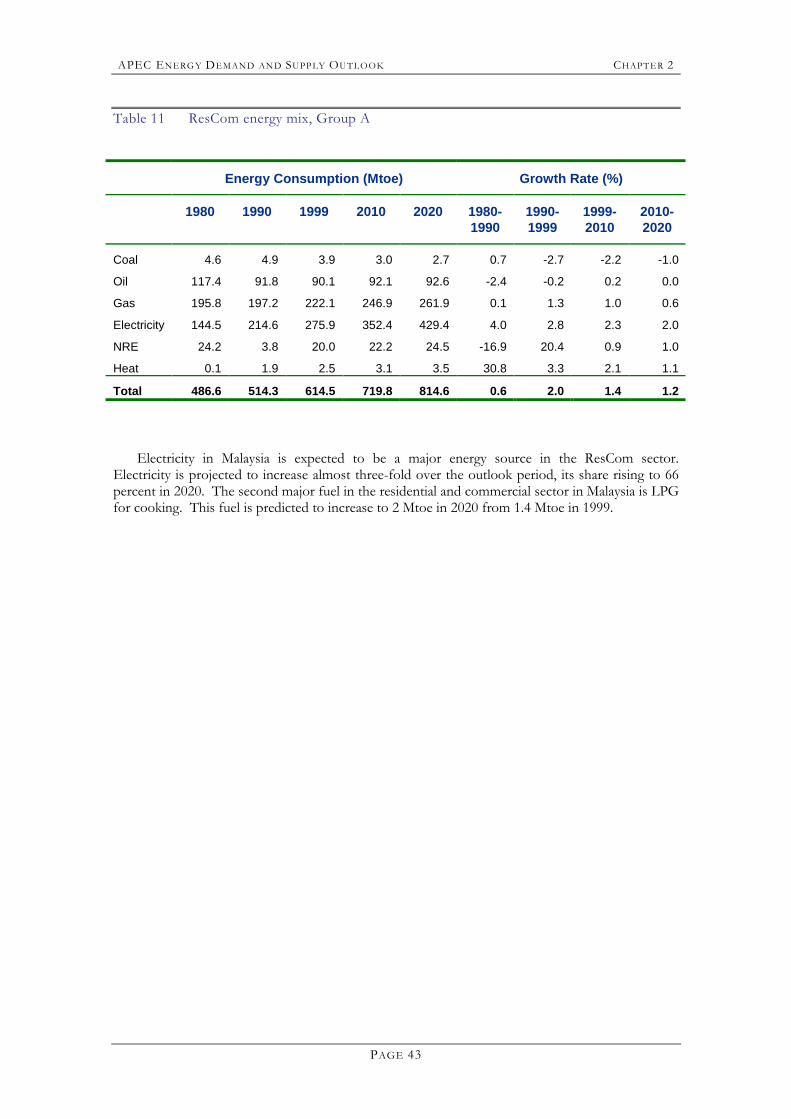
APEC ENERG Y DEMAND AN D SUPP LY OUTLOOK CHAPT ER 2
PAGE 43
Table 11 ResCom energy mix, Group A
Energy Consumption (Mtoe) Growth Rate (%)
1980 1990 1999 2010 2020 1980-1990
1990-1999
1999-2010
2010-2020
Coal 4.6 4.9 3.9 3.0 2.7 0.7 -2.7 -2.2 -1.0
Oil 117.4 91.8 90.1 92.1 92.6 -2.4 -0.2 0.2 0.0
Gas 195.8 197.2 222.1 246.9 261.9 0.1 1.3 1.0 0.6
Electricity 144.5 214.6 275.9 352.4 429.4 4.0 2.8 2.3 2.0
NRE 24.2 3.8 20.0 22.2 24.5 -16.9 20.4 0.9 1.0
Heat 0.1 1.9 2.5 3.1 3.5 30.8 3.3 2.1 1.1
Total 486.6 514.3 614.5 719.8 814.6 0.6 2.0 1.4 1.2
Electricity in Malaysia is expected to be a major energy source in the ResCom sector. Electricity is projected to increase almost three-fold over the outlook period, its share rising to 66 percent in 2020. The second major fuel in the residential and commercial sector in Malaysia is LPG for cooking. This fuel is predicted to increase to 2 Mtoe in 2020 from 1.4 Mtoe in 1999.
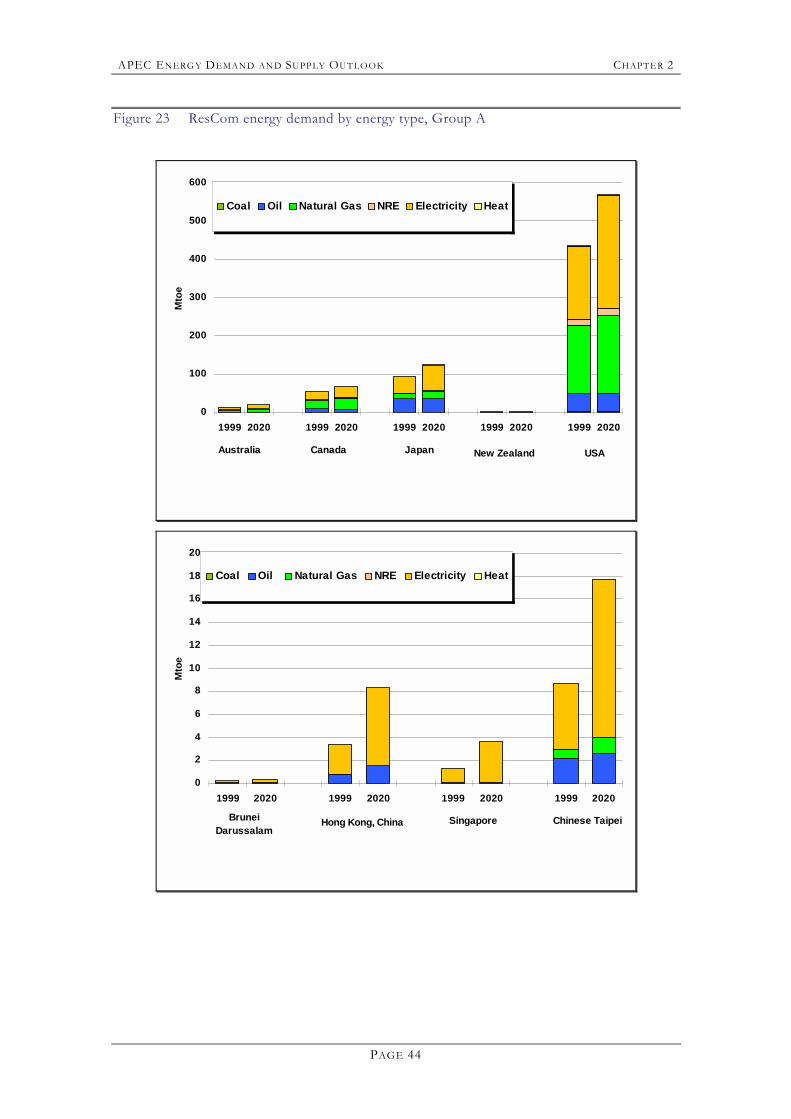
APEC ENERG Y DEMAND AN D SUPP LY OUTLOOK CHAPT ER 2
PAGE 44
Figure 23 ResCom energy demand by energy type, Group A
0
100
200
300
400
500
600
1999 2020 1999 2020 1999 2020 1999 2020 1999 2020
Mto
e
Coal Oil Natural Gas NRE Electricity Heat
Australia Canada Japan New Zealand USA
0
2
4
6
8
10
12
14
16
18
20
1999 2020 1999 2020 1999 2020 1999 2020
Mto
e
Coal Oil Natural Gas NRE Electricity Heat
Brunei Darussalam
Hong Kong, China Singapore Chinese Taipei
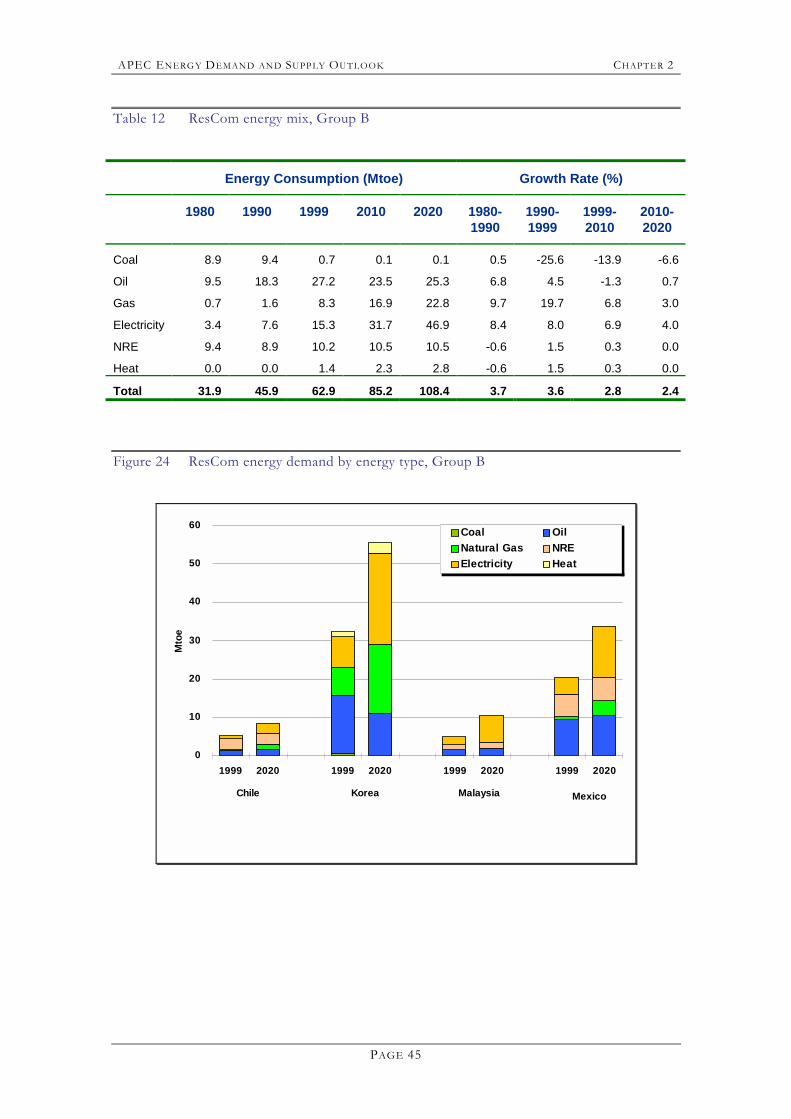
APEC ENERG Y DEMAND AN D SUPP LY OUTLOOK CHAPT ER 2
PAGE 45
Table 12 ResCom energy mix, Group B
Energy Consumption (Mtoe) Growth Rate (%)
1980 1990 1999 2010 2020 1980-1990
1990-1999
1999-2010
2010-2020
Coal 8.9 9.4 0.7 0.1 0.1 0.5 -25.6 -13.9 -6.6
Oil 9.5 18.3 27.2 23.5 25.3 6.8 4.5 -1.3 0.7
Gas 0.7 1.6 8.3 16.9 22.8 9.7 19.7 6.8 3.0
Electricity 3.4 7.6 15.3 31.7 46.9 8.4 8.0 6.9 4.0
NRE 9.4 8.9 10.2 10.5 10.5 -0.6 1.5 0.3 0.0
Heat 0.0 0.0 1.4 2.3 2.8 -0.6 1.5 0.3 0.0
Total 31.9 45.9 62.9 85.2 108.4 3.7 3.6 2.8 2.4
Figure 24 ResCom energy demand by energy type, Group B
0
10
20
30
40
50
60
1999 2020 1999 2020 1999 2020 1999 2020
Mto
e
Coal Oil Natural Gas NREElectricity Heat
Chile Korea Malaysia Mexico
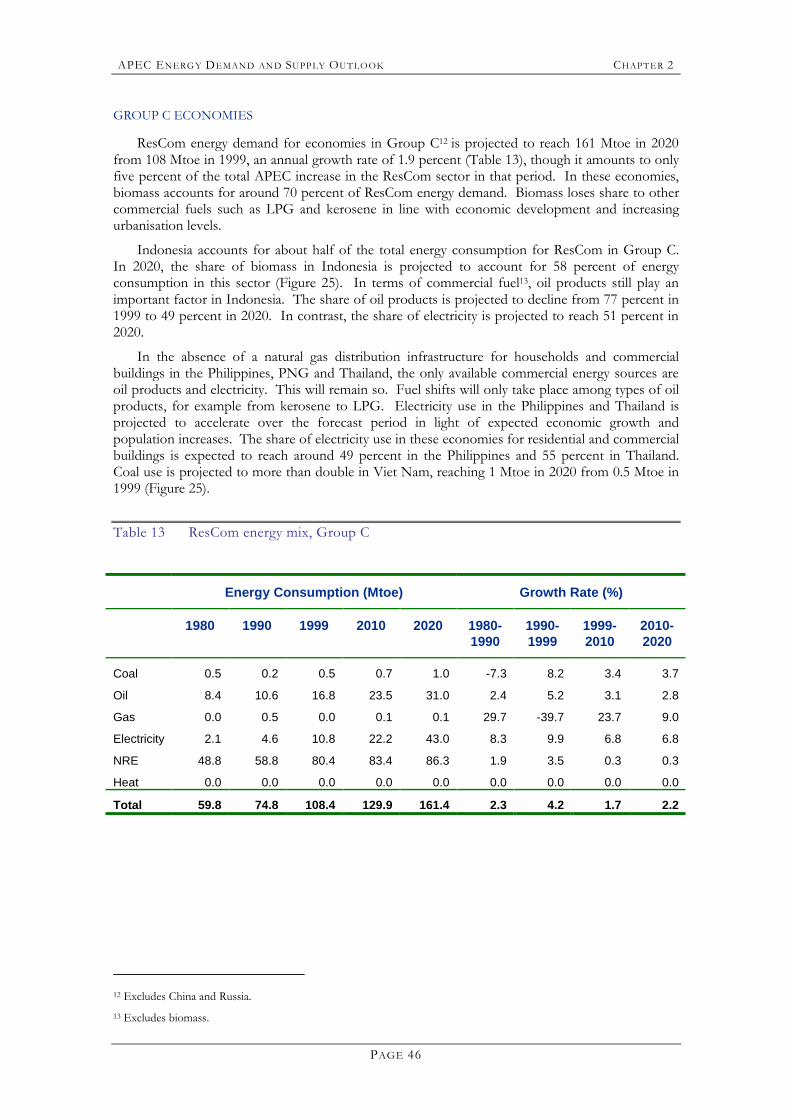
APEC ENERG Y DEMAND AN D SUPP LY OUTLOOK CHAPT ER 2
PAGE 46
GROUP C ECONOMIES
ResCom energy demand for economies in Group C12 is projected to reach 161 Mtoe in 2020 from 108 Mtoe in 1999, an annual growth rate of 1.9 percent (Table 13), though it amounts to only five percent of the total APEC increase in the ResCom sector in that period. In these economies, biomass accounts for around 70 percent of ResCom energy demand. Biomass loses share to other commercial fuels such as LPG and kerosene in line with economic development and increasing urbanisation levels.
Indonesia accounts for about half of the total energy consumption for ResCom in Group C. In 2020, the share of biomass in Indonesia is projected to account for 58 percent of energy consumption in this sector (Figure 25). In terms of commercial fuel13, oil products still play an important factor in Indonesia. The share of oil products is projected to decline from 77 percent in 1999 to 49 percent in 2020. In contrast, the share of electricity is projected to reach 51 percent in 2020.
In the absence of a natural gas distribution infrastructure for households and commercial buildings in the Philippines, PNG and Thailand, the only available commercial energy sources are oil products and electricity. This will remain so. Fuel shifts will only take place among types of oil products, for example from kerosene to LPG. Electricity use in the Philippines and Thailand is projected to accelerate over the forecast period in light of expected economic growth and population increases. The share of electricity use in these economies for residential and commercial buildings is expected to reach around 49 percent in the Philippines and 55 percent in Thailand. Coal use is projected to more than double in Viet Nam, reaching 1 Mtoe in 2020 from 0.5 Mtoe in 1999 (Figure 25).
Table 13 ResCom energy mix, Group C
Energy Consumption (Mtoe) Growth Rate (%)
1980 1990 1999 2010 2020 1980-1990
1990-1999
1999-2010
2010-2020
Coal 0.5 0.2 0.5 0.7 1.0 -7.3 8.2 3.4 3.7
Oil 8.4 10.6 16.8 23.5 31.0 2.4 5.2 3.1 2.8
Gas 0.0 0.5 0.0 0.1 0.1 29.7 -39.7 23.7 9.0
Electricity 2.1 4.6 10.8 22.2 43.0 8.3 9.9 6.8 6.8
NRE 48.8 58.8 80.4 83.4 86.3 1.9 3.5 0.3 0.3
Heat 0.0 0.0 0.0 0.0 0.0 0.0 0.0 0.0 0.0
Total 59.8 74.8 108.4 129.9 161.4 2.3 4.2 1.7 2.2
12 Excludes China and Russia. 13 Excludes biomass.
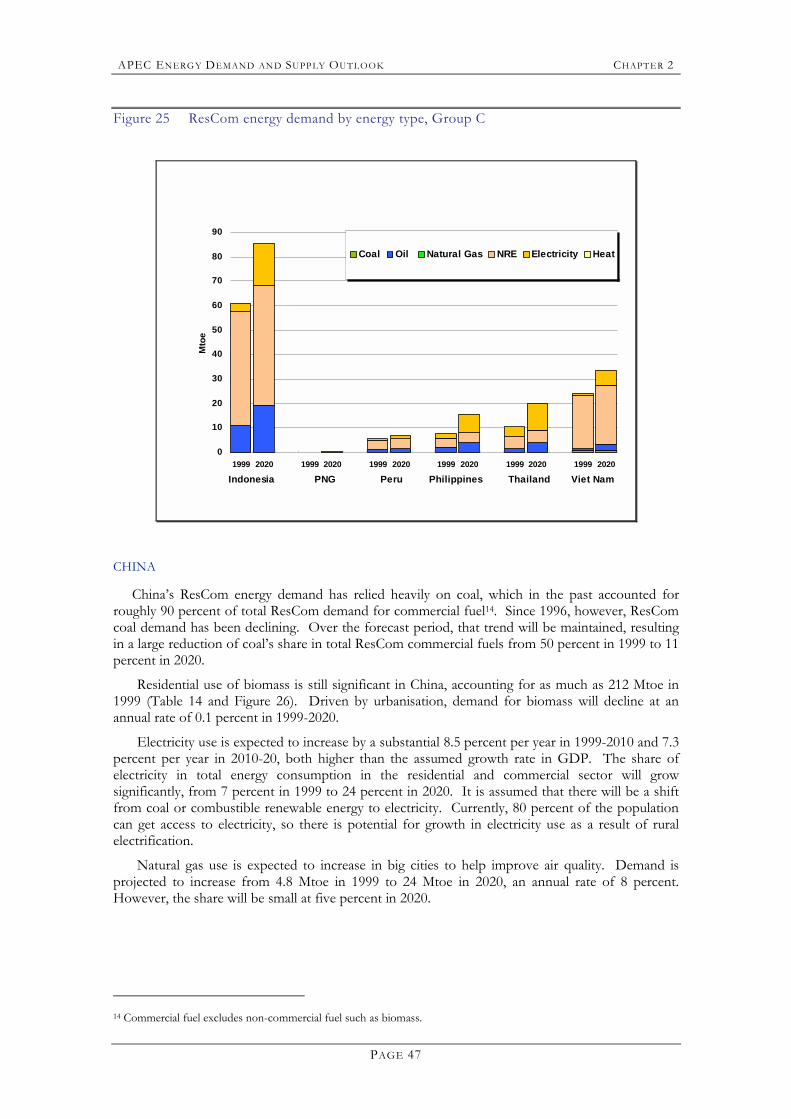
APEC ENERG Y DEMAND AN D SUPP LY OUTLOOK CHAPT ER 2
PAGE 47
Figure 25 ResCom energy demand by energy type, Group C
0
10
20
30
40
50
60
70
80
90
1999 2020 1999 2020 1999 2020 1999 2020 1999 2020 1999 2020
Mto
e
Coal Oil Natural Gas NRE Electricity Heat
Indonesia PNG Peru Philippines Thailand Viet Nam
CHINA
China�s ResCom energy demand has relied heavily on coal, which in the past accounted for roughly 90 percent of total ResCom demand for commercial fuel14. Since 1996, however, ResCom coal demand has been declining. Over the forecast period, that trend will be maintained, resulting in a large reduction of coal�s share in total ResCom commercial fuels from 50 percent in 1999 to 11 percent in 2020.
Residential use of biomass is still significant in China, accounting for as much as 212 Mtoe in 1999 (Table 14 and Figure 26). Driven by urbanisation, demand for biomass will decline at an annual rate of 0.1 percent in 1999-2020.
Electricity use is expected to increase by a substantial 8.5 percent per year in 1999-2010 and 7.3 percent per year in 2010-20, both higher than the assumed growth rate in GDP. The share of electricity in total energy consumption in the residential and commercial sector will grow significantly, from 7 percent in 1999 to 24 percent in 2020. It is assumed that there will be a shift from coal or combustible renewable energy to electricity. Currently, 80 percent of the population can get access to electricity, so there is potential for growth in electricity use as a result of rural electrification.
Natural gas use is expected to increase in big cities to help improve air quality. Demand is projected to increase from 4.8 Mtoe in 1999 to 24 Mtoe in 2020, an annual rate of 8 percent. However, the share will be small at five percent in 2020.
14 Commercial fuel excludes non-commercial fuel such as biomass.
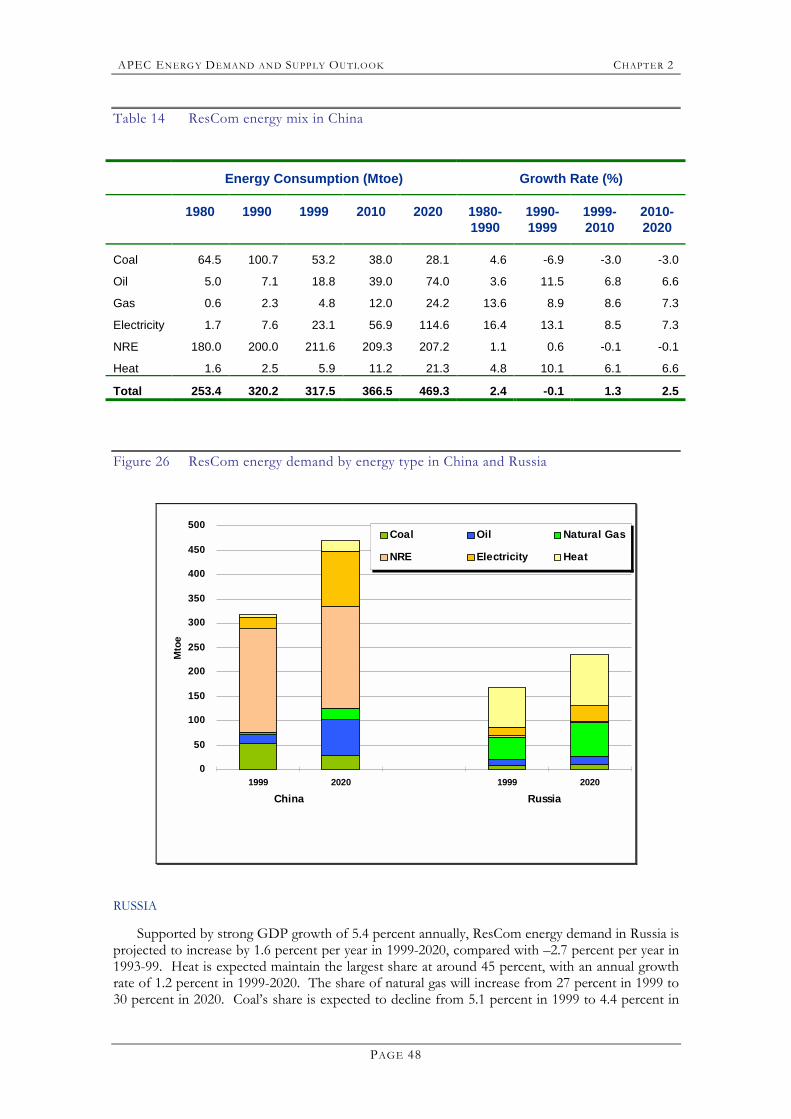
APEC ENERG Y DEMAND AN D SUPP LY OUTLOOK CHAPT ER 2
PAGE 48
Table 14 ResCom energy mix in China
Energy Consumption (Mtoe) Growth Rate (%)
1980 1990 1999 2010 2020 1980-1990
1990-1999
1999-2010
2010-2020
Coal 64.5 100.7 53.2 38.0 28.1 4.6 -6.9 -3.0 -3.0
Oil 5.0 7.1 18.8 39.0 74.0 3.6 11.5 6.8 6.6
Gas 0.6 2.3 4.8 12.0 24.2 13.6 8.9 8.6 7.3
Electricity 1.7 7.6 23.1 56.9 114.6 16.4 13.1 8.5 7.3
NRE 180.0 200.0 211.6 209.3 207.2 1.1 0.6 -0.1 -0.1
Heat 1.6 2.5 5.9 11.2 21.3 4.8 10.1 6.1 6.6
Total 253.4 320.2 317.5 366.5 469.3 2.4 -0.1 1.3 2.5
Figure 26 ResCom energy demand by energy type in China and Russia
0
50
100
150
200
250
300
350
400
450
500
1999 2020 1999 2020
Mto
e
Coal Oil Natural Gas
NRE Electricity Heat
China Russia
RUSSIA
Supported by strong GDP growth of 5.4 percent annually, ResCom energy demand in Russia is projected to increase by 1.6 percent per year in 1999-2020, compared with �2.7 percent per year in 1993-99. Heat is expected maintain the largest share at around 45 percent, with an annual growth rate of 1.2 percent in 1999-2020. The share of natural gas will increase from 27 percent in 1999 to 30 percent in 2020. Coal�s share is expected to decline from 5.1 percent in 1999 to 4.4 percent in
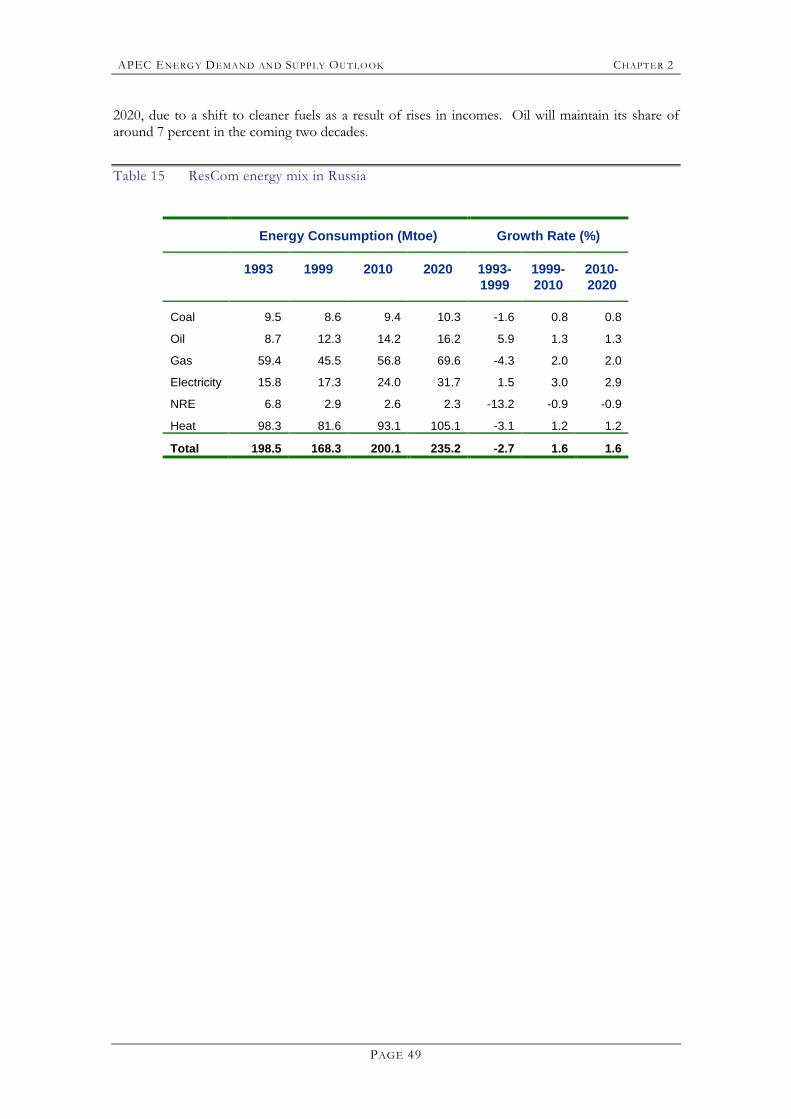
APEC ENERG Y DEMAND AN D SUPP LY OUTLOOK CHAPT ER 2
PAGE 49
2020, due to a shift to cleaner fuels as a result of rises in incomes. Oil will maintain its share of around 7 percent in the coming two decades.
Table 15 ResCom energy mix in Russia
Energy Consumption (Mtoe) Growth Rate (%)
1993 1999 2010 2020 1993-1999
1999-2010
2010-2020
Coal 9.5 8.6 9.4 10.3 -1.6 0.8 0.8
Oil 8.7 12.3 14.2 16.2 5.9 1.3 1.3
Gas 59.4 45.5 56.8 69.6 -4.3 2.0 2.0
Electricity 15.8 17.3 24.0 31.7 1.5 3.0 2.9
NRE 6.8 2.9 2.6 2.3 -13.2 -0.9 -0.9
Heat 98.3 81.6 93.1 105.1 -3.1 1.2 1.2
Total 198.5 168.3 200.1 235.2 -2.7 1.6 1.6

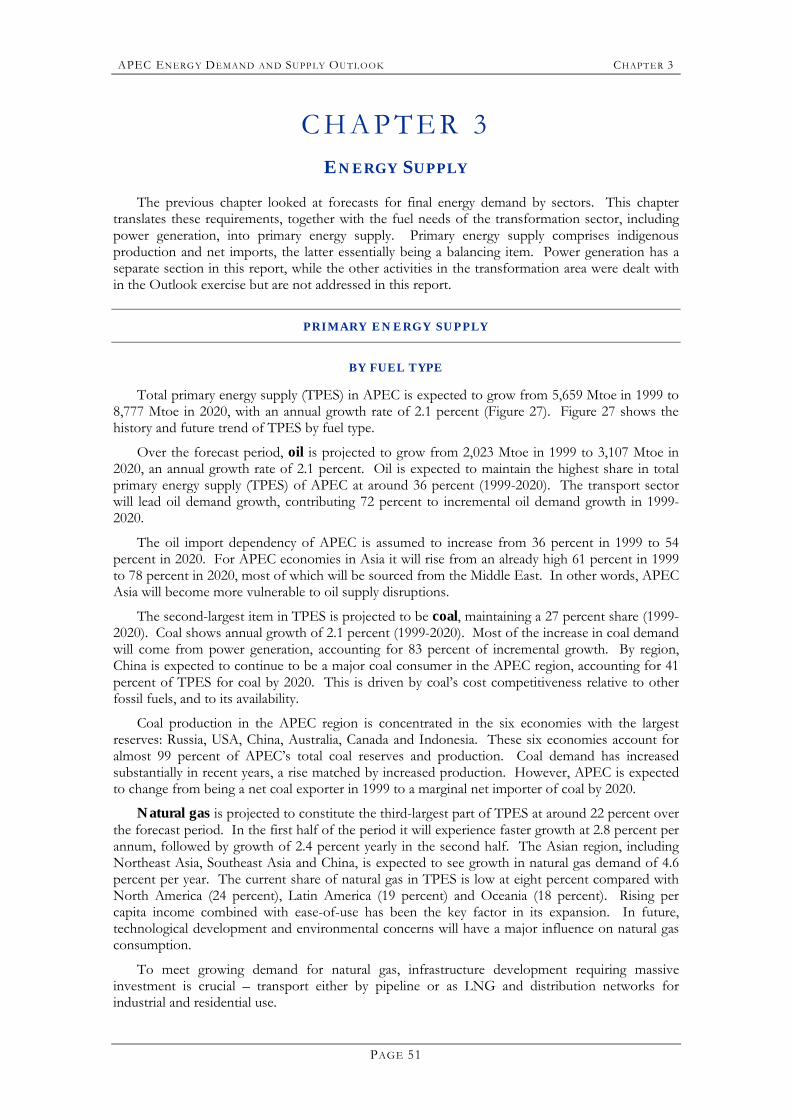
APEC ENERG Y DEMAND AN D SUPP LY OUTLOOK CHAPT ER 3
PAGE 51
C H A P T E R 3 ENERGY SUPPLY
The previous chapter looked at forecasts for final energy demand by sectors. This chapter translates these requirements, together with the fuel needs of the transformation sector, including power generation, into primary energy supply. Primary energy supply comprises indigenous production and net imports, the latter essentially being a balancing item. Power generation has a separate section in this report, while the other activities in the transformation area were dealt with in the Outlook exercise but are not addressed in this report.
PRIMARY ENERGY SUPPLY
BY FUEL TYPE
Total primary energy supply (TPES) in APEC is expected to grow from 5,659 Mtoe in 1999 to 8,777 Mtoe in 2020, with an annual growth rate of 2.1 percent (Figure 27). Figure 27 shows the history and future trend of TPES by fuel type.
Over the forecast period, oil is projected to grow from 2,023 Mtoe in 1999 to 3,107 Mtoe in 2020, an annual growth rate of 2.1 percent. Oil is expected to maintain the highest share in total primary energy supply (TPES) of APEC at around 36 percent (1999-2020). The transport sector will lead oil demand growth, contributing 72 percent to incremental oil demand growth in 1999-2020.
The oil import dependency of APEC is assumed to increase from 36 percent in 1999 to 54 percent in 2020. For APEC economies in Asia it will rise from an already high 61 percent in 1999 to 78 percent in 2020, most of which will be sourced from the Middle East. In other words, APEC Asia will become more vulnerable to oil supply disruptions.
The second-largest item in TPES is projected to be coal, maintaining a 27 percent share (1999-2020). Coal shows annual growth of 2.1 percent (1999-2020). Most of the increase in coal demand will come from power generation, accounting for 83 percent of incremental growth. By region, China is expected to continue to be a major coal consumer in the APEC region, accounting for 41 percent of TPES for coal by 2020. This is driven by coal�s cost competitiveness relative to other fossil fuels, and to its availability.
Coal production in the APEC region is concentrated in the six economies with the largest reserves: Russia, USA, China, Australia, Canada and Indonesia. These six economies account for almost 99 percent of APEC�s total coal reserves and production. Coal demand has increased substantially in recent years, a rise matched by increased production. However, APEC is expected to change from being a net coal exporter in 1999 to a marginal net importer of coal by 2020.
Natural gas is projected to constitute the third-largest part of TPES at around 22 percent over the forecast period. In the first half of the period it will experience faster growth at 2.8 percent per annum, followed by growth of 2.4 percent yearly in the second half. The Asian region, including Northeast Asia, Southeast Asia and China, is expected to see growth in natural gas demand of 4.6 percent per year. The current share of natural gas in TPES is low at eight percent compared with North America (24 percent), Latin America (19 percent) and Oceania (18 percent). Rising per capita income combined with ease-of-use has been the key factor in its expansion. In future, technological development and environmental concerns will have a major influence on natural gas consumption.
To meet growing demand for natural gas, infrastructure development requiring massive investment is crucial � transport either by pipeline or as LNG and distribution networks for industrial and residential use.
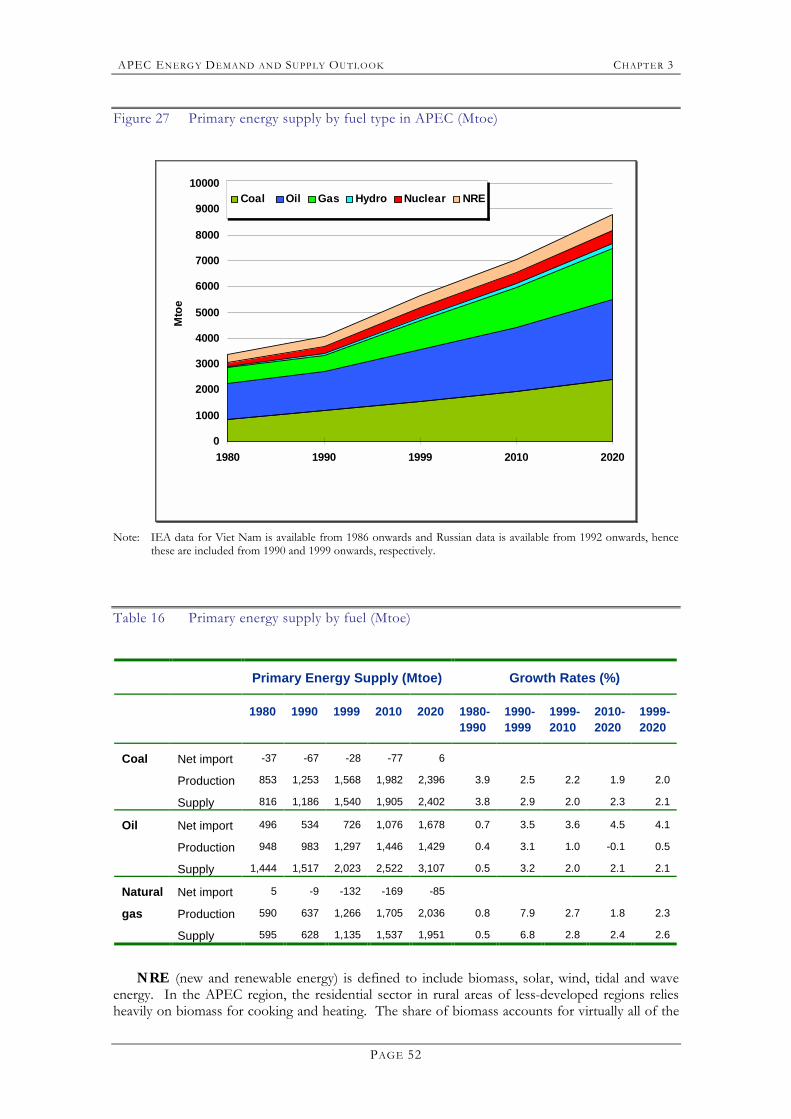
APEC ENERG Y DEMAND AN D SUPP LY OUTLOOK CHAPT ER 3
PAGE 52
Figure 27 Primary energy supply by fuel type in APEC (Mtoe)
0
1000
2000
3000
4000
5000
6000
7000
8000
9000
10000
1980 1990 1999 2010 2020
Mto
e
Coal Oil Gas Hydro Nuclear NRE
Note: IEA data for Viet Nam is available from 1986 onwards and Russian data is available from 1992 onwards, hence
these are included from 1990 and 1999 onwards, respectively.
Table 16 Primary energy supply by fuel (Mtoe)
Primary Energy Supply (Mtoe) Growth Rates (%)
1980 1990 1999 2010 2020 1980-1990
1990-1999
1999-2010
2010-2020
1999-2020
Coal Net import -37 -67 -28 -77 6
Production 853 1,253 1,568 1,982 2,396 3.9 2.5 2.2 1.9 2.0
Supply 816 1,186 1,540 1,905 2,402 3.8 2.9 2.0 2.3 2.1
Oil Net import 496 534 726 1,076 1,678 0.7 3.5 3.6 4.5 4.1
Production 948 983 1,297 1,446 1,429 0.4 3.1 1.0 -0.1 0.5
Supply 1,444 1,517 2,023 2,522 3,107 0.5 3.2 2.0 2.1 2.1
Natural Net import 5 -9 -132 -169 -85
gas Production 590 637 1,266 1,705 2,036 0.8 7.9 2.7 1.8 2.3
Supply 595 628 1,135 1,537 1,951 0.5 6.8 2.8 2.4 2.6
NRE (new and renewable energy) is defined to include biomass, solar, wind, tidal and wave energy. In the APEC region, the residential sector in rural areas of less-developed regions relies heavily on biomass for cooking and heating. The share of biomass accounts for virtually all of the
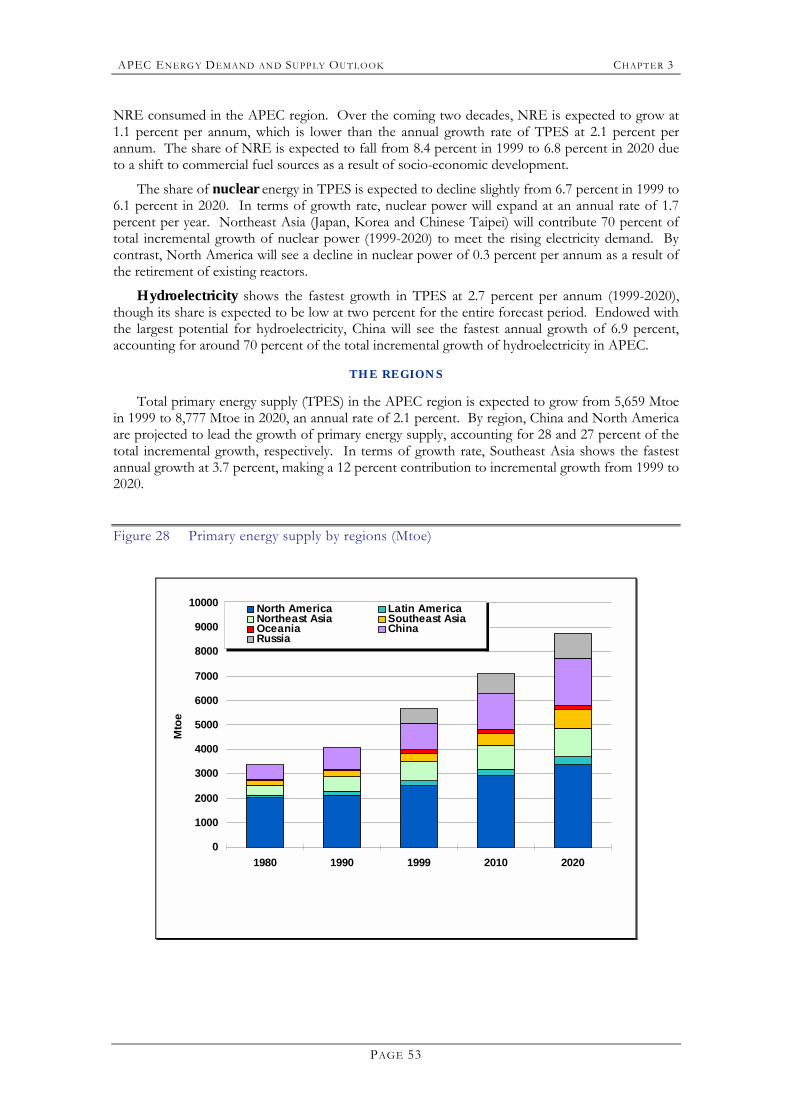
APEC ENERG Y DEMAND AN D SUPP LY OUTLOOK CHAPT ER 3
PAGE 53
NRE consumed in the APEC region. Over the coming two decades, NRE is expected to grow at 1.1 percent per annum, which is lower than the annual growth rate of TPES at 2.1 percent per annum. The share of NRE is expected to fall from 8.4 percent in 1999 to 6.8 percent in 2020 due to a shift to commercial fuel sources as a result of socio-economic development.
The share of nuclear energy in TPES is expected to decline slightly from 6.7 percent in 1999 to 6.1 percent in 2020. In terms of growth rate, nuclear power will expand at an annual rate of 1.7 percent per year. Northeast Asia (Japan, Korea and Chinese Taipei) will contribute 70 percent of total incremental growth of nuclear power (1999-2020) to meet the rising electricity demand. By contrast, North America will see a decline in nuclear power of 0.3 percent per annum as a result of the retirement of existing reactors.
Hydroelectricity shows the fastest growth in TPES at 2.7 percent per annum (1999-2020), though its share is expected to be low at two percent for the entire forecast period. Endowed with the largest potential for hydroelectricity, China will see the fastest annual growth of 6.9 percent, accounting for around 70 percent of the total incremental growth of hydroelectricity in APEC.
THE REGIONS
Total primary energy supply (TPES) in the APEC region is expected to grow from 5,659 Mtoe in 1999 to 8,777 Mtoe in 2020, an annual rate of 2.1 percent. By region, China and North America are projected to lead the growth of primary energy supply, accounting for 28 and 27 percent of the total incremental growth, respectively. In terms of growth rate, Southeast Asia shows the fastest annual growth at 3.7 percent, making a 12 percent contribution to incremental growth from 1999 to 2020.
Figure 28 Primary energy supply by regions (Mtoe)
0
1000
2000
3000
4000
5000
6000
7000
8000
9000
10000
1980 1990 1999 2010 2020
Mto
e
North America Latin AmericaNortheast Asia Southeast AsiaOceania ChinaRussia
APEC ENERG Y DEMAND AN D SUPP LY OUTLOOK CHAPT ER 3
PAGE 54
PRIMARY ENERGY SUPPLY PER CAPITA
Primary energy supply per capita in APEC is expected to increase from 2.2 toe in 1999 to 2.7 toe in 2020. As can be seen in Figure 29, however, the range in per capita figures in 2020 is wide, from 0.2 toe in Papua New Guinea to 9.0 toe in Canada.
The overall trends are consistent with the notion that consumers� demand for energy will increase as incomes rise. However, energy demand per capita will begin to level off as individual consumers� energy needs reach a saturation point. For this reason, the pace of primary energy demand per capita growth varies from region to region. North America, with the highest income level, shows a moderate increase in per capita energy demand of 0.4 percent per year in 1999-2020. In contrast, Russia and China will see faster growth in per capita energy demand at 2.7 and 2.1 percent per annum, respectively (1999-2020).
Figure 29 Primary energy supply per capita by region, (1980-2020)
0123456
789
10
0 5000 10000 15000 20000 25000 30000 35000 40000 45000GDP per capita (1990 US$)
toe
per c
apita
North America Latin America Northeast Asia Southeast AsiaOceania China Russia APEC
North America
Russia
Oceania
Northeast AsiaAPEC
Latin AmericaChina
Southeast Asia
ENERGY INTENSITY
Energy intensity (toe per GDP US$ million in constant 1990 dollars) for APEC as a whole is expected to decline over the forecast period, indicating a less energy-intensive future (Figure 30). Factors affecting the level of energy intensity include income level, industry structure, technology, energy prices and climate. There are wide disparities in energy intensity by region. China shows the largest reduction in energy intensity, from 3.7 toe per million US$ in 1980 to 0.5 in 2020. This is largely driven by fast growth in its GDP of 7.1 percent per year, and a shift to more energy-efficient technology. By comparison, Northeast Asia�s energy intensity will stay almost unchanged at around 0.2 toe per million US$.
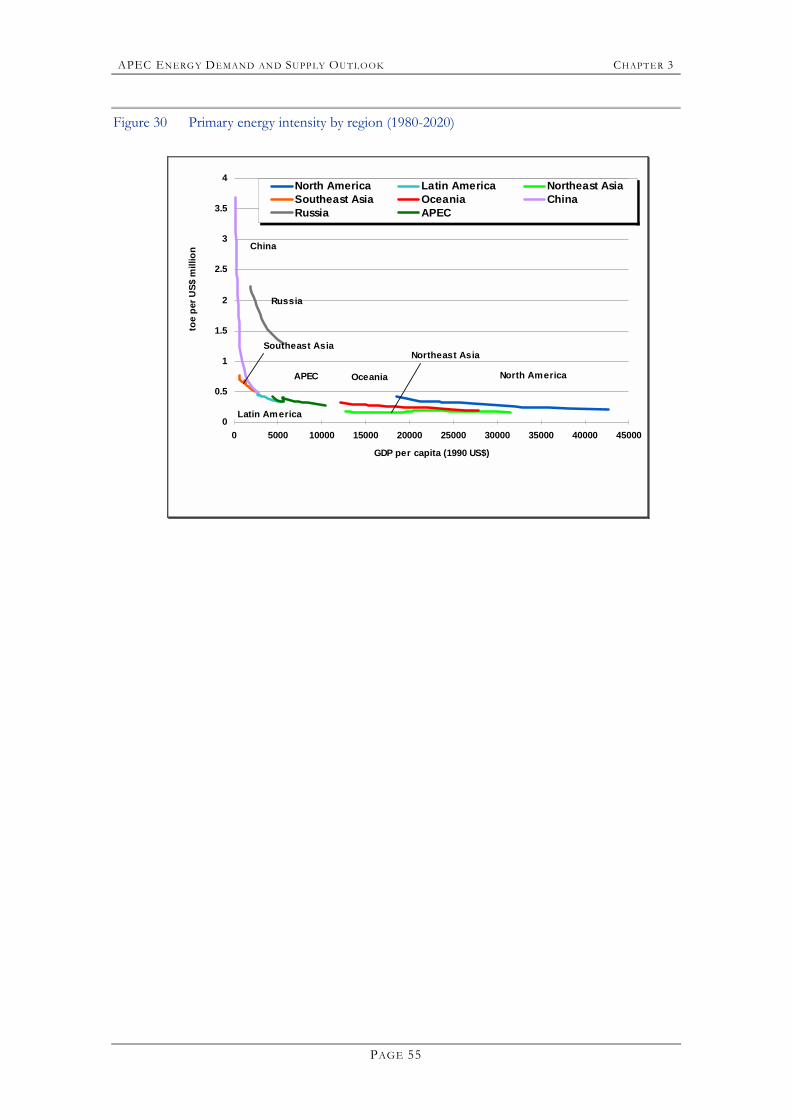
APEC ENERG Y DEMAND AN D SUPP LY OUTLOOK CHAPT ER 3
PAGE 55
Figure 30 Primary energy intensity by region (1980-2020)
0
0.5
1
1.5
2
2.5
3
3.5
4
0 5000 10000 15000 20000 25000 30000 35000 40000 45000
GDP per capita (1990 US$)
toe
per U
S$ m
illio
nNorth America Latin America Northeast AsiaSoutheast Asia Oceania ChinaRussia APEC
North America
Russia
Oceania
Northeast Asia
APEC
Latin America
China
Southeast Asia
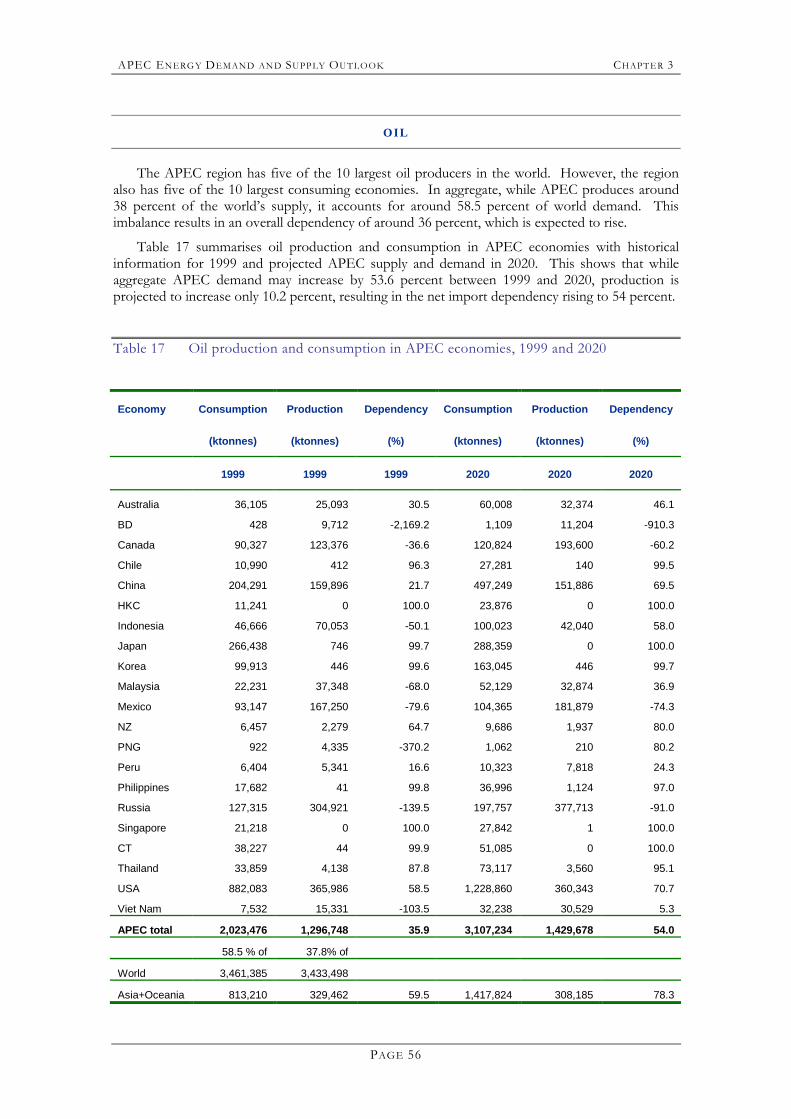
APEC ENERG Y DEMAND AN D SUPP LY OUTLOOK CHAPT ER 3
PAGE 56
OIL
The APEC region has five of the 10 largest oil producers in the world. However, the region also has five of the 10 largest consuming economies. In aggregate, while APEC produces around 38 percent of the world�s supply, it accounts for around 58.5 percent of world demand. This imbalance results in an overall dependency of around 36 percent, which is expected to rise.
Table 17 summarises oil production and consumption in APEC economies with historical information for 1999 and projected APEC supply and demand in 2020. This shows that while aggregate APEC demand may increase by 53.6 percent between 1999 and 2020, production is projected to increase only 10.2 percent, resulting in the net import dependency rising to 54 percent.
Table 17 Oil production and consumption in APEC economies, 1999 and 2020
Economy Consumption Production Dependency Consumption Production Dependency
(ktonnes) (ktonnes) (%) (ktonnes) (ktonnes) (%)
1999 1999 1999 2020 2020 2020
Australia 36,105 25,093 30.5 60,008 32,374 46.1
BD 428 9,712 -2,169.2 1,109 11,204 -910.3
Canada 90,327 123,376 -36.6 120,824 193,600 -60.2
Chile 10,990 412 96.3 27,281 140 99.5
China 204,291 159,896 21.7 497,249 151,886 69.5
HKC 11,241 0 100.0 23,876 0 100.0
Indonesia 46,666 70,053 -50.1 100,023 42,040 58.0
Japan 266,438 746 99.7 288,359 0 100.0
Korea 99,913 446 99.6 163,045 446 99.7
Malaysia 22,231 37,348 -68.0 52,129 32,874 36.9
Mexico 93,147 167,250 -79.6 104,365 181,879 -74.3
NZ 6,457 2,279 64.7 9,686 1,937 80.0
PNG 922 4,335 -370.2 1,062 210 80.2
Peru 6,404 5,341 16.6 10,323 7,818 24.3
Philippines 17,682 41 99.8 36,996 1,124 97.0
Russia 127,315 304,921 -139.5 197,757 377,713 -91.0
Singapore 21,218 0 100.0 27,842 1 100.0
CT 38,227 44 99.9 51,085 0 100.0
Thailand 33,859 4,138 87.8 73,117 3,560 95.1
USA 882,083 365,986 58.5 1,228,860 360,343 70.7
Viet Nam 7,532 15,331 -103.5 32,238 30,529 5.3
APEC total 2,023,476 1,296,748 35.9 3,107,234 1,429,678 54.0
58.5 % of 37.8% of
World 3,461,385 3,433,498
Asia+Oceania 813,210 329,462 59.5 1,417,824 308,185 78.3
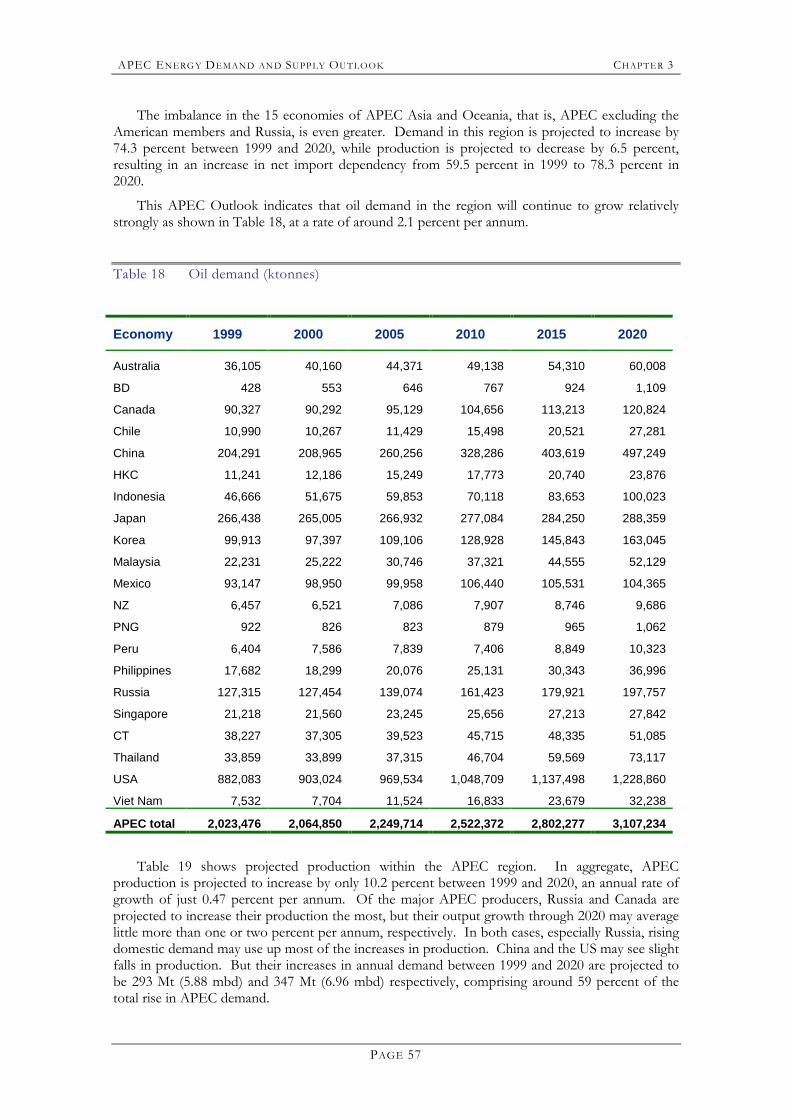
APEC ENERG Y DEMAND AN D SUPP LY OUTLOOK CHAPT ER 3
PAGE 57
The imbalance in the 15 economies of APEC Asia and Oceania, that is, APEC excluding the American members and Russia, is even greater. Demand in this region is projected to increase by 74.3 percent between 1999 and 2020, while production is projected to decrease by 6.5 percent, resulting in an increase in net import dependency from 59.5 percent in 1999 to 78.3 percent in 2020.
This APEC Outlook indicates that oil demand in the region will continue to grow relatively strongly as shown in Table 18, at a rate of around 2.1 percent per annum.
Table 18 Oil demand (ktonnes)
Economy 1999 2000 2005 2010 2015 2020
Australia 36,105 40,160 44,371 49,138 54,310 60,008
BD 428 553 646 767 924 1,109
Canada 90,327 90,292 95,129 104,656 113,213 120,824
Chile 10,990 10,267 11,429 15,498 20,521 27,281
China 204,291 208,965 260,256 328,286 403,619 497,249
HKC 11,241 12,186 15,249 17,773 20,740 23,876
Indonesia 46,666 51,675 59,853 70,118 83,653 100,023
Japan 266,438 265,005 266,932 277,084 284,250 288,359
Korea 99,913 97,397 109,106 128,928 145,843 163,045
Malaysia 22,231 25,222 30,746 37,321 44,555 52,129
Mexico 93,147 98,950 99,958 106,440 105,531 104,365
NZ 6,457 6,521 7,086 7,907 8,746 9,686
PNG 922 826 823 879 965 1,062
Peru 6,404 7,586 7,839 7,406 8,849 10,323
Philippines 17,682 18,299 20,076 25,131 30,343 36,996
Russia 127,315 127,454 139,074 161,423 179,921 197,757
Singapore 21,218 21,560 23,245 25,656 27,213 27,842
CT 38,227 37,305 39,523 45,715 48,335 51,085
Thailand 33,859 33,899 37,315 46,704 59,569 73,117
USA 882,083 903,024 969,534 1,048,709 1,137,498 1,228,860
Viet Nam 7,532 7,704 11,524 16,833 23,679 32,238
APEC total 2,023,476 2,064,850 2,249,714 2,522,372 2,802,277 3,107,234
Table 19 shows projected production within the APEC region. In aggregate, APEC production is projected to increase by only 10.2 percent between 1999 and 2020, an annual rate of growth of just 0.47 percent per annum. Of the major APEC producers, Russia and Canada are projected to increase their production the most, but their output growth through 2020 may average little more than one or two percent per annum, respectively. In both cases, especially Russia, rising domestic demand may use up most of the increases in production. China and the US may see slight falls in production. But their increases in annual demand between 1999 and 2020 are projected to be 293 Mt (5.88 mbd) and 347 Mt (6.96 mbd) respectively, comprising around 59 percent of the total rise in APEC demand.
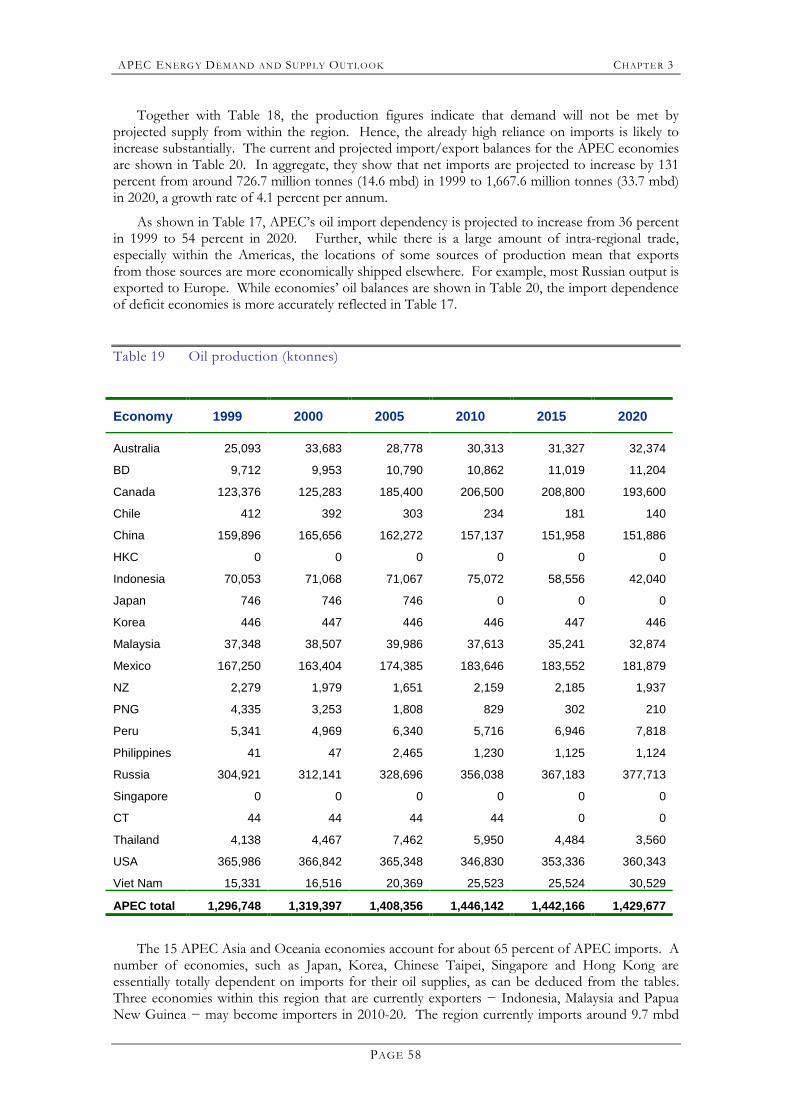
APEC ENERG Y DEMAND AN D SUPP LY OUTLOOK CHAPT ER 3
PAGE 58
Together with Table 18, the production figures indicate that demand will not be met by projected supply from within the region. Hence, the already high reliance on imports is likely to increase substantially. The current and projected import/export balances for the APEC economies are shown in Table 20. In aggregate, they show that net imports are projected to increase by 131 percent from around 726.7 million tonnes (14.6 mbd) in 1999 to 1,667.6 million tonnes (33.7 mbd) in 2020, a growth rate of 4.1 percent per annum.
As shown in Table 17, APEC�s oil import dependency is projected to increase from 36 percent in 1999 to 54 percent in 2020. Further, while there is a large amount of intra-regional trade, especially within the Americas, the locations of some sources of production mean that exports from those sources are more economically shipped elsewhere. For example, most Russian output is exported to Europe. While economies� oil balances are shown in Table 20, the import dependence of deficit economies is more accurately reflected in Table 17.
Table 19 Oil production (ktonnes)
Economy 1999 2000 2005 2010 2015 2020
Australia 25,093 33,683 28,778 30,313 31,327 32,374
BD 9,712 9,953 10,790 10,862 11,019 11,204
Canada 123,376 125,283 185,400 206,500 208,800 193,600
Chile 412 392 303 234 181 140
China 159,896 165,656 162,272 157,137 151,958 151,886
HKC 0 0 0 0 0 0
Indonesia 70,053 71,068 71,067 75,072 58,556 42,040
Japan 746 746 746 0 0 0
Korea 446 447 446 446 447 446
Malaysia 37,348 38,507 39,986 37,613 35,241 32,874
Mexico 167,250 163,404 174,385 183,646 183,552 181,879
NZ 2,279 1,979 1,651 2,159 2,185 1,937
PNG 4,335 3,253 1,808 829 302 210
Peru 5,341 4,969 6,340 5,716 6,946 7,818
Philippines 41 47 2,465 1,230 1,125 1,124
Russia 304,921 312,141 328,696 356,038 367,183 377,713
Singapore 0 0 0 0 0 0
CT 44 44 44 44 0 0
Thailand 4,138 4,467 7,462 5,950 4,484 3,560
USA 365,986 366,842 365,348 346,830 353,336 360,343
Viet Nam 15,331 16,516 20,369 25,523 25,524 30,529
APEC total 1,296,748 1,319,397 1,408,356 1,446,142 1,442,166 1,429,677
The 15 APEC Asia and Oceania economies account for about 65 percent of APEC imports. A number of economies, such as Japan, Korea, Chinese Taipei, Singapore and Hong Kong are essentially totally dependent on imports for their oil supplies, as can be deduced from the tables. Three economies within this region that are currently exporters − Indonesia, Malaysia and Papua New Guinea − may become importers in 2010-20. The region currently imports around 9.7 mbd

APEC ENERG Y DEMAND AN D SUPP LY OUTLOOK CHAPT ER 3
PAGE 59
and this is projected to increase to around 22.3 mbd in 2020. Of the 12.6 mbd additional import demand, six mbd, or 48 percent, is to meet increased demand from China, assuming production levels there remain static, as projected in this Outlook.
Table 20 (Net) Oil Imports (>0) and (Net) Exports (<0) (ktonnes)
Economy 1999 2000 2005 2010 2015 2020
Australia 11,012 6,477 15,593 18,825 22,983 27,634
BD -9,284 -9,400 -10,144 -10,095 -10,095 -10,095
Canada -33,049 -34,991 -90,271 -101,844 -95,587 -72,776
Chile 10,578 9,875 11,126 15,264 20,340 27,141
China 44,395 43,309 97,984 171,149 251,661 345,363
HKC 11,241 12,186 15,249 17,773 20,740 23,876
Indonesia -23,387 -19,393 -11,214 -4,954 25,097 57,983
Japan 265,692 264,259 266,186 277,084 284,250 288,359
Korea 99,467 96,950 108,660 128,482 145,396 162,599
Malaysia -15,117 -13,285 -9,240 -292 9,314 19,255
Mexico -74,103 -64,454 -74,427 -77,206 -78,021 -77,514
NZ 4,178 4,542 5,435 5,748 6,561 7,749
PNG -3,413 -2,427 -985 50 663 852
Peru 1,063 2,617 1,499 1,690 1,903 2,505
Philippines 17,641 18,252 17,611 23,901 29,218 35,872
Russia -177,606 -184,687 -189,622 -194,615 -187,262 -179,956
Singapore 21,218 21,560 23,245 25,656 27,213 27,842
CT 38,183 37,261 39,479 45,671 48,335 51,085
Thailand 29,721 29,432 29,853 40,754 55,085 69,557
USA 516,097 536,182 604,186 701,879 784,162 868,517
Viet Nam -7,799 -8,812 -8,845 -8,690 -1,845 1,709
APEC total 726,728 745,453 841,358 1,076,230 1,360,111 1,677,557
(mbd) 14.6 15.0 16.9 21.6 27.3 33.7
Asia+Oceania 483,748 480,911 578,867 731,062 914,576 1,109,640
(mbd) 9.7 9.7 11.6 14.7 18.4 22.3
Table 21 gives one view of the possible sources of new increments in production to 2020. This assessment shows that by far the large contribution to production increases will come from OPEC sources, predominantly in the Middle East. Further, almost 60 percent of the 33.4 mbd increase in worldwide production between 2000 and 2020 may be needed to satisfy increased APEC demand.
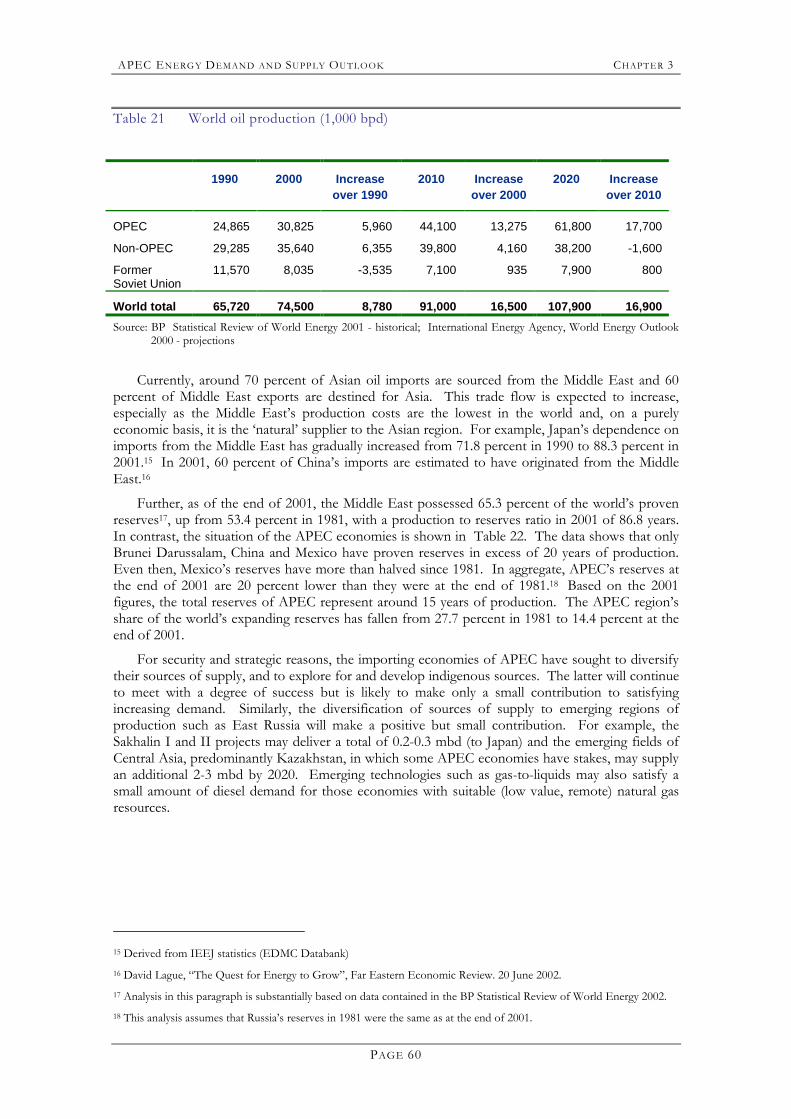
APEC ENERG Y DEMAND AN D SUPP LY OUTLOOK CHAPT ER 3
PAGE 60
Table 21 World oil production (1,000 bpd)
1990 2000 Increase over 1990
2010 Increase over 2000
2020 Increase over 2010
OPEC 24,865 30,825 5,960 44,100 13,275 61,800 17,700
Non-OPEC 29,285 35,640 6,355 39,800 4,160 38,200 -1,600
Former Soviet Union
11,570 8,035 -3,535 7,100 935 7,900 800
World total 65,720 74,500 8,780 91,000 16,500 107,900 16,900 Source: BP Statistical Review of World Energy 2001 - historical; International Energy Agency, World Energy Outlook
2000 - projections
Currently, around 70 percent of Asian oil imports are sourced from the Middle East and 60 percent of Middle East exports are destined for Asia. This trade flow is expected to increase, especially as the Middle East�s production costs are the lowest in the world and, on a purely economic basis, it is the �natural� supplier to the Asian region. For example, Japan�s dependence on imports from the Middle East has gradually increased from 71.8 percent in 1990 to 88.3 percent in 2001.15 In 2001, 60 percent of China�s imports are estimated to have originated from the Middle East.16
Further, as of the end of 2001, the Middle East possessed 65.3 percent of the world�s proven reserves17, up from 53.4 percent in 1981, with a production to reserves ratio in 2001 of 86.8 years. In contrast, the situation of the APEC economies is shown in Table 22. The data shows that only Brunei Darussalam, China and Mexico have proven reserves in excess of 20 years of production. Even then, Mexico�s reserves have more than halved since 1981. In aggregate, APEC�s reserves at the end of 2001 are 20 percent lower than they were at the end of 1981.18 Based on the 2001 figures, the total reserves of APEC represent around 15 years of production. The APEC region�s share of the world�s expanding reserves has fallen from 27.7 percent in 1981 to 14.4 percent at the end of 2001.
For security and strategic reasons, the importing economies of APEC have sought to diversify their sources of supply, and to explore for and develop indigenous sources. The latter will continue to meet with a degree of success but is likely to make only a small contribution to satisfying increasing demand. Similarly, the diversification of sources of supply to emerging regions of production such as East Russia will make a positive but small contribution. For example, the Sakhalin I and II projects may deliver a total of 0.2-0.3 mbd (to Japan) and the emerging fields of Central Asia, predominantly Kazakhstan, in which some APEC economies have stakes, may supply an additional 2-3 mbd by 2020. Emerging technologies such as gas-to-liquids may also satisfy a small amount of diesel demand for those economies with suitable (low value, remote) natural gas resources.
15 Derived from IEEJ statistics (EDMC Databank) 16 David Lague, �The Quest for Energy to Grow�, Far Eastern Economic Review. 20 June 2002. 17 Analysis in this paragraph is substantially based on data contained in the BP Statistical Review of World Energy 2002. 18 This analysis assumes that Russia�s reserves in 1981 were the same as at the end of 2001.
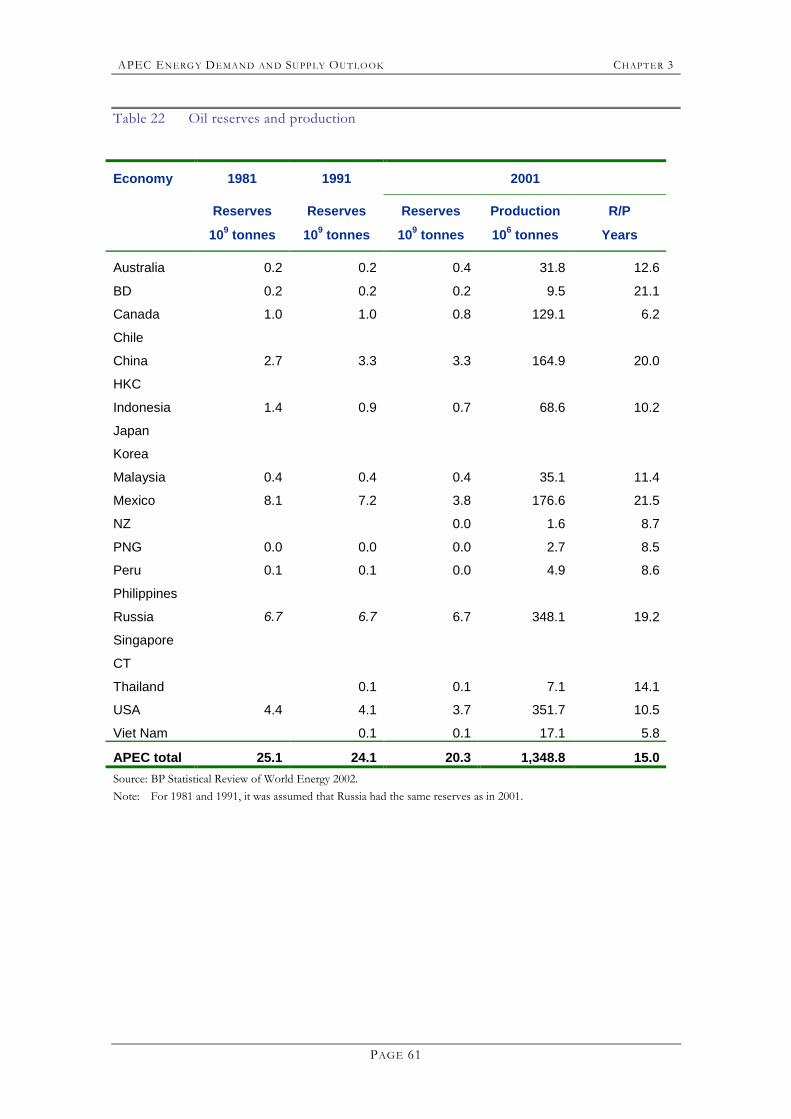
APEC ENERG Y DEMAND AN D SUPP LY OUTLOOK CHAPT ER 3
PAGE 61
Table 22 Oil reserves and production
Economy 1981 1991 2001
Reserves
109 tonnes
Reserves
109 tonnes
Reserves
109 tonnes
Production
106 tonnes
R/P
Years
Australia 0.2 0.2 0.4 31.8 12.6
BD 0.2 0.2 0.2 9.5 21.1
Canada 1.0 1.0 0.8 129.1 6.2
Chile
China 2.7 3.3 3.3 164.9 20.0
HKC
Indonesia 1.4 0.9 0.7 68.6 10.2
Japan
Korea
Malaysia 0.4 0.4 0.4 35.1 11.4
Mexico 8.1 7.2 3.8 176.6 21.5
NZ 0.0 1.6 8.7
PNG 0.0 0.0 0.0 2.7 8.5
Peru 0.1 0.1 0.0 4.9 8.6
Philippines
Russia 6.7 6.7 6.7 348.1 19.2
Singapore
CT
Thailand 0.1 0.1 7.1 14.1
USA 4.4 4.1 3.7 351.7 10.5
Viet Nam 0.1 0.1 17.1 5.8
APEC total 25.1 24.1 20.3 1,348.8 15.0 Source: BP Statistical Review of World Energy 2002. Note: For 1981 and 1991, it was assumed that Russia had the same reserves as in 2001.
APEC ENERG Y DEMAND AN D SUPP LY OUTLOOK CHAPT ER 3
PAGE 62
NATURAL GAS
OVERVIEW
Natural gas is second only to hydro energy in terms of growth rate for the projection period in the APEC economies. It is forecast to grow at 2.6 percent per annum, from 1,135 Mtoe in 1999 to 1,951 Mtoe in 2020, with its share in total primary energy supply increasing from 20 to 22 percent. This fast expansion of natural gas within APEC is in line with its growth elsewhere in the world, as shown by other major energy demand forecasts. The IEA forecasts that natural gas supply will grow 2.7 percent per annum between 1997 and 2020, with its share in world primary energy supply rising from 22 to 26 percent.19 According to reference case projections in the EIA�s International Energy Outlook 2002, world natural gas consumption is expected to grow at an average 3.2 percent per year over the same forecast period as APERC�s.20 Total volume is projected to reach 4.6 trillion m3 in 2020, nearly twice the 1999 total of 2.4 trillion m3, and its share in total energy consumption is projected to increase from 23 percent in 1999 to 28 percent in 2020.
On a regional basis, China is expected to show the highest growth in gas consumption at 8.3 percent per year between 1999 and 2020, followed by Latin America with 6.3 percent. Southeast and Northeast Asia will also demonstrate rapid growth in gas demand well above the APEC average, with annual growth rates of 3.9 and 3.3 percent, respectively. The growth rate for Asia including China will be 4.6 percent per annum during the forecast period. Gas demand in North America is seen rising 1.8 percent annually, a slower rate of increase than in Asia, meaning North America�s share in total APEC natural gas consumption will fall to 44 percent in 2020 from 52 percent in 1999. Russia�s growth in natural gas consumption is forecast to increase by 2.0 percent per annum, which is below the APEC average, and gas�s share in total primary energy supply seems to be falling, but it will stay the economy most heavily dependent on natural gas, with a 45 percent dependence in 2020. Natural gas is expected to have a high share in Latin America, increasing from 19.4 percent of total primary energy supply in 1999 to 37.2 percent in 2020. In Oceania, natural gas growth is estimated to be at the APEC average at 2.6 percent per annum during the forecast period, with a stable share of gas in total primary energy supply at around 20 percent. In China, natural gas demand is forecast to grow the fastest among energy types, but it is anticipated that its share in TPES will be only 7.1 percent in 2020.
In spite of the slow expansion of natural gas use in North America and Russia, they are expected to account for 53 percent of the total rise in gas demand between 1999 and 2020. Asia�s contribution to increased natural gas consumption will be one-third of the APEC total in that period. If Russia is added to this region, another 52 to 53 percent increment is made on the western side of the Pacific. An estimated 68 percent of the increase in natural gas consumption will be in the transformation sector and another 19 percent for industrial use to meet fast-growing demand for power and for environmental protection requirements. The residential and commercial sectors are likely to account for about 12 percent of total growth until 2020. Natural gas use for transport will be minimal, contributing a mere 0.6 percent to incremental gas demand, as oil products will continue to be the main fuel in this sector.
19 IEA, World Energy Outlook 2000, 2000. 20 Energy Information Administration, International Energy Outlook 2002, March 2002.
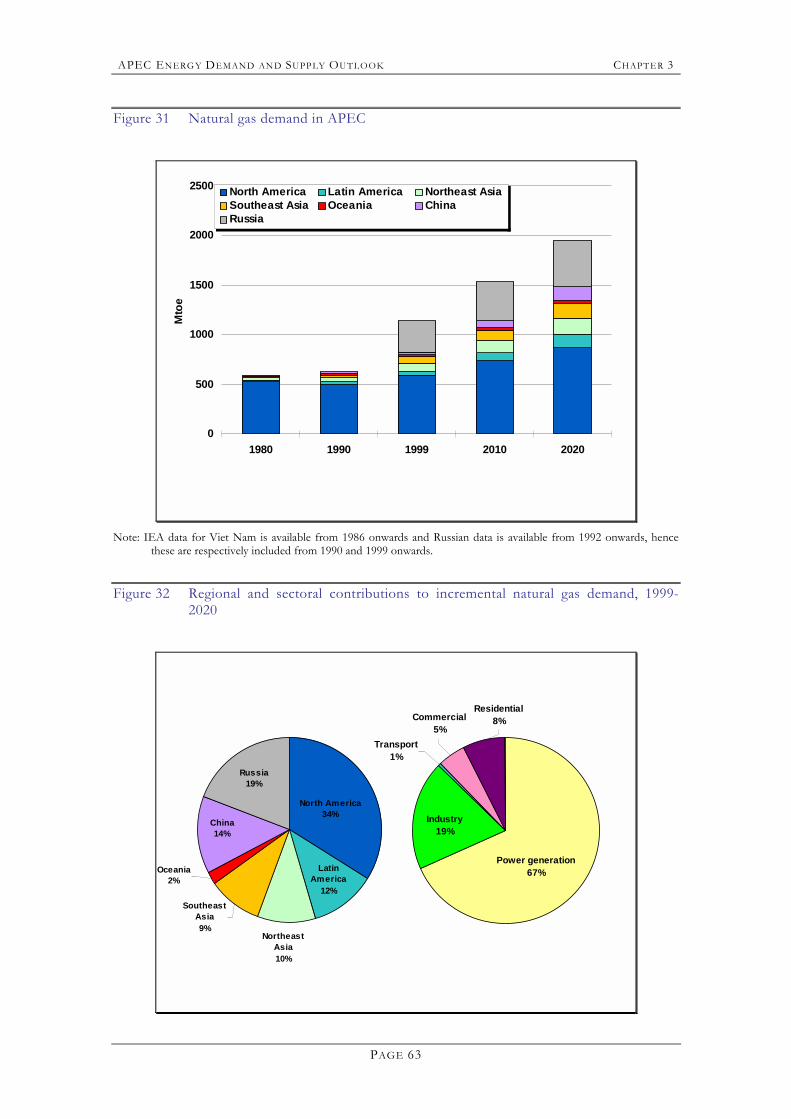
APEC ENERG Y DEMAND AN D SUPP LY OUTLOOK CHAPT ER 3
PAGE 63
Figure 31 Natural gas demand in APEC
0
500
1000
1500
2000
2500
1980 1990 1999 2010 2020
Mto
eNorth America Latin America Northeast AsiaSoutheast Asia Oceania ChinaRussia
Note: IEA data for Viet Nam is available from 1986 onwards and Russian data is available from 1992 onwards, hence
these are respectively included from 1990 and 1999 onwards.
Figure 32 Regional and sectoral contributions to incremental natural gas demand, 1999-2020
Oceania2%
Russia19%
North America34%
Latin America
12%
Northeast Asia10%
Southeast Asia9%
China14%
Transport1%
Commercial5%
Industry19%
Power generation67%
Residential8%
APEC ENERG Y DEMAND AN D SUPP LY OUTLOOK CHAPT ER 3
PAGE 64
Natural gas consumption in APEC is projected to almost double within the next two decades, and the volume consumed in 2020 is forecast to be more than triple that for 1980, naturally giving rise to concerns about whether and how this demand should be met. It is estimated that gas reserves and undiscovered resources will be sufficient to meet the consumption needs. This assumption is supported by proven reserves and recent significant discoveries. For example, it is reported that proven natural gas reserves as of January 1, 2002, worldwide were estimated at 154.5 trillion m3, which is 4.9 trillion m3 more than the estimate for 2001, with most of the increase having come from developing economies. The reserves-to-production (R/P) ratio worldwide was estimated at 61 years as of 2001.21 Also, the US Geological Survey�s most recent assessment says a huge volume of natural gas has yet to be discovered. 22 The mean estimate of worldwide undiscovered natural gas is 147.1 trillion m3. An even larger quantity of natural gas resources, ultimate remaining gas, is estimated at 450 to 530 trillion m3 by CEDIGAZ (International Centre for Information on Natural Gas).23 These figures translate into natural gas reserves and resources around four times the cumulative world consumption forecast until 2020.
Although natural gas reserves are distributed relatively more evenly across regions than oil, the majority are located in the FSU (former Soviet Union) and the Middle East, which have 72 percent of total remaining reserves. Of undiscovered resources, 50 percent are anticipated to be in those same regions. Due to the differing reserves, consumption and production of natural gas in different regions, R/P ratios are also different across regions. For instance, North America, which has been the largest producing and consuming region, has an estimated R/P ratio of only 10 years. South and Central America have an R/P ratio of 71.8 years, the FSU 79.6 years, Africa 86.2 years and the Middle East over 100 years.
The distribution of natural gas reserves and differing R/P ratios across regions imply that there should be active international trades of natural gas either through pipelines or in liquefied form. Total exports of natural gas via pipelines in 2000 were estimated at around 390 billion m3, while those as LNG were 137 billion m3.24 Among the largest exporters and importers are APEC economies: Russia, Canada, Indonesia and Malaysia as exporters; and the United States, Japan and Korea as importers. Total imports into APEC economies amounted to 41.2 percent of worldwide natural gas trade in 2000, and exports from APEC economies 60 percent. LNG imports by APEC were 76 percent of total LNG exported worldwide.
Although there are sufficient gas reserves and resources to meet growing demand for an extended period of time, gas needs to be competitive against other forms of energy in terms of economic costs and benefits, and to be accessible to consumers, in order to keep its value as a source of energy and industrial feedstock. Major determinants of its penetration include supply infrastructure, technologies for utilisation and supply, development of markets for gas products and services, and facilitating policies and regulations at both domestic and international levels.
INFRASTRUCTURE
Projects related to gas development, production and transport costing some US$70 billion are taking place in APEC and over US$90 billion more is committed or planned. More investment will be needed to meet growing demand.25 Also, development of local distribution networks is crucial for national gas markets to form and for upstream projects to proceed.
21 BP plc, BP Statistical Review of World Energy 2001, p. 24. 22 U.S. Geological Survey, World Petroleum Assessment 2000, Washington, D.C., 2000. Quoted in IEA (2000) and EIA
(2002). 23 CEDIGAZ, Natural Gas in the World: 2001 Survey. 24 CEDIGAZ quoted in BP Statistical Review of World Energy 2001, p. 28. 25 Based on APERC�s infrastructure investment database.
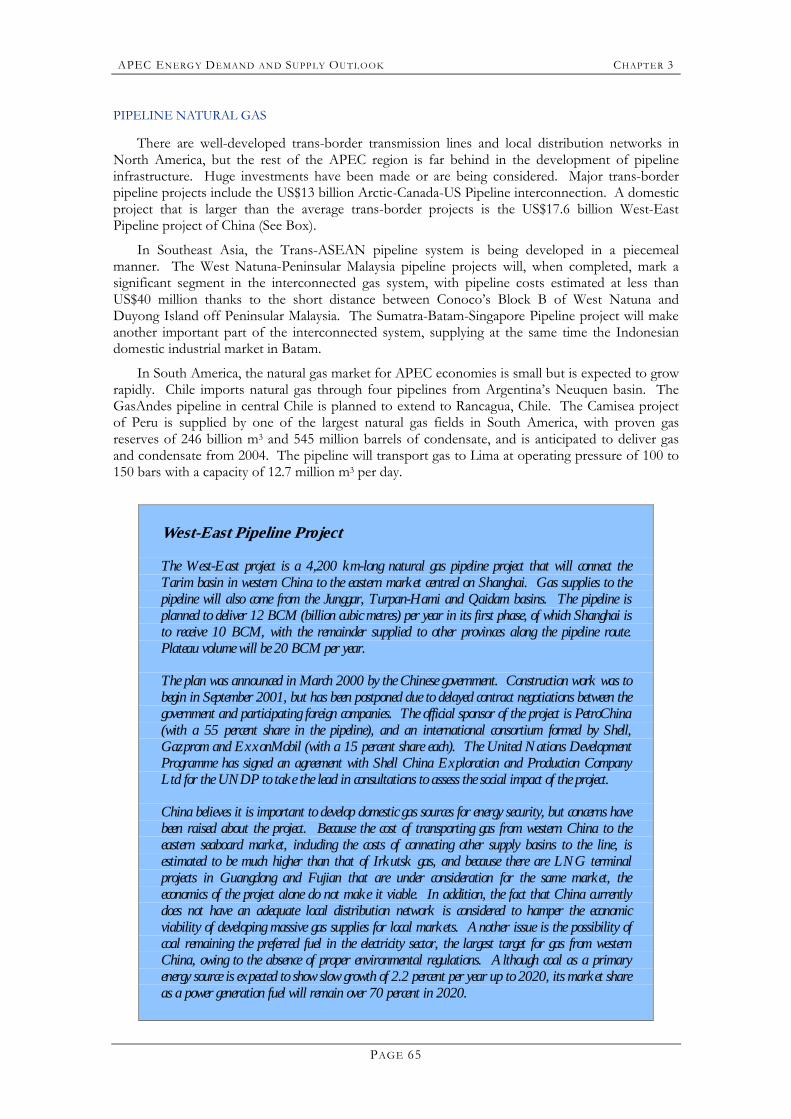
APEC ENERG Y DEMAND AN D SUPP LY OUTLOOK CHAPT ER 3
PAGE 65
PIPELINE NATURAL GAS
There are well-developed trans-border transmission lines and local distribution networks in North America, but the rest of the APEC region is far behind in the development of pipeline infrastructure. Huge investments have been made or are being considered. Major trans-border pipeline projects include the US$13 billion Arctic-Canada-US Pipeline interconnection. A domestic project that is larger than the average trans-border projects is the US$17.6 billion West-East Pipeline project of China (See Box).
In Southeast Asia, the Trans-ASEAN pipeline system is being developed in a piecemeal manner. The West Natuna-Peninsular Malaysia pipeline projects will, when completed, mark a significant segment in the interconnected gas system, with pipeline costs estimated at less than US$40 million thanks to the short distance between Conoco�s Block B of West Natuna and Duyong Island off Peninsular Malaysia. The Sumatra-Batam-Singapore Pipeline project will make another important part of the interconnected system, supplying at the same time the Indonesian domestic industrial market in Batam.
In South America, the natural gas market for APEC economies is small but is expected to grow rapidly. Chile imports natural gas through four pipelines from Argentina�s Neuquen basin. The GasAndes pipeline in central Chile is planned to extend to Rancagua, Chile. The Camisea project of Peru is supplied by one of the largest natural gas fields in South America, with proven gas reserves of 246 billion m3 and 545 million barrels of condensate, and is anticipated to deliver gas and condensate from 2004. The pipeline will transport gas to Lima at operating pressure of 100 to 150 bars with a capacity of 12.7 million m3 per day.
West-East Pipeline Project
The West-East project is a 4,200 km-long natural gas pipeline project that will connect the Tarim basin in western China to the eastern market centred on Shanghai. Gas supplies to the pipeline will also come from the Junggar, Turpan-Hami and Qaidam basins. The pipeline is planned to deliver 12 BCM (billion cubic metres) per year in its first phase, of which Shanghai is to receive 10 BCM, with the remainder supplied to other provinces along the pipeline route. Plateau volume will be 20 BCM per year.
The plan was announced in March 2000 by the Chinese government. Construction work was to begin in September 2001, but has been postponed due to delayed contract negotiations between the government and participating foreign companies. The official sponsor of the project is PetroChina (with a 55 percent share in the pipeline), and an international consortium formed by Shell, Gazprom and ExxonMobil (with a 15 percent share each). The United Nations Development Programme has signed an agreement with Shell China Exploration and Production Company Ltd for the UNDP to take the lead in consultations to assess the social impact of the project.
China believes it is important to develop domestic gas sources for energy security, but concerns have been raised about the project. Because the cost of transporting gas from western China to the eastern seaboard market, including the costs of connecting other supply basins to the line, is estimated to be much higher than that of Irkutsk gas, and because there are LNG terminal projects in Guangdong and Fujian that are under consideration for the same market, the economics of the project alone do not make it viable. In addition, the fact that China currently does not have an adequate local distribution network is considered to hamper the economic viability of developing massive gas supplies for local markets. Another issue is the possibility of coal remaining the preferred fuel in the electricity sector, the largest target for gas from western China, owing to the absence of proper environmental regulations. Although coal as a primary energy source is expected to show slow growth of 2.2 percent per year up to 2020, its market share as a power generation fuel will remain over 70 percent in 2020.
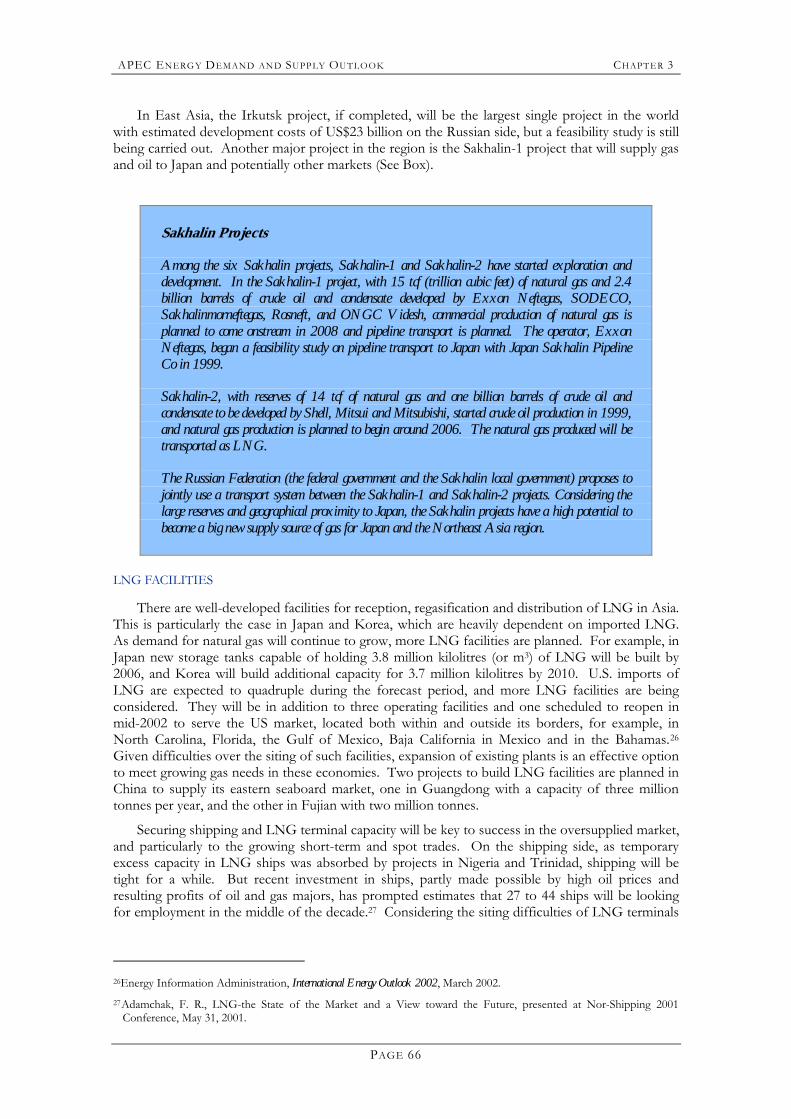
APEC ENERG Y DEMAND AN D SUPP LY OUTLOOK CHAPT ER 3
PAGE 66
In East Asia, the Irkutsk project, if completed, will be the largest single project in the world with estimated development costs of US$23 billion on the Russian side, but a feasibility study is still being carried out. Another major project in the region is the Sakhalin-1 project that will supply gas and oil to Japan and potentially other markets (See Box).
Sakhalin Projects
Among the six Sakhalin projects, Sakhalin-1 and Sakhalin-2 have started exploration and development. In the Sakhalin-1 project, with 15 tcf (trillion cubic feet) of natural gas and 2.4 billion barrels of crude oil and condensate developed by Exxon Neftegas, SODECO, Sakhalinmorneftegas, Rosneft, and ONGC Videsh, commercial production of natural gas is planned to come onstream in 2008 and pipeline transport is planned. The operator, Exxon Neftegas, began a feasibility study on pipeline transport to Japan with Japan Sakhalin Pipeline Co in 1999.
Sakhalin-2, with reserves of 14 tcf of natural gas and one billion barrels of crude oil and condensate to be developed by Shell, Mitsui and Mitsubishi, started crude oil production in 1999, and natural gas production is planned to begin around 2006. The natural gas produced will be transported as LNG.
The Russian Federation (the federal government and the Sakhalin local government) proposes to jointly use a transport system between the Sakhalin-1 and Sakhalin-2 projects. Considering the large reserves and geographical proximity to Japan, the Sakhalin projects have a high potential to become a big new supply source of gas for Japan and the Northeast Asia region.
LNG FACILITIES
There are well-developed facilities for reception, regasification and distribution of LNG in Asia. This is particularly the case in Japan and Korea, which are heavily dependent on imported LNG. As demand for natural gas will continue to grow, more LNG facilities are planned. For example, in Japan new storage tanks capable of holding 3.8 million kilolitres (or m3) of LNG will be built by 2006, and Korea will build additional capacity for 3.7 million kilolitres by 2010. U.S. imports of LNG are expected to quadruple during the forecast period, and more LNG facilities are being considered. They will be in addition to three operating facilities and one scheduled to reopen in mid-2002 to serve the US market, located both within and outside its borders, for example, in North Carolina, Florida, the Gulf of Mexico, Baja California in Mexico and in the Bahamas.26 Given difficulties over the siting of such facilities, expansion of existing plants is an effective option to meet growing gas needs in these economies. Two projects to build LNG facilities are planned in China to supply its eastern seaboard market, one in Guangdong with a capacity of three million tonnes per year, and the other in Fujian with two million tonnes.
Securing shipping and LNG terminal capacity will be key to success in the oversupplied market, and particularly to the growing short-term and spot trades. On the shipping side, as temporary excess capacity in LNG ships was absorbed by projects in Nigeria and Trinidad, shipping will be tight for a while. But recent investment in ships, partly made possible by high oil prices and resulting profits of oil and gas majors, has prompted estimates that 27 to 44 ships will be looking for employment in the middle of the decade.27 Considering the siting difficulties of LNG terminals
26Energy Information Administration, International Energy Outlook 2002, March 2002. 27Adamchak, F. R., LNG-the State of the Market and a View toward the Future, presented at Nor-Shipping 2001
Conference, May 31, 2001.
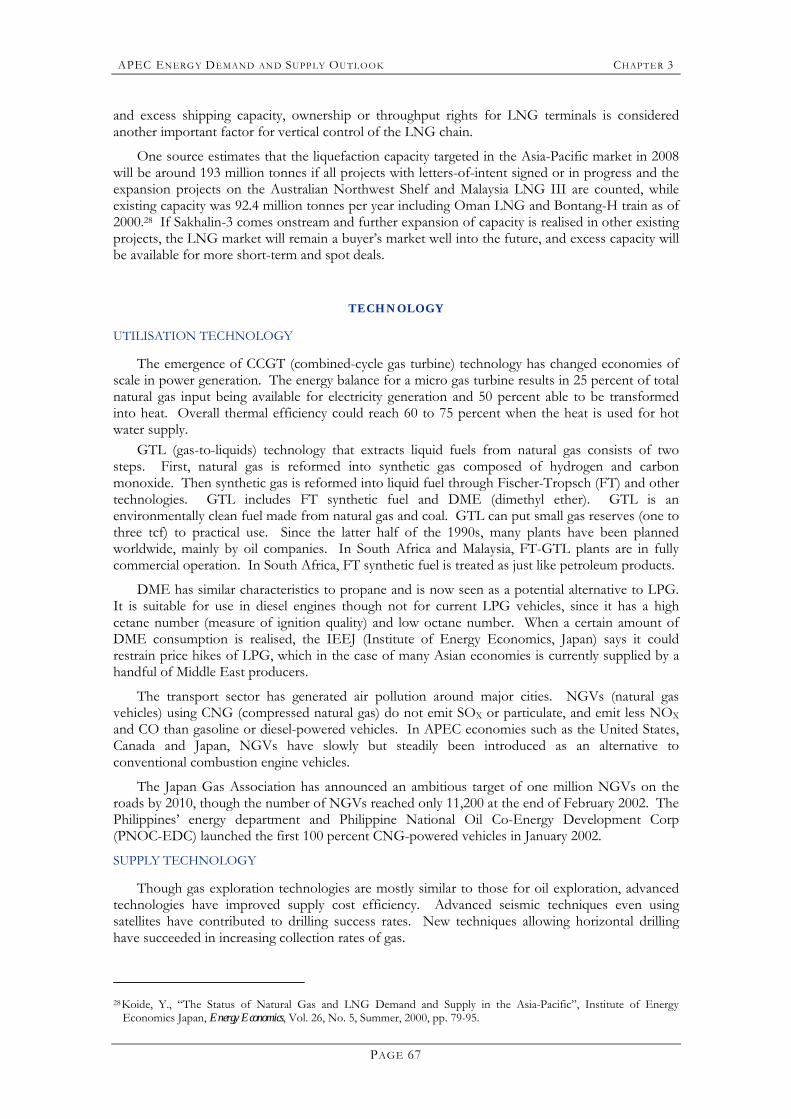
APEC ENERG Y DEMAND AN D SUPP LY OUTLOOK CHAPT ER 3
PAGE 67
and excess shipping capacity, ownership or throughput rights for LNG terminals is considered another important factor for vertical control of the LNG chain.
One source estimates that the liquefaction capacity targeted in the Asia-Pacific market in 2008 will be around 193 million tonnes if all projects with letters-of-intent signed or in progress and the expansion projects on the Australian Northwest Shelf and Malaysia LNG III are counted, while existing capacity was 92.4 million tonnes per year including Oman LNG and Bontang-H train as of 2000.28 If Sakhalin-3 comes onstream and further expansion of capacity is realised in other existing projects, the LNG market will remain a buyer�s market well into the future, and excess capacity will be available for more short-term and spot deals.
TECHNOLOGY
UTILISATION TECHNOLOGY
The emergence of CCGT (combined-cycle gas turbine) technology has changed economies of scale in power generation. The energy balance for a micro gas turbine results in 25 percent of total natural gas input being available for electricity generation and 50 percent able to be transformed into heat. Overall thermal efficiency could reach 60 to 75 percent when the heat is used for hot water supply.
GTL (gas-to-liquids) technology that extracts liquid fuels from natural gas consists of two steps. First, natural gas is reformed into synthetic gas composed of hydrogen and carbon monoxide. Then synthetic gas is reformed into liquid fuel through Fischer-Tropsch (FT) and other technologies. GTL includes FT synthetic fuel and DME (dimethyl ether). GTL is an environmentally clean fuel made from natural gas and coal. GTL can put small gas reserves (one to three tcf) to practical use. Since the latter half of the 1990s, many plants have been planned worldwide, mainly by oil companies. In South Africa and Malaysia, FT-GTL plants are in fully commercial operation. In South Africa, FT synthetic fuel is treated as just like petroleum products.
DME has similar characteristics to propane and is now seen as a potential alternative to LPG. It is suitable for use in diesel engines though not for current LPG vehicles, since it has a high cetane number (measure of ignition quality) and low octane number. When a certain amount of DME consumption is realised, the IEEJ (Institute of Energy Economics, Japan) says it could restrain price hikes of LPG, which in the case of many Asian economies is currently supplied by a handful of Middle East producers.
The transport sector has generated air pollution around major cities. NGVs (natural gas vehicles) using CNG (compressed natural gas) do not emit SOX or particulate, and emit less NOX and CO than gasoline or diesel-powered vehicles. In APEC economies such as the United States, Canada and Japan, NGVs have slowly but steadily been introduced as an alternative to conventional combustion engine vehicles.
The Japan Gas Association has announced an ambitious target of one million NGVs on the roads by 2010, though the number of NGVs reached only 11,200 at the end of February 2002. The Philippines� energy department and Philippine National Oil Co-Energy Development Corp (PNOC-EDC) launched the first 100 percent CNG-powered vehicles in January 2002.
SUPPLY TECHNOLOGY
Though gas exploration technologies are mostly similar to those for oil exploration, advanced technologies have improved supply cost efficiency. Advanced seismic techniques even using satellites have contributed to drilling success rates. New techniques allowing horizontal drilling have succeeded in increasing collection rates of gas.
28Koide, Y., �The Status of Natural Gas and LNG Demand and Supply in the Asia-Pacific�, Institute of Energy
Economics Japan, Energy Economics, Vol. 26, No. 5, Summer, 2000, pp. 79-95.
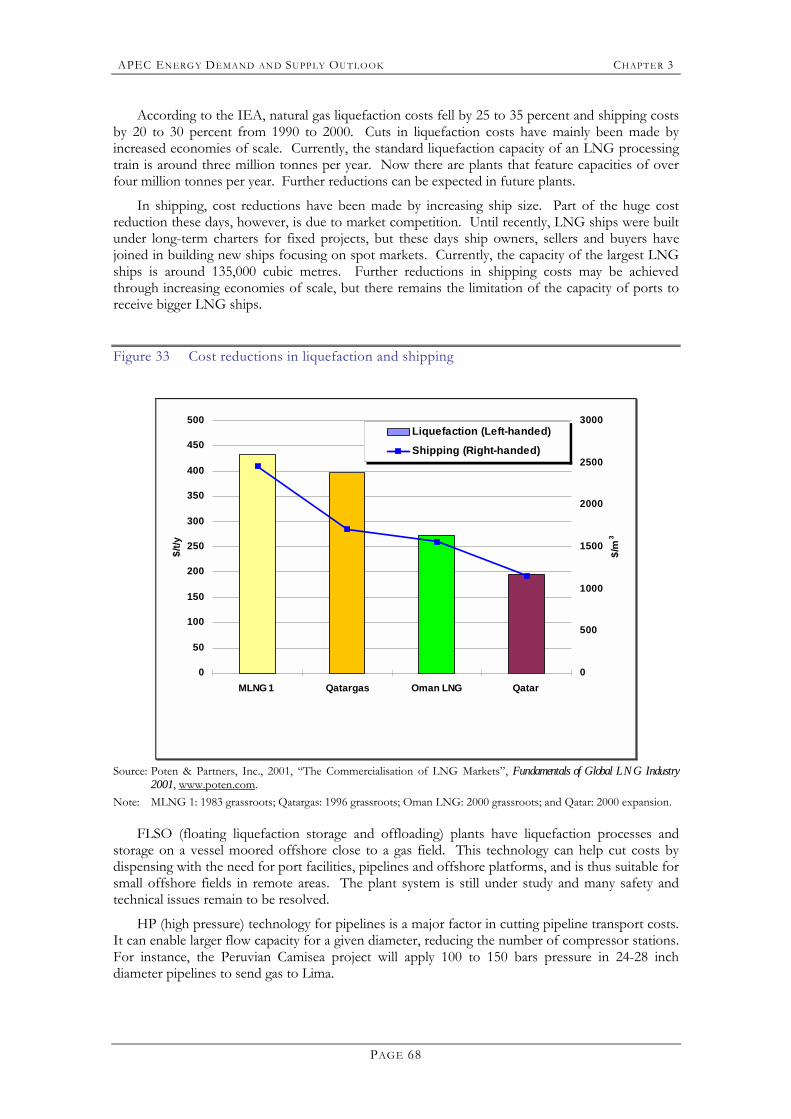
APEC ENERG Y DEMAND AN D SUPP LY OUTLOOK CHAPT ER 3
PAGE 68
According to the IEA, natural gas liquefaction costs fell by 25 to 35 percent and shipping costs by 20 to 30 percent from 1990 to 2000. Cuts in liquefaction costs have mainly been made by increased economies of scale. Currently, the standard liquefaction capacity of an LNG processing train is around three million tonnes per year. Now there are plants that feature capacities of over four million tonnes per year. Further reductions can be expected in future plants.
In shipping, cost reductions have been made by increasing ship size. Part of the huge cost reduction these days, however, is due to market competition. Until recently, LNG ships were built under long-term charters for fixed projects, but these days ship owners, sellers and buyers have joined in building new ships focusing on spot markets. Currently, the capacity of the largest LNG ships is around 135,000 cubic metres. Further reductions in shipping costs may be achieved through increasing economies of scale, but there remains the limitation of the capacity of ports to receive bigger LNG ships.
Figure 33 Cost reductions in liquefaction and shipping
0
50
100
150
200
250
300
350
400
450
500
MLNG 1 Qatargas Oman LNG Qatar
$/t/y
0
500
1000
1500
2000
2500
3000
$/m
3
Liquefaction (Left-handed)
Shipping (Right-handed)
Source: Poten & Partners, Inc., 2001, �The Commercialisation of LNG Markets�, Fundamentals of Global LNG Industry
2001, www.poten.com. Note: MLNG 1: 1983 grassroots; Qatargas: 1996 grassroots; Oman LNG: 2000 grassroots; and Qatar: 2000 expansion.
FLSO (floating liquefaction storage and offloading) plants have liquefaction processes and storage on a vessel moored offshore close to a gas field. This technology can help cut costs by dispensing with the need for port facilities, pipelines and offshore platforms, and is thus suitable for small offshore fields in remote areas. The plant system is still under study and many safety and technical issues remain to be resolved.
HP (high pressure) technology for pipelines is a major factor in cutting pipeline transport costs. It can enable larger flow capacity for a given diameter, reducing the number of compressor stations. For instance, the Peruvian Camisea project will apply 100 to 150 bars pressure in 24-28 inch diameter pipelines to send gas to Lima.
APEC ENERG Y DEMAND AN D SUPP LY OUTLOOK CHAPT ER 3
PAGE 69
DEVELOPMENT OF MARKETS
While a natural gas infrastructure provides for gas to be produced and transported, technological developments enhance the competitiveness of gas by providing a better service at the same cost or the same service at a lower cost. But without a well-developed market, desires of sellers/suppliers and buyers/consumers cannot be efficiently fulfilled. Markets for natural gas may be divided into international and internal markets, and into those where natural gas competes with other fuels and those where gas-to-gas competition occurs. But they are so closely interdependent that all segments facilitate or constrain each other.
The development of competitive gas markets and the high price of gas have made LNG competitive with pipeline gas in the United States. Due to the easy availability of LNG and the competitive nature of the market for gas, US LNG imports grew from 72 cargoes in 1999 to 100 cargoes in 2000, of which 39 were based on spot deals. Japan�s superdeals29 increased continuously from the early 1980s to a high of 2.55 million tonnes in 1992 and 1993, but had tumbled to 250,000 tonnes by 1999. Korea�s superdeal volume reached its peak of 5.13 million tonnes in 1997, falling to 4.15 million tonnes in 1999. It had purchased a total of 18 spot cargoes by the end of 2000, amounting to one million tonnes.
It appears that the LNG market, though not so structured as others at present, has begun developing into a spot delivery market. And although slower than in the Atlantic, spot LNG trade is expected to grow rapidly in the Asia-Pacific market, with the majority of gas trade still anchored on long-term contracts. As major LNG importing economies such as Japan and Korea move forward to competitive national markets for power and gas, LNG trading patterns will respond to buyers� changing needs in risk management by allowing more flexibility in gas purchases. Australia�s Northwest Shelf expansion project is reported to be considering short-term provisions to meet Japanese buyers� needs. Also, Japan�s third-largest electricity utility, Chubu Electric, recently signed a spot contract with Malaysia�s PETRONAS that runs to the end of 2004 on an if-and-when-needed basis.
Although the development of more flexible short-term and spot deals in the LNG market is an important factor for facilitating competition − both for gas-to-gas and gas-to-other fuels − a well-developed local distribution network is also crucial in internal markets of importing economies. Japan has well-developed local networks, but because they are regionally segregated, a competitive national gas market is hard to build, at least at the moment. Under-development of distribution networks hinders gas penetration, not only by making it impossible to physically distribute gas but also by restricting the development of the market. Another result of distribution networks being less developed is that delivery costs are kept high, which reduces the price competitiveness of natural gas. Higher delivery prices mean lower consumption and a smaller market for natural gas, making upstream projects less economic (See Box for West-East pipeline project).
Another vital element for the development of markets is the construction and commercial use of gas storage in the downstream market.30 Although a major role of gas storage lies in traditional utility functions such as matching supply to demand and supporting system operations, commercial functions that are more directly aimed at profits have been developed in some economies in APEC and the EU. This was made possible by market liberalisation and the unbundling of supply and sales businesses. In the United States, marketers effectively controlled about a quarter of total storage capacity during the 2000-01 storage year despite not owning any capacity. They invented a Pareto-improving scheme31 called an agency agreement under which marketers and capacity owners share supply obligations and profits utilising storage capacity. As the price of gas becomes more volatile following liberalisation, there are more chances to make profits for those controlling gas 29 A superdeal is a long-term contract between buyers and sellers, typically of one to five years duration, that allows for
the uptake of cargoes of LNG up to the contracted limit with the contract period. The last superdeal ended in 1999. Spot trades increased as the market evolved.
30 APERC, Gas Storage in the APEC Region: Development of Commercial Structure, 2002. 31 The welfare of at least one individual improves without any deterioration in the welfare of others.
APEC ENERG Y DEMAND AN D SUPP LY OUTLOOK CHAPT ER 3
PAGE 70
storage capacity through time and location-based price arbitrage. This type of commercial use of storage not only helps stabilise gas prices but also makes them send correct price signals. Japan and Korea aim to adopt more commercially oriented gas trading arrangements. It is anticipated that shorter-term or spot deals of gas will play a more significant part in both upstream and downstream gas markets.
GOVERNMENT POLICIES AND OTHER ISSUES
Government industrial policies have a great impact on the market penetration of gas. For instance, mandated third-party access or open access to essential facilities such as LNG terminals, pipelines and storage allows both suppliers and consumers easier access to the gas market, facilitating the substitution of natural gas for other fuels. Increased gas-to-gas competition means existing facilities are used more efficiently and gas supply costs are reduced. It also implies higher profits for facility owners, attracting more participants to the market.
Liberalisation of gas markets enhances commercial use of facilities. As the market operates on a more commercial basis with private players seeking profits, however, security of supply is likely to depend on what the market allows. Demand will tend to be met with minimal facilities. The most important reason is that natural gas is a premium fuel and gas storage is highly capital-intensive (See Box). Trading of storage capacity and gas at a regional level may help alleviate concerns about security and price stability.
Preferential tax and financial treatment of natural gas can also attract more suppliers and consumers. But governments will find it more difficult to adopt differential fiscal and financial treatment for a specific energy source or group of market participants, as the diverse energy sources compete fiercely and the energy market becomes more integrated at both the regional and global levels. Market participants argue for level playing fields � a view endorsed by APEC energy ministers in 1998.32
From the perspective of governments being rule setters and hence partly determining the costs and benefits of economic activities, the most influential factor for natural gas penetration seems to be government policies related to the environment. With abundant reserves and developing technologies for production and utilisation, natural gas has the brightest future of all types of energy. However, if environmental standards are lowered or there is loose monitoring and enforcement of them, this would lower the social costs of polluting and reduce the benefits of environmentally benign activities, putting natural gas at a disadvantage against other fossil fuels.
Natural Gas Storage and Gas Stockpiling
Natural gas is a premium fuel. It sometimes takes multi-billion dollar projects to produce gas and transport it to markets. When natural gas is transported as LNG, it is at least eight times as expensive as oil per unit amount of energy.
Based on data from different sources, the investment cost of LNG storage tanks alone is in the order of eight to 10 times higher than for crude oil storage, and around three times higher than for oil product storage on a unit energy basis. Investment costs for underground gas storage increase rapidly depending on whether depleted reservoirs, aquifers or salt cavities are used. Construction costs of depleted reservoir storage are comparable to those of a crude oil storage facility, and those of aquifer storage are comparable to oil product storage. Yet the costs for salt cavity facilities are two to three times higher than for depleted reservoir facilities.
32�Recommendations Concerning Accelerating Investment in Natural Gas Supplies, Infrastructure and Trading Networks
in the APEC Region� endorsed by APEC Energy Ministers at their third meeting in Okinawa, Japan in October 1998.

APEC ENERG Y DEMAND AN D SUPP LY OUTLOOK CHAPT ER 3
PAGE 71
It is true that for a long time underground gas storage was developed for strategic reasons, to provide access to gas in case of shortages, especially in the event of war or conflicts. But as gas has become popular and its consumption has grown rapidly, more emphasis has been put on the role of gas storage in meeting peak demand and enabling economies in the gas supply chain. Gas that can be stored in a depleted reservoir typically ranges from 300,000 to five million toe, and for aquifer storage it is 200,000 to three million toe, which are comparable to the capacity of an average oil storage site. A salt cavity typically stores 50,000 to 500,000 toe of gas. Operating costs for gas storage are high. But that may not be crucial if gas is to be stockpiled for contingency purposes only, since stockpiling does not require high turnovers of the stored gas.
The high cost of investment needed for gas storage implies a huge opportunity cost for utilising storage facilities for stockpiling purposes. Unless the risk premium for gas supply disruption is sufficiently large, gas stockpiling does not seem to be a viable option relative to oil stockpiling. Natural gas being a premium fuel, the market seems to compensate for high operating costs arising from high turnover as well as high fixed costs. Facilities with high deliverability and high turn-around capability are valued more in the liberalised gas market.
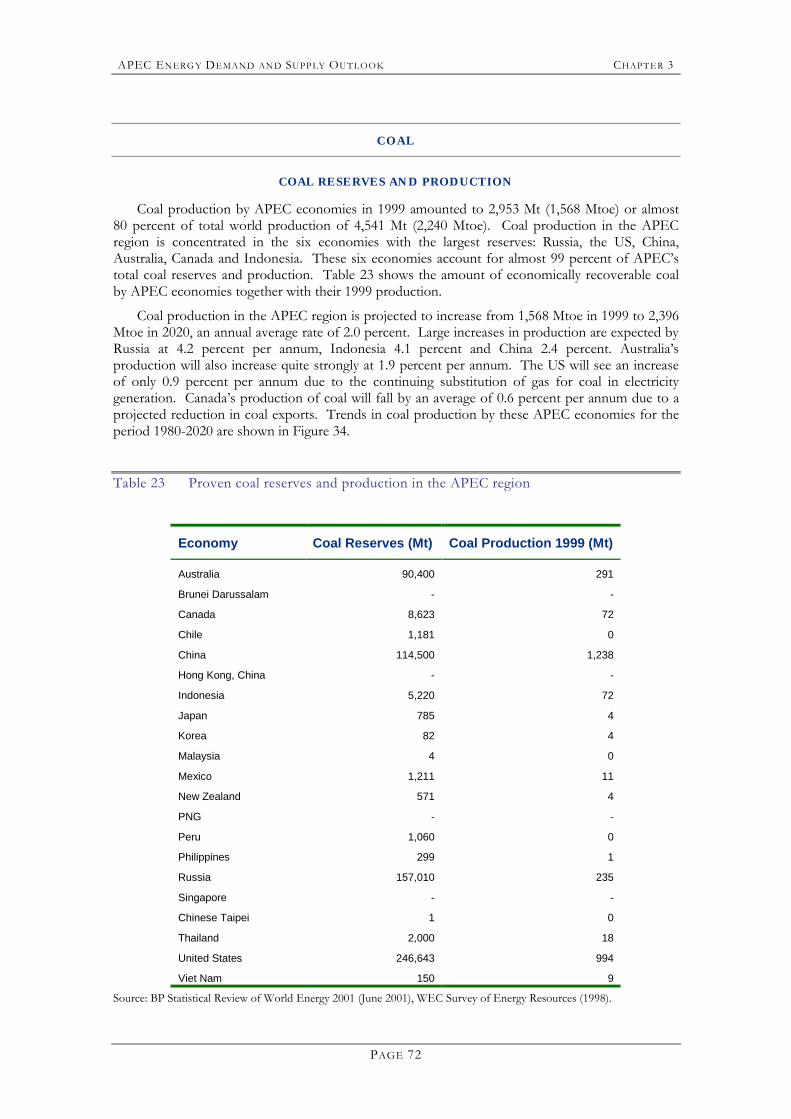
APEC ENERG Y DEMAND AN D SUPP LY OUTLOOK CHAPT ER 3
PAGE 72
COAL
COAL RESERVES AND PRODUCTION
Coal production by APEC economies in 1999 amounted to 2,953 Mt (1,568 Mtoe) or almost 80 percent of total world production of 4,541 Mt (2,240 Mtoe). Coal production in the APEC region is concentrated in the six economies with the largest reserves: Russia, the US, China, Australia, Canada and Indonesia. These six economies account for almost 99 percent of APEC�s total coal reserves and production. Table 23 shows the amount of economically recoverable coal by APEC economies together with their 1999 production.
Coal production in the APEC region is projected to increase from 1,568 Mtoe in 1999 to 2,396 Mtoe in 2020, an annual average rate of 2.0 percent. Large increases in production are expected by Russia at 4.2 percent per annum, Indonesia 4.1 percent and China 2.4 percent. Australia�s production will also increase quite strongly at 1.9 percent per annum. The US will see an increase of only 0.9 percent per annum due to the continuing substitution of gas for coal in electricity generation. Canada�s production of coal will fall by an average of 0.6 percent per annum due to a projected reduction in coal exports. Trends in coal production by these APEC economies for the period 1980-2020 are shown in Figure 34.
Table 23 Proven coal reserves and production in the APEC region
Economy Coal Reserves (Mt) Coal Production 1999 (Mt)
Australia 90,400 291
Brunei Darussalam - -
Canada 8,623 72
Chile 1,181 0
China 114,500 1,238
Hong Kong, China - -
Indonesia 5,220 72
Japan 785 4
Korea 82 4
Malaysia 4 0
Mexico 1,211 11
New Zealand 571 4
PNG - -
Peru 1,060 0
Philippines 299 1
Russia 157,010 235
Singapore - -
Chinese Taipei 1 0
Thailand 2,000 18
United States 246,643 994
Viet Nam 150 9
Source: BP Statistical Review of World Energy 2001 (June 2001), WEC Survey of Energy Resources (1998).
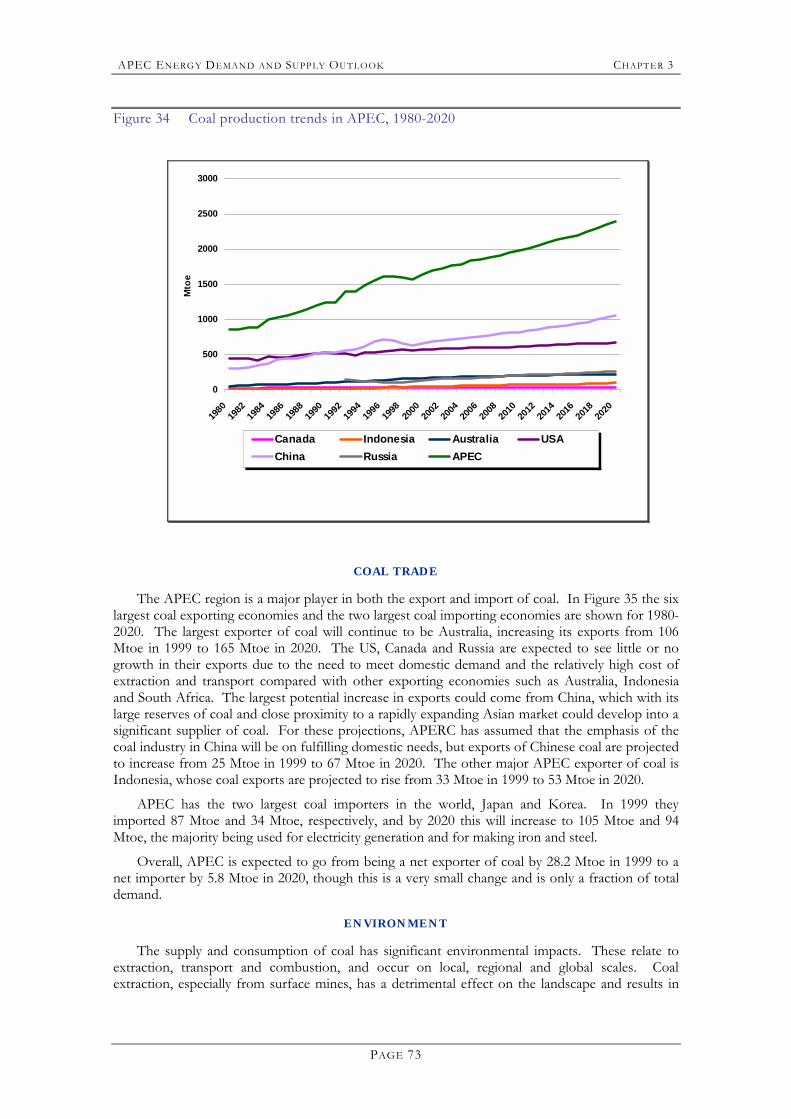
APEC ENERG Y DEMAND AN D SUPP LY OUTLOOK CHAPT ER 3
PAGE 73
Figure 34 Coal production trends in APEC, 1980-2020
0
500
1000
1500
2000
2500
3000
1980
1982
1984
1986
1988
1990
1992
1994
1996
1998
2000
2002
2004
2006
2008
2010
2012
2014
2016
2018
2020
Mto
e
Canada Indonesia Australia USAChina Russia APEC
COAL TRADE
The APEC region is a major player in both the export and import of coal. In Figure 35 the six largest coal exporting economies and the two largest coal importing economies are shown for 1980-2020. The largest exporter of coal will continue to be Australia, increasing its exports from 106 Mtoe in 1999 to 165 Mtoe in 2020. The US, Canada and Russia are expected to see little or no growth in their exports due to the need to meet domestic demand and the relatively high cost of extraction and transport compared with other exporting economies such as Australia, Indonesia and South Africa. The largest potential increase in exports could come from China, which with its large reserves of coal and close proximity to a rapidly expanding Asian market could develop into a significant supplier of coal. For these projections, APERC has assumed that the emphasis of the coal industry in China will be on fulfilling domestic needs, but exports of Chinese coal are projected to increase from 25 Mtoe in 1999 to 67 Mtoe in 2020. The other major APEC exporter of coal is Indonesia, whose coal exports are projected to rise from 33 Mtoe in 1999 to 53 Mtoe in 2020.
APEC has the two largest coal importers in the world, Japan and Korea. In 1999 they imported 87 Mtoe and 34 Mtoe, respectively, and by 2020 this will increase to 105 Mtoe and 94 Mtoe, the majority being used for electricity generation and for making iron and steel.
Overall, APEC is expected to go from being a net exporter of coal by 28.2 Mtoe in 1999 to a net importer by 5.8 Mtoe in 2020, though this is a very small change and is only a fraction of total demand.
ENVIRONMENT
The supply and consumption of coal has significant environmental impacts. These relate to extraction, transport and combustion, and occur on local, regional and global scales. Coal extraction, especially from surface mines, has a detrimental effect on the landscape and results in
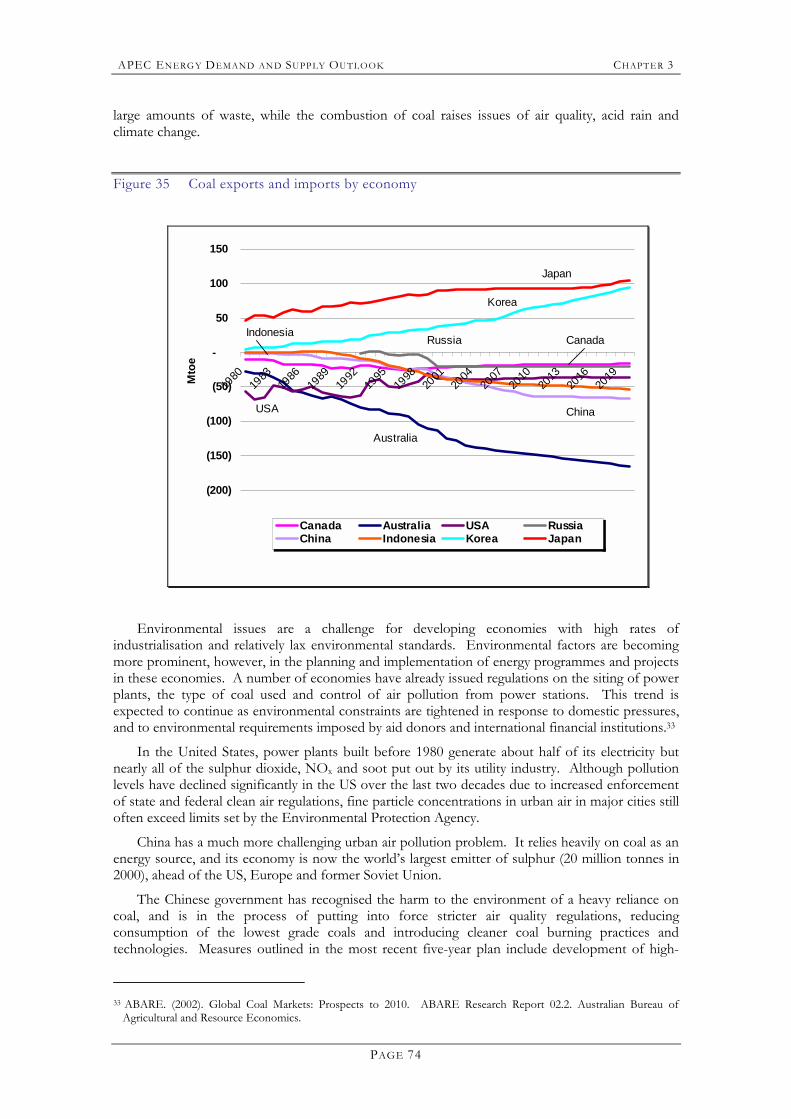
APEC ENERG Y DEMAND AN D SUPP LY OUTLOOK CHAPT ER 3
PAGE 74
large amounts of waste, while the combustion of coal raises issues of air quality, acid rain and climate change.
Figure 35 Coal exports and imports by economy
(200)
(150)
(100)
(50)
-
50
100
150
1980
1983
1986
1989
1992
1995
1998
2001
2004
2007
2010
2013
2016
2019M
toe
Canada Australia USA RussiaChina Indonesia Korea Japan
Japan
Korea
Australia
RussiaIndonesia
China
Canada
USA
Environmental issues are a challenge for developing economies with high rates of industrialisation and relatively lax environmental standards. Environmental factors are becoming more prominent, however, in the planning and implementation of energy programmes and projects in these economies. A number of economies have already issued regulations on the siting of power plants, the type of coal used and control of air pollution from power stations. This trend is expected to continue as environmental constraints are tightened in response to domestic pressures, and to environmental requirements imposed by aid donors and international financial institutions.33
In the United States, power plants built before 1980 generate about half of its electricity but nearly all of the sulphur dioxide, NOx and soot put out by its utility industry. Although pollution levels have declined significantly in the US over the last two decades due to increased enforcement of state and federal clean air regulations, fine particle concentrations in urban air in major cities still often exceed limits set by the Environmental Protection Agency.
China has a much more challenging urban air pollution problem. It relies heavily on coal as an energy source, and its economy is now the world�s largest emitter of sulphur (20 million tonnes in 2000), ahead of the US, Europe and former Soviet Union.
The Chinese government has recognised the harm to the environment of a heavy reliance on coal, and is in the process of putting into force stricter air quality regulations, reducing consumption of the lowest grade coals and introducing cleaner coal burning practices and technologies. Measures outlined in the most recent five-year plan include development of high-
33 ABARE. (2002). Global Coal Markets: Prospects to 2010. ABARE Research Report 02.2. Australian Bureau of
Agricultural and Resource Economics.
APEC ENERG Y DEMAND AN D SUPP LY OUTLOOK CHAPT ER 3
PAGE 75
grade coal resources, exploration for oil and natural gas resources, promotion of oil and gas imports, exploitation of available renewable energy resources, encouragement of energy efficiency practices and technologies, and construction of a unified national power network.34
Despite the imposition of policies and measures to reduce the environmental effects of coal combustion, APERC expects coal demand to continue to grow strongly throughout the period in the APEC region.
This finding is similar to that published by ABARE, 35 in which a climate change policy framework was adopted that assumed agreements would be maintained on sinks, a clean development mechanism and international emissions trading that were reached in resumed negotiations at the sixth Conference of the Parties held in Bonn in July 2001. It also assumed that the United States and Canada would not ratify the Kyoto Protocol. Under this framework the simulation indicated that implementation of climate change policies would cause global coal demand to fall, though the net overall impact would be a decline of only two percent.
Coal, having the highest carbon content on an energy value basis, is hardest hit by any carbon penalty. Coal consumption in Annex B countries where emission abatement policies are implemented is projected to fall by 9.3 percent relative to the reference case in 2010. Coal consumption in the United States, Canada and non-Annex B countries will rise as a result of carbon leakage. Based on the findings of this study, the only economies within APEC that would see a reduction in their demand for coal would be Australia, Japan and New Zealand. Russia, although a large consumer of coal, will easily meet its Kyoto target without the need for any climate change policies. Other APEC economies, especially those which may benefit from carbon leakage, could actually see an increase in demand for coal over the reference case.
COAL TECHNOLOGY
There is no denying that coal is plentiful and very cost-competitive in Asian power markets, and it could continue to provide a large percentage of the primary energy consumed by the electricity generation sector, which is needed to underpin the region�s rapid socio-economic development.
It is also clear that rapidly industrialising economies that rely heavily on coal for power generation and other direct energy use are bearing substantial environmental costs from this practice. This is especially true where low-grade coal is widely used, and where regulations do not provide adequate control over emissions.
Growing demand for clean energy will affect the willingness of investors to put capital into further expansion of coal production capabilities as importers look to cleaner fuels. It will also promote dissemination of technologies for clean coal power generation.
Coal has a high carbon content, but clean coal technologies can lower the carbon emission rate relative to current technologies, such as pulverised coal boilers. For example, a pulverised coal boiler operating at 34 percent efficiency has a carbon emission rate of 260 g/kWh (grams per kilowatt-hour), while an integrated coal gasification combined cycle (IGCC) facility operating at 42 percent efficiency produces 20 percent less carbon, or 210 g/kWh.
For every GWh (gigawatt-hour) of electricity generated by IGCC, 50 tonnes of carbon could be avoided, compared with the emissions from a pulverised coal boiler. By 2020, advanced coal-fired plants may achieve 60 percent efficiency through R&D, reducing their carbon emission rate to 150 g/kWh, and saving 110 tonnes per GWh.36
34 http://www.chinadaily.com.cn 35 ABARE. (2002). Global Coal Markets: Prospects to 2010. ABARE Research Report 02.2. Australian Bureau of
Agricultural and Resource Economics. 36 US DOE. (2002). Scenarios for a Clean Energy Future. Inter-laboratory Working Group on Energy-Efficient and
Clean-Energy Technologies. Prepared for the Office of Energy Efficiency and Renewable Energy, US Department of Energy.
APEC ENERG Y DEMAND AN D SUPP LY OUTLOOK CHAPT ER 3
PAGE 76
Advanced clean coal power generation technologies such as IGCC are still at a pre-commercial stage of development, and so their capital and operating costs are still non-competitive and suffer a technology risk premium. There are three IGCC demonstration plants currently in operation or under construction in the US, so the rapid commercialisation and dissemination of such technology is still some way off.
Prof Zhou Fengqi, in his presentation to the APERC Annual Conference, 37 stated that although coal will continue to be the main source of primary energy in China for many years to come, the installation of clean coal technologies will be a high priority. These include coal washing and widespread adoption of cyclic fluidised combustion processes, as well as installation of flue gas processes to remove sulphur, nitrogen and particulate matter.
Amid growing concern over the impact of fossil fuel extraction and combustion, a growing number of governments and companies have stepped up research into so-called �clean coal technologies�. For example, the US in its National Energy Policy Report of May 2001 recommended that US$2 billion be provided over 10 years for research into clean coal technologies.
Clean Coal Technologies are a family of new technological innovations that are environmentally superior to the technologies in common use today. They consist of new combustion processes � such as fluidised bed combustion and low NOx burners � that remove pollutants, or prevent them from forming, while the coal burns. They can be new pollution control technologies that clean pollutants from flue gases before they exit a smokestack. They also include new processes that convert coal into other energy forms that can be cleaned before being combusted, for example, converting coal into a gas that has the same environmental characteristics as clean-burning natural gas (Department of Energy 2001).
SUPERCRITICAL STEAM CYCLES
At present, sub-critical steam cycles are the dominant coal technology for electricity generation. The process of converting heat from fuel into electricity is operated well below the steam/water critical pressure of 221.2 bar. By increasing the operating temperature and pressure, greater thermal and environmental efficiency can be obtained.
Current supercritical power plants can achieve efficiencies of around 45 percent (LHV, or lower heating value), though steam temperatures and efficiency have gradually increased. State-of-the-art plants are expected to operate at 620 °C within the next few years, and by 2020 may have achieved temperatures of 650-700 °C and efficiencies in the range of 50-55 percent (LHV) (DTI 1999).
FLUIDISED BED COMBUSTORS
Fluidised bed combustors remove pollutants inside the boiler, with no scrubber or post combustion sulphur and nitrogen controls needed. Rather than burning coal as a blown-in powder, fluidised beds mix pulverised coal with limestone and suspend the mixture on jets of air in a floating �bed�. The limestone removes sulphur as it is released from the burning coal and converts it to an environmentally benign powder. The process also reduces the temperature of combustion below the threshold where large amounts of NOx form.
This technology can be used for a wide range of variable quality fuels and wastes. The fluidised bed can be fuelled with low-quality coals, washing wastes, sewage sludge, municipal waste and tyres.
Pressurised Fluidised Bed technology operates at increased pressures and enables sufficient generation of flue gas energy to drive a gas turbine, which is recovered before being released into the atmosphere. Electricity is therefore generated from both the gas turbine and the conventional steam turbine, raising the thermal efficiency by around 10 percent above conventional coal-fired technology, which does not utilise a gas turbine.
37 Zhou, F. (2002). Policies and Measures on Environmental Protection in China. Energy Research Institute of SPDC,
China.
APEC ENERG Y DEMAND AN D SUPP LY OUTLOOK CHAPT ER 3
PAGE 77
INTEGRATED GASIFICATION COMBINED CYCLE (IGCC)
This process turns coal into gas which can be cleaned of its impurities to levels similar to natural gas. The gas is then combusted in a gas turbine to generate a source of electricity. Exhaust from the gas turbine is used to produce steam which drives a turbine and generates a second source of electricity. This �combined� effect can boost thermal efficiency by as much as 20 percent above conventional coal-burning power plants and could eventually double efficiencies (US DOE 2001).
COAL PRICE
International coal prices in the APEC region are generally set either through long-term contracts or through spot markets.
Traditionally, prices have been set through negotiations between suppliers and consumers, with long-term contracts of 10 to 15 years being the norm. These contracts reflected the long-term investment decisions that needed to be made regarding mines, transport, storage and use as well as concerns over security of supply.
More recently, these long-term contracts have also included annual price and tonnage reviews and have been complemented with the use of over-term contracts that cover sales for up to a year and spot sales. The spot market has become an increasingly important determinant of thermal coal prices in recent years. In Japan and Korea, for example, 30 percent of coal imports are purchased on the spot market as a result of factors such as deregulation of the electricity industry in these economies and the pressure on electricity generators to contain costs.
APEC ENERG Y DEMAND AN D SUPP LY OUTLOOK CHAPT ER 3
PAGE 78
NUCLEAR
AN OVERVIEW
Energy is of strategic importance to all economies in the world. Since the Industrial Revolution of the 18th century, a great transformation from an overwhelmingly agrarian society to a dynamic industrial one has taken place. Mass production and consumption paved the way for increases in population, which reinforced rapid industrialisation. Energy played a key role, and securing energy supplies became an essential responsibility of governments.
With prospects of high economic growth, energy demand in the APEC region is likely to grow faster than in other regions. According to APERC�s Outlook, total primary energy supply for the APEC region as a whole will reach 8,777 Mtoe in 2020 from 5,659 Mtoe in 1999, an annual growth rate of 2.1% percent. Projected energy demand is unprecedented in size, and APEC policy-makers and business leaders have an obligation to consider how to meet it in a cost-effective way.
Most APEC economies, in particular Northeast Asian economies, do not have enough energy resources to meet their growing demand and must rely on imports. Dependence on regions outside APEC for energy will deepen in the future. Korea and Japan are heavily dependent on the Middle East for oil, and there is no sign of any marked change in the near future in what might be regarded as an excessive dependence. China, being a net importer of crude oil since 1993 as well as an economic powerhouse, could see its situation exacerbated in the near future. It is most likely that for APEC as a whole the situation will worsen in the long run because of the rapid depletion of energy resources in Southeast Asian economies.
Nuclear power generation has helped stabilise energy supplies even at a time of fast-growing demand in the APEC region. In fact, economies without energy resources have benefited in large measure from nuclear power as a quasi-indigenous energy resource. Currently, eight APEC economies have significant nuclear power generation capacity. Nuclear power�s share in electricity generation in 1999 ranged from 1.2 percent in China and 5.2 percent in Mexico to 30 percent in Japan and 38.9 percent in Korea.
However, nuclear power generation has become increasingly unpopular in the wake of a series of accidents, including Three Mile Island, Chernobyl, and most recently in Tokai Mura in Japan. Because of what may be exaggerated fears of nuclear accidents, public sentiment against nuclear power plants and related facilities has grown, and in the minds of ordinary people the danger of accidents outweighs potential benefits.
Nuclear power has been in a quagmire since a core criticality explosion at the Chernobyl nuclear plant in Ukraine, then part of the Soviet Union, in 1986. Chernobyl showed that an accident that seemed only a remote possibility could happen, with devastating consequences. To cope with rising anti-nuclear feeling among the public, most governments had to postpone or rethink expansion of nuclear programmes. In some cases, reactors were shut down early.
Replacement of current capacity by other types of power generation seems neither economically desirable nor environmentally beneficial, since mid-course correction of nuclear programmes is not without cost: a huge sunk cost must be incurred, as seen in the US after deregulation. Thus the cost of early decommissioning of existing nuclear power plants easily outweighs any benefits it could yield.
Conditions determining the economic viability of nuclear plants vis-à-vis other thermal power plants change over time, an example being world oil prices. So it is a mistake to assume that one type of power generation will always be superior to another, even from an economic perspective. A static comparison of capital expenditure and operating costs has been the criteria for choosing types of power generation, an approach that might seem to rule out nuclear power as a viable option. But in economics, the more options the better.
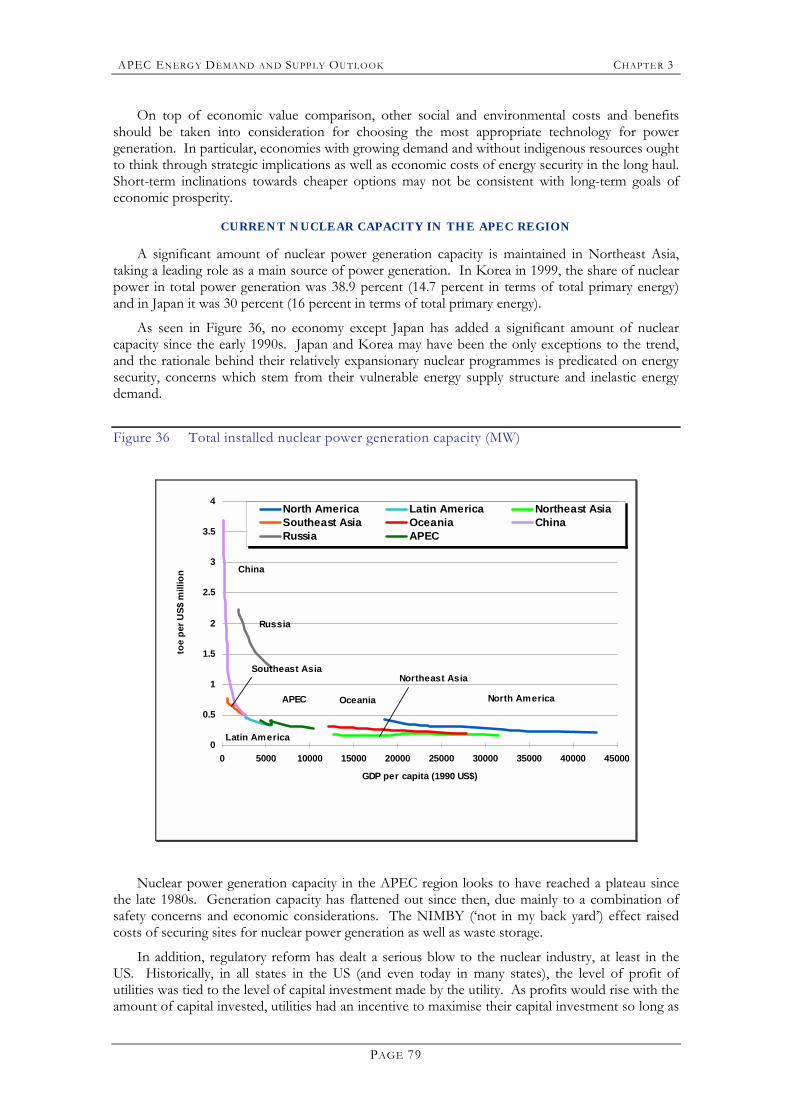
APEC ENERG Y DEMAND AN D SUPP LY OUTLOOK CHAPT ER 3
PAGE 79
On top of economic value comparison, other social and environmental costs and benefits should be taken into consideration for choosing the most appropriate technology for power generation. In particular, economies with growing demand and without indigenous resources ought to think through strategic implications as well as economic costs of energy security in the long haul. Short-term inclinations towards cheaper options may not be consistent with long-term goals of economic prosperity.
CURRENT NUCLEAR CAPACITY IN THE APEC REGION
A significant amount of nuclear power generation capacity is maintained in Northeast Asia, taking a leading role as a main source of power generation. In Korea in 1999, the share of nuclear power in total power generation was 38.9 percent (14.7 percent in terms of total primary energy) and in Japan it was 30 percent (16 percent in terms of total primary energy).
As seen in Figure 36, no economy except Japan has added a significant amount of nuclear capacity since the early 1990s. Japan and Korea may have been the only exceptions to the trend, and the rationale behind their relatively expansionary nuclear programmes is predicated on energy security, concerns which stem from their vulnerable energy supply structure and inelastic energy demand.
Figure 36 Total installed nuclear power generation capacity (MW)
0
0.5
1
1.5
2
2.5
3
3.5
4
0 5000 10000 15000 20000 25000 30000 35000 40000 45000
GDP per capita (1990 US$)
toe
per U
S$ m
illio
n
North America Latin America Northeast AsiaSoutheast Asia Oceania ChinaRussia APEC
North America
Russia
Oceania
Northeast Asia
APEC
Latin America
China
Southeast Asia
Nuclear power generation capacity in the APEC region looks to have reached a plateau since the late 1980s. Generation capacity has flattened out since then, due mainly to a combination of safety concerns and economic considerations. The NIMBY (�not in my back yard�) effect raised costs of securing sites for nuclear power generation as well as waste storage.
In addition, regulatory reform has dealt a serious blow to the nuclear industry, at least in the US. Historically, in all states in the US (and even today in many states), the level of profit of utilities was tied to the level of capital investment made by the utility. As profits would rise with the amount of capital invested, utilities had an incentive to maximise their capital investment so long as
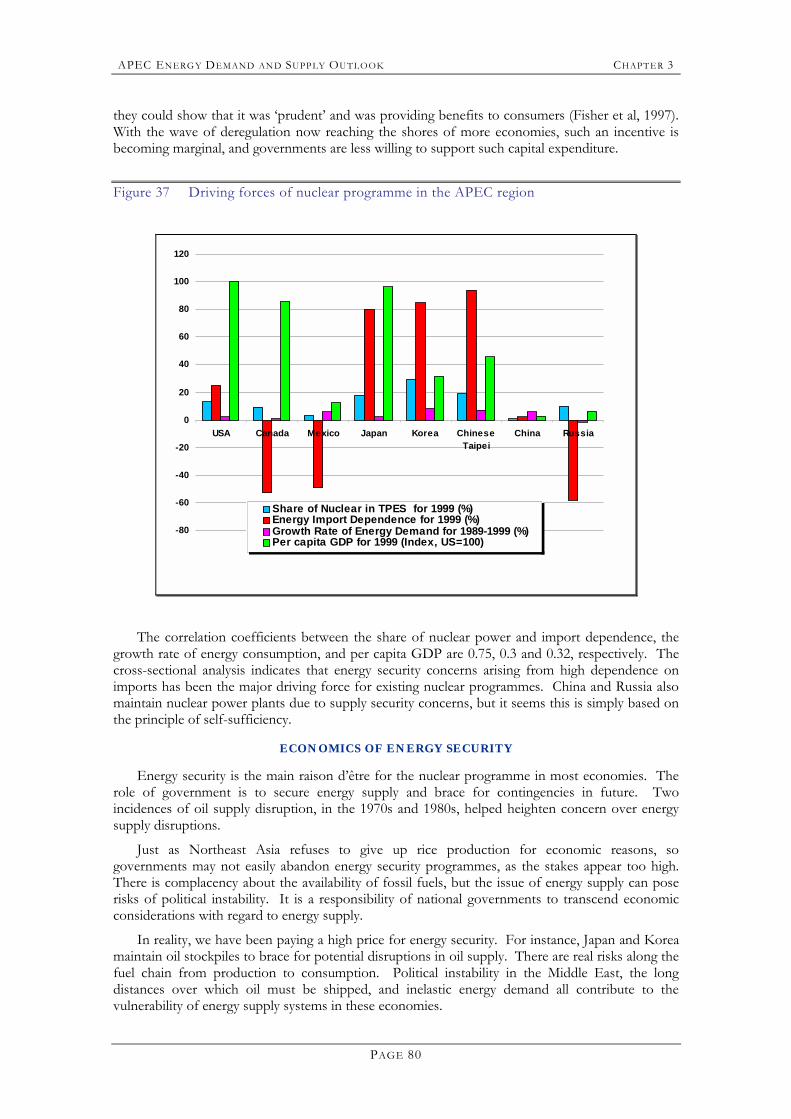
APEC ENERG Y DEMAND AN D SUPP LY OUTLOOK CHAPT ER 3
PAGE 80
they could show that it was �prudent� and was providing benefits to consumers (Fisher et al, 1997). With the wave of deregulation now reaching the shores of more economies, such an incentive is becoming marginal, and governments are less willing to support such capital expenditure.
Figure 37 Driving forces of nuclear programme in the APEC region
-80
-60
-40
-20
0
20
40
60
80
100
120
USA Canada Mexico Japan Korea ChineseTaipei
China Russia
Share of Nuclear in TPES for 1999 (%)Energy Import Dependence for 1999 (%)Growth Rate of Energy Demand for 1989-1999 (%)Per capita GDP for 1999 (Index, US=100)
The correlation coefficients between the share of nuclear power and import dependence, the growth rate of energy consumption, and per capita GDP are 0.75, 0.3 and 0.32, respectively. The cross-sectional analysis indicates that energy security concerns arising from high dependence on imports has been the major driving force for existing nuclear programmes. China and Russia also maintain nuclear power plants due to supply security concerns, but it seems this is simply based on the principle of self-sufficiency.
ECONOMICS OF ENERGY SECURITY
Energy security is the main raison d�être for the nuclear programme in most economies. The role of government is to secure energy supply and brace for contingencies in future. Two incidences of oil supply disruption, in the 1970s and 1980s, helped heighten concern over energy supply disruptions.
Just as Northeast Asia refuses to give up rice production for economic reasons, so governments may not easily abandon energy security programmes, as the stakes appear too high. There is complacency about the availability of fossil fuels, but the issue of energy supply can pose risks of political instability. It is a responsibility of national governments to transcend economic considerations with regard to energy supply.
In reality, we have been paying a high price for energy security. For instance, Japan and Korea maintain oil stockpiles to brace for potential disruptions in oil supply. There are real risks along the fuel chain from production to consumption. Political instability in the Middle East, the long distances over which oil must be shipped, and inelastic energy demand all contribute to the vulnerability of energy supply systems in these economies.
APEC ENERG Y DEMAND AN D SUPP LY OUTLOOK CHAPT ER 3
PAGE 81
In order to enhance energy security, Northeast Asian economies including China, Japan and Korea are considering crossborder natural gas pipeline projects aiming to exploit natural gas reserves in the Russian Far East and Western Siberia. The Irkutsk, Sakhalin and Yakutsk projects are under scrutiny to see if they are economically feasible. These projects are regarded as ways to diversify energy sources, though it turns out they are neither inexpensive nor easy to implement.
If nuclear programmes were to be abandoned at a stroke in Korea and Japan, a huge amount of oil and natural gas would need to be imported. In addition, oil stockpiles would have to grow in proportion to oil consumption levels. It would require in turn large amounts of capital expenditure on storage facilities. As these economies already have high levels of public debt, they might be unable to afford such additional spending. In addition, the environmental cost would soar, in a local as well as a global context, if oil and coal consumption were to grow at the expense of nuclear power.
SOCIO-ECONOMIC ENVIRONMENT FOR NUCLEAR INDUSTRY
Nuclear power generation is losing its attractiveness for most economies, mainly because of issues of safety and radioactive waste disposal. The nuclear industry faces a number of challenges:
• The investment climate is not on the side of nuclear power.
o Long lead times pose a number of risks, prominent among which is cost-overrun (5-7 years).
o High initial investment costs of a nuclear power plant can overshadow potential benefits, as it can be three times as high as for coal in terms of kilowatts generated.38
o If insurance costs have to be borne by the private sector they will be prohibitively high. Traditionally, as in the United States, governments tend to bear the risk of accidents. However, once the electricity industry is privatised, there may be no takers for nuclear plants due to insurance costs.
• Financing could become difficult in the aftermath of deregulation of the electricity market, as power generators are oriented towards short-term gains and lenders might be unwilling to take long-term risks. This also depends on the market situation for generation capacity. In times of excess capacity, financing of nuclear power plants is out of the question.
• Human resources supporting the industry are thinning: availability and recruitment of qualified nuclear engineers and scientists may become a major stumbling block in the near future.
• Lingering public acceptance issues:
o Safety
o Spent fuel and waste management are thorny issues in most countries
o Acquisition of appropriate sites for nuclear power plants will be met with fierce resistance from local residents
With all these difficulties facing the industry, could we afford to abandon nuclear programmes? The answer seems to be no, because of the sheer size of its share in power generation, the environmental impact, and recovery of previous investment. At least for existing plants, an appropriate level of staffing and maintenance investment should continue so as to avoid their early decommissioning, which would increase so-called sunk costs.
38 The Asian Energy Factor: Myths and Dilemmas of Energy, Security and the Pacific Future, Robert Manning, Palgrave,
September 2000.
APEC ENERG Y DEMAND AN D SUPP LY OUTLOOK CHAPT ER 3
PAGE 82
ENVIRONMENT
Environmental quality has been a significant driver behind governments� interest in nuclear power. Major cities in China, for example, have been frequently ranked high in various lists of the most polluted cities in the world. Decades of growing coal usage have resulted in environmental degradation, which needs to be urgently remedied. Environmental degradation, if not properly dealt with, will drive up costs in the economy and society as a whole. In addition, further unrestricted use of coal will result in substantial damage to health and to crops.
CLIMATE CHANGE
Increasing concern about the environment could in time help expand nuclear capacity. The United Nations Framework Convention on Climate Change (UNFCCC39) adopted at the Rio Earth Summit in June 1992, was ratified by more than 150 governments worldwide as of 1996. The UNFCCC was established to minimise the adverse effects of climate change on the present and future ecosystem (such as desertification and rising sea levels). The Convention and the Protocol require each nation (Annex I economies have made binding commitments) to establish sustainable economic development plans. These commitments could have enormous potential impacts in the years to come. At the 3rd Conference of the Parties to the Climate Change Convention in Kyoto in 1997, parties to the Convention developed an internationally agreed approach for GHG emissions reduction. The Kyoto Protocol established targets and a timetable for advanced economies listed in Annex B of the Kyoto Protocol. This approach was intended to force implementation of GHG emissions reduction policies and measures in a way that was legally binding.
It is not hard to see that one of the most effective ways to reduce greenhouse emissions is nuclear power generation. Depending on how details of the Kyoto Protocol − including rules, modalities and guidelines − are agreed in subsequent negotiations, it could play a major role in promoting growth of nuclear power generation in APEC economies
JAPAN
Since its adoption, the Kyoto Protocol has become an important factor in terms of energy policy formulation in Japan,40 which ratified the protocol on June 4th, 2002. Once the protocol comes into force, the GHG emission reduction target of six percent at 1990 levels will become legally binding. Despite targets set at Kyoto, energy demand (and resulting CO2 emissions) are growing strongly. According to IEEJ statistics, CO2 emissions in Japan in 1997 exceeded the Kyoto target by 17 percent, while primary energy consumption grew about 17 percent between 1990 and 1997. Since CO2 is the major greenhouse gas emitted by Japan, this trend should send alarm signals to Japanese energy policy-makers, should they want to meet the target. Nuclear power generation has become an indispensable part of efforts to reduce GHG emissions in Japan.
KOREA
Korea is a party to both UNFCCC and the Kyoto Protocol, but is not a signatory to Annex I (nor, for the same reason, to Annex B in the Kyoto Protocol). Thus, even after the Protocol enters into force, Korea�s GHG emissions would not be constrained from a legal standpoint. It has had remarkably high economic growth for the last three decades and still experiences robust growth, except for a temporary setback in 1998 due to the Asian financial crisis. Korea is now a member of the OECD and IEA. The international community is calling for appropriate voluntary participation by Korea to combat global warming. The government is now undertaking measures to reduce GHG emissions while minimising the economic consequences, following its national plan to cope with climate change. In a series of climate change negotiations, the government raised the
39 The UNFCCC serves as the legal basis for the international development of responses to climate change, and aims to
mitigate greenhouse gas emissions (GHG) from the extensive use of fossil fuels. 40 Japan agreed to reduce GHG emissions by 2010 to six percent below its 1990 level. See for details Kyoto Protocol to
the Convention of Climate Change (1997), the Climate Change Secretariat, UNFCCC.
APEC ENERG Y DEMAND AN D SUPP LY OUTLOOK CHAPT ER 3
PAGE 83
possibility of adopting a binding GHG emissions reduction target from the second commitment period between 2012 and 2016.
LOCAL ENVIRONMENT
Climate change is a global issue, and understandably at a local level support is limited. The atmosphere is global. A farmer in the US may have little concern about the GHG emissions of a steel manufacturer in Europe, because the danger to his crop from these emissions cannot be seen, and causality is hard to prove. If the steel manufacturer is asked to pay for the GHG emissions to compensate for crop losses in the US, he will be reluctant to do so for the same reason.
In contrast, local air pollution has begun to have a significant bearing on the formation of energy and environmental policies in many economies in the APEC region. Notably, Northeast Asian economies have begun to pay more attention to improvements in the quality of the environment in cities and townships. As a result, governments in the region are reinforcing environment standards and encouraging a change in the energy mix towards more environment-friendly resources.
FUTURE PROSPECTS
Nuclear power generation can have an important role to play in the future. It has the potential to provide benefits in the realms of energy security and environmental protection to economies that place a high value on these critical issues. But these benefits may not be realised without financial, institutional and government support.
Nuclear power generation is becoming less favoured by the electricity industry as public acceptance issues overshadow most benefits it can bring. Safety and waste disposal take centre stage in the dispute over whether to expand, continue or abandon nuclear power generation in most economies with nuclear power plants. As nuclear accidents tend to have serious consequences, safety concerns pose the main threat to the industry�s expansion, despite the low probability of accidents. In addition, low public acceptance of nuclear facilities, including waste disposal systems, raises the cost of securing sites for the nuclear power plants, making it less viable economically.
If the current trend of regulatory reform in the power sector combined with privatisation continues, some APEC economies will be forced to drop most of their nuclear programmes and sooner or later face cost problems over existing nuclear plants. In particular, Japan and Korea depend heavily on nuclear power generation, and may find it difficult to avoid this issue in the future if these plants prove to be uneconomic in a competitive environment. The problem could be heightened if nuclear power plants must be shut down earlier than originally planned for reasons other than economic ones. The bottom line seems to be that doing so will raise electricity tariffs unnecessarily.
There are mixed forecasts on the future of nuclear power programmes throughout the world. The IEA World Energy Outlook (1998) said nuclear capacity would remain of the same order of magnitude as today, while the World Energy Council�s Energy for Tomorrow�s World (2000) predicted a doubling of current capacity. APERC�s Outlook 2002 predicts a modest growth of nuclear power generation capacity in the APEC region from 203 GW in 1999 to 278 GW in 2020, which reflects each member�s plans for nuclear power generation, at an annual growth rate of 1.5%.
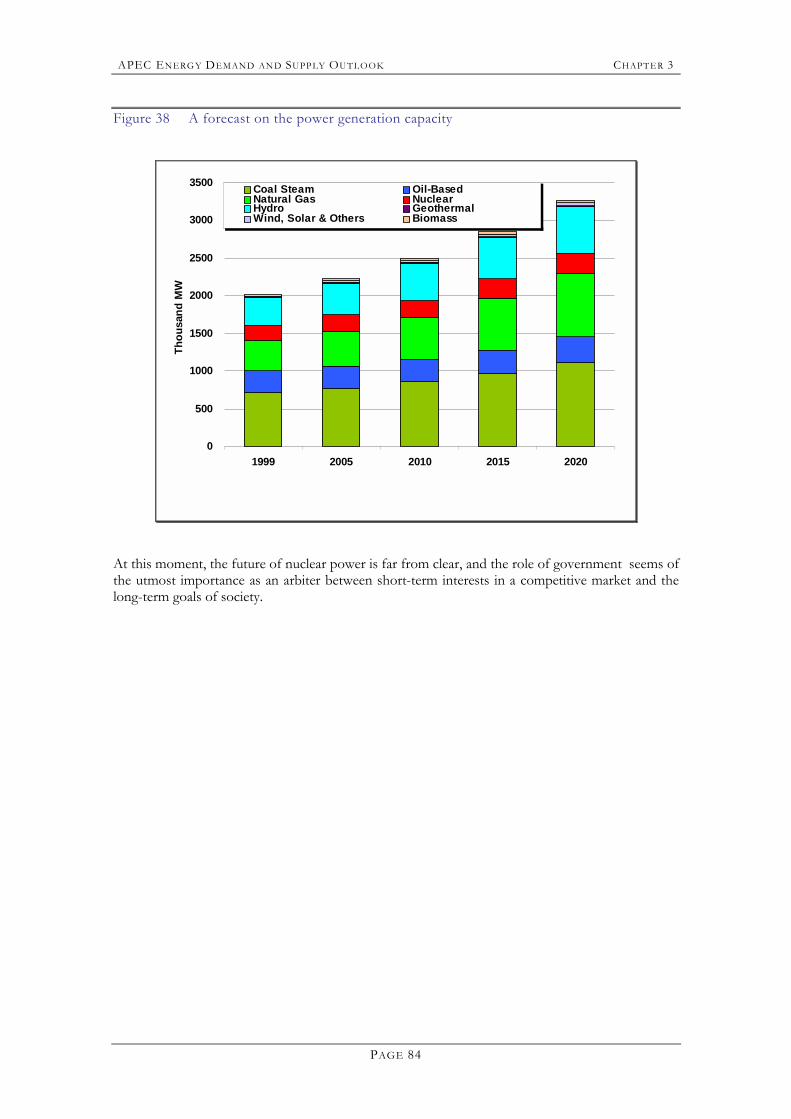
APEC ENERG Y DEMAND AN D SUPP LY OUTLOOK CHAPT ER 3
PAGE 84
Figure 38 A forecast on the power generation capacity
0
500
1000
1500
2000
2500
3000
3500
1999 2005 2010 2015 2020
Thou
sand
MW
Coal Steam Oil-BasedNatural Gas NuclearHydro GeothermalWind, Solar & Others Biomass
At this moment, the future of nuclear power is far from clear, and the role of government seems of the utmost importance as an arbiter between short-term interests in a competitive market and the long-term goals of society.
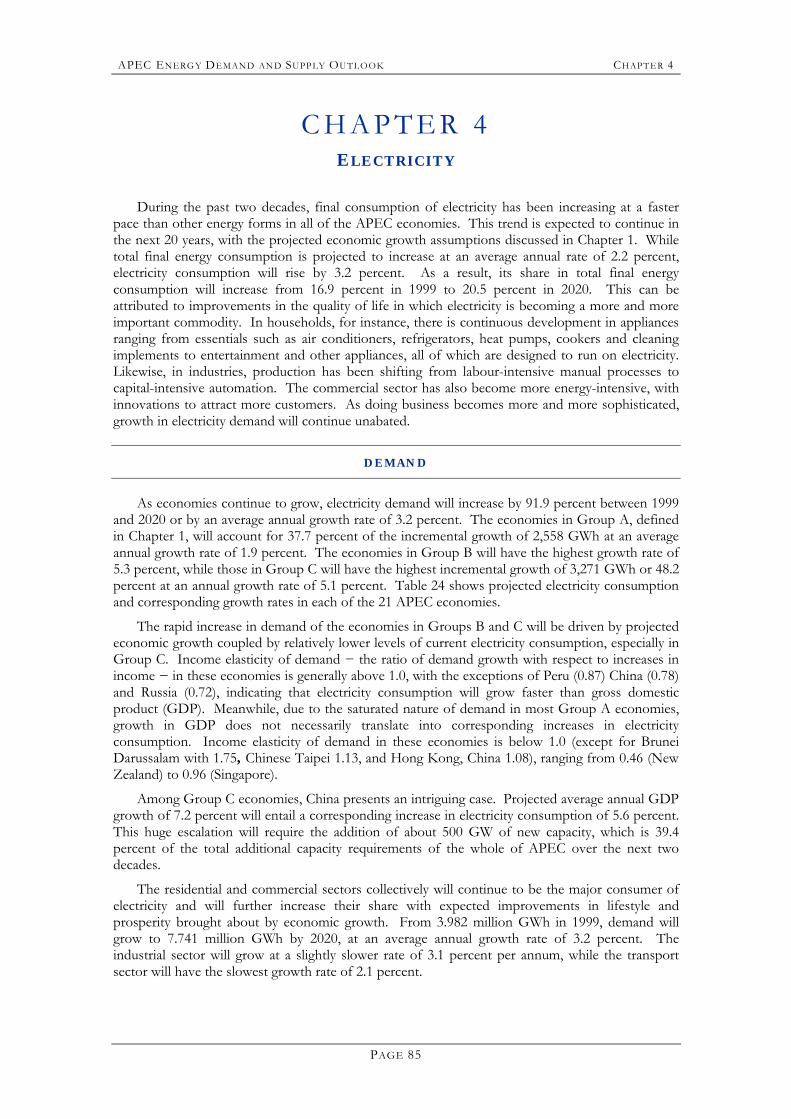
APEC ENERG Y DEMAND AN D SUPP LY OUTLOOK CHAPT ER 4
PAGE 85
C H A P T E R 4 ELECTRICITY
During the past two decades, final consumption of electricity has been increasing at a faster pace than other energy forms in all of the APEC economies. This trend is expected to continue in the next 20 years, with the projected economic growth assumptions discussed in Chapter 1. While total final energy consumption is projected to increase at an average annual rate of 2.2 percent, electricity consumption will rise by 3.2 percent. As a result, its share in total final energy consumption will increase from 16.9 percent in 1999 to 20.5 percent in 2020. This can be attributed to improvements in the quality of life in which electricity is becoming a more and more important commodity. In households, for instance, there is continuous development in appliances ranging from essentials such as air conditioners, refrigerators, heat pumps, cookers and cleaning implements to entertainment and other appliances, all of which are designed to run on electricity. Likewise, in industries, production has been shifting from labour-intensive manual processes to capital-intensive automation. The commercial sector has also become more energy-intensive, with innovations to attract more customers. As doing business becomes more and more sophisticated, growth in electricity demand will continue unabated.
DEMAND
As economies continue to grow, electricity demand will increase by 91.9 percent between 1999 and 2020 or by an average annual growth rate of 3.2 percent. The economies in Group A, defined in Chapter 1, will account for 37.7 percent of the incremental growth of 2,558 GWh at an average annual growth rate of 1.9 percent. The economies in Group B will have the highest growth rate of 5.3 percent, while those in Group C will have the highest incremental growth of 3,271 GWh or 48.2 percent at an annual growth rate of 5.1 percent. Table 24 shows projected electricity consumption and corresponding growth rates in each of the 21 APEC economies.
The rapid increase in demand of the economies in Groups B and C will be driven by projected economic growth coupled by relatively lower levels of current electricity consumption, especially in Group C. Income elasticity of demand − the ratio of demand growth with respect to increases in income − in these economies is generally above 1.0, with the exceptions of Peru (0.87) China (0.78) and Russia (0.72), indicating that electricity consumption will grow faster than gross domestic product (GDP). Meanwhile, due to the saturated nature of demand in most Group A economies, growth in GDP does not necessarily translate into corresponding increases in electricity consumption. Income elasticity of demand in these economies is below 1.0 (except for Brunei Darussalam with 1.75, Chinese Taipei 1.13, and Hong Kong, China 1.08), ranging from 0.46 (New Zealand) to 0.96 (Singapore).
Among Group C economies, China presents an intriguing case. Projected average annual GDP growth of 7.2 percent will entail a corresponding increase in electricity consumption of 5.6 percent. This huge escalation will require the addition of about 500 GW of new capacity, which is 39.4 percent of the total additional capacity requirements of the whole of APEC over the next two decades.
The residential and commercial sectors collectively will continue to be the major consumer of electricity and will further increase their share with expected improvements in lifestyle and prosperity brought about by economic growth. From 3.982 million GWh in 1999, demand will grow to 7.741 million GWh by 2020, at an average annual growth rate of 3.2 percent. The industrial sector will grow at a slightly slower rate of 3.1 percent per annum, while the transport sector will have the slowest growth rate of 2.1 percent.
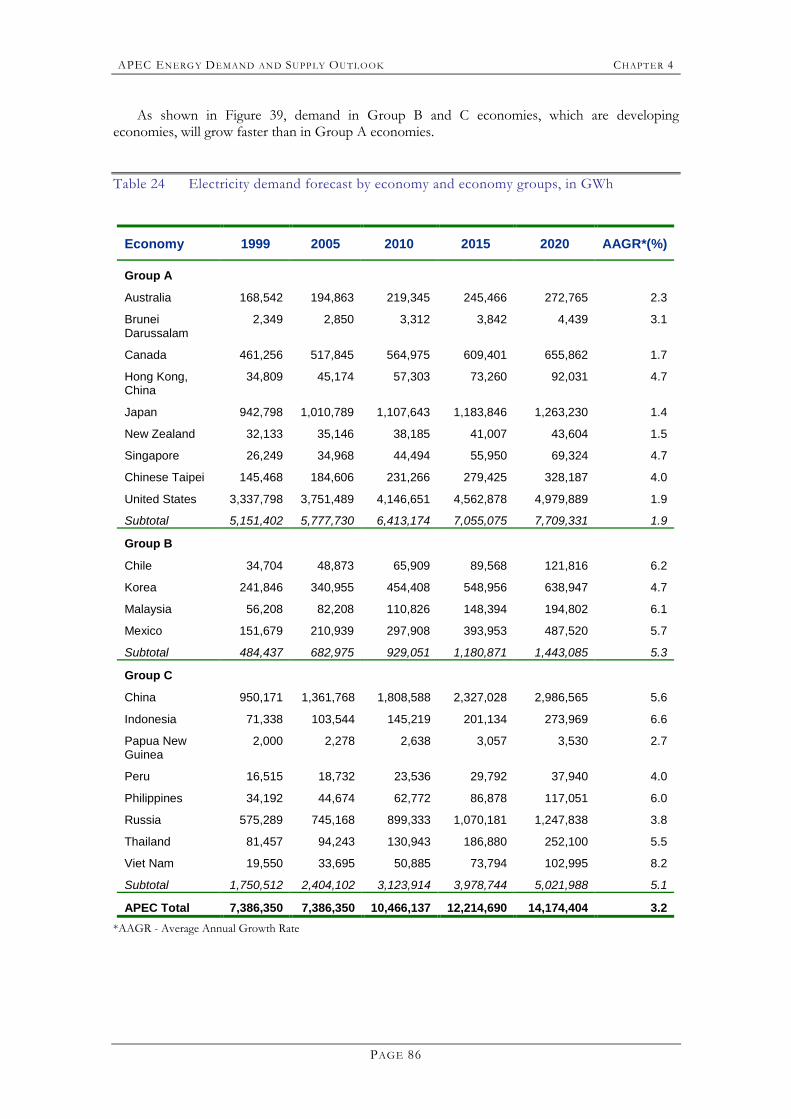
APEC ENERG Y DEMAND AN D SUPP LY OUTLOOK CHAPT ER 4
PAGE 86
As shown in Figure 39, demand in Group B and C economies, which are developing economies, will grow faster than in Group A economies.
Table 24 Electricity demand forecast by economy and economy groups, in GWh
Economy 1999 2005 2010 2015 2020 AAGR*(%)
Group A
Australia 168,542 194,863 219,345 245,466 272,765 2.3
Brunei Darussalam
2,349 2,850 3,312 3,842 4,439 3.1
Canada 461,256 517,845 564,975 609,401 655,862 1.7
Hong Kong, China
34,809 45,174 57,303 73,260 92,031 4.7
Japan 942,798 1,010,789 1,107,643 1,183,846 1,263,230 1.4
New Zealand 32,133 35,146 38,185 41,007 43,604 1.5
Singapore 26,249 34,968 44,494 55,950 69,324 4.7
Chinese Taipei 145,468 184,606 231,266 279,425 328,187 4.0
United States 3,337,798 3,751,489 4,146,651 4,562,878 4,979,889 1.9
Subtotal 5,151,402 5,777,730 6,413,174 7,055,075 7,709,331 1.9
Group B
Chile 34,704 48,873 65,909 89,568 121,816 6.2
Korea 241,846 340,955 454,408 548,956 638,947 4.7
Malaysia 56,208 82,208 110,826 148,394 194,802 6.1
Mexico 151,679 210,939 297,908 393,953 487,520 5.7
Subtotal 484,437 682,975 929,051 1,180,871 1,443,085 5.3
Group C
China 950,171 1,361,768 1,808,588 2,327,028 2,986,565 5.6
Indonesia 71,338 103,544 145,219 201,134 273,969 6.6
Papua New Guinea
2,000 2,278 2,638 3,057 3,530 2.7
Peru 16,515 18,732 23,536 29,792 37,940 4.0
Philippines 34,192 44,674 62,772 86,878 117,051 6.0
Russia 575,289 745,168 899,333 1,070,181 1,247,838 3.8
Thailand 81,457 94,243 130,943 186,880 252,100 5.5
Viet Nam 19,550 33,695 50,885 73,794 102,995 8.2
Subtotal 1,750,512 2,404,102 3,123,914 3,978,744 5,021,988 5.1
APEC Total 7,386,350 7,386,350 10,466,137 12,214,690 14,174,404 3.2 *AAGR - Average Annual Growth Rate
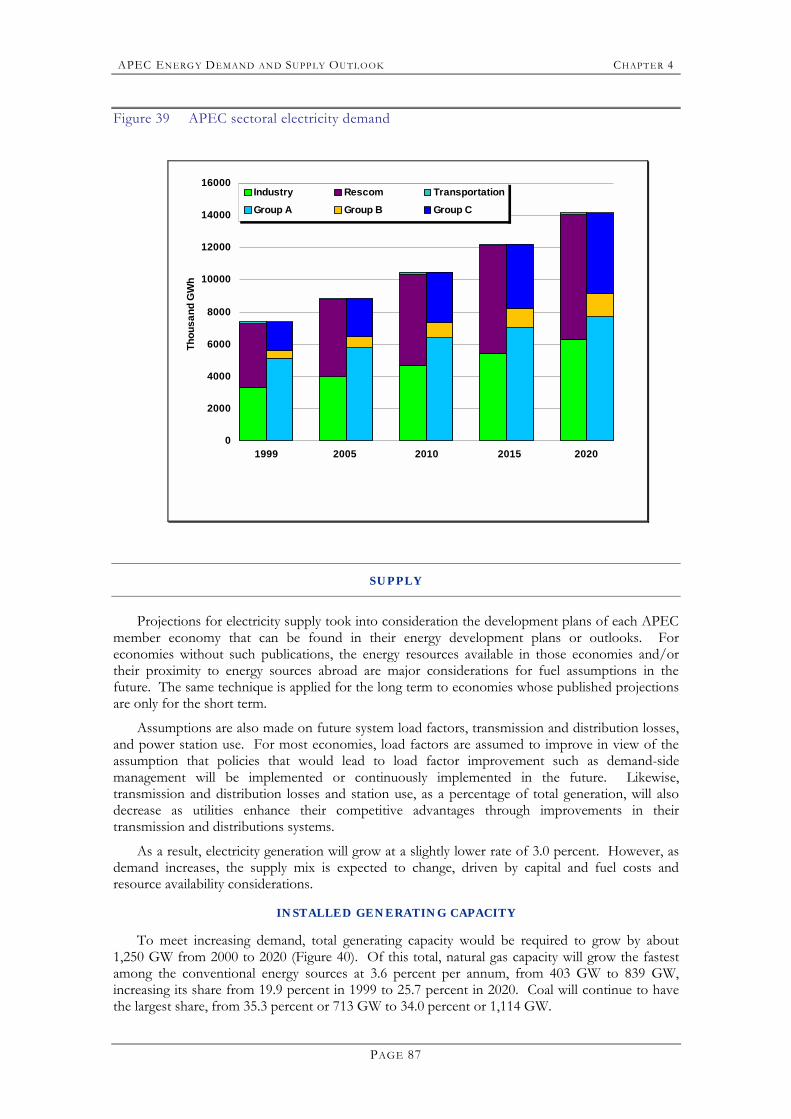
APEC ENERG Y DEMAND AN D SUPP LY OUTLOOK CHAPT ER 4
PAGE 87
Figure 39 APEC sectoral electricity demand
0
2000
4000
6000
8000
10000
12000
14000
16000Th
ousa
nd G
Wh
Industry Rescom TransportationGroup A Group B Group C
1999 2005 2010 2015 2020
SUPPLY
Projections for electricity supply took into consideration the development plans of each APEC member economy that can be found in their energy development plans or outlooks. For economies without such publications, the energy resources available in those economies and/or their proximity to energy sources abroad are major considerations for fuel assumptions in the future. The same technique is applied for the long term to economies whose published projections are only for the short term.
Assumptions are also made on future system load factors, transmission and distribution losses, and power station use. For most economies, load factors are assumed to improve in view of the assumption that policies that would lead to load factor improvement such as demand-side management will be implemented or continuously implemented in the future. Likewise, transmission and distribution losses and station use, as a percentage of total generation, will also decrease as utilities enhance their competitive advantages through improvements in their transmission and distributions systems.
As a result, electricity generation will grow at a slightly lower rate of 3.0 percent. However, as demand increases, the supply mix is expected to change, driven by capital and fuel costs and resource availability considerations.
INSTALLED GENERATING CAPACITY
To meet increasing demand, total generating capacity would be required to grow by about 1,250 GW from 2000 to 2020 (Figure 40). Of this total, natural gas capacity will grow the fastest among the conventional energy sources at 3.6 percent per annum, from 403 GW to 839 GW, increasing its share from 19.9 percent in 1999 to 25.7 percent in 2020. Coal will continue to have the largest share, from 35.3 percent or 713 GW to 34.0 percent or 1,114 GW.
APEC ENERG Y DEMAND AN D SUPP LY OUTLOOK CHAPT ER 4
PAGE 88
Oil-based capacity will see its share fall from 14.4 to 10.3 percent during the outlook period, while that of nuclear power will slip from 10.1 to 8.5 percent. Although the absolute numbers are increasing, the contribution of hydro, geothermal and biomass will decrease as demand is expected to outpace developments in these renewable energy sources. New and renewable energy (NRE) such as solar and wind could grow the fastest, by almost eight-fold, as development starts from a very low level. Their collective contribution will, however, remain very low, rising from 0.3 percent to 1.2 percent.
Figure 40 APEC installed generating capacity (1999-2020)
0
500
1000
1500
2000
2500
3000
3500
1999 2005 2010 2015 2020
Thou
sand
MW
Coal Steam Oil-BasedNatural Gas NuclearHydro GeothermalWind, Solar & Others Biomass
GENERATION
Figure 41 shows the future power generation mix. Coal, the most economic choice for baseload 41 in most economies, is expected to continue to be the major fuel, with its share decreasing slightly from 44.0 percent in 1999 to 42.2 percent in 2020. This is due to its relatively lower price as a fuel and its availability as a resource in almost all of the APEC economies, making it the most economic choice to meet rapidly growing demand.
Natural gas will grow at a higher rate than coal, reflecting its current low penetration rate in many of the APEC economies. Its share will increase from 17.0 percent in 1999 to 27.1 percent in 2020, still considerably lower than coal. One main reason for the lower share, aside from it being less geographically available, is that this fuel will be used mostly during the intermediate and peak load periods in view of its higher price and the availability of natural gas power plant technologies in modular units, ideal for load dispatch management.
41 The type of generation plant that comes first in dispatch order, meaning the one that is always in use.
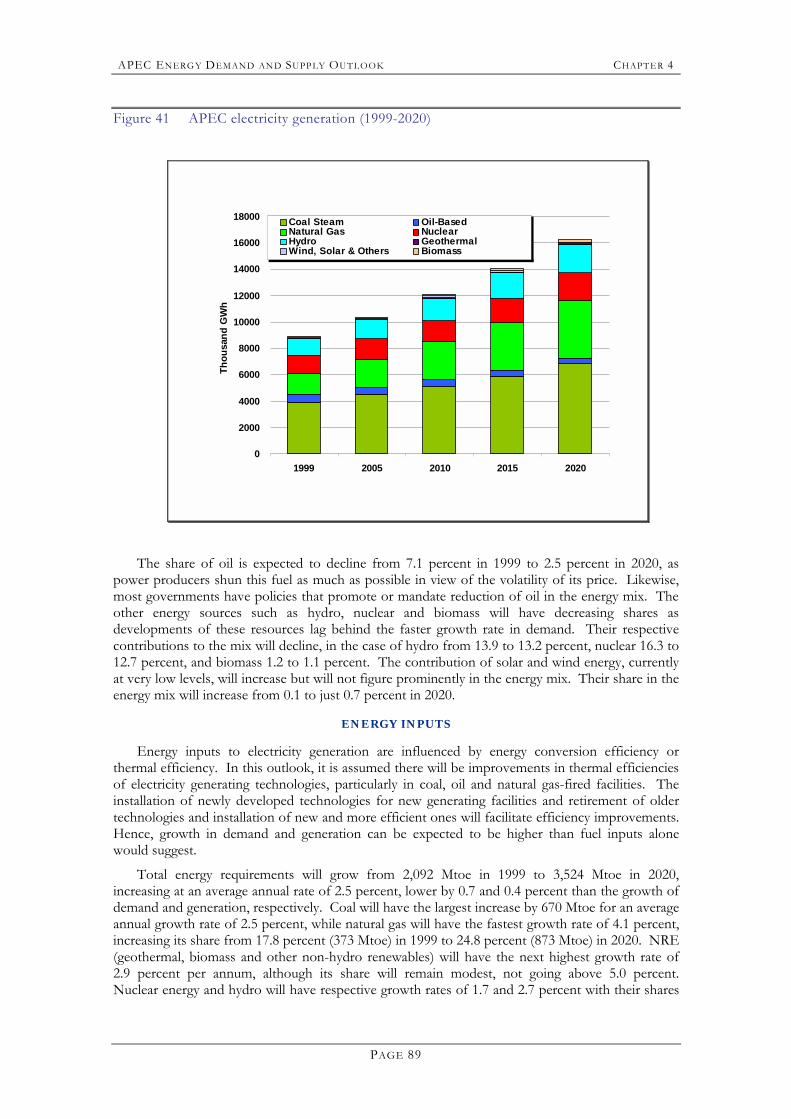
APEC ENERG Y DEMAND AN D SUPP LY OUTLOOK CHAPT ER 4
PAGE 89
Figure 41 APEC electricity generation (1999-2020)
0
2000
4000
6000
8000
10000
12000
14000
16000
18000
1999 2005 2010 2015 2020
Thou
sand
GW
hCoal Steam Oil-BasedNatural Gas NuclearHydro GeothermalWind, Solar & Others Biomass
The share of oil is expected to decline from 7.1 percent in 1999 to 2.5 percent in 2020, as power producers shun this fuel as much as possible in view of the volatility of its price. Likewise, most governments have policies that promote or mandate reduction of oil in the energy mix. The other energy sources such as hydro, nuclear and biomass will have decreasing shares as developments of these resources lag behind the faster growth rate in demand. Their respective contributions to the mix will decline, in the case of hydro from 13.9 to 13.2 percent, nuclear 16.3 to 12.7 percent, and biomass 1.2 to 1.1 percent. The contribution of solar and wind energy, currently at very low levels, will increase but will not figure prominently in the energy mix. Their share in the energy mix will increase from 0.1 to just 0.7 percent in 2020.
ENERGY INPUTS
Energy inputs to electricity generation are influenced by energy conversion efficiency or thermal efficiency. In this outlook, it is assumed there will be improvements in thermal efficiencies of electricity generating technologies, particularly in coal, oil and natural gas-fired facilities. The installation of newly developed technologies for new generating facilities and retirement of older technologies and installation of new and more efficient ones will facilitate efficiency improvements. Hence, growth in demand and generation can be expected to be higher than fuel inputs alone would suggest.
Total energy requirements will grow from 2,092 Mtoe in 1999 to 3,524 Mtoe in 2020, increasing at an average annual rate of 2.5 percent, lower by 0.7 and 0.4 percent than the growth of demand and generation, respectively. Coal will have the largest increase by 670 Mtoe for an average annual growth rate of 2.5 percent, while natural gas will have the fastest growth rate of 4.1 percent, increasing its share from 17.8 percent (373 Mtoe) in 1999 to 24.8 percent (873 Mtoe) in 2020. NRE (geothermal, biomass and other non-hydro renewables) will have the next highest growth rate of 2.9 percent per annum, although its share will remain modest, not going above 5.0 percent. Nuclear energy and hydro will have respective growth rates of 1.7 and 2.7 percent with their shares
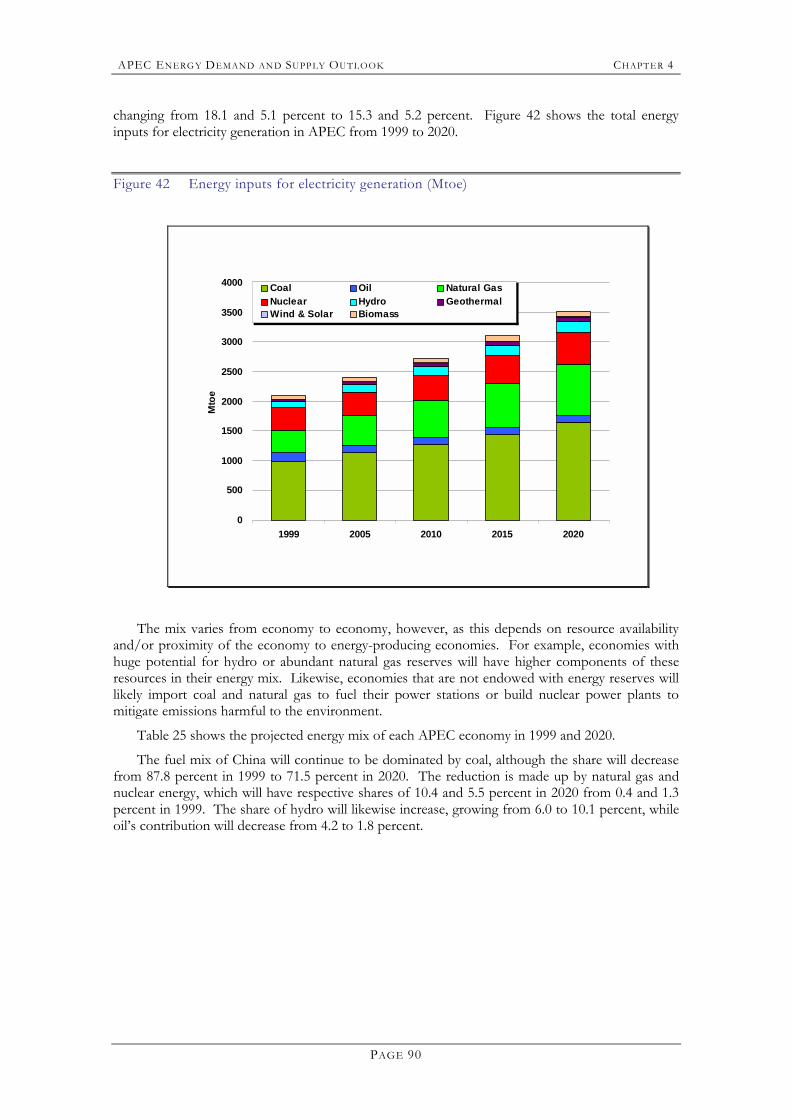
APEC ENERG Y DEMAND AN D SUPP LY OUTLOOK CHAPT ER 4
PAGE 90
changing from 18.1 and 5.1 percent to 15.3 and 5.2 percent. Figure 42 shows the total energy inputs for electricity generation in APEC from 1999 to 2020.
Figure 42 Energy inputs for electricity generation (Mtoe)
0
500
1000
1500
2000
2500
3000
3500
4000
1999 2005 2010 2015 2020
Mto
e
Coal Oil Natural Gas Nuclear Hydro GeothermalWind & Solar Biomass
The mix varies from economy to economy, however, as this depends on resource availability and/or proximity of the economy to energy-producing economies. For example, economies with huge potential for hydro or abundant natural gas reserves will have higher components of these resources in their energy mix. Likewise, economies that are not endowed with energy reserves will likely import coal and natural gas to fuel their power stations or build nuclear power plants to mitigate emissions harmful to the environment.
Table 25 shows the projected energy mix of each APEC economy in 1999 and 2020.
The fuel mix of China will continue to be dominated by coal, although the share will decrease from 87.8 percent in 1999 to 71.5 percent in 2020. The reduction is made up by natural gas and nuclear energy, which will have respective shares of 10.4 and 5.5 percent in 2020 from 0.4 and 1.3 percent in 1999. The share of hydro will likewise increase, growing from 6.0 to 10.1 percent, while oil�s contribution will decrease from 4.2 to 1.8 percent.
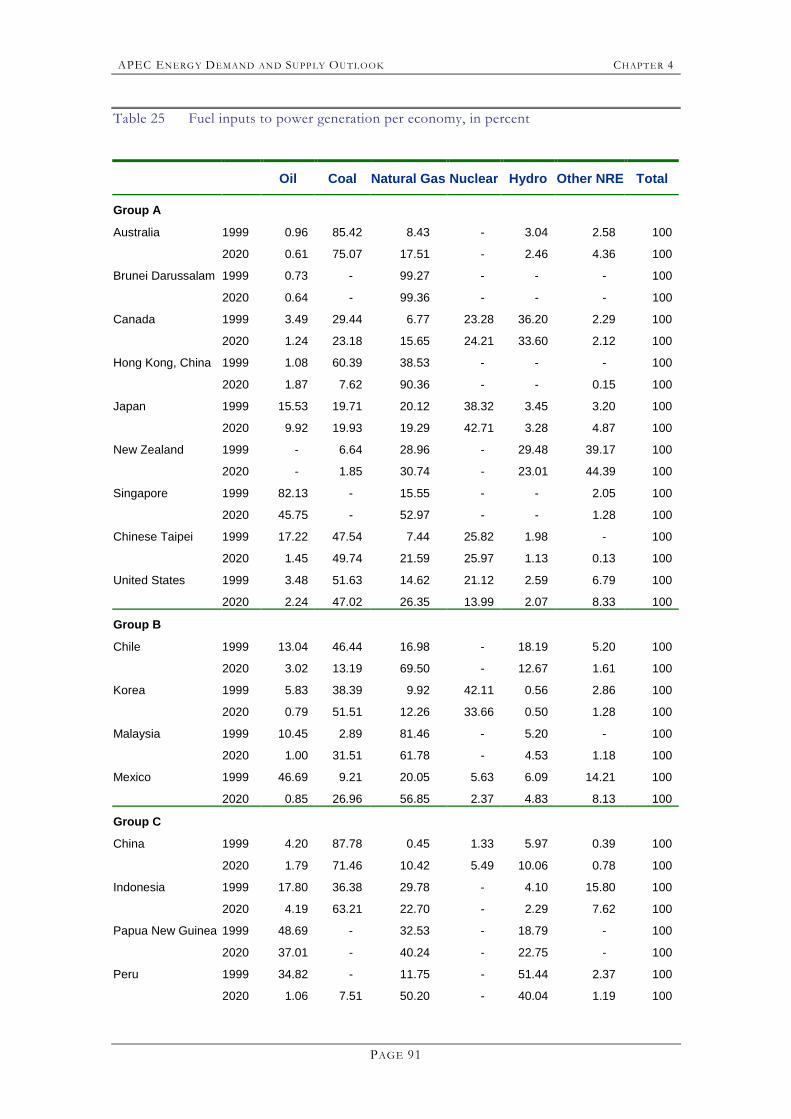
APEC ENERG Y DEMAND AN D SUPP LY OUTLOOK CHAPT ER 4
PAGE 91
Table 25 Fuel inputs to power generation per economy, in percent
Oil Coal Natural Gas Nuclear Hydro Other NRE Total
Group A
Australia 1999 0.96 85.42 8.43 - 3.04 2.58 100
2020 0.61 75.07 17.51 - 2.46 4.36 100
Brunei Darussalam 1999 0.73 - 99.27 - - - 100
2020 0.64 - 99.36 - - - 100
Canada 1999 3.49 29.44 6.77 23.28 36.20 2.29 100
2020 1.24 23.18 15.65 24.21 33.60 2.12 100
Hong Kong, China 1999 1.08 60.39 38.53 - - - 100
2020 1.87 7.62 90.36 - - 0.15 100
Japan 1999 15.53 19.71 20.12 38.32 3.45 3.20 100
2020 9.92 19.93 19.29 42.71 3.28 4.87 100
New Zealand 1999 - 6.64 28.96 - 29.48 39.17 100
2020 - 1.85 30.74 - 23.01 44.39 100
Singapore 1999 82.13 - 15.55 - - 2.05 100
2020 45.75 - 52.97 - - 1.28 100
Chinese Taipei 1999 17.22 47.54 7.44 25.82 1.98 - 100
2020 1.45 49.74 21.59 25.97 1.13 0.13 100
United States 1999 3.48 51.63 14.62 21.12 2.59 6.79 100
2020 2.24 47.02 26.35 13.99 2.07 8.33 100
Group B
Chile 1999 13.04 46.44 16.98 - 18.19 5.20 100
2020 3.02 13.19 69.50 - 12.67 1.61 100
Korea 1999 5.83 38.39 9.92 42.11 0.56 2.86 100
2020 0.79 51.51 12.26 33.66 0.50 1.28 100
Malaysia 1999 10.45 2.89 81.46 - 5.20 - 100
2020 1.00 31.51 61.78 - 4.53 1.18 100
Mexico 1999 46.69 9.21 20.05 5.63 6.09 14.21 100
2020 0.85 26.96 56.85 2.37 4.83 8.13 100
Group C
China 1999 4.20 87.78 0.45 1.33 5.97 0.39 100
2020 1.79 71.46 10.42 5.49 10.06 0.78 100
Indonesia 1999 17.80 36.38 29.78 - 4.10 15.80 100
2020 4.19 63.21 22.70 - 2.29 7.62 100
Papua New Guinea 1999 48.69 - 32.53 - 18.79 - 100
2020 37.01 - 40.24 - 22.75 - 100
Peru 1999 34.82 - 11.75 - 51.44 2.37 100
2020 1.06 7.51 50.20 - 40.04 1.19 100
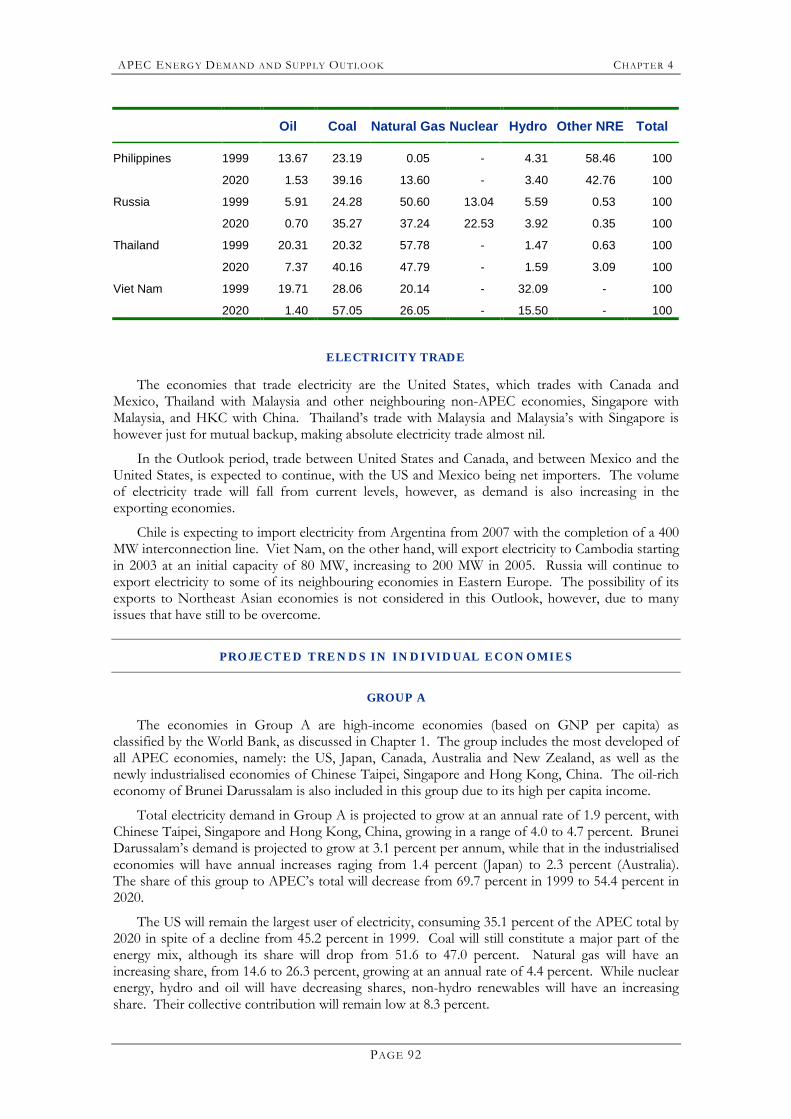
APEC ENERG Y DEMAND AN D SUPP LY OUTLOOK CHAPT ER 4
PAGE 92
Oil Coal Natural Gas Nuclear Hydro Other NRE Total
Philippines 1999 13.67 23.19 0.05 - 4.31 58.46 100
2020 1.53 39.16 13.60 - 3.40 42.76 100
Russia 1999 5.91 24.28 50.60 13.04 5.59 0.53 100
2020 0.70 35.27 37.24 22.53 3.92 0.35 100
Thailand 1999 20.31 20.32 57.78 - 1.47 0.63 100
2020 7.37 40.16 47.79 - 1.59 3.09 100
Viet Nam 1999 19.71 28.06 20.14 - 32.09 - 100
2020 1.40 57.05 26.05 - 15.50 - 100
ELECTRICITY TRADE
The economies that trade electricity are the United States, which trades with Canada and Mexico, Thailand with Malaysia and other neighbouring non-APEC economies, Singapore with Malaysia, and HKC with China. Thailand�s trade with Malaysia and Malaysia�s with Singapore is however just for mutual backup, making absolute electricity trade almost nil.
In the Outlook period, trade between United States and Canada, and between Mexico and the United States, is expected to continue, with the US and Mexico being net importers. The volume of electricity trade will fall from current levels, however, as demand is also increasing in the exporting economies.
Chile is expecting to import electricity from Argentina from 2007 with the completion of a 400 MW interconnection line. Viet Nam, on the other hand, will export electricity to Cambodia starting in 2003 at an initial capacity of 80 MW, increasing to 200 MW in 2005. Russia will continue to export electricity to some of its neighbouring economies in Eastern Europe. The possibility of its exports to Northeast Asian economies is not considered in this Outlook, however, due to many issues that have still to be overcome.
PROJECT ED TRENDS IN INDIVIDUAL ECONOMIES
GROUP A
The economies in Group A are high-income economies (based on GNP per capita) as classified by the World Bank, as discussed in Chapter 1. The group includes the most developed of all APEC economies, namely: the US, Japan, Canada, Australia and New Zealand, as well as the newly industrialised economies of Chinese Taipei, Singapore and Hong Kong, China. The oil-rich economy of Brunei Darussalam is also included in this group due to its high per capita income.
Total electricity demand in Group A is projected to grow at an annual rate of 1.9 percent, with Chinese Taipei, Singapore and Hong Kong, China, growing in a range of 4.0 to 4.7 percent. Brunei Darussalam�s demand is projected to grow at 3.1 percent per annum, while that in the industrialised economies will have annual increases raging from 1.4 percent (Japan) to 2.3 percent (Australia). The share of this group to APEC�s total will decrease from 69.7 percent in 1999 to 54.4 percent in 2020.
The US will remain the largest user of electricity, consuming 35.1 percent of the APEC total by 2020 in spite of a decline from 45.2 percent in 1999. Coal will still constitute a major part of the energy mix, although its share will drop from 51.6 to 47.0 percent. Natural gas will have an increasing share, from 14.6 to 26.3 percent, growing at an annual rate of 4.4 percent. While nuclear energy, hydro and oil will have decreasing shares, non-hydro renewables will have an increasing share. Their collective contribution will remain low at 8.3 percent.
APEC ENERG Y DEMAND AN D SUPP LY OUTLOOK CHAPT ER 4
PAGE 93
Japan will remain the second-largest user of electricity, but its share of total consumption will decline from 12.8 to 8.9 percent due to its relatively slower growth rate of 1.4 percent per annum, which is also the slowest among the 21 APEC economies. Its energy mix will maintain a significant share from nuclear energy, which will increase from 38.3 to 42.7 percent, reflecting Japan�s efforts to curb CO2 emissions. Coal will keep a stable share, shifting from 19.7 to 19.9 percent. Natural gas�s share will slightly decline from 20.1 to 19.3 percent, in spite of its annual growth rate of 1.1 percent. Non-hydro renewables will have a minimal share of 4.9 percent, increasing from 2.9 percent in 1999.
Australia, Canada and New Zealand will likewise have decreasing shares ranging from 0.1 to 1.4 percent in view of slower rates of growth in consumption with respect to total consumption of Group A. Coal made up 85.4 percent of Australia�s energy inputs in 1999. This dependence on coal will decline to 75.1 percent in 2020, with natural gas�s contribution increasing from 8.4 to 17.5 percent.
Natural gas�s contribution to Canada�s fuel mix will increase by 5.5 percent annually. Its share will consequently increase from 6.8 to 15.8 percent, partly dislodging coal�s share, which will fall to 23.2 from 29.4 percent. Nuclear and hydro will maintain stable shares of 24.2 and 33.6 percent, respectively. The increase in nuclear generation is not due to new capacity additions but to the return to service of around 2,800 MW of idled nuclear reactors.
Electricity consumption in New Zealand will increase at a rate of 1.5 percent annually. Most of the energy requirements to meet this demand will come from geothermal, which will increase at an annual rate of 3.2 percent. Natural gas will also have an increasing share, growing at 2.1 percent per annum. Its share will increase from 29.0 to 30.7 percent. The share of hydropower will increase by 0.6 percent annually. The most significant growth will come from wind energy, whose contribution will increase at an annual rate of 12.9 percent. Its share will remain low, however, reaching just 0.6 percent in 2020.
The energy mix in Hong Kong, China will be dominated by natural gas in 2020, dislodging coal, which had a 60.4 percent share in 1999. This is brought about by the retirement of ageing coal-fired facilities, which will be replaced by natural gas power plants. Hence, natural gas consumption in the power sector will grow at an annual rate of 8.6 percent. Coal, on the other hand, will have an annual decline of 5.5 percent. Oil, although its share remains below 2.0 percent, will grow by 7.0 percent annually to provide for the peak load requirements in the economy.
In Chinese Taipei, rapid growth in natural gas consumption of 9.0 percent can be expected. Its share will increase from 7.4 to 21.6 percent. Coal and nuclear energy will also grow, albeit at a slower pace of 3.8 and 3.6 percent, respectively, keeping stable shares in the energy mix. Oil consumption in electricity generation will decline by 7.9 percent annually.
Singapore�s energy mix will become less oil-dominated (from 82.1 percent in 1999 to 45.7 percent in 2020) with the availability of more natural gas with the completion of a pipeline from Indonesia. It is projected that new capacity requirements will be fuelled by natural gas in view of its over-dependence in oil. Natural gas�s share in the energy mix will increase from 15.6 to 53.0 percent. Coal is not an option in the economy due to geographic limitations.
Brunei Darussalam will continue to use natural gas, which forms 99 percent of its energy inputs in power generation, due to the abundance of this resource in the economy. Oil will still be used but on a limited scale, only in isolated areas that are far from the grid.
GROUP B
Electricity demand of the economies in Group B will grow by 5.3 percent per annum, the fastest growth rates among the economy groups. Among the economies in this group, Chile will have the fastest growth rate at 6.2 percent, followed by Malaysia at 6.1 percent. Mexico comes third with 5.7 percent and then Korea at 4.7 percent.
The energy requirements to meet demand in Chile will mostly come from natural gas, which will grow by 12.8 percent annually. The low price of natural gas in Chile makes it a more economic
APEC ENERG Y DEMAND AN D SUPP LY OUTLOOK CHAPT ER 4
PAGE 94
choice for baseload operation. There is no expected addition of coal capacity42. Hydroelectricity will increase at an annual rate of 3.6 percent.
In Korea, growing electricity demand will be met by construction of coal, natural gas and nuclear facilities. Growth in the contribution from these energy resources will be 5.9, 5.5 and 3.3 percent, respectively. Hydroelectricity�s share will also grow by 3.9 percent annually.
In Malaysia, due to the government�s thrust for diversification, coal�s contribution will grow at an annual rate of 18.3 percent. Its share to the energy mix will increase from 2.9 percent in 1999 to 31.5 percent in 2020. Natural gas, which will maintain a substantial share in the mix, will grow by 4.2 percent annually, while hydro will increase by 4.9 percent.
Mexico�s energy mix will shift from oil to coal and natural gas in the future. In 1999, oil constituted 46.7 percent of the total energy mix, with natural gas having a share of 20.1 percent. This will radically change by 2020, with oil�s share reduced to 0.9 percent. The contribution of coal and natural gas will increase at annual rates of 9.7 and 9.5 percent, respectively, to give them shares of 27.0 and 56.8 percent by 2020.
GROUP C
The forecast collective growth rate of electricity consumption in Group C is 5.1 percent. As shown in Table 24, growth rates of the economies in this group vary widely. The lowest growth rate of 2.7 percent will be experienced in Papua New Guinea, while the highest will be in Viet Nam at 8.2 percent. The most notable among these economies are China and Russia, which constitute 54.3 and 32.9 percent, respectively, of total demand of the group in 1999. In the future, these shares will change to 59.5 and 24.8 percent, respectively.
In terms of fuel inputs for power generation, coal will continue to constitute more than half of the energy requirements (55.4 percent in 1999 to 56.9 percent in 2020). Natural gas will still be the next most important fuel, keeping its share above 20 percent throughout the Outlook period. The fastest-growing fuel (at 6.3 percent) will be nuclear, underpinned by the construction of more nuclear facilities in China and Russia. Coal and natural gas will have slower growth rates due to the current high level of penetration of these fuels. Non-hydro renewables, although growing at 3.8 percent annually, will still have a low share of 2.2 percent by 2020.
China�s energy mix in power generation will continue to be dominated by coal, which will grow by 3.3 percent annually, although coal�s share is projected to decline from 87.8 to 71.5 percent. The decline will be made up by the increase in utilisation of natural gas, nuclear and hydroelectric energy for power generation. The respective contributions from these energy sources will increase at annual rates of 21.1, 8.5 and 11.6 percent. In view of the limited reserves of natural gas in China, huge amounts of imports will be needed either through pipelines from Central or Southeast Asia, or through LNG imports.
For Russia, it is projected that coal will increase its share of the energy mix in power generation by 2020. From 24.3 percent in 1999, coal�s share will increase to 35.3 percent in 2020, growing by 4.3 percent annually. Natural gas, on the other hand, will have a decreasing share from 50.6 to 37.2 percent, with an annual growth rate of a mere 0.9 percent. This is due to the policy of the Russian government to diversify energy sources to reduce over-dependence on natural gas. Nuclear energy is also expected to increase, growing by 5.1 percent per annum. Oil�s share in the energy mix will also decline by 7.4 percent per annum.
Thailand was the third-biggest electricity consumer among the Group C economies in 1999. Its demand is projected to grow at an annual rate of 5.5 percent. Coal is projected to be the most economic option to provide for the baseload requirements of this economy, growing by 8.3 percent annually during the Outlook period. It will constitute 40.2 percent of the total fuel requirements in 2020. Natural gas will be used for intermediate and peaking load requirements and will grow by 3.9 percent per annum. By 2020, its share will decline to 47.8 from 57.8 percent in 1999.
42 This Outlook did not consider the recent approval of the use of petcoke combined with coal in power generation.
APEC ENERG Y DEMAND AN D SUPP LY OUTLOOK CHAPT ER 4
PAGE 95
Indonesia, a producer of natural gas, is projected to put more coal in its energy mix in view of the government policy to increase utilisation of this indigenous resource. This will result in 9.2 percent annual growth in coal consumption in the electricity sector, increasing the share from 36.4 percent in 1999 to 63.2 percent in 2020. Natural gas will grow by 5.0 percent per annum, but its share will fall from 29.8 to 22.7 percent during the same period. Oil, which has a contribution of 17.8 percent in 1999, will have a declining growth rate of 0.75 percent, and by 2020 its share will drop to 4.2 percent. Power system expansion planned in Indonesia sees the development of hydroelectric and geothermal power plants. This will result in 3.4 percent growth in the contribution of hydroelectric and 3.8 percent in geothermal.
The Philippines� power generation fuel mix will become more coal-dependent in the next two decades, with coal consumption growing at 7.0 percent per annum. Oil�s contribution, on the other hand, will fall at an annual rate of 6.0 percent. Natural gas, which will be used for large-scale power generation starting in 2002, will have a 13.6 percent share by 2020 from almost nil in 1999. The contribution of geothermal energy and hydroelectricity will increase by 2.7 and 3.1 percent, respectively, but their shares will drop from 58.8 to 41.9 percent and from 4.3 to 3.4 percent. Wind energy will also be tapped for power generation but its share of the mix will be only 0.2 percent in 2020.
Viet Nam�s electricity consumption will be the fastest-growing among the 21 APEC economies. This will entail growth of 12.7 percent coal consumption and 10.3 percent in that of natural gas, with hydropower growing 5.2 percent.
Peru�s hydro-dominated energy mix will become dependent on natural gas in 2020, with natural gas�s share ballooning to 50.2 percent from 11.7 percent in 1999. Coal will also be used in the economy but on a limited scale, with its share forming only 7.5 percent of the energy mix. The 34.8 percent share of oil will decline at an annual rate of 12.0 percent, dwindling eventually to 1.1 percent in 2020.
Papua New Guinea�s projected 2.7 percent growth in electricity demand could be met by increases of 3.5, 3.4 and 1.1 percent in natural gas, hydro and oil in its energy mix. Papua New Guinea has natural gas reserves that will soon be developed for export to Australia, and part of the gas could be used for domestic electricity production.
ALTERNATIVE SCENARIO
A study looking into the possible effects that emerging technologies, policies and measures could have on demand and supply patterns in APEC economies over the next 20 years was conducted as a supplement to this Outlook. The areas that were considered were as follows:
! Reduction of demand for electricity through more efficient demand technologies and demand-side management (DSM);
! Increasing efficiency of fossil fuel-fired power plants and transmission;
! Increased penetration of cogeneration and distributed generation; and
! Increased generation from new and renewable energy such as wind, solar, biomass and geothermal
With the assumption of energy efficiency improvements in demand technologies and implementation of DSM measures, electricity demand is projected to grow at a lower annual rate between 2004 and 2020 of 2.6 percent, compared with the 3.2 percent annual escalation in the Reference case (Figure 43). A more detailed discussion on this is presented in APERC, 200243.
43 APERC, (2002a), �Alternative Development Scenarios for Electricity and Transport to 2020 for the APEC Region�.
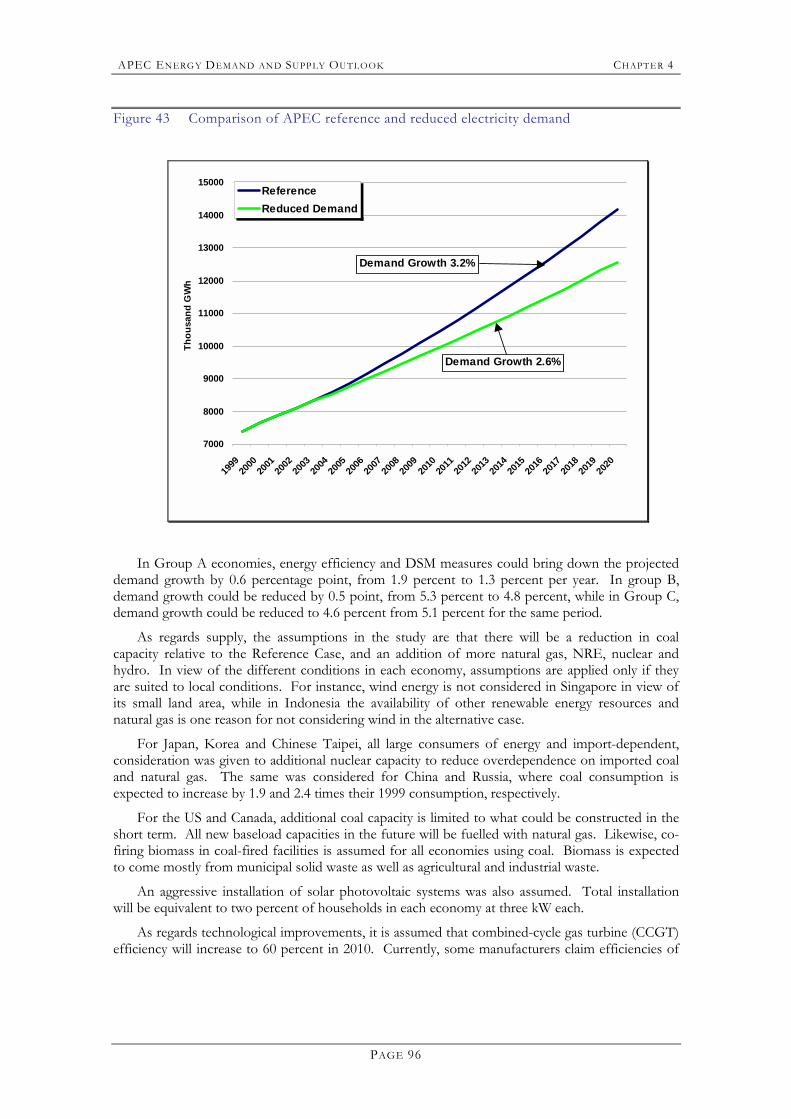
APEC ENERG Y DEMAND AN D SUPP LY OUTLOOK CHAPT ER 4
PAGE 96
Figure 43 Comparison of APEC reference and reduced electricity demand
7000
8000
9000
10000
11000
12000
13000
14000
15000
1999
2000
2001
2002
2003
2004
2005
2006
2007
2008
2009
2010
2011
2012
2013
2014
2015
2016
2017
2018
2019
2020
Thou
sand
GW
hReferenceReduced Demand
Demand Growth 3.2%
Demand Growth 2.6%
In Group A economies, energy efficiency and DSM measures could bring down the projected demand growth by 0.6 percentage point, from 1.9 percent to 1.3 percent per year. In group B, demand growth could be reduced by 0.5 point, from 5.3 percent to 4.8 percent, while in Group C, demand growth could be reduced to 4.6 percent from 5.1 percent for the same period.
As regards supply, the assumptions in the study are that there will be a reduction in coal capacity relative to the Reference Case, and an addition of more natural gas, NRE, nuclear and hydro. In view of the different conditions in each economy, assumptions are applied only if they are suited to local conditions. For instance, wind energy is not considered in Singapore in view of its small land area, while in Indonesia the availability of other renewable energy resources and natural gas is one reason for not considering wind in the alternative case.
For Japan, Korea and Chinese Taipei, all large consumers of energy and import-dependent, consideration was given to additional nuclear capacity to reduce overdependence on imported coal and natural gas. The same was considered for China and Russia, where coal consumption is expected to increase by 1.9 and 2.4 times their 1999 consumption, respectively.
For the US and Canada, additional coal capacity is limited to what could be constructed in the short term. All new baseload capacities in the future will be fuelled with natural gas. Likewise, co-firing biomass in coal-fired facilities is assumed for all economies using coal. Biomass is expected to come mostly from municipal solid waste as well as agricultural and industrial waste.
An aggressive installation of solar photovoltaic systems was also assumed. Total installation will be equivalent to two percent of households in each economy at three kW each.
As regards technological improvements, it is assumed that combined-cycle gas turbine (CCGT) efficiency will increase to 60 percent in 2010. Currently, some manufacturers claim efficiencies of
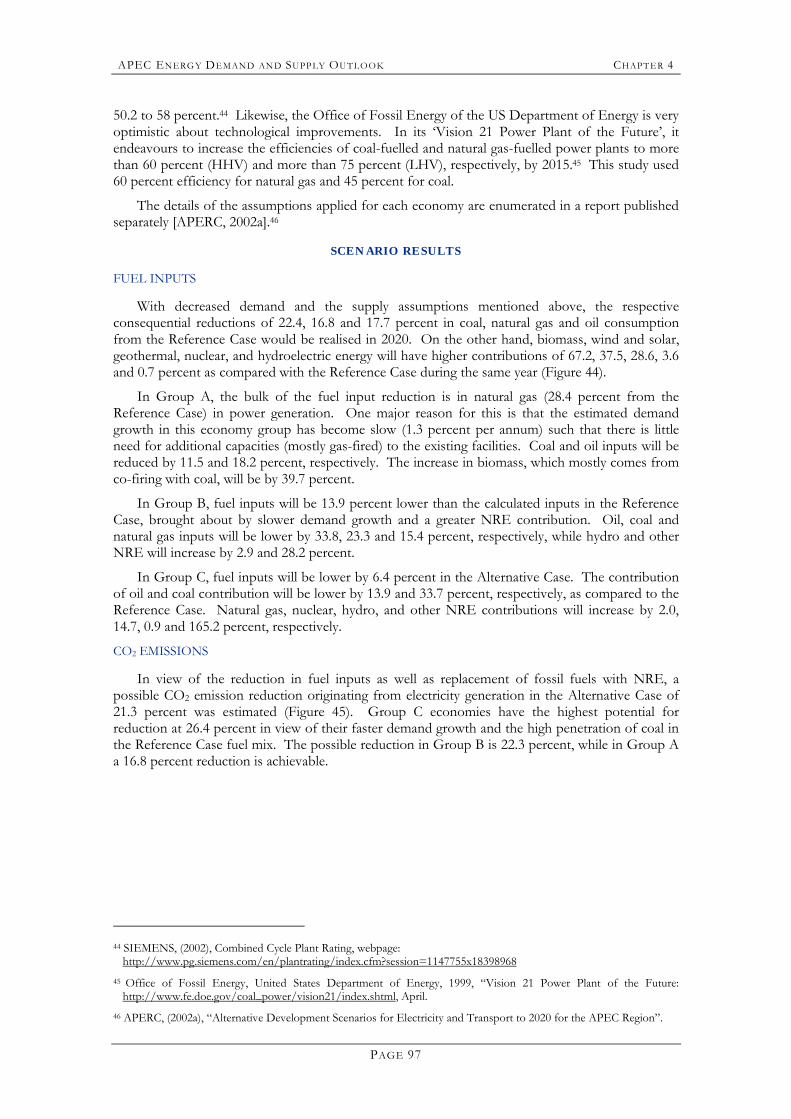
APEC ENERG Y DEMAND AN D SUPP LY OUTLOOK CHAPT ER 4
PAGE 97
50.2 to 58 percent.44 Likewise, the Office of Fossil Energy of the US Department of Energy is very optimistic about technological improvements. In its �Vision 21 Power Plant of the Future�, it endeavours to increase the efficiencies of coal-fuelled and natural gas-fuelled power plants to more than 60 percent (HHV) and more than 75 percent (LHV), respectively, by 2015.45 This study used 60 percent efficiency for natural gas and 45 percent for coal.
The details of the assumptions applied for each economy are enumerated in a report published separately [APERC, 2002a].46
SCENARIO RESULTS
FUEL INPUTS
With decreased demand and the supply assumptions mentioned above, the respective consequential reductions of 22.4, 16.8 and 17.7 percent in coal, natural gas and oil consumption from the Reference Case would be realised in 2020. On the other hand, biomass, wind and solar, geothermal, nuclear, and hydroelectric energy will have higher contributions of 67.2, 37.5, 28.6, 3.6 and 0.7 percent as compared with the Reference Case during the same year (Figure 44).
In Group A, the bulk of the fuel input reduction is in natural gas (28.4 percent from the Reference Case) in power generation. One major reason for this is that the estimated demand growth in this economy group has become slow (1.3 percent per annum) such that there is little need for additional capacities (mostly gas-fired) to the existing facilities. Coal and oil inputs will be reduced by 11.5 and 18.2 percent, respectively. The increase in biomass, which mostly comes from co-firing with coal, will be by 39.7 percent.
In Group B, fuel inputs will be 13.9 percent lower than the calculated inputs in the Reference Case, brought about by slower demand growth and a greater NRE contribution. Oil, coal and natural gas inputs will be lower by 33.8, 23.3 and 15.4 percent, respectively, while hydro and other NRE will increase by 2.9 and 28.2 percent.
In Group C, fuel inputs will be lower by 6.4 percent in the Alternative Case. The contribution of oil and coal contribution will be lower by 13.9 and 33.7 percent, respectively, as compared to the Reference Case. Natural gas, nuclear, hydro, and other NRE contributions will increase by 2.0, 14.7, 0.9 and 165.2 percent, respectively.
CO2 EMISSIONS
In view of the reduction in fuel inputs as well as replacement of fossil fuels with NRE, a possible CO2 emission reduction originating from electricity generation in the Alternative Case of 21.3 percent was estimated (Figure 45). Group C economies have the highest potential for reduction at 26.4 percent in view of their faster demand growth and the high penetration of coal in the Reference Case fuel mix. The possible reduction in Group B is 22.3 percent, while in Group A a 16.8 percent reduction is achievable.
44 SIEMENS, (2002), Combined Cycle Plant Rating, webpage:
http://www.pg.siemens.com/en/plantrating/index.cfm?session=1147755x18398968 45 Office of Fossil Energy, United States Department of Energy, 1999, �Vision 21 Power Plant of the Future:
http://www.fe.doe.gov/coal_power/vision21/index.shtml, April. 46 APERC, (2002a), �Alternative Development Scenarios for Electricity and Transport to 2020 for the APEC Region�.
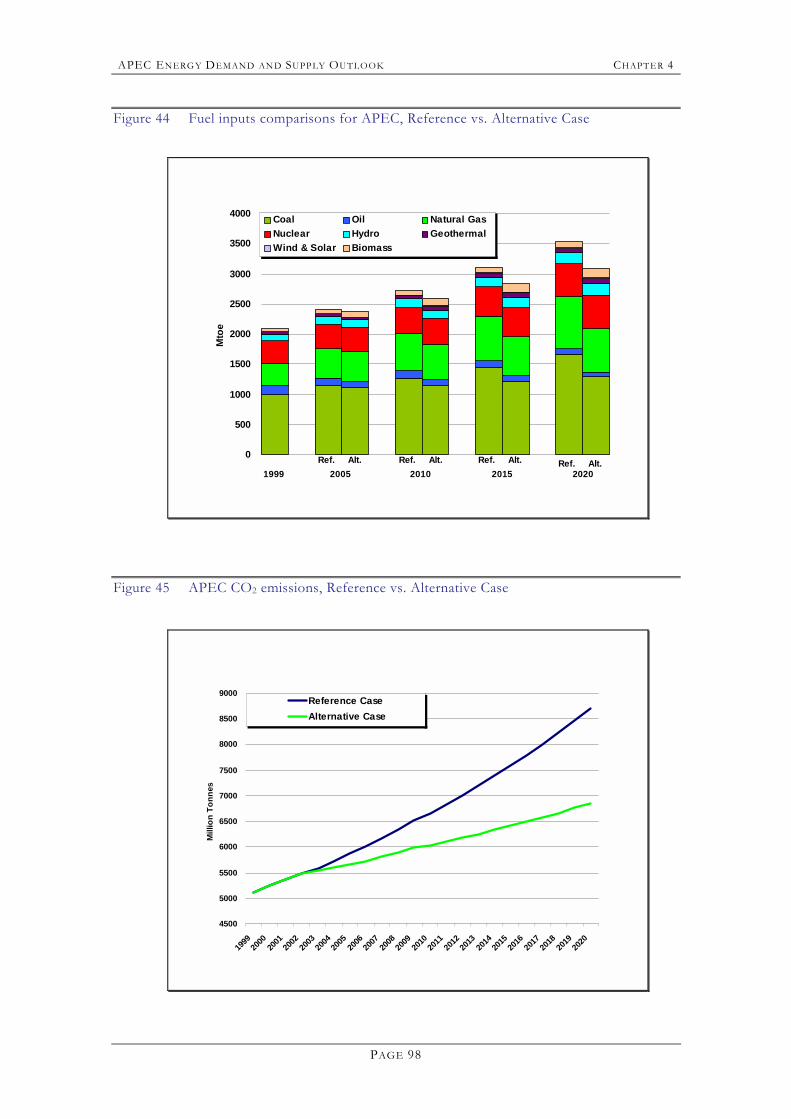
APEC ENERG Y DEMAND AN D SUPP LY OUTLOOK CHAPT ER 4
PAGE 98
Figure 44 Fuel inputs comparisons for APEC, Reference vs. Alternative Case
0
500
1000
1500
2000
2500
3000
3500
4000M
toe
Coal Oil Natural Gas Nuclear Hydro GeothermalWind & Solar Biomass
1999 2005 2010 2015 2020Ref. Alt. Ref. Alt. Ref. Alt. Ref. Alt.
Figure 45 APEC CO2 emissions, Reference vs. Alternative Case
4500
5000
5500
6000
6500
7000
7500
8000
8500
9000
1999
2000
2001
2002
2003
2004
2005
2006
2007
2008
2009
2010
2011
2012
2013
2014
2015
2016
2017
2018
2019
2020
Mill
ion
Tonn
es
Reference CaseAlternative Case
APEC ENERG Y DEMAND AN D SUPP LY OUTLOOK CHAPT ER 5
PAGE 99
C H A P T E R 5 INVESTMENT
There is increasing concern that the future growth rate in APEC economies� energy demand will place extraordinary strain on their capacity to appropriate or attract funding needed to develop required infrastructure. Energy demand has risen rapidly as a result of population and income growth in the APEC region, and this trend will continue for the next 20 years at a higher rate than in other parts of the world, as suggested by our forecast in this Outlook.
In this Chapter, an attempt is made to estimate the magnitude of investment needed by APEC economies for energy infrastructure. Taking advantage of energy demand projections developed for this Outlook for each different type of fuel, an estimate is made of infrastructure required and its associated capital cost in the main stages of energy procurement -- from resource extraction to processing, transformation and transport of energy to consumption centres.
Also included is a discussion on the importance of foreign direct investment (FDI) in the search for funds and the factors and mechanisms that determine its contribution in a given economy.
AVAILABILITY OF INVESTMENT CAPITAL
The sums required for infrastructure in the energy sector are not insignificant, and with the future trends of growing energy demand, they will only get larger with time. Some forecast studies show that energy demand, and therefore investment requirements, grows more slowly than the economy itself, but nevertheless it will become more and more difficult for economies to provide all of the funds required.
Developing energy infrastructure takes a long period of gestation and implementation, inevitably accompanied by the need for large amounts of capital investment. For example, a 600MW thermal power plant project would require several years for pre-feasibility and feasibility studies, more time for the long process of due diligence, and two to four years for the actual construction of the plant. In addition, throughout its operation, which could extend to some three decades, a constant inflow of capital is required for refurbishments, upgrades and expansions. In the end, such a project could involve total capital costs ranging from hundreds of millions up to a billion US dollars.
The energy sector is in need of investment at a time when accessibility to public funds is becoming ever more difficult. Governments need to direct available monetary resources into priority activities such as investing in social services, reducing fiscal deficits and downsizing their public sector. What is more, the largest investment needs will be in the developing world, where these problems are exacerbated and where historically the availability of investment capital has been limited.
In the APEC region the level of development of energy infrastructure varies as widely as that of economic development. Economies with relatively low per capita incomes (Group C, for the most part) are experiencing persistent need and shortage of energy infrastructure to cope with growing energy demand. Unlike the industrialised world, developing economies have insufficient domestic capital formation and low solvency in financial markets when it comes to energy projects. Therefore an increasing proportion of the capital required for the energy sector will have to be obtained from alternative resources other than the public. Reliance on foreign capital from industrialised countries appears to be imperative in the future.
In addition, energy infrastructure projects are not necessarily the most attractive among competing investment opportunities internationally. Efforts are needed to make energy
APEC ENERG Y DEMAND AN D SUPP LY OUTLOOK CHAPT ER 5
PAGE 100
investments more attractive and provide a transparent and stable environment for potential investors. In this context, it is paramount to harmonise investors� interests and the host economy�s needs.
CAPITAL MARKETS
In recent years, trends in capital markets have shown them to be growing at a faster pace than GDP. In 1998, global energy investments accounted for about seven percent of international credit financing. These trends are likely to continue, so if it is assumed that the energy investment ratio remains stable and that capital markets grow relative to GDP, capital market size does not appear to be a limiting factor for energy sector finance.47 The issue of most importance, then, is finding the most effective ways to channel the available capital into the economies that most need it.
A number of economies have recognised the need to lower regulatory and market barriers to attract foreign involvement. Such is the case with major oil and gas producers in Africa, the Middle East and Latin America. Algeria, Egypt, Libya and Nigeria, among others, have changed their upstream policies and practices to attract joint-venture investment by international oil companies. Venezuela has sought private investment in the oil and gas sectors. Saudi Arabia has recently started to open its upstream gas sector to foreign companies. China and India will require huge amounts of capital to meet their ambitious plans for coal production. Increased foreign direct investment and partnerships between international and national energy companies would make more supply projects possible and limit investment risk for all participants.48
In the oil industry, one of the most significant trends in capital spending in the last few years has been a geographical shift. Larger amounts of capital from major international companies are being invested in places other than the United States. International companies are looking at opportunities in areas that were previously not open to outside private investments.
Russia and the former Soviet Union republics are some of the more attractive areas. There is a large resource base that has been generating a lot of attention from international companies experienced in oil industry activity throughout the world.
In addition, many of the oil producing countries of Africa and Latin America are aggressively trying to attract capital investment by offering better fiscal terms to investing companies. Even the OPEC countries are considering joint production and development agreements in order to attract the capital needed to expand capacity.49
FRACTION OF ENERGY INVESTMENTS
To put the historical trends of energy investment into context, it can be compared to overall economic activity. Average global capital spending on energy in the early 1990s was in a range of US$240-280 billion per year, which at the time amounted to one percent of gross world product (GWP). Power sector investments, which are the most capital-intensive in energy, accounted for about 0.7-0.8 percent of GWP in 1998 (EIA, 1998; IEA, 1998). The initial procurement operations in the coal, oil, and gas sectors account for another 0.3-0.4 percent. Even if non-electric downstream investments are included, total energy sector investments in the 1990s still do not exceed 1.5 percent of GWP. Faster growth in generation capacity is likely in the future, reversing the recent trend that was due in part to demand-side management and the appearance of independent power producers. But even considering extreme conditions of rapid power capacity expansion together with more stringent environmental constraints, global energy sector investments are unlikely to exceed two percent of GWP. 50
47 �Global Energy Perspectives�. International Institute for Applied Systems Analysis (IIASA), World Energy Council
(WEC). Cambridge University Press. 1998. 48 �World Energy Outlook 2001�. IEA/OECD. 2001. 49 �Worldwide Petroleum Industry Outlook�. Robert J. Beck. PennWell. 2001. 50 �Global Energy Perspectives�. IIASA/WEC. Cambridge University Press. 1998.
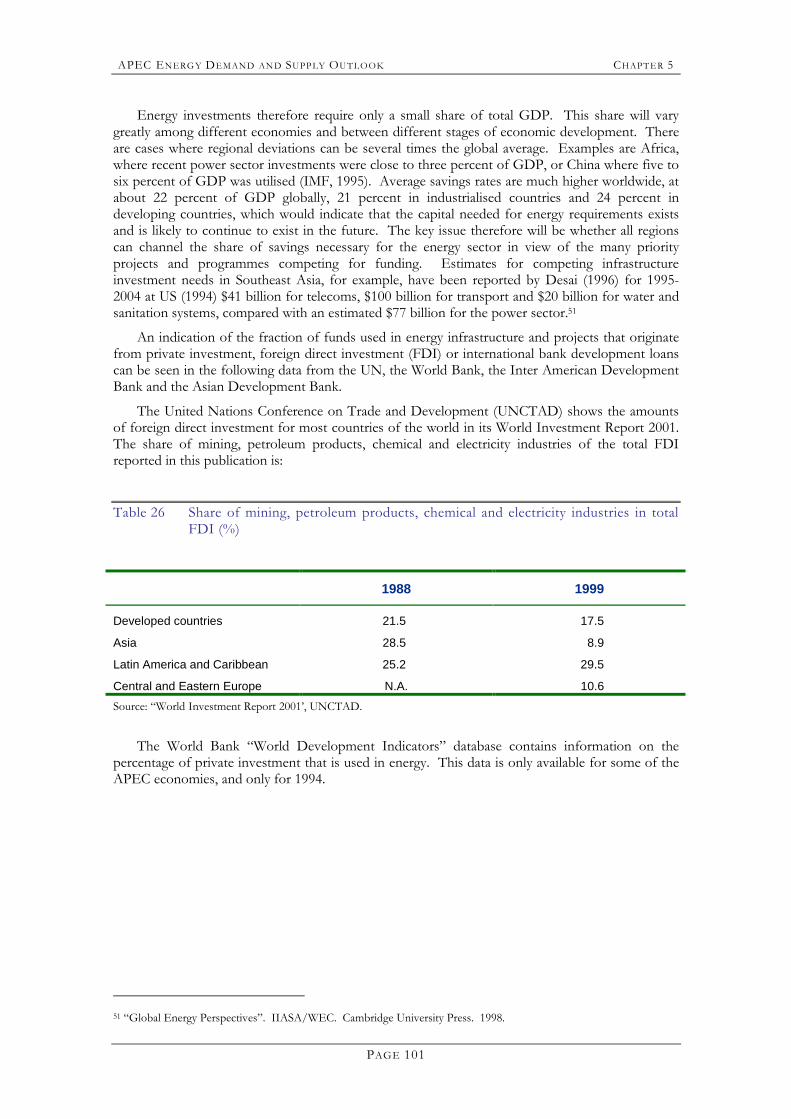
APEC ENERG Y DEMAND AN D SUPP LY OUTLOOK CHAPT ER 5
PAGE 101
Energy investments therefore require only a small share of total GDP. This share will vary greatly among different economies and between different stages of economic development. There are cases where regional deviations can be several times the global average. Examples are Africa, where recent power sector investments were close to three percent of GDP, or China where five to six percent of GDP was utilised (IMF, 1995). Average savings rates are much higher worldwide, at about 22 percent of GDP globally, 21 percent in industrialised countries and 24 percent in developing countries, which would indicate that the capital needed for energy requirements exists and is likely to continue to exist in the future. The key issue therefore will be whether all regions can channel the share of savings necessary for the energy sector in view of the many priority projects and programmes competing for funding. Estimates for competing infrastructure investment needs in Southeast Asia, for example, have been reported by Desai (1996) for 1995-2004 at US (1994) $41 billion for telecoms, $100 billion for transport and $20 billion for water and sanitation systems, compared with an estimated $77 billion for the power sector.51
An indication of the fraction of funds used in energy infrastructure and projects that originate from private investment, foreign direct investment (FDI) or international bank development loans can be seen in the following data from the UN, the World Bank, the Inter American Development Bank and the Asian Development Bank.
The United Nations Conference on Trade and Development (UNCTAD) shows the amounts of foreign direct investment for most countries of the world in its World Investment Report 2001. The share of mining, petroleum products, chemical and electricity industries of the total FDI reported in this publication is:
Table 26 Share of mining, petroleum products, chemical and electricity industries in total FDI (%)
1988 1999
Developed countries 21.5 17.5
Asia 28.5 8.9
Latin America and Caribbean 25.2 29.5
Central and Eastern Europe N.A. 10.6 Source: �World Investment Report 2001�, UNCTAD.
The World Bank �World Development Indicators� database contains information on the percentage of private investment that is used in energy. This data is only available for some of the APEC economies, and only for 1994.
51 �Global Energy Perspectives�. IIASA/WEC. Cambridge University Press. 1998.
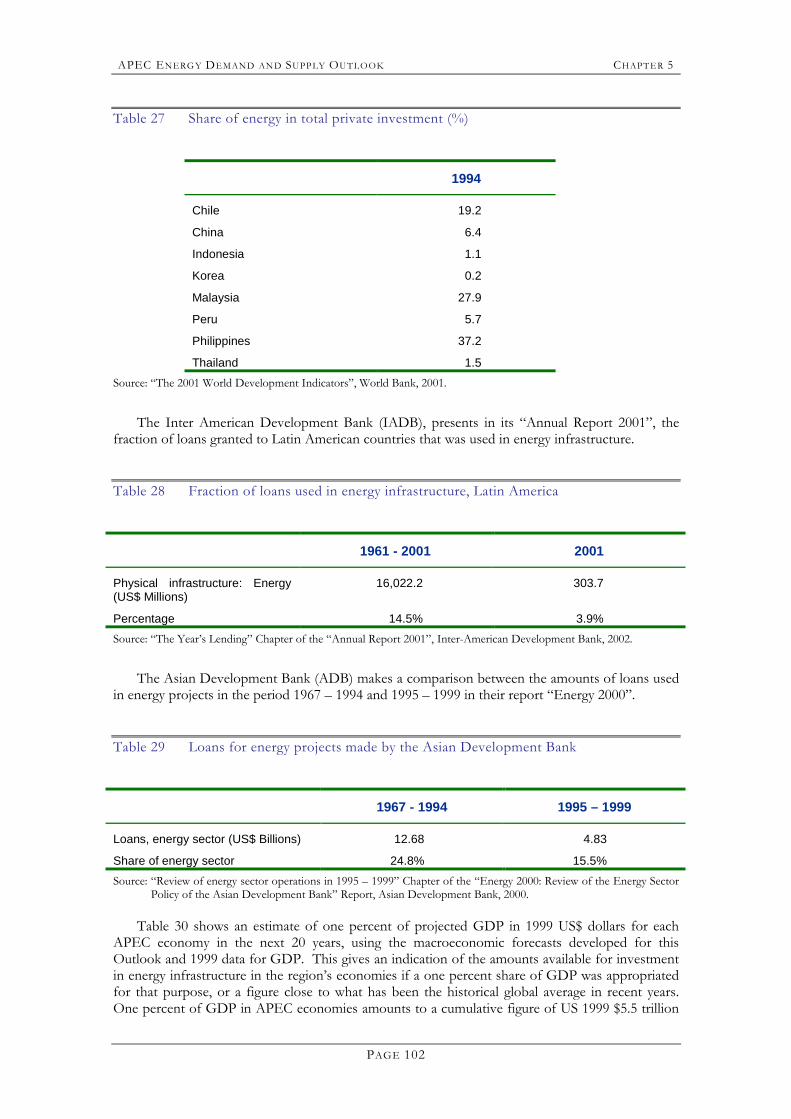
APEC ENERG Y DEMAND AN D SUPP LY OUTLOOK CHAPT ER 5
PAGE 102
Table 27 Share of energy in total private investment (%)
1994
Chile 19.2
China 6.4
Indonesia 1.1
Korea 0.2
Malaysia 27.9
Peru 5.7
Philippines 37.2
Thailand 1.5 Source: �The 2001 World Development Indicators�, World Bank, 2001.
The Inter American Development Bank (IADB), presents in its �Annual Report 2001�, the fraction of loans granted to Latin American countries that was used in energy infrastructure.
Table 28 Fraction of loans used in energy infrastructure, Latin America
1961 - 2001 2001
Physical infrastructure: Energy (US$ Millions)
16,022.2 303.7
Percentage 14.5% 3.9% Source: �The Year�s Lending� Chapter of the �Annual Report 2001�, Inter-American Development Bank, 2002.
The Asian Development Bank (ADB) makes a comparison between the amounts of loans used in energy projects in the period 1967 � 1994 and 1995 � 1999 in their report �Energy 2000�.
Table 29 Loans for energy projects made by the Asian Development Bank
1967 - 1994 1995 – 1999
Loans, energy sector (US$ Billions) 12.68 4.83
Share of energy sector 24.8% 15.5% Source: �Review of energy sector operations in 1995 � 1999� Chapter of the �Energy 2000: Review of the Energy Sector
Policy of the Asian Development Bank� Report, Asian Development Bank, 2000.
Table 30 shows an estimate of one percent of projected GDP in 1999 US$ dollars for each APEC economy in the next 20 years, using the macroeconomic forecasts developed for this Outlook and 1999 data for GDP. This gives an indication of the amounts available for investment in energy infrastructure in the region�s economies if a one percent share of GDP was appropriated for that purpose, or a figure close to what has been the historical global average in recent years. One percent of GDP in APEC economies amounts to a cumulative figure of US 1999 $5.5 trillion
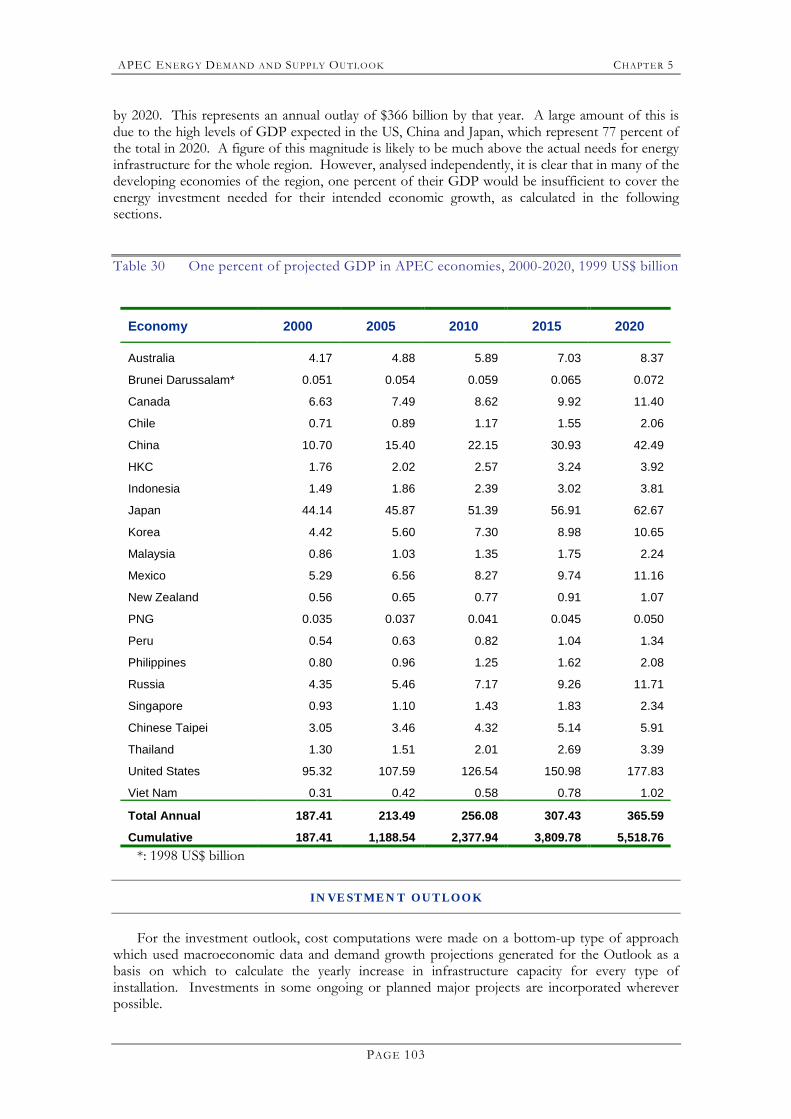
APEC ENERG Y DEMAND AN D SUPP LY OUTLOOK CHAPT ER 5
PAGE 103
by 2020. This represents an annual outlay of $366 billion by that year. A large amount of this is due to the high levels of GDP expected in the US, China and Japan, which represent 77 percent of the total in 2020. A figure of this magnitude is likely to be much above the actual needs for energy infrastructure for the whole region. However, analysed independently, it is clear that in many of the developing economies of the region, one percent of their GDP would be insufficient to cover the energy investment needed for their intended economic growth, as calculated in the following sections.
Table 30 One percent of projected GDP in APEC economies, 2000-2020, 1999 US$ billion
Economy 2000 2005 2010 2015 2020
Australia 4.17 4.88 5.89 7.03 8.37
Brunei Darussalam* 0.051 0.054 0.059 0.065 0.072
Canada 6.63 7.49 8.62 9.92 11.40
Chile 0.71 0.89 1.17 1.55 2.06
China 10.70 15.40 22.15 30.93 42.49
HKC 1.76 2.02 2.57 3.24 3.92
Indonesia 1.49 1.86 2.39 3.02 3.81
Japan 44.14 45.87 51.39 56.91 62.67
Korea 4.42 5.60 7.30 8.98 10.65
Malaysia 0.86 1.03 1.35 1.75 2.24
Mexico 5.29 6.56 8.27 9.74 11.16
New Zealand 0.56 0.65 0.77 0.91 1.07
PNG 0.035 0.037 0.041 0.045 0.050
Peru 0.54 0.63 0.82 1.04 1.34
Philippines 0.80 0.96 1.25 1.62 2.08
Russia 4.35 5.46 7.17 9.26 11.71
Singapore 0.93 1.10 1.43 1.83 2.34
Chinese Taipei 3.05 3.46 4.32 5.14 5.91
Thailand 1.30 1.51 2.01 2.69 3.39
United States 95.32 107.59 126.54 150.98 177.83
Viet Nam 0.31 0.42 0.58 0.78 1.02
Total Annual 187.41 213.49 256.08 307.43 365.59
Cumulative 187.41 1,188.54 2,377.94 3,809.78 5,518.76 *: 1998 US$ billion
INVESTMENT OUTLOOK
For the investment outlook, cost computations were made on a bottom-up type of approach which used macroeconomic data and demand growth projections generated for the Outlook as a basis on which to calculate the yearly increase in infrastructure capacity for every type of installation. Investments in some ongoing or planned major projects are incorporated wherever possible.
APEC ENERG Y DEMAND AN D SUPP LY OUTLOOK CHAPT ER 5
PAGE 104
The most important areas of energy infrastructure were considered, specifically: coal, oil and gas procurement, petrochemical and sulphur plants, oil and gas transport and power generation and transmission.
For coal supply, costs were calculated based on coal production expected of each economy in the future, including transport costs, which in the case of coal sometimes can be as much as 50 percent of the total.
Costs for oil and gas production are included. The costs of oil and gas exploration were considered as a fraction of the global costs of production. The estimates add the cost for the installations required for oil refinery and gas processing. Petrochemical installations and sulphur production plants were included on the basis that their need arises from the production and processing of oil.
The figures for oil and gas transport include the cost of pipelines and tankers required for international trade in the case of oil, and for pipelines, tankers and LNG facilities required for international trade in the case of natural gas. No consideration is given in these calculations to the additional infrastructure required for domestic transmission of oil and gas, as no reliable and consistent information was found for the 21 APEC economies. The transport calculations also include the most important known pipeline and LNG projects in the area programmed to date.
The cost of power generation was estimated based on the additional installed capacity needed to meet demand for electricity in the different sectors of each economy as calculated by the LEAP model. Transmission costs were also calculated as a function of the additional capacity, but no consideration was given to the cost of the required final distribution capacity.
The investment estimates also do not include costs of renewable energies other than large hydro, biomass, geothermal, wind, solar thermal and solar photovoltaic systems used for power generation. Heat facilities are also excluded except for those used in cogeneration, and no allowance is made either for the cost of energy efficiency technologies or emission control hardware for the improvement of existing installations.
Specific investment terms are not static in the long run. With time, costs tend to diminish as a result of innovation, manufacturing improvements and advances in technical know-how. Also, energy infrastructure requirements in the future can vary depending on technical improvements achieved on efficiencies, emissions and other performance characteristics. Pressure to push up costs will come from new environmental regulation and awareness of sustainability of resources.
Table 31 shows that by 2020, the estimated requirements of capital for energy infrastructure will be in a range of 1999 US$130-170 billion. The total amount accumulated in the 20-year period starting in 2000 needed in the APEC region will be 1999 US$2.2-2.8 trillion dollars. It must be remembered, however, that this figure does not include minor renewable energies, heat facilities, domestic pipelines, electricity distribution, energy efficiency or emission control technologies.
The bulk of investments in energy will be concentrated in China, Russia and the United States, with yearly total energy investments required by the year 2020 of around US$52 billion, US$20 billion and US$15 billion, respectively. In that same year, investments in these economies will account for 58 percent of the APEC total. APEC economies in Southeast Asia, comprising Brunei Darussalam, Indonesia, Malaysia, the Philippines, Singapore, Thailand and Viet Nam, and representative of developing economies in Asia, will invest US$27 billion, or 16 percent of the total APEC requirements, in 2020. Northeast Asia, which includes Japan, Korea, Chinese Taipei and Hong Kong, China, and is representative of industrialised Asia, will account for US$15 billion, or 10 percent, of the investment in energy. Chile, Mexico and Peru together will have investments of the order of US$14 billion, or nine percent of the total in the region, and the economies of Oceania will have the lowest share of investments with 1.7 percent, amounting to US$3 billion by 2020.
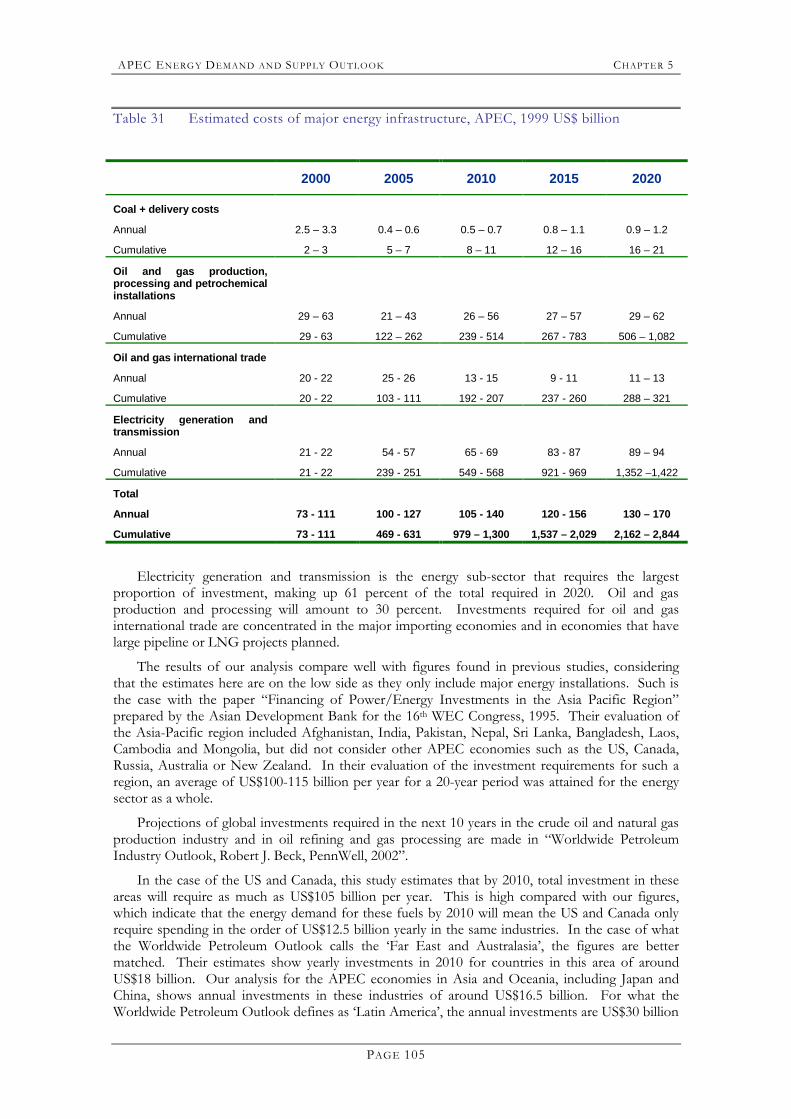
APEC ENERG Y DEMAND AN D SUPP LY OUTLOOK CHAPT ER 5
PAGE 105
Table 31 Estimated costs of major energy infrastructure, APEC, 1999 US$ billion
2000 2005 2010 2015 2020
Coal + delivery costs
Annual 2.5 – 3.3 0.4 – 0.6 0.5 – 0.7 0.8 – 1.1 0.9 – 1.2
Cumulative 2 – 3 5 – 7 8 – 11 12 – 16 16 – 21
Oil and gas production, processing and petrochemical installations
Annual 29 – 63 21 – 43 26 – 56 27 – 57 29 – 62
Cumulative 29 - 63 122 – 262 239 - 514 267 - 783 506 – 1,082
Oil and gas international trade
Annual 20 - 22 25 - 26 13 - 15 9 - 11 11 – 13
Cumulative 20 - 22 103 - 111 192 - 207 237 - 260 288 – 321
Electricity generation and transmission
Annual 21 - 22 54 - 57 65 - 69 83 - 87 89 – 94
Cumulative 21 - 22 239 - 251 549 - 568 921 - 969 1,352 –1,422
Total
Annual 73 - 111 100 - 127 105 - 140 120 - 156 130 – 170
Cumulative 73 - 111 469 - 631 979 – 1,300 1,537 – 2,029 2,162 – 2,844
Electricity generation and transmission is the energy sub-sector that requires the largest proportion of investment, making up 61 percent of the total required in 2020. Oil and gas production and processing will amount to 30 percent. Investments required for oil and gas international trade are concentrated in the major importing economies and in economies that have large pipeline or LNG projects planned.
The results of our analysis compare well with figures found in previous studies, considering that the estimates here are on the low side as they only include major energy installations. Such is the case with the paper �Financing of Power/Energy Investments in the Asia Pacific Region� prepared by the Asian Development Bank for the 16th WEC Congress, 1995. Their evaluation of the Asia-Pacific region included Afghanistan, India, Pakistan, Nepal, Sri Lanka, Bangladesh, Laos, Cambodia and Mongolia, but did not consider other APEC economies such as the US, Canada, Russia, Australia or New Zealand. In their evaluation of the investment requirements for such a region, an average of US$100-115 billion per year for a 20-year period was attained for the energy sector as a whole.
Projections of global investments required in the next 10 years in the crude oil and natural gas production industry and in oil refining and gas processing are made in �Worldwide Petroleum Industry Outlook, Robert J. Beck, PennWell, 2002�.
In the case of the US and Canada, this study estimates that by 2010, total investment in these areas will require as much as US$105 billion per year. This is high compared with our figures, which indicate that the energy demand for these fuels by 2010 will mean the US and Canada only require spending in the order of US$12.5 billion yearly in the same industries. In the case of what the Worldwide Petroleum Outlook calls the �Far East and Australasia�, the figures are better matched. Their estimates show yearly investments in 2010 for countries in this area of around US$18 billion. Our analysis for the APEC economies in Asia and Oceania, including Japan and China, shows annual investments in these industries of around US$16.5 billion. For what the Worldwide Petroleum Outlook defines as �Latin America�, the annual investments are US$30 billion

APEC ENERG Y DEMAND AN D SUPP LY OUTLOOK CHAPT ER 5
PAGE 106
compared with a figure in our study of between US$3.5-10.6 billion for only Mexico, Chile and Peru. Considering that countries such as Venezuela are not included in our analysis, the results could be said to be similar.
Evaluated against Table 30, the total requirement of US$2.2-2.8 trillion weighs up favourably against the total of US$5.5 trillion available if only one percent of GDP in the economies of the area is directed towards energy infrastructure. However, evaluated on an economy-by-economy basis, it can be seen that a number of developing economies in APEC will need to appropriate funds in excess of one percent of their GDP if their economic growth is not to be hampered by energy infrastructure deficiencies (see Table 32), even more if the cost of all related systems and infrastructure ancillaries is taken into consideration.
Table 32 Energy investment for major infrastructure required in APEC economies in 2020
Economy Investment in 2020 (1999 US$ billion)
Australia 1.7 – 2.5
Brunei Darussalam 0.10 – 0.16
Canada 5.3 – 9.3
Chile 2.0 – 2.5
China 47.7 – 55.4
Hong Kong, China 0.30 – 0.31
Indonesia 6.4 – 8.6
Japan 5.3 – 5.9
Korea 4.5 – 6.1
Malaysia 3.3 – 4.6
Mexico 5.2 – 7.2
New Zealand 0.37 – 0.44
Papua New Guinea 0.09 – 0.11
Peru 2.7 – 8.5
Philippines 1.9 – 2.1
Russia 17.9 – 21.9
Singapore 3.8 – 4.5
Chinese Taipei 4.0 – 4.5
Thailand 3.9 – 5.5
United States 12.1 – 18.6
Viet Nam 1.5 – 1.9
TOTAL APEC 130 - 170
Not only should the effects of a lack of infrastructure on economic growth be considered. Other important issues to address include sustainability and environmental protection. It is to be expected that when funds are insufficient, major parts of them will be directed to areas of high priority in the economy. Expenditures on improving energy efficiency, emissions control and
APEC ENERG Y DEMAND AN D SUPP LY OUTLOOK CHAPT ER 5
PAGE 107
environment protection are not obvious in these circumstances, and steps should be taken to include investment in these areas as an integral part of energy infrastructure development.
FDI AS A SOURCE OF CAPITAL FOR ECONOMIC GROWTH
Foreign direct investment, or FDI, can be a main source of capital for developing countries where capital formation is insufficient and lack of capital flow could hamper any opportunity for economic development. Transnational corporations, as a major source of FDI and a major channel for transferring capital across borders, have an increasing role in stimulating the growth of developing economies. The impact of a transnational corporation on a developing economy is apparent in capital formation, technology, human resources development, trade and even the environment. But it is in capital formation where the influence is more obvious. The effect will be more noteworthy if the capital obtained is directed at industries crucial to growth, as in the case of energy.
Transnational corporations can also be major actors in the development of technology and human resources. Because their involvement happens in environmentally significant activities, their participation can be a factor in the environment of a host country.
The growth of FDI in the past two decades or so has been accompanied by changes in its geographical pattern, indicating shifts in the investment climate in host countries and in the economic factors driving the location of international production. New locations are becoming attractive relative to old ones. Also, the activities relocated to other host countries by direct investment are changing in nature. As determinants of location are changing, countries can change their ability to receive FDI and to alter its contributions.
For policy-makers it is of primary importance to know and understand the trends of how FDI compares in its location patterns with other means of transferring productive assets, where it comes from, where it goes, which activities it affects and which functions it transfers. More importantly, it is essential to understand why and how the patterns of FDI are evolving. With this understanding, FDI policies can be formulated efficiently and realistically.52
HARMONISING INVESTORS’ PREFERENCE AND HOST ECONOMIES’ NEEDS
In principle, the objectives of transnational corporations differ from those of host governments: governments seek to spur national development, while transnational corporations seek to enhance their own competitiveness in an international context. It is in the best interests of both parties to work together to establish appropriate conditions on common ground.
Understanding the factors that affect foreign investment decision-making provides a useful framework for understanding the flow of energy investment. Therefore, first a definition of FDI is provided. Second, a theoretical framework for determining FDI factors is demonstrated.
DEFINITION OF FDI
According to the OECD, foreign direct investment (FDI) is defined as international investment made in order to obtain a lasting interest by a resident entity in one economy (�direct investor�) in an entity resident in an economy other than that of the investor (�direct investment enterprise�) [OECD, 1999; IMF, 1993]. Lasting interest means there will be a long-term relationship between the investor and the enterprise of the host parties. Also, a significant influence on management would be envisaged, and the foreign investor will probably hold more than 10 percent of the shares.
In general, ownership of 10 percent of shares or voting stock is a criterion for whether an investment is categorised as direct investment or not. The flow of FDI is seriously affected by the
52 �World Investment Report�, 1992, 1999, 2000, 2001. United Nations Conference on Trade and Development.
APEC ENERG Y DEMAND AN D SUPP LY OUTLOOK CHAPT ER 5
PAGE 108
ability to earn profits on activities in a foreign country. On this account, there is a significant difference between FDI and foreign portfolio investment (FPI), which does not involve active management.
FDI can take various forms: the purchase of existing assets in a foreign country; new investment in property, plant & equipment in a foreign country; participation in a joint venture with a local partner in a foreign country, and cross-border mergers and acquisitions (M&A).53
UNDERSTANDING FDI FROM INVESTORS’ PERSPECTIVE
Various economic theories have provided an analytical framework for FDI. The most recent theory, provided by Narula and Dunning54, is best characterised as an �OLI� framework. This theory identifies three advantages in doing business abroad from investors� perspective: Ownership advantages, Location advantages, and Internalisation advantages.
Ownership advantage: 55 Doing business abroad results in additional costs because of cultural and language differences, or lack of knowledge of the local market. However, a foreign direct investor has certain advantages with respect to their own production process or their own unique product. Also, firm specific know-how, information and brand names owned by a foreign direct investor can be good reasons for doing business abroad. These advantages offset the disadvantages by generating higher revenues or lowering costs when investors utilise relatively lower factor input costs such as cheap labour and capital investment.
Location advantage: Location advantages can be factors such as resource endowment, level of economic development, social structure and political stability of the host country. Also, foreign direct investors take into account these location advantages, including the market size and potential future market development in the host country when making investment decisions.
Basically, there are two types of foreign direct investment that utilise location advantage: local market-oriented FDI and export-oriented FDI. For the first, the level of economic development, market size, and future prospects for economic development are important determining factors for foreign investment. Export-oriented investors set up enterprises in particular places to utilise resources endowment and labour at lower costs and expect to be very competitive in exports.
Internalisation advantage: Internalisation provides the advantage of reducing supply costs with respect to import licensing and tariff barriers.
These three OLI factors can be further classified into supply-side and demand-side factors. The ownership and internalisation advantages are supply-side factors. The location advantage is a demand-side factor.
Narula and Dunning�s OLI framework covers various essential elements underlining FDI. It is useful for analysing recent decision-making FDI patterns.
FDI AND ECONOMIC GROWTH IN THE APEC REGION
As seen in Figure 46, regardless of income level of each economy, capital inflow in the form of FDI is highly correlated with its economic performance. For example, economies belonging to Group B have the same pattern of cyclical movement, in which peaks and troughs in FDI closely match those in GDP.
53 Joint venture can take the form of (1) contractual joint venture, (2) equity joint venture and (3) wholly foreign owned
joint venture. In the case of cross border M&A, the ownership of more than 10 percent of shares falls under the FDI category, while the ownership of less than 10 percent of share falls under FPI.
54 Narula, R. and Dunning, J.H. (1998). �Globalisation and New Realities for Multinational Enterprise � Developing Host Country Interaction�.
55 Ownership advantage is called �Firm Specific Advantage� also.
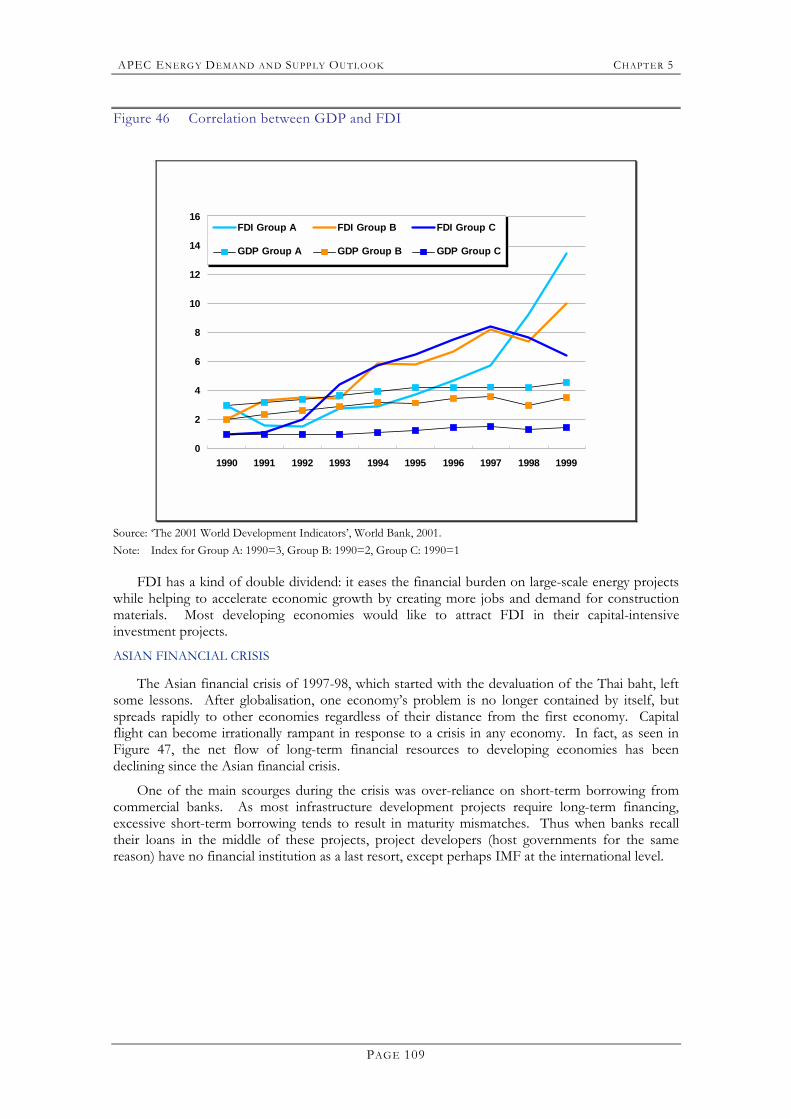
APEC ENERG Y DEMAND AN D SUPP LY OUTLOOK CHAPT ER 5
PAGE 109
Figure 46 Correlation between GDP and FDI
0
2
4
6
8
10
12
14
16
1990 1991 1992 1993 1994 1995 1996 1997 1998 1999
FDI Group A FDI Group B FDI Group C
GDP Group A GDP Group B GDP Group C
Source: �The 2001 World Development Indicators�, World Bank, 2001. Note: Index for Group A: 1990=3, Group B: 1990=2, Group C: 1990=1
FDI has a kind of double dividend: it eases the financial burden on large-scale energy projects while helping to accelerate economic growth by creating more jobs and demand for construction materials. Most developing economies would like to attract FDI in their capital-intensive investment projects.
ASIAN FINANCIAL CRISIS
The Asian financial crisis of 1997-98, which started with the devaluation of the Thai baht, left some lessons. After globalisation, one economy�s problem is no longer contained by itself, but spreads rapidly to other economies regardless of their distance from the first economy. Capital flight can become irrationally rampant in response to a crisis in any economy. In fact, as seen in Figure 47, the net flow of long-term financial resources to developing economies has been declining since the Asian financial crisis.
One of the main scourges during the crisis was over-reliance on short-term borrowing from commercial banks. As most infrastructure development projects require long-term financing, excessive short-term borrowing tends to result in maturity mismatches. Thus when banks recall their loans in the middle of these projects, project developers (host governments for the same reason) have no financial institution as a last resort, except perhaps IMF at the international level.
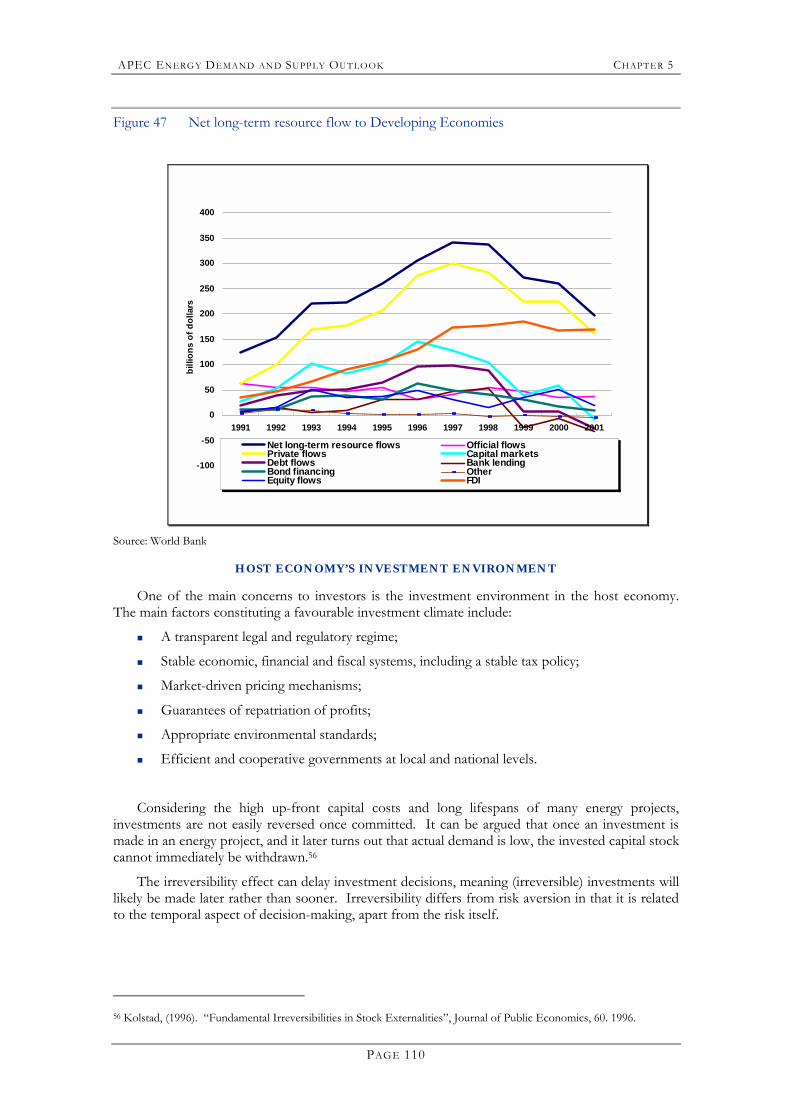
APEC ENERG Y DEMAND AN D SUPP LY OUTLOOK CHAPT ER 5
PAGE 110
Figure 47 Net long-term resource flow to Developing Economies
-100
-50
0
50
100
150
200
250
300
350
400
1991 1992 1993 1994 1995 1996 1997 1998 1999 2000 2001
billi
ons
of d
olla
rs
Net long-term resource flows Official flowsPrivate flows Capital marketsDebt flows Bank lendingBond financing OtherEquity flows FDI
Source: World Bank
HOST ECONOMY’S INVESTMENT ENVIRONMENT
One of the main concerns to investors is the investment environment in the host economy. The main factors constituting a favourable investment climate include:
! A transparent legal and regulatory regime;
! Stable economic, financial and fiscal systems, including a stable tax policy;
! Market-driven pricing mechanisms;
! Guarantees of repatriation of profits;
! Appropriate environmental standards;
! Efficient and cooperative governments at local and national levels.
Considering the high up-front capital costs and long lifespans of many energy projects, investments are not easily reversed once committed. It can be argued that once an investment is made in an energy project, and it later turns out that actual demand is low, the invested capital stock cannot immediately be withdrawn.56
The irreversibility effect can delay investment decisions, meaning (irreversible) investments will likely be made later rather than sooner. Irreversibility differs from risk aversion in that it is related to the temporal aspect of decision-making, apart from the risk itself.
56 Kolstad, (1996). �Fundamental Irreversibilities in Stock Externalities�, Journal of Public Economics, 60. 1996.
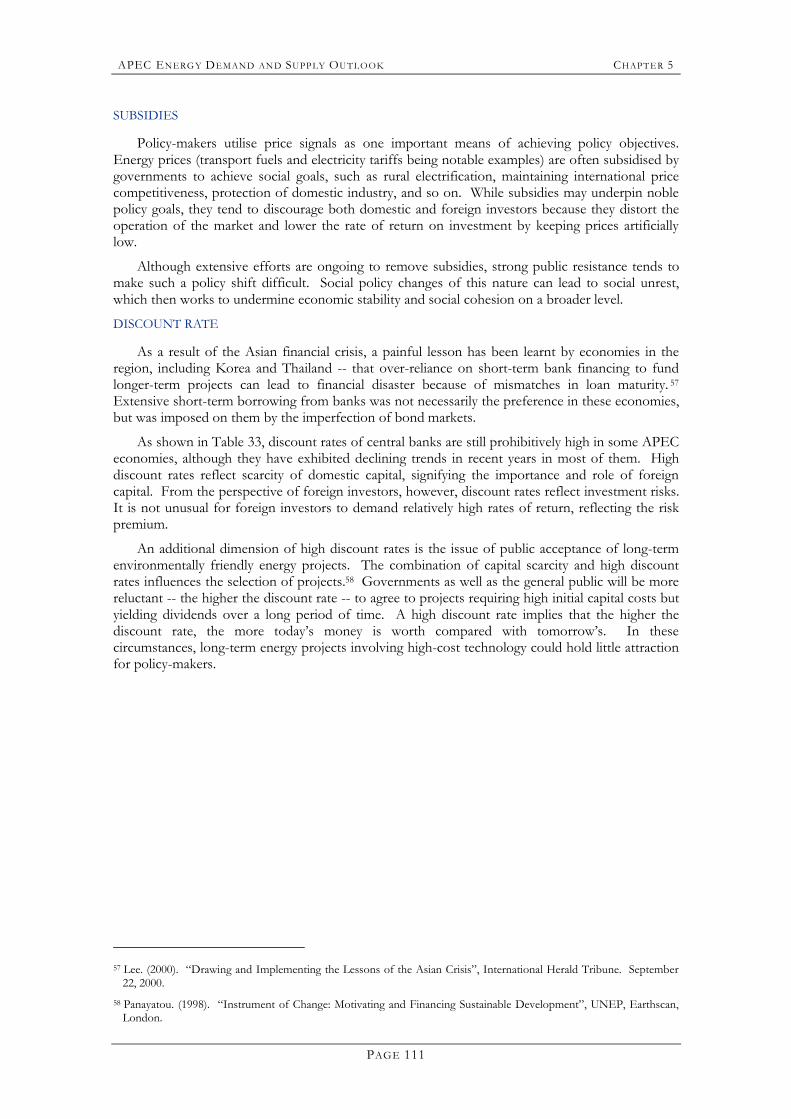
APEC ENERG Y DEMAND AN D SUPP LY OUTLOOK CHAPT ER 5
PAGE 111
SUBSIDIES
Policy-makers utilise price signals as one important means of achieving policy objectives. Energy prices (transport fuels and electricity tariffs being notable examples) are often subsidised by governments to achieve social goals, such as rural electrification, maintaining international price competitiveness, protection of domestic industry, and so on. While subsidies may underpin noble policy goals, they tend to discourage both domestic and foreign investors because they distort the operation of the market and lower the rate of return on investment by keeping prices artificially low.
Although extensive efforts are ongoing to remove subsidies, strong public resistance tends to make such a policy shift difficult. Social policy changes of this nature can lead to social unrest, which then works to undermine economic stability and social cohesion on a broader level.
DISCOUNT RATE
As a result of the Asian financial crisis, a painful lesson has been learnt by economies in the region, including Korea and Thailand -- that over-reliance on short-term bank financing to fund longer-term projects can lead to financial disaster because of mismatches in loan maturity. 57 Extensive short-term borrowing from banks was not necessarily the preference in these economies, but was imposed on them by the imperfection of bond markets.
As shown in Table 33, discount rates of central banks are still prohibitively high in some APEC economies, although they have exhibited declining trends in recent years in most of them. High discount rates reflect scarcity of domestic capital, signifying the importance and role of foreign capital. From the perspective of foreign investors, however, discount rates reflect investment risks. It is not unusual for foreign investors to demand relatively high rates of return, reflecting the risk premium.
An additional dimension of high discount rates is the issue of public acceptance of long-term environmentally friendly energy projects. The combination of capital scarcity and high discount rates influences the selection of projects.58 Governments as well as the general public will be more reluctant -- the higher the discount rate -- to agree to projects requiring high initial capital costs but yielding dividends over a long period of time. A high discount rate implies that the higher the discount rate, the more today�s money is worth compared with tomorrow�s. In these circumstances, long-term energy projects involving high-cost technology could hold little attraction for policy-makers.
57 Lee. (2000). �Drawing and Implementing the Lessons of the Asian Crisis�, International Herald Tribune. September
22, 2000. 58 Panayatou. (1998). �Instrument of Change: Motivating and Financing Sustainable Development�, UNEP, Earthscan,
London.
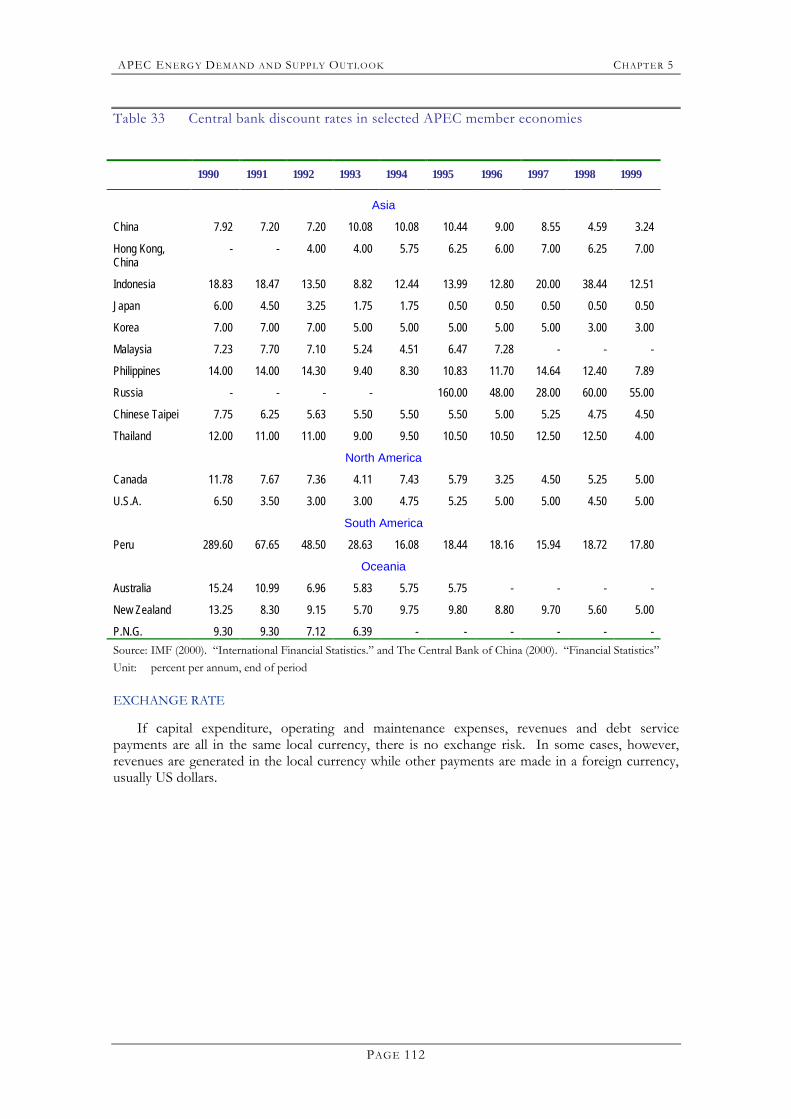
APEC ENERG Y DEMAND AN D SUPP LY OUTLOOK CHAPT ER 5
PAGE 112
Table 33 Central bank discount rates in selected APEC member economies
1990 1991 1992 1993 1994 1995 1996 1997 1998 1999
Asia
China 7.92 7.20 7.20 10.08 10.08 10.44 9.00 8.55 4.59 3.24
Hong Kong, China
- - 4.00 4.00 5.75 6.25 6.00 7.00 6.25 7.00
Indonesia 18.83 18.47 13.50 8.82 12.44 13.99 12.80 20.00 38.44 12.51
Japan 6.00 4.50 3.25 1.75 1.75 0.50 0.50 0.50 0.50 0.50
Korea 7.00 7.00 7.00 5.00 5.00 5.00 5.00 5.00 3.00 3.00
Malaysia 7.23 7.70 7.10 5.24 4.51 6.47 7.28 - - -
Philippines 14.00 14.00 14.30 9.40 8.30 10.83 11.70 14.64 12.40 7.89
Russia - - - - 160.00 48.00 28.00 60.00 55.00
Chinese Taipei 7.75 6.25 5.63 5.50 5.50 5.50 5.00 5.25 4.75 4.50
Thailand 12.00 11.00 11.00 9.00 9.50 10.50 10.50 12.50 12.50 4.00
North America
Canada 11.78 7.67 7.36 4.11 7.43 5.79 3.25 4.50 5.25 5.00
U.S.A. 6.50 3.50 3.00 3.00 4.75 5.25 5.00 5.00 4.50 5.00
South America
Peru 289.60 67.65 48.50 28.63 16.08 18.44 18.16 15.94 18.72 17.80
Oceania
Australia 15.24 10.99 6.96 5.83 5.75 5.75 - - - -
New Zealand 13.25 8.30 9.15 5.70 9.75 9.80 8.80 9.70 5.60 5.00
P.N.G. 9.30 9.30 7.12 6.39 - - - - - - Source: IMF (2000). �International Financial Statistics.� and The Central Bank of China (2000). �Financial Statistics� Unit: percent per annum, end of period EXCHANGE RATE
If capital expenditure, operating and maintenance expenses, revenues and debt service payments are all in the same local currency, there is no exchange risk. In some cases, however, revenues are generated in the local currency while other payments are made in a foreign currency, usually US dollars.
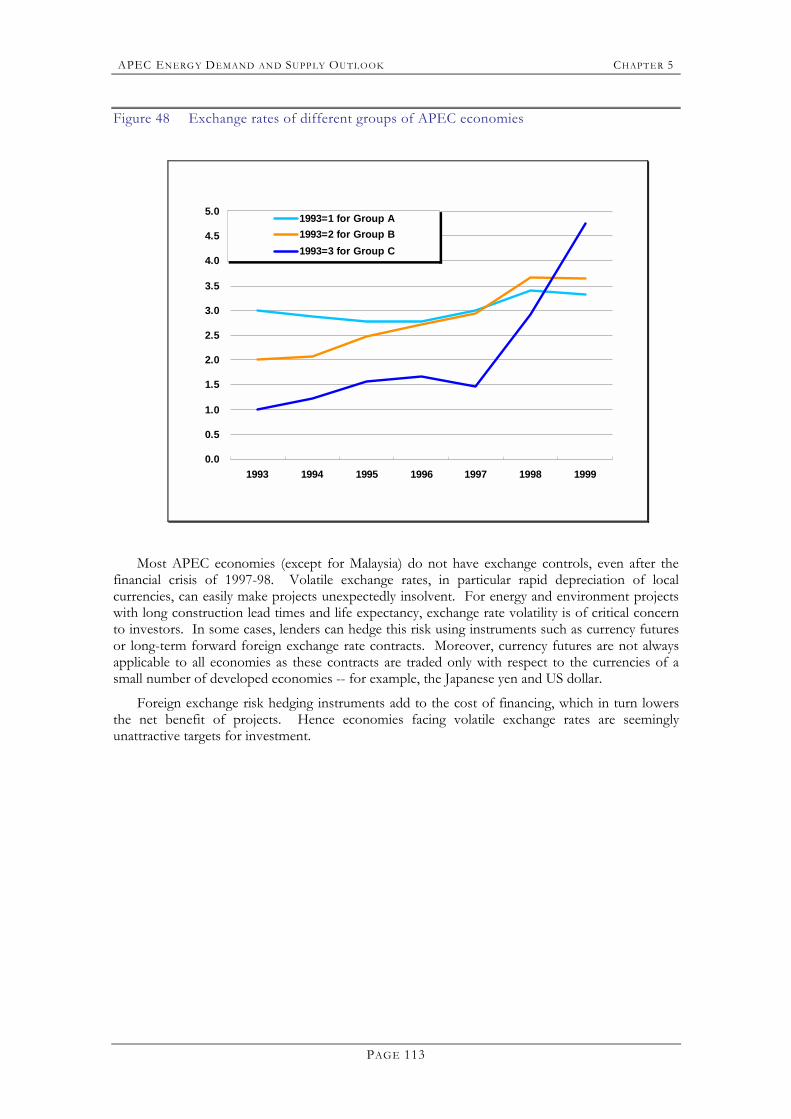
APEC ENERG Y DEMAND AN D SUPP LY OUTLOOK CHAPT ER 5
PAGE 113
Figure 48 Exchange rates of different groups of APEC economies
0.0
0.5
1.0
1.5
2.0
2.5
3.0
3.5
4.0
4.5
5.0
1993 1994 1995 1996 1997 1998 1999
1993=1 for Group A1993=2 for Group B1993=3 for Group C
Most APEC economies (except for Malaysia) do not have exchange controls, even after the financial crisis of 1997-98. Volatile exchange rates, in particular rapid depreciation of local currencies, can easily make projects unexpectedly insolvent. For energy and environment projects with long construction lead times and life expectancy, exchange rate volatility is of critical concern to investors. In some cases, lenders can hedge this risk using instruments such as currency futures or long-term forward foreign exchange rate contracts. Moreover, currency futures are not always applicable to all economies as these contracts are traded only with respect to the currencies of a small number of developed economies -- for example, the Japanese yen and US dollar.
Foreign exchange risk hedging instruments add to the cost of financing, which in turn lowers the net benefit of projects. Hence economies facing volatile exchange rates are seemingly unattractive targets for investment.

APEC EN ERGY DEMAND AN D SUPP LY OUTLOOK CHAPT ER 6
PAGE 115
C H A P T E R 6 CONCLUSIONS
The 20th century was marked by a series of the most significant transformations in society since the Industrial Revolution. Mass production and consumption, technological innovations in transport and electricity use, and globalisation and trade competition have changed our way of life. The transformation has been beyond anything witnessed before in human history. As a result, our living standards have improved substantially, industrial productivity has gone up sharply, and geographical distance is no longer a major barrier to the free flow of labour and capital.
Energy is a major element of capital input, enabling and shaping these transformations. Energy consumption is not the only influence driving such transformations. Having energy resources available and accessible has often controlled the speed of such changes, and whether energy was affordable and acceptable has tended to modify their direction.
Our forecast shows that APEC energy demand will grow robustly for the next 20 years. Energy consumption exhibited a rising trend in the region for most of the second half of the 20th century, and there is no sign of a change in that trend. Population and income growth have been major driving forces for this rapid growth. While population growth is slowing, incomes are projected to grow at a rapid pace. Energy consumption will be sustained at an annual average growth rate of 2.1 percent, mainly due to income growth.
Demand for electricity and transport fuel will grow disproportionately compared with other final forms of energy. Urbanisation, development and diffusion of information technology, demographic change (in particular ageing59) and high-consumption lifestyles will lead to relatively higher growth in transport fuel consumption and electricity use. Technology improvements in these two areas will hold the key to reducing the supply burden in the coming decades.
The primary energy supply mix will not change much over the projection period: still dominant oil and coal, rising natural gas, and fast-growing but still marginal new and renewables. Although environmental concerns will help natural gas to gain acceptance over coal and oil, its share will not grow much over the next 20 years. Different from other types of energy, both LNG and pipeline natural gas require large-scale capital investment for infrastructure development and rigid long-term contracts, which are stumbling blocks to the faster penetration of natural gas. New and renewables, despite environmental benefits, will remain marginal to supporting the projected demand. Relatively high technology costs will inevitably keep these types of energy at low priority in an increasingly competitive market environment following regulatory reform and privatisation.
With growing demand for energy, each economy will address, to a greater or lesser degree depending on its stage of economic development, issues of resource availability60, infrastructure investment and market. For developing economies, investment in energy infrastructure development requires particular attention because of its sheer size, low capital formation and socio-economic barriers.
For APEC as a whole, the total investment needed for oil refining, natural gas transport and processing, and power plants is estimated at US$2.2-2.8 trillion. In view of past investment trends, it is likely that APEC economies will face more challenges in future to secure investment needed because of greater uncertainty in energy markets following slow but steady regulatory reform.
Foreign direct investment, along with ODA, has been instrumental in promoting investment in developing economies. In fact, FDI has contributed quite substantially to the economic growth of most economies, especially developing ones. In attracting FDI, the investment environment of the 59 Ageing matters in a number of ways: An increase in the number of households as a result of an increase in single-
occupancy households increases the use of electricity. 60 It seems sufficient energy resources are available at least until 2020, as stated in the IEA�s 2001 World Energy Outlook.
APEC EN ERGY DEMAND AN D SUPP LY OUTLOOK CHAPT ER 6
PAGE 116
host economy is critical in terms of taxes, tariffs, and laws and regulations. Institutional barriers are also of concern to investors, for example Russia�s production sharing agreements. More often than not, a combination of these factors determines the size and speed of such investment flows. Concerted efforts by both investors and host economies certainly create a more favourable environment under which there can be smooth and steady capital flows to help resolve hurdles in attracting adequate FDI.
Faced with growing dependence on imported energy, some APEC economies have taken up energy security as a major agenda item in their energy policy. At the same time, the events of September 11th rekindled interest in energy supply security amid increased global political instability. Security of energy transport, in particular, is likely to emerge as a major concern for those relying heavily on energy imports from long distances. Increased volumes of energy imports in the future will add to existing security concerns. In this regard, preparing regional policies and measures to cope with supply disruptions deserve much attention.
Regulatory reform, even at the current slow pace, will have long-term impacts on energy supply. Introduction of competition and privatisation will enhance efficiency in the energy industry as a whole, and the private sector will play a gradually more important role in terms of planning, investment and technology development. However, the transition from a regulated market to a competitive one is not always as smooth as might be set out in a textbook. Challenges abound, and there is no one-size-fits-all remedy. The bottom line, in light of projected energy demand, is that regulatory reform, unless well-planned and executed, may well lead to more problems than it solves. Environmental problems can be exacerbated if there is no control over coal consumption, in particular in the power sector, and the safety and reliability of energy supply can be easily compromised and even jeopardised, as seen in the California energy crisis.
Our forecasts indicate that GHG emissions from fossil fuel combustion, including CO2, methane and nitrous oxide,61 will rise from 13,883 Mt CO2 in 1999 to 22,198 Mt CO2 in 2020. In the global context, the projected level of emissions will exceed the target level specified in the Kyoto Protocol, and the concentration of CO2 in the atmosphere will be substantially higher than targeted in the Climate Change Convention and Kyoto Protocol. But while the Kyoto Protocol may appear to have been derailed, it is likely to help shape the energy mix in the future, depending on the outcome of ratification and when the protocol enters into force. While it remains to be seen how far the current energy mix can change, a gradual shift from carbon-intensive energy forms to those which are less carbon-intensive will continue. Local environmental concerns will surely give a boost to this shift, as air quality in some densely populated cities in APEC has already fallen far below the pollution standards recommended by the World Health Organisation. For the time being, until the outcome of the Kyoto Protocol is finalised, improvement of local air quality will work as a main impetus to mitigating greenhouse gases.
During the 1980s and 1990s, the economic dynamism of the APEC region was fuelled by rapid growth in energy consumption. We are of the view that this trend will continue for the next two decades, and the APEC region will become a centre of new opportunities for energy investment. Even though securing energy supply to meet projected demand in a sustainable manner will pose numerous challenges to all APEC economies, they may well be converted into opportunities if managed well, depending on how we respond. History provides ample evidences of this, such as the construction of the American railroad in the late 19th century and of natural gas pipeline networks in Europe in the 1960s and 1970s, which not only achieved their intended goals but also spread economically beneficial ripple effects to other industries. A combination of clear vision and careful planning and management resulted in benefits exceeding what most had anticipated.
Energy cooperation among APEC members has significant potential for bringing shared prosperity. Taking advantage of the diverse energy profiles of APEC members based on economies of scale, they can advance the frontiers of cooperation in areas such as transboundary power interconnections, natural gas pipeline networks, joint use of existing supply infrastructure, transfer of technology and know-how, and joint exploration and development of energy resources. 61 Methane and nitrous oxide are expressed as CO2 equivalent.

APEC EN ERGY DEMAND AN D SUPP LY OUTLOOK CHAPT ER 6
PAGE 117
The future depends on the choices we make today, and responsibility will follow. With strong resolve and close cooperation among APEC economies, sustainable energy for the future will be achieved.

APEC EN ERGY DEMAND AN D SUPP LY OUTLOOK REFERENCES
PAGE 119
R E F E R E N C E S
ABARE. (2002). “Global Coal Markets: Prospects to 2010”, ABARE Research Report 02.2., Australian Bureau of Agricultural and Resource Economics. 2002.
Adamchak, F. R. (2001). “LNG – the State of the Market and a View toward the Future”, presented at Nor-Shipping 2001, 18th International Shipping and Maritime Exhibition and Conference, Oslo. May 31, 2001.
ADB. (2000). “Energy 2000: Review of the Energy Sector Policy of the Asian Development Bank”, Asian Development Bank, Manila, Philippines. 2000.
APEC Energy Ministers. (1998). Recommendations Concerning Accelerating Investment in Natural Gas Supplies, Infrastructure and Trading Networks in the APEC Region, Third APEC Energy Ministerial Meeting, Okinawa, Japan. October 1998.
APERC. (2002a). “Alternative Development Scenarios for Electricity and Transport to 2020 for the APEC Region”, Tokyo. 2002.
APERC. (2002b). “Gas Storage in the APEC Region: Development of Commercial Structure”, Tokyo. 2002.
APERC. (2002c). APERC database on infrastructure investment.
Bank of China. (2000). “Financial Statistics”, The Central Bank of China. 2000.
Beck, R.J. (2001). “Worldwide Petroleum Industry Outlook, Eighteenth Edition, 2002-2006 Projection to 2011”, PennWell, Tulsa, Oklahoma. September 2001.
BP. (2001). “BP Statistical Review of World Energy 2001”, BP p.l.c., London. June 2001.
BP. (2002). “BP Statistical Review of World Energy 2002”, BP p.l.c., London. June 2002.
CEDIGAZ. (2001). “Natural Gas in the World: 2001 Survey”, CEDIGAZ, Paris.
China Daily. Online version of China�s English-language newspaper: www.chinadaily.com.cn.
DRI-WEFA. (2001). APEC Economies� macro economic forecasts 1999-2020, DRI-WEFA. December 2001.
EIA. (2002). “International Energy Outlook 2002”, U.S. Department of Energy, Energy Information Administration, Washington. March 2002.
IADB. (2002). “Annual Report 2001”, Inter-American Development Bank, Washington. 2002.
IEA. (2000). “World Energy Outlook 2000”, OECD/IEA, Paris.
IEA. (2001a). “World Energy Outlook 2001”, OECD/IEA, Paris.
IEA. (2001b). Energy Balances of OECD Countries (2001 edition). OECD/IEA, Paris.
IEA. (2001c). Energy Balances of Non-OECD Countries (2001 edition). OECD/IEA, Paris.
IEA. (2001d). Energy Statistics of OECD Countries (2001 edition). OECD/IEA, Paris.
IEA. (2001e). Energy Statistics of Non-OECD Countries (2001 edition). OECD/IEA, Paris.
IEEJ. (2002a). APEC Energy Database, EDMC, Institute of Energy Economics, Japan.
IEEJ. (2002b). The Energy Data and Modelling Center Databank, EDMC, Institute of Energy Economics, Japan.
IIASA/WEC. (1998). “Global Energy Perspectives”, International Institute for Applied Systems Analysis (IIASA)/World Energy Council (WEC), Cambridge University Press. 1998.
IMF. (1993). “Balance of Payments Manual”. Fifth edition. International Monetary Fund, Washington. 1993.
APEC EN ERGY DEMAND AN D SUPP LY OUTLOOK REFERENCES
PAGE 120
IMF. (2000). “International Financial Statistics Yearbook, 2000”, International Monetary Fund, Washington. 2000.
Koide, Y. (2000). “The Status of Natural Gas and LNG Demand and Supply in the Asia-Pacific”, Institute of Energy Economics Japan, Energy Economics, Tokyo. 2000.
Kolstad, C.D. (1996). “Fundamental Irreversibilities in Stock Externalities”, Journal of Public Economics, 60. 1996.
Lague, D. (2002). “China: The Quest for Energy to Grow”, Far Eastern Economic Review, Dow Jones & Company. June 20, 2002.
Lee, Hsien Loong. (2000). “Drawing and Implementing the Lessons of the Asian Crisis”, International Herald Tribune. September 22, 2000.
Manning, R. (2000). “The Asian Energy Factor: Myths and Dilemmas of Energy, Security and the Pacific Future”, Palgrave. September 2000.
Narula, R. and Dunning, J.H. (1998). “Globalisation and New Realities for Multinational Enterprise – Developing Host Country Interaction”, University of Oslo. September 14, 1998.
OECD. (1999). “Benchmark Definition of Foreign Direct Investment”. Third edition. OECD. Paris. 1999.
Panayatou, T. (1998). “Instrument of Change: Motivating and Financing Sustainable Development”, UNEP, Earthscan, London.
Poten & Partners. (2001). “The Commercialisation of LNG Markets”, Fundamentals of the Global LNG Industry 2001, Petroleum Economist. Poten & Partners, Inc., New York. May 10, 2001.
SIEMENS. (2002). “Combined Cycle Plant Ratings” webpage: http://www.pg.siemens.com/en/plantrating/index.cfm?session=1147755x18398968. Siemens AG 2002.
UNCTAD. (1992). “World Investment Report 1992: Transnational Corporations as Engines of Growth”, United Nations Conference on Trade and Development, United Nations, New York and Geneva. 1992.
UNCTAD. (1999). “World Investment Report 1999: Foreign Direct Investment and the Challenge of Development”, United Nations Conference on Trade and Development. United Nations, New York and Geneva. 1999.
UNCTAD. (2000). “World Investment Report 2000: Cross-border Mergers and Acquisitions and Development”, United Nations Conference on Trade and Development. United Nations, New York and Geneva. 2000.
UNCTAD. (2001). “World Investment Report 2001: Promoting Linkages”, United Nations Conference on Trade and Development. United Nations, New York and Geneva. 2001.
UNFCCC. (1997). Kyoto Protocol to the Convention of Climate Change, the Climate Change Secretariat, United Nations Framework Convention on Climate Change. 1997.
U.S. DOE. (1999). “Vision 21 Power Plant of the Future”, Office of Fossil Energy website: http://www.fe.doe.gov/coal_power/vision21/index.shtml, U.S. Department of Energy, Washington. April 1999.
U.S. DOE. (2000). “Scenarios for a Clean Energy Future”, Inter-laboratory Working Group on Energy-efficient and Clean-energy Technologies, prepared for the Office of Energy Efficiency and Renewable Energy, U.S. Department of Energy, Washington.
U.S. Geological Survey (2000). “World Petroleum Assessment 2000”, U.S. Geological Survey, Washington.
WEC. (1998). “Survey of Energy Resources”, World Energy Council, London. 1998.
World Bank. (2001). “The 2001 World Development Indicators”, International Bank for Reconstruction and Development/The World Bank, Washington. 2001.

APEC EN ERGY DEMAND AN D SUPP LY OUTLOOK REFERENCES
PAGE 121
Zhou, F. (2002). “Policies and Measures on Environmental Protection in China”, Energy Research Institute of SPDC, China, presented at the APERC Annual Conference 2002. January 31, 2002.

APEC EN ERGY DEMAND AN D SUPP LY OUTLOOK REFERENCES
PAGE 122
APEC EN ERGY DEMAND AN D SUPP LY OUTLOOK APPENDI X
PAGE 123
A P P E N D I X
ECONOMY REVIEWS
APEC EN ERGY DEMAND AN D SUPP LY OUTLOOK APPENDI X
PAGE 124
CONTENTS
Australia .............................................................................................................. 129
Brunei Darussalam .............................................................................................................. 133
Canada .............................................................................................................. 137
Chile .............................................................................................................. 143
China .............................................................................................................. 149
Hong Kong, China .............................................................................................................. 157
Indonesia .............................................................................................................. 161
Japan .............................................................................................................. 165
Korea .............................................................................................................. 171
Malaysia .............................................................................................................. 179
Mexico .............................................................................................................. 183
New Zealand .............................................................................................................. 189
Papua New Guinea .............................................................................................................. 195
Peru .............................................................................................................. 199
The Philippines .............................................................................................................. 205
Russia .............................................................................................................. 211
Singapore .............................................................................................................. 217
Chinese Taipei .............................................................................................................. 223
Thailand .............................................................................................................. 227
United States .............................................................................................................. 233
Viet Nam .............................................................................................................. 237
APEC EN ERGY DEMAND AN D SUPP LY OUTLOOK APPENDI X
PAGE 125
LIST OF TABLES
Table 34 Australia: Various Indicators............................................................................... 129
Table 35 Australia: Primary Energy Supply....................................................................... 130
Table 36 Australia: Final Energy Consumption ............................................................... 131
Table 37 Brunei Darussalam: Various Indicators............................................................. 133
Table 38 Brunei Darussalam: Final Energy Consumption ............................................. 134
Table 39 Brunei Darussalam: Primary Energy Supply .................................................... 135
Table 40 Canada: Various Indicators ................................................................................. 137
Table 41 Canada: Final Energy Consumption.................................................................. 138
Table 42 Canada: Primary Energy Supply ......................................................................... 140
Table 43 Chile: Various Indicators ..................................................................................... 143
Table 44 Chile: Final Energy Consumption...................................................................... 145
Table 45 Chile: Primary Energy Supply ............................................................................. 146
Table 46 China: Various Indicators .................................................................................... 149
Table 47 China: Final Energy Consumption..................................................................... 152
Table 48 China: Primary Energy Supply............................................................................ 154
Table 49 Hong Kong, China: Various Indicators ............................................................ 157
Table 50 Hong Kong, China: Final Energy Consumption............................................. 158
Table 51 Hong Kong, China: Primary Energy Supply .................................................... 158
Table 52 Indonesia: Various Indicators ............................................................................. 161
Table 53 Indonesia: Final Energy Consumption.............................................................. 162
Table 54 Indonesia: Primary Energy Supply..................................................................... 163
Table 55 Japan: Various Indicators..................................................................................... 165
Table 56 Japan: Final Energy Consumption ..................................................................... 166
Table 57 Japan: Primary Energy Supply ............................................................................ 167
Table 58 Korea: Various Indicators ................................................................................... 171
Table 59 Korea: Final Energy Consumption.................................................................... 173
Table 60 Korea: Primary Energy Supply ........................................................................... 174
Table 61 Malaysia: Various Indicators ............................................................................... 179
Table 62 Malaysia: Final Energy Consumption................................................................ 180
Table 63 Malaysia: Primary Energy Supply ....................................................................... 181
Table 64 Mexico: Various Indicators ................................................................................. 183
Table 65 Mexico: Final Energy Consumption.................................................................. 185
Table 66 Mexico: Primary Energy Supply ......................................................................... 185
APEC EN ERGY DEMAND AN D SUPP LY OUTLOOK APPENDI X
PAGE 126
Table 67 New Zealand: Various Indicators....................................................................... 189
Table 68 New Zealand: Final Energy Consumption....................................................... 190
Table 69 New Zealand: Primary Energy Supply .............................................................. 191
Table 70 Papua New Guinea: Various Indicators............................................................ 196
Table 71 Papua New Guinea: Final Energy Consumption ............................................ 197
Table 72 Papua New Guinea: Primary Energy Supply.................................................... 197
Table 73 Peru: Various Indicators ...................................................................................... 199
Table 74 Peru: Final Energy Consumption....................................................................... 200
Table 75 Peru: Primary Energy Supply .............................................................................. 201
Table 76 The Philippines: Various Indicators................................................................... 205
Table 77 The Philippines: Final Energy Consumption ................................................... 206
Table 78 The Philippines: Primary Energy Supply .......................................................... 207
Table 79 Russia: Various Indicators ................................................................................... 212
Table 80 Russia: Final Energy Consumption.................................................................... 213
Table 81 Russia: Primary Energy Supply........................................................................... 214
Table 82 Singapore: Various Indicators............................................................................. 217
Table 83 Singapore: Final Energy Consumption ............................................................. 218
Table 84 Singapore: Primary Energy Supply..................................................................... 219
Table 85 Chinese Taipei: Various Indicators .................................................................... 223
Table 86 Chinese Taipei: Final Energy Consumption..................................................... 224
Table 87 Chinese Taipei: Primary Energy Supply............................................................ 224
Table 88 Thailand: Various Indicators............................................................................... 227
Table 89 Thailand: Final Energy Consumption ............................................................... 228
Table 90 Thailand: Primary Energy Supply....................................................................... 229
Table 91 United States: Various Indicators....................................................................... 233
Table 92 United States: Final Energy Consumption ....................................................... 234
Table 93 United States: Primary Energy Supply............................................................... 235
Table 94 Viet Nam: Various Indicators ............................................................................. 237
Table 95 Viet Nam: Final Energy Consumption.............................................................. 238
Table 96 Viet Nam: Primary Energy Supply..................................................................... 239
APEC EN ERGY DEMAND AN D SUPP LY OUTLOOK APPENDI X
PAGE 127
LIST OF FIGURES
Figure 49 Australia: Primary Energy Supply Fuel Mix, 1999 and 2020 ......................... 130
Figure 50 Brunei Darussalam: Primary Energy Supply Fuel Mix, 1999 and 2020 ....... 136
Figure 51 Canada: Primary Energy Supply Fuel Mix, 1999 and 2020............................ 140
Figure 52 Chile: Primary Energy Supply Fuel Mix, 1999 and 2020................................ 147
Figure 53: China: Primary Energy Supply Fuel Mix, 1999 and 2020............................... 154
Figure 54 Hong Kong, China: Primary Energy Supply Fuel Mix, 1999 and 2020....... 159
Figure 55 Indonesia: Primary Energy Supply Fuel Mix, 1999 and 2020........................ 164
Figure 56 Japan: Primary Energy Supply Fuel Mix, 1999 and 2020 ............................... 168
Figure 57 Korea: Primary Energy Supply Fuel Mix, 1999 and 2020 .............................. 174
Figure 58 Malaysia: Primary Energy Supply Fuel Mix, 1999 and 2020 .......................... 181
Figure 59 Mexico: Primary Energy Supply Fuel Mix, 1999 and 2020............................ 186
Figure 60 New Zealand: Primary Energy Supply Fuel Mix, 1999 and 2020 ................. 191
Figure 61 Papua New Guinea: Primary Energy Supply Fuel Mix, 1999 and 2020 ...... 198
Figure 62 Peru: Primary Energy Supply Fuel Mix, 1999 and 2020................................. 202
Figure 63 The Philippines: Primary Energy Supply Fuel Mix, 1999 and 2020 ............. 208
Figure 64 Russia: Primary Energy Supply Fuel Mix, 1999 and 2020.............................. 214
Figure 65 Singapore: Primary Energy Supply Fuel Mix, 1999 and 2020 ....................... 220
Figure 66 Chinese Taipei: Primary Energy Supply Fuel Mix, 1999 and 2020............... 225
Figure 67 Thailand: Primary Energy Supply Fuel Mix, 1999 and 2020 ......................... 230
Figure 68 United States: Primary Energy Supply Fuel Mix, 1999 and 2020 ................. 235
Figure 69 Viet Nam: Primary Energy Supply Fuel Mix, 1999 and 2020........................ 240

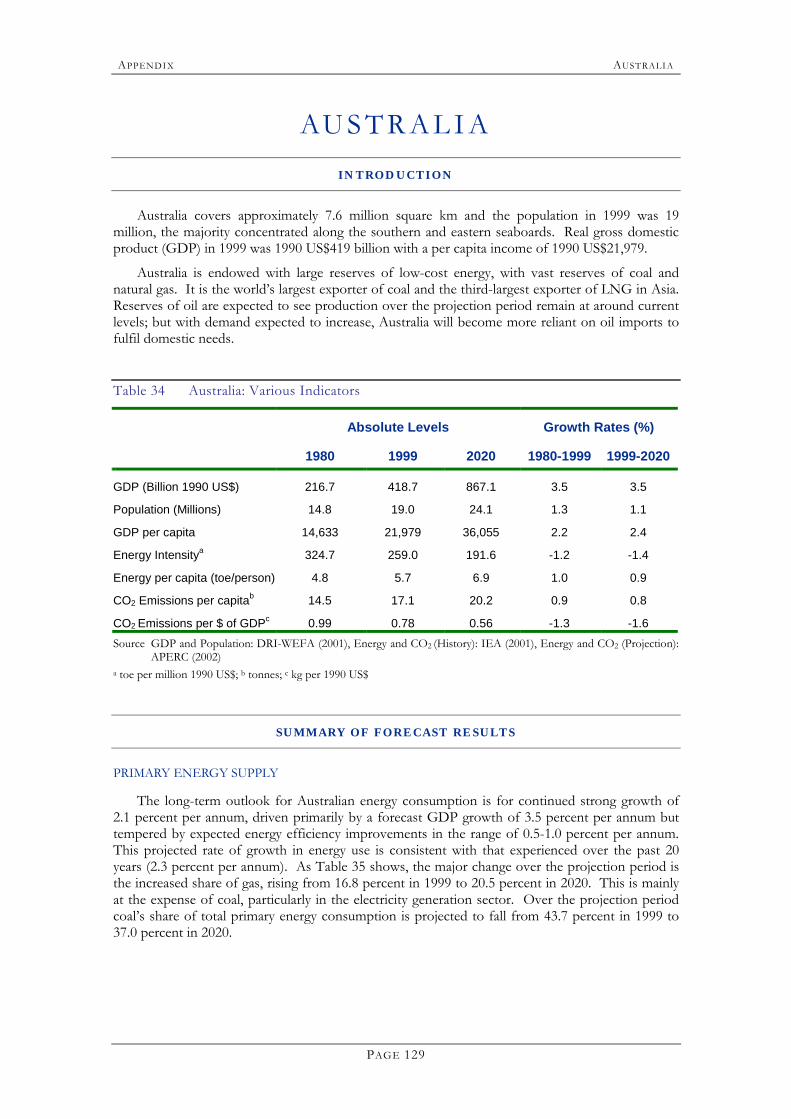
APPENDI X AUST RALI A
PAGE 129
AU S T R A L I A INTROD UCTION
Australia covers approximately 7.6 million square km and the population in 1999 was 19 million, the majority concentrated along the southern and eastern seaboards. Real gross domestic product (GDP) in 1999 was 1990 US$419 billion with a per capita income of 1990 US$21,979.
Australia is endowed with large reserves of low-cost energy, with vast reserves of coal and natural gas. It is the world�s largest exporter of coal and the third-largest exporter of LNG in Asia. Reserves of oil are expected to see production over the projection period remain at around current levels; but with demand expected to increase, Australia will become more reliant on oil imports to fulfil domestic needs.
Table 34 Australia: Various Indicators
Absolute Levels Growth Rates (%)
1980 1999 2020 1980-1999 1999-2020
GDP (Billion 1990 US$) 216.7 418.7 867.1 3.5 3.5
Population (Millions) 14.8 19.0 24.1 1.3 1.1
GDP per capita 14,633 21,979 36,055 2.2 2.4
Energy Intensitya 324.7 259.0 191.6 -1.2 -1.4
Energy per capita (toe/person) 4.8 5.7 6.9 1.0 0.9
CO2 Emissions per capitab 14.5 17.1 20.2 0.9 0.8
CO2 Emissions per $ of GDPc 0.99 0.78 0.56 -1.3 -1.6 Source GDP and Population: DRI-WEFA (2001), Energy and CO2 (History): IEA (2001), Energy and CO2 (Projection):
APERC (2002) a toe per million 1990 US$; b tonnes; c kg per 1990 US$
SUMMARY OF FORECAST RESULTS
PRIMARY ENERGY SUPPLY
The long-term outlook for Australian energy consumption is for continued strong growth of 2.1 percent per annum, driven primarily by a forecast GDP growth of 3.5 percent per annum but tempered by expected energy efficiency improvements in the range of 0.5-1.0 percent per annum. This projected rate of growth in energy use is consistent with that experienced over the past 20 years (2.3 percent per annum). As Table 35 shows, the major change over the projection period is the increased share of gas, rising from 16.8 percent in 1999 to 20.5 percent in 2020. This is mainly at the expense of coal, particularly in the electricity generation sector. Over the projection period coal�s share of total primary energy consumption is projected to fall from 43.7 percent in 1999 to 37.0 percent in 2020.
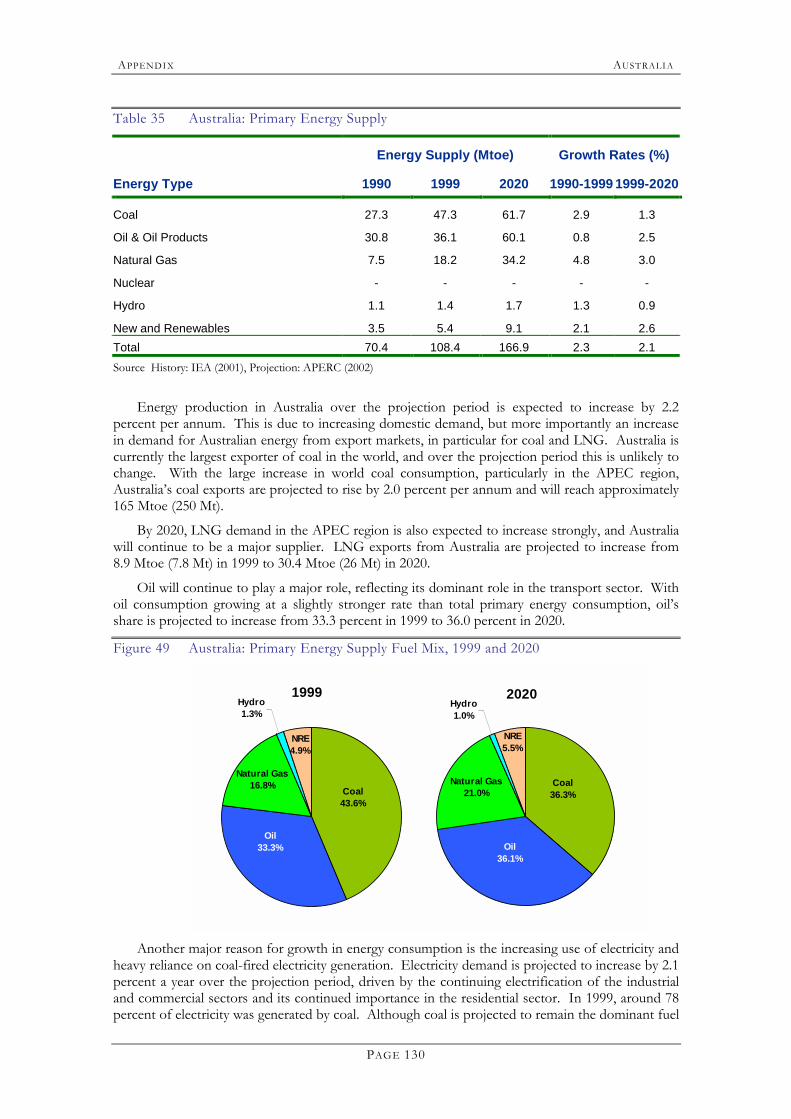
APPENDI X AUST RALI A
PAGE 130
Table 35 Australia: Primary Energy Supply
Energy Supply (Mtoe) Growth Rates (%)
Energy Type 1990 1999 2020 1990-1999 1999-2020
Coal 27.3 47.3 61.7 2.9 1.3
Oil & Oil Products 30.8 36.1 60.1 0.8 2.5
Natural Gas 7.5 18.2 34.2 4.8 3.0
Nuclear - - - - -
Hydro 1.1 1.4 1.7 1.3 0.9
New and Renewables 3.5 5.4 9.1 2.1 2.6 Total 70.4 108.4 166.9 2.3 2.1 Source History: IEA (2001), Projection: APERC (2002)
Energy production in Australia over the projection period is expected to increase by 2.2 percent per annum. This is due to increasing domestic demand, but more importantly an increase in demand for Australian energy from export markets, in particular for coal and LNG. Australia is currently the largest exporter of coal in the world, and over the projection period this is unlikely to change. With the large increase in world coal consumption, particularly in the APEC region, Australia�s coal exports are projected to rise by 2.0 percent per annum and will reach approximately 165 Mtoe (250 Mt).
By 2020, LNG demand in the APEC region is also expected to increase strongly, and Australia will continue to be a major supplier. LNG exports from Australia are projected to increase from 8.9 Mtoe (7.8 Mt) in 1999 to 30.4 Mtoe (26 Mt) in 2020.
Oil will continue to play a major role, reflecting its dominant role in the transport sector. With oil consumption growing at a slightly stronger rate than total primary energy consumption, oil�s share is projected to increase from 33.3 percent in 1999 to 36.0 percent in 2020.
Figure 49 Australia: Primary Energy Supply Fuel Mix, 1999 and 2020
1999Hydro1.3%
Oil33.3%
Coal43.6%
NRE4.9%
Natural Gas16.8%
2020Hydro1.0%
Oil36.1%
Coal36.3%
NRE5.5%
Natural Gas21.0%
Another major reason for growth in energy consumption is the increasing use of electricity and
heavy reliance on coal-fired electricity generation. Electricity demand is projected to increase by 2.1 percent a year over the projection period, driven by the continuing electrification of the industrial and commercial sectors and its continued importance in the residential sector. In 1999, around 78 percent of electricity was generated by coal. Although coal is projected to remain the dominant fuel
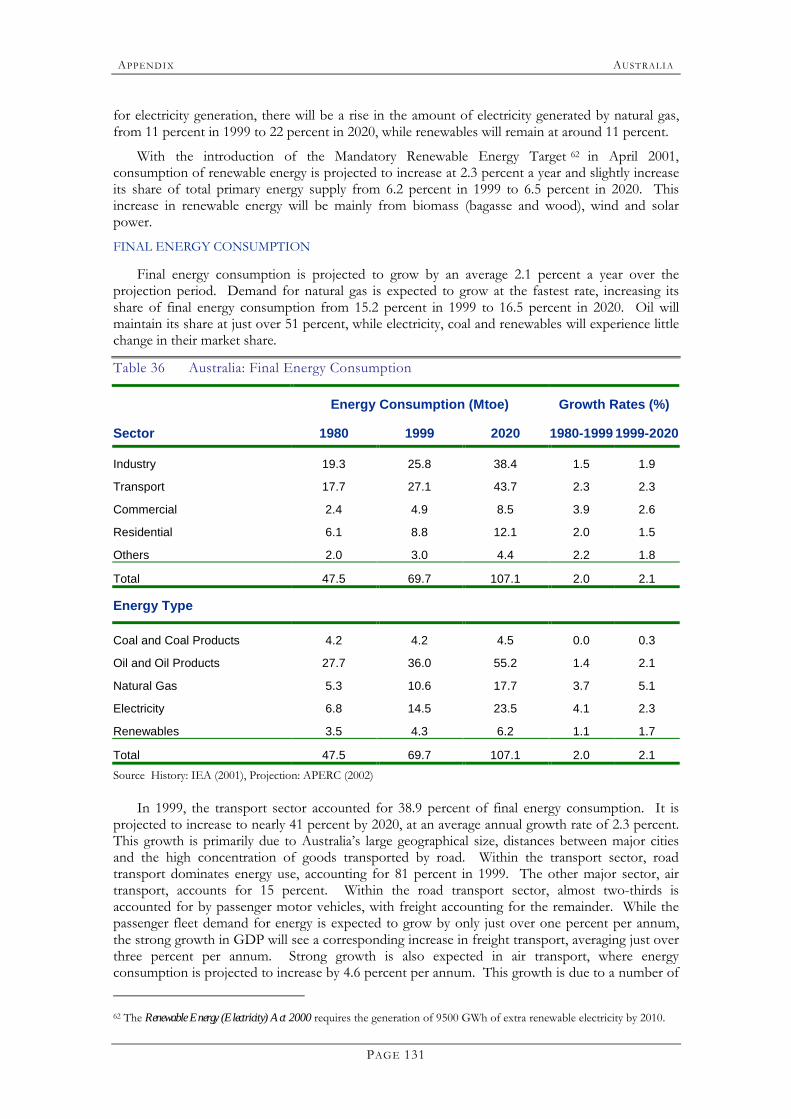
APPENDI X AUST RALI A
PAGE 131
for electricity generation, there will be a rise in the amount of electricity generated by natural gas, from 11 percent in 1999 to 22 percent in 2020, while renewables will remain at around 11 percent.
With the introduction of the Mandatory Renewable Energy Target 62 in April 2001, consumption of renewable energy is projected to increase at 2.3 percent a year and slightly increase its share of total primary energy supply from 6.2 percent in 1999 to 6.5 percent in 2020. This increase in renewable energy will be mainly from biomass (bagasse and wood), wind and solar power.
FINAL ENERGY CONSUMPTION
Final energy consumption is projected to grow by an average 2.1 percent a year over the projection period. Demand for natural gas is expected to grow at the fastest rate, increasing its share of final energy consumption from 15.2 percent in 1999 to 16.5 percent in 2020. Oil will maintain its share at just over 51 percent, while electricity, coal and renewables will experience little change in their market share.
Table 36 Australia: Final Energy Consumption
Energy Consumption (Mtoe) Growth Rates (%)
Sector 1980 1999 2020 1980-1999 1999-2020
Industry 19.3 25.8 38.4 1.5 1.9
Transport 17.7 27.1 43.7 2.3 2.3
Commercial 2.4 4.9 8.5 3.9 2.6
Residential 6.1 8.8 12.1 2.0 1.5
Others 2.0 3.0 4.4 2.2 1.8
Total 47.5 69.7 107.1 2.0 2.1
Energy Type
Coal and Coal Products 4.2 4.2 4.5 0.0 0.3
Oil and Oil Products 27.7 36.0 55.2 1.4 2.1
Natural Gas 5.3 10.6 17.7 3.7 5.1
Electricity 6.8 14.5 23.5 4.1 2.3
Renewables 3.5 4.3 6.2 1.1 1.7
Total 47.5 69.7 107.1 2.0 2.1 Source History: IEA (2001), Projection: APERC (2002)
In 1999, the transport sector accounted for 38.9 percent of final energy consumption. It is projected to increase to nearly 41 percent by 2020, at an average annual growth rate of 2.3 percent. This growth is primarily due to Australia�s large geographical size, distances between major cities and the high concentration of goods transported by road. Within the transport sector, road transport dominates energy use, accounting for 81 percent in 1999. The other major sector, air transport, accounts for 15 percent. Within the road transport sector, almost two-thirds is accounted for by passenger motor vehicles, with freight accounting for the remainder. While the passenger fleet demand for energy is expected to grow by only just over one percent per annum, the strong growth in GDP will see a corresponding increase in freight transport, averaging just over three percent per annum. Strong growth is also expected in air transport, where energy consumption is projected to increase by 4.6 percent per annum. This growth is due to a number of 62 The Renewable Energy (Electricity) Act 2000 requires the generation of 9500 GWh of extra renewable electricity by 2010.

APPENDI X AUST RALI A
PAGE 132
factors, including continued strong tourism demand, rising affluence of domestic customers and cheaper airfares in real terms.
Residential energy demand is expected to grow steadily by 1.5 percent a year from 1999 to 2020, with electricity and gas the major fuels used, displacing wood and oil. The commercial sector is expected to see growth of 2.6 percent per annum over the period to 2020, driven by high growth in economic activity averaging 3.5 percent per annum. Other drivers include the continuing electrification of workplaces (penetration of personal computers, printers and the like) and more flexible working hours, especially in the retail sector.
Over the last 20 years the industrial sector has grown at 1.6 percent per annum, and over the forecast period this growth rate is expected to rise to around 1.9 percent. The faster growth is mainly due to expected developments in the iron and steel and basic nonferrous metal sectors. In the iron and steel sector there is expected to be significant growth in the use of the direct reduced iron (DRI) process, in which iron ore is made into partially metalised iron granules using reformed natural gas. For the nonferrous metals sector, continued expansion and greenfield plants are expected in the alumina refining, aluminium smelting and nickel industries. Demand for magnesium, particularly for motor vehicles, is expected to increase rapidly over the projection period, resulting in a number of magnesium smelting plants being established in Australia. Natural gas and electricity are the major fuels used in the above processes, and their projected consumption is expected to grow, gas by 2.8 percent per year and electricity by 2.2 percent.
OTHER ISSUES
Competitively priced and reliable energy services are a key to international competitiveness in Australian industry and to its standard of living. Energy services are also essential for the development of Australia's regions. Production and exports of energy commodities, technologies and services contribute significantly to Australia's national wealth and to job creation.
Australian energy demand is expected to grow rapidly (2.1 percent a year until 2020, or just over a 50 percent increase). At the same time, energy supply and use is a significant and increasing source of greenhouse gas emissions and is a major factor in urban air quality. Meeting future energy needs will require carefully thought-out policies so that fuel choice and use are optimised from the economic, operational, reliability and security of supply, and environmental perspectives. Efficient energy markets and an effective policy framework are needed to reduce investment uncertainty, facilitate infrastructure development, encourage the development and uptake of alternative, environmentally friendly energy services, and facilitate more efficient use of energy throughout the economy. Sound decision-making processes, both in industry and government, contribute to the achievement of effective and efficient energy markets.
Further energy market development, for example development of Australia�s energy resources including natural gas, greater electricity interconnection and more efficient use of energy, will widen Australia's industry development possibilities and associated economic benefits. It will also provide opportunities for greater uptake of distributed electricity generation based on gas technologies or for more extensive application of renewable technologies � both offering environmental benefits.
At the same time, it must be recognised that Australia's energy market operates in the context of a dynamic international energy market. Any decisions made in this context must be flexible and responsive to significant developments in energy policy in major producing and consuming countries; they must ensure that Australia�s international competitiveness is enhanced, and that it is well-placed to take advantage of emerging opportunities to supply energy commodities, services and technologies.
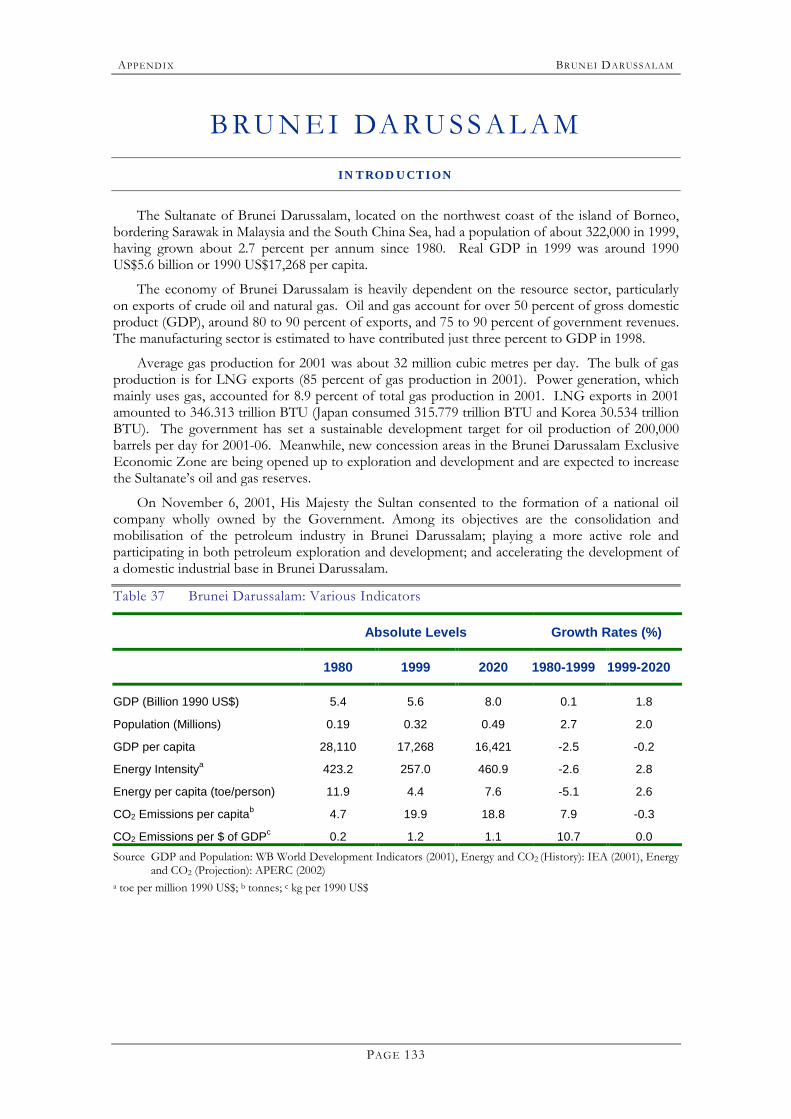
APPENDI X BRUNEI DARUSSALAM
PAGE 133
B RU N E I DA RU S S A L A M INTROD UCTION
The Sultanate of Brunei Darussalam, located on the northwest coast of the island of Borneo, bordering Sarawak in Malaysia and the South China Sea, had a population of about 322,000 in 1999, having grown about 2.7 percent per annum since 1980. Real GDP in 1999 was around 1990 US$5.6 billion or 1990 US$17,268 per capita.
The economy of Brunei Darussalam is heavily dependent on the resource sector, particularly on exports of crude oil and natural gas. Oil and gas account for over 50 percent of gross domestic product (GDP), around 80 to 90 percent of exports, and 75 to 90 percent of government revenues. The manufacturing sector is estimated to have contributed just three percent to GDP in 1998.
Average gas production for 2001 was about 32 million cubic metres per day. The bulk of gas production is for LNG exports (85 percent of gas production in 2001). Power generation, which mainly uses gas, accounted for 8.9 percent of total gas production in 2001. LNG exports in 2001 amounted to 346.313 trillion BTU (Japan consumed 315.779 trillion BTU and Korea 30.534 trillion BTU). The government has set a sustainable development target for oil production of 200,000 barrels per day for 2001-06. Meanwhile, new concession areas in the Brunei Darussalam Exclusive Economic Zone are being opened up to exploration and development and are expected to increase the Sultanate�s oil and gas reserves.
On November 6, 2001, His Majesty the Sultan consented to the formation of a national oil company wholly owned by the Government. Among its objectives are the consolidation and mobilisation of the petroleum industry in Brunei Darussalam; playing a more active role and participating in both petroleum exploration and development; and accelerating the development of a domestic industrial base in Brunei Darussalam.
Table 37 Brunei Darussalam: Various Indicators
Absolute Levels Growth Rates (%)
1980 1999 2020 1980-1999 1999-2020
GDP (Billion 1990 US$) 5.4 5.6 8.0 0.1 1.8
Population (Millions) 0.19 0.32 0.49 2.7 2.0
GDP per capita 28,110 17,268 16,421 -2.5 -0.2
Energy Intensitya 423.2 257.0 460.9 -2.6 2.8
Energy per capita (toe/person) 11.9 4.4 7.6 -5.1 2.6
CO2 Emissions per capitab 4.7 19.9 18.8 7.9 -0.3
CO2 Emissions per $ of GDPc 0.2 1.2 1.1 10.7 0.0 Source GDP and Population: WB World Development Indicators (2001), Energy and CO2 (History): IEA (2001), Energy
and CO2 (Projection): APERC (2002) a toe per million 1990 US$; b tonnes; c kg per 1990 US$
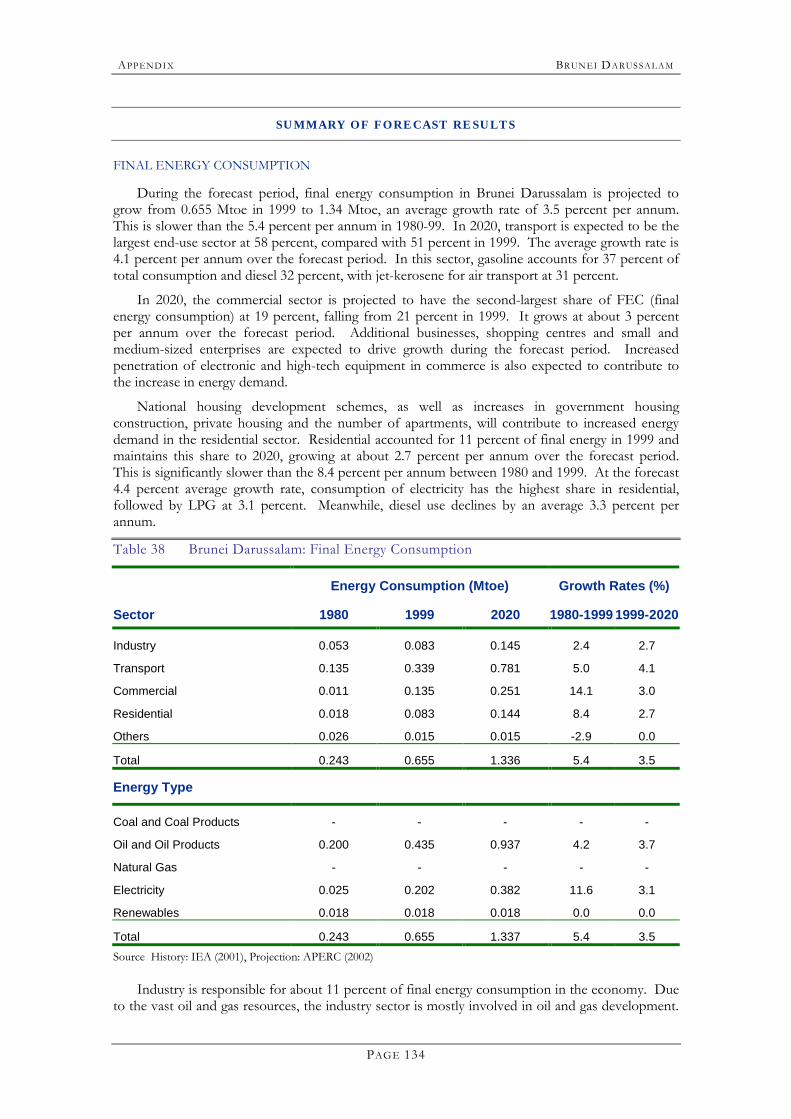
APPENDI X BRUNEI DARUSSALAM
PAGE 134
SUMMARY OF FORECAST RESULTS
FINAL ENERGY CONSUMPTION
During the forecast period, final energy consumption in Brunei Darussalam is projected to grow from 0.655 Mtoe in 1999 to 1.34 Mtoe, an average growth rate of 3.5 percent per annum. This is slower than the 5.4 percent per annum in 1980-99. In 2020, transport is expected to be the largest end-use sector at 58 percent, compared with 51 percent in 1999. The average growth rate is 4.1 percent per annum over the forecast period. In this sector, gasoline accounts for 37 percent of total consumption and diesel 32 percent, with jet-kerosene for air transport at 31 percent.
In 2020, the commercial sector is projected to have the second-largest share of FEC (final energy consumption) at 19 percent, falling from 21 percent in 1999. It grows at about 3 percent per annum over the forecast period. Additional businesses, shopping centres and small and medium-sized enterprises are expected to drive growth during the forecast period. Increased penetration of electronic and high-tech equipment in commerce is also expected to contribute to the increase in energy demand.
National housing development schemes, as well as increases in government housing construction, private housing and the number of apartments, will contribute to increased energy demand in the residential sector. Residential accounted for 11 percent of final energy in 1999 and maintains this share to 2020, growing at about 2.7 percent per annum over the forecast period. This is significantly slower than the 8.4 percent per annum between 1980 and 1999. At the forecast 4.4 percent average growth rate, consumption of electricity has the highest share in residential, followed by LPG at 3.1 percent. Meanwhile, diesel use declines by an average 3.3 percent per annum.
Table 38 Brunei Darussalam: Final Energy Consumption
Energy Consumption (Mtoe) Growth Rates (%)
Sector 1980 1999 2020 1980-1999 1999-2020
Industry 0.053 0.083 0.145 2.4 2.7
Transport 0.135 0.339 0.781 5.0 4.1
Commercial 0.011 0.135 0.251 14.1 3.0
Residential 0.018 0.083 0.144 8.4 2.7
Others 0.026 0.015 0.015 -2.9 0.0
Total 0.243 0.655 1.336 5.4 3.5
Energy Type
Coal and Coal Products - - - - -
Oil and Oil Products 0.200 0.435 0.937 4.2 3.7
Natural Gas - - - - -
Electricity 0.025 0.202 0.382 11.6 3.1
Renewables 0.018 0.018 0.018 0.0 0.0
Total 0.243 0.655 1.337 5.4 3.5 Source History: IEA (2001), Projection: APERC (2002)
Industry is responsible for about 11 percent of final energy consumption in the economy. Due to the vast oil and gas resources, the industry sector is mostly involved in oil and gas development.
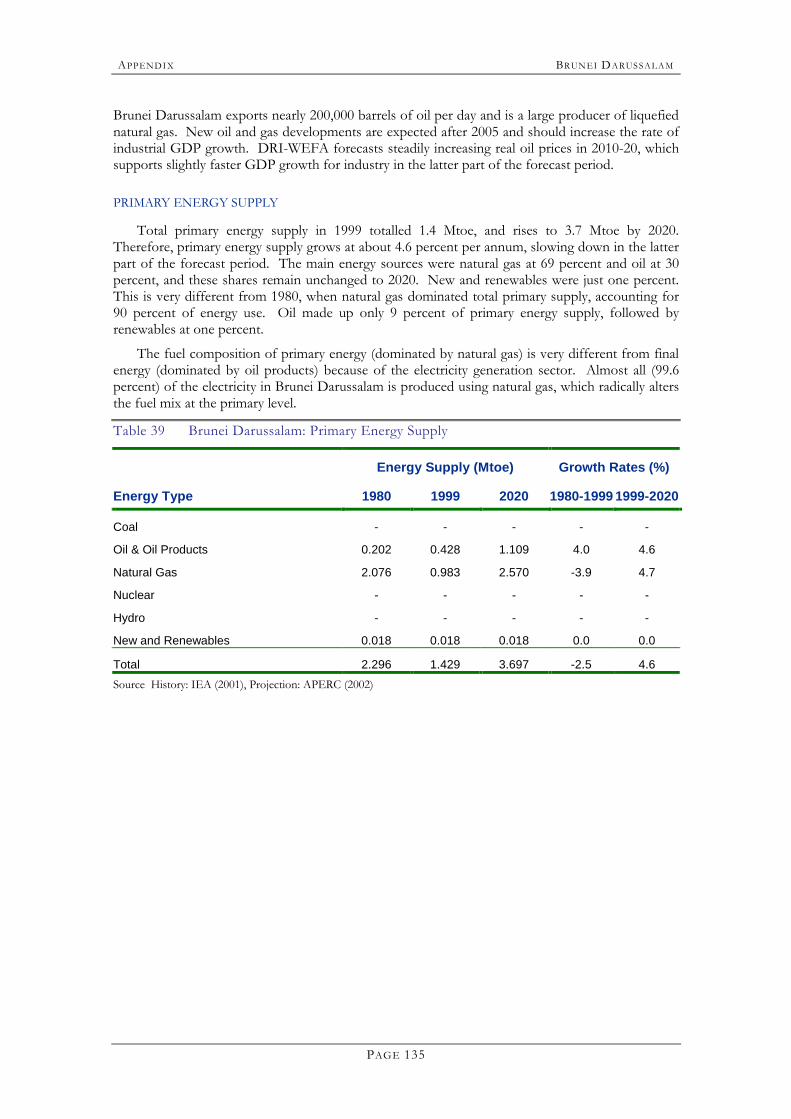
APPENDI X BRUNEI DARUSSALAM
PAGE 135
Brunei Darussalam exports nearly 200,000 barrels of oil per day and is a large producer of liquefied natural gas. New oil and gas developments are expected after 2005 and should increase the rate of industrial GDP growth. DRI-WEFA forecasts steadily increasing real oil prices in 2010-20, which supports slightly faster GDP growth for industry in the latter part of the forecast period. PRIMARY ENERGY SUPPLY
Total primary energy supply in 1999 totalled 1.4 Mtoe, and rises to 3.7 Mtoe by 2020. Therefore, primary energy supply grows at about 4.6 percent per annum, slowing down in the latter part of the forecast period. The main energy sources were natural gas at 69 percent and oil at 30 percent, and these shares remain unchanged to 2020. New and renewables were just one percent. This is very different from 1980, when natural gas dominated total primary supply, accounting for 90 percent of energy use. Oil made up only 9 percent of primary energy supply, followed by renewables at one percent.
The fuel composition of primary energy (dominated by natural gas) is very different from final energy (dominated by oil products) because of the electricity generation sector. Almost all (99.6 percent) of the electricity in Brunei Darussalam is produced using natural gas, which radically alters the fuel mix at the primary level.
Table 39 Brunei Darussalam: Primary Energy Supply
Energy Supply (Mtoe) Growth Rates (%)
Energy Type 1980 1999 2020 1980-1999 1999-2020
Coal - - - - -
Oil & Oil Products 0.202 0.428 1.109 4.0 4.6
Natural Gas 2.076 0.983 2.570 -3.9 4.7
Nuclear - - - - -
Hydro - - - - -
New and Renewables 0.018 0.018 0.018 0.0 0.0
Total 2.296 1.429 3.697 -2.5 4.6 Source History: IEA (2001), Projection: APERC (2002)
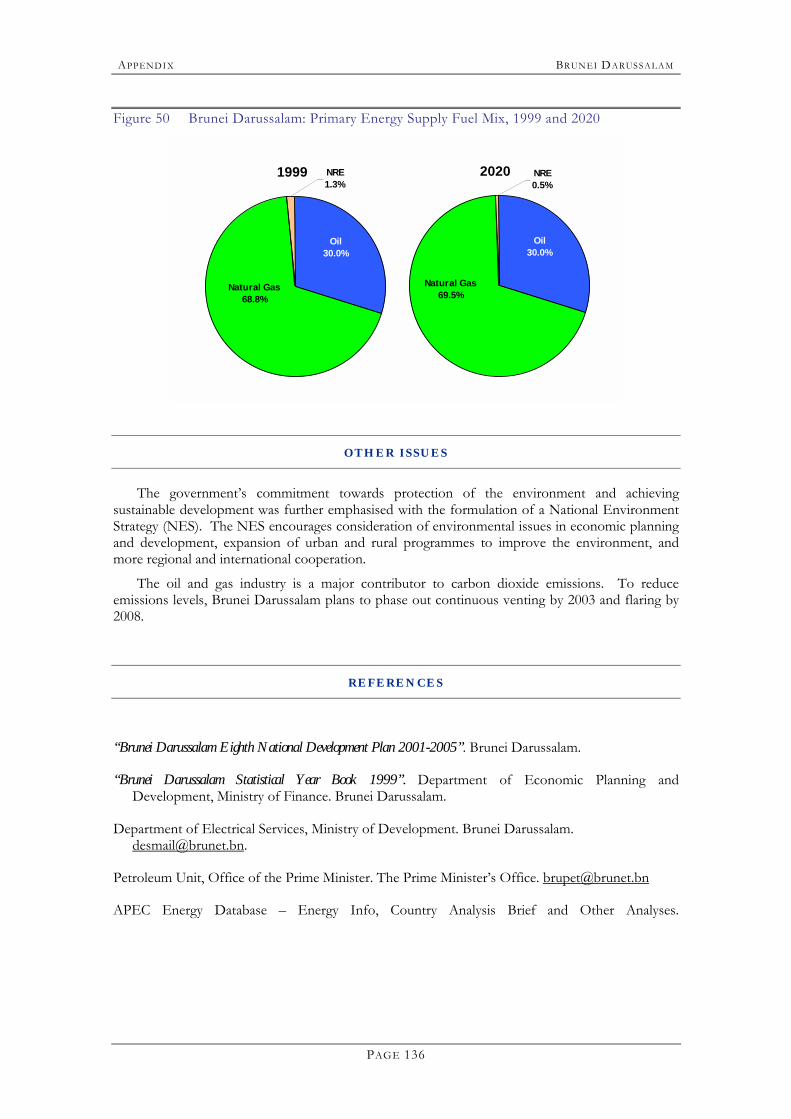
APPENDI X BRUNEI DARUSSALAM
PAGE 136
Figure 50 Brunei Darussalam: Primary Energy Supply Fuel Mix, 1999 and 2020
1999
Natural Gas68.8%
NRE1.3%
Oil30.0%
2020
Oil30.0%
NRE0.5%
Natural Gas69.5%
OTHER ISSUES
The government�s commitment towards protection of the environment and achieving sustainable development was further emphasised with the formulation of a National Environment Strategy (NES). The NES encourages consideration of environmental issues in economic planning and development, expansion of urban and rural programmes to improve the environment, and more regional and international cooperation.
The oil and gas industry is a major contributor to carbon dioxide emissions. To reduce emissions levels, Brunei Darussalam plans to phase out continuous venting by 2003 and flaring by 2008.
REFERENCES
“Brunei Darussalam Eighth National Development Plan 2001-2005”. Brunei Darussalam.
“Brunei Darussalam Statistical Year Book 1999”. Department of Economic Planning and Development, Ministry of Finance. Brunei Darussalam.
Department of Electrical Services, Ministry of Development. Brunei Darussalam. [email protected].
Petroleum Unit, Office of the Prime Minister. The Prime Minister�s Office. [email protected]
APEC Energy Database � Energy Info, Country Analysis Brief and Other Analyses.
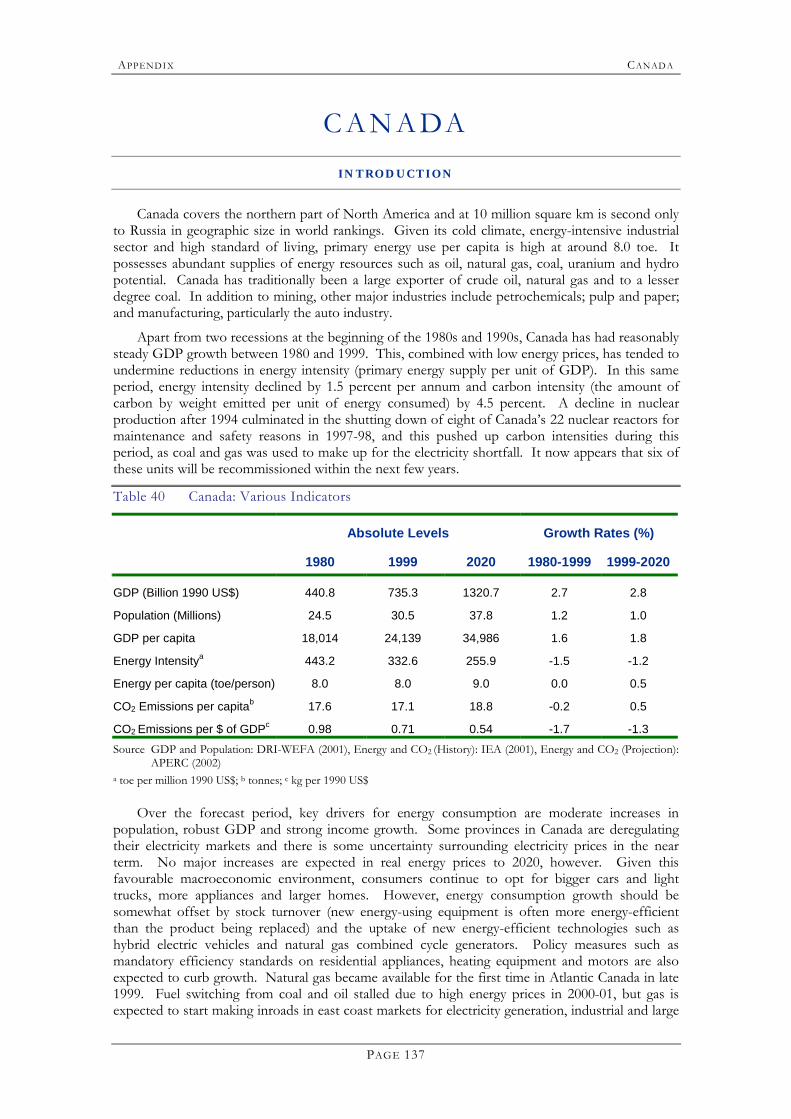
APPENDI X CAN AD A
PAGE 137
C A N A DA INTROD UCTION
Canada covers the northern part of North America and at 10 million square km is second only to Russia in geographic size in world rankings. Given its cold climate, energy-intensive industrial sector and high standard of living, primary energy use per capita is high at around 8.0 toe. It possesses abundant supplies of energy resources such as oil, natural gas, coal, uranium and hydro potential. Canada has traditionally been a large exporter of crude oil, natural gas and to a lesser degree coal. In addition to mining, other major industries include petrochemicals; pulp and paper; and manufacturing, particularly the auto industry.
Apart from two recessions at the beginning of the 1980s and 1990s, Canada has had reasonably steady GDP growth between 1980 and 1999. This, combined with low energy prices, has tended to undermine reductions in energy intensity (primary energy supply per unit of GDP). In this same period, energy intensity declined by 1.5 percent per annum and carbon intensity (the amount of carbon by weight emitted per unit of energy consumed) by 4.5 percent. A decline in nuclear production after 1994 culminated in the shutting down of eight of Canada�s 22 nuclear reactors for maintenance and safety reasons in 1997-98, and this pushed up carbon intensities during this period, as coal and gas was used to make up for the electricity shortfall. It now appears that six of these units will be recommissioned within the next few years.
Table 40 Canada: Various Indicators
Absolute Levels Growth Rates (%)
1980 1999 2020 1980-1999 1999-2020
GDP (Billion 1990 US$) 440.8 735.3 1320.7 2.7 2.8
Population (Millions) 24.5 30.5 37.8 1.2 1.0
GDP per capita 18,014 24,139 34,986 1.6 1.8
Energy Intensitya 443.2 332.6 255.9 -1.5 -1.2
Energy per capita (toe/person) 8.0 8.0 9.0 0.0 0.5
CO2 Emissions per capitab 17.6 17.1 18.8 -0.2 0.5
CO2 Emissions per $ of GDPc 0.98 0.71 0.54 -1.7 -1.3 Source GDP and Population: DRI-WEFA (2001), Energy and CO2 (History): IEA (2001), Energy and CO2 (Projection):
APERC (2002) a toe per million 1990 US$; b tonnes; c kg per 1990 US$
Over the forecast period, key drivers for energy consumption are moderate increases in population, robust GDP and strong income growth. Some provinces in Canada are deregulating their electricity markets and there is some uncertainty surrounding electricity prices in the near term. No major increases are expected in real energy prices to 2020, however. Given this favourable macroeconomic environment, consumers continue to opt for bigger cars and light trucks, more appliances and larger homes. However, energy consumption growth should be somewhat offset by stock turnover (new energy-using equipment is often more energy-efficient than the product being replaced) and the uptake of new energy-efficient technologies such as hybrid electric vehicles and natural gas combined cycle generators. Policy measures such as mandatory efficiency standards on residential appliances, heating equipment and motors are also expected to curb growth. Natural gas became available for the first time in Atlantic Canada in late 1999. Fuel switching from coal and oil stalled due to high energy prices in 2000-01, but gas is expected to start making inroads in east coast markets for electricity generation, industrial and large
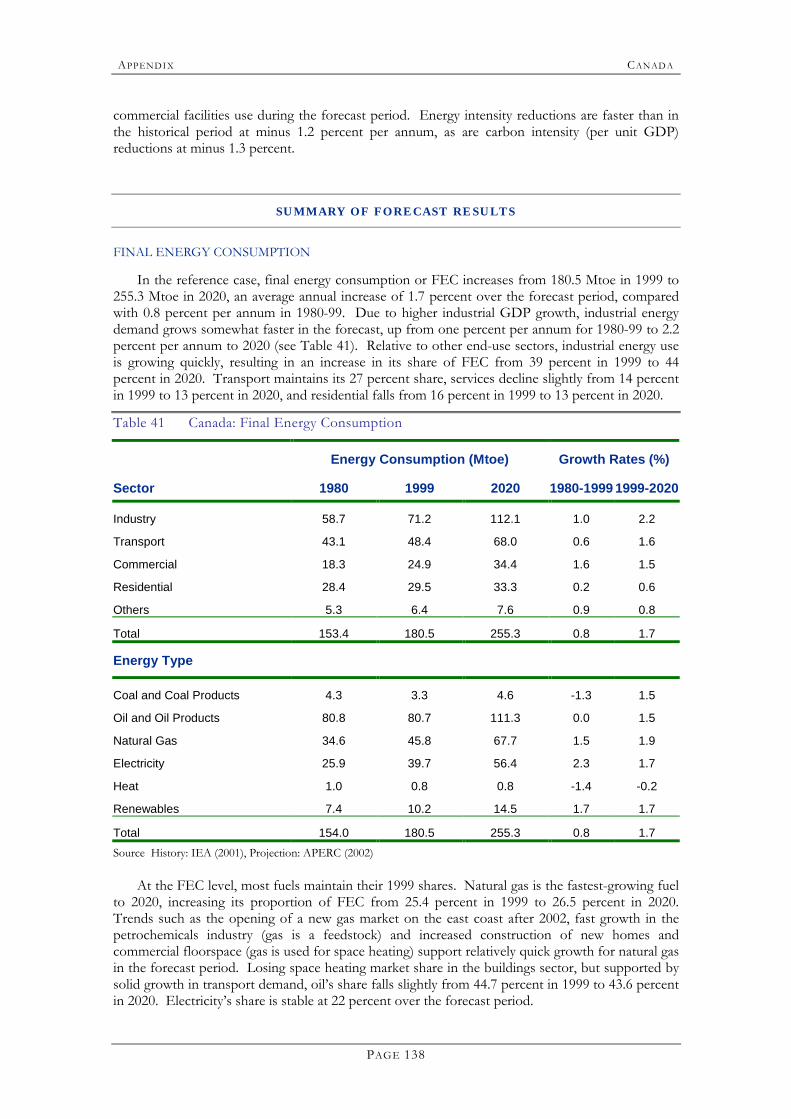
APPENDI X CAN AD A
PAGE 138
commercial facilities use during the forecast period. Energy intensity reductions are faster than in the historical period at minus 1.2 percent per annum, as are carbon intensity (per unit GDP) reductions at minus 1.3 percent.
SUMMARY OF FORECAST RESULTS
FINAL ENERGY CONSUMPTION
In the reference case, final energy consumption or FEC increases from 180.5 Mtoe in 1999 to 255.3 Mtoe in 2020, an average annual increase of 1.7 percent over the forecast period, compared with 0.8 percent per annum in 1980-99. Due to higher industrial GDP growth, industrial energy demand grows somewhat faster in the forecast, up from one percent per annum for 1980-99 to 2.2 percent per annum to 2020 (see Table 41). Relative to other end-use sectors, industrial energy use is growing quickly, resulting in an increase in its share of FEC from 39 percent in 1999 to 44 percent in 2020. Transport maintains its 27 percent share, services decline slightly from 14 percent in 1999 to 13 percent in 2020, and residential falls from 16 percent in 1999 to 13 percent in 2020.
Table 41 Canada: Final Energy Consumption
Energy Consumption (Mtoe) Growth Rates (%)
Sector 1980 1999 2020 1980-1999 1999-2020
Industry 58.7 71.2 112.1 1.0 2.2
Transport 43.1 48.4 68.0 0.6 1.6
Commercial 18.3 24.9 34.4 1.6 1.5
Residential 28.4 29.5 33.3 0.2 0.6
Others 5.3 6.4 7.6 0.9 0.8
Total 153.4 180.5 255.3 0.8 1.7
Energy Type
Coal and Coal Products 4.3 3.3 4.6 -1.3 1.5
Oil and Oil Products 80.8 80.7 111.3 0.0 1.5
Natural Gas 34.6 45.8 67.7 1.5 1.9
Electricity 25.9 39.7 56.4 2.3 1.7
Heat 1.0 0.8 0.8 -1.4 -0.2
Renewables 7.4 10.2 14.5 1.7 1.7
Total 154.0 180.5 255.3 0.8 1.7 Source History: IEA (2001), Projection: APERC (2002)
At the FEC level, most fuels maintain their 1999 shares. Natural gas is the fastest-growing fuel to 2020, increasing its proportion of FEC from 25.4 percent in 1999 to 26.5 percent in 2020. Trends such as the opening of a new gas market on the east coast after 2002, fast growth in the petrochemicals industry (gas is a feedstock) and increased construction of new homes and commercial floorspace (gas is used for space heating) support relatively quick growth for natural gas in the forecast period. Losing space heating market share in the buildings sector, but supported by solid growth in transport demand, oil�s share falls slightly from 44.7 percent in 1999 to 43.6 percent in 2020. Electricity�s share is stable at 22 percent over the forecast period.
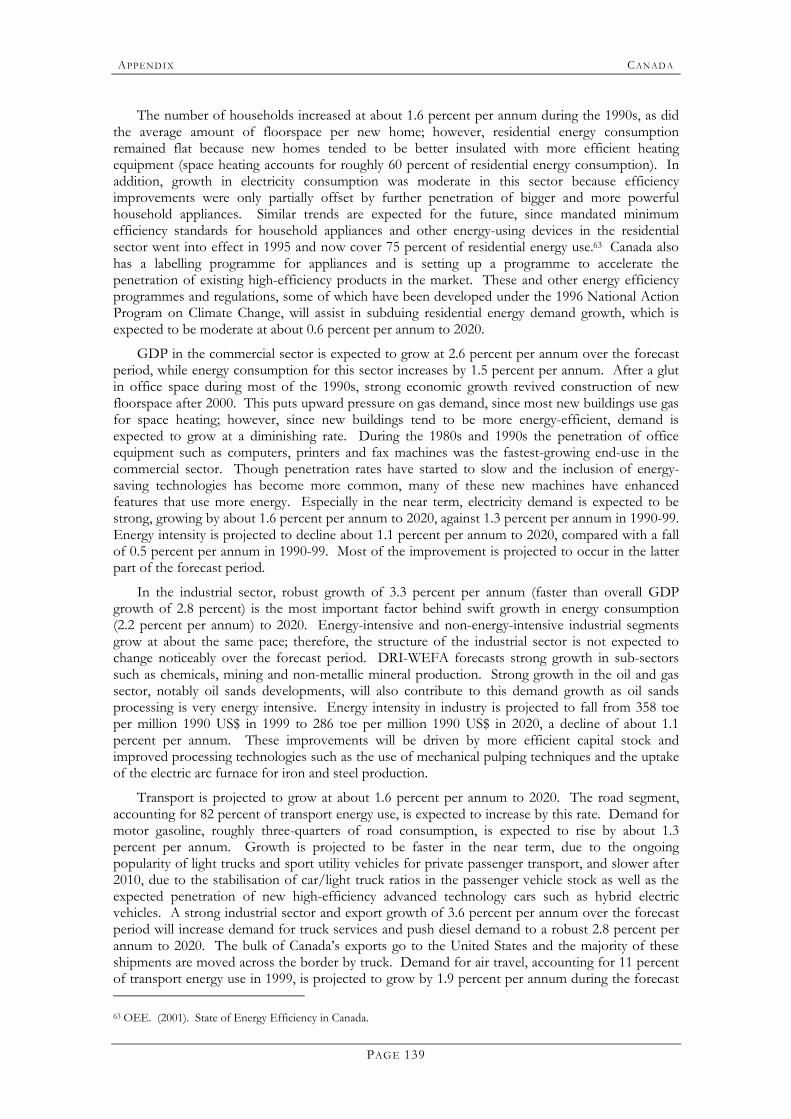
APPENDI X CAN AD A
PAGE 139
The number of households increased at about 1.6 percent per annum during the 1990s, as did the average amount of floorspace per new home; however, residential energy consumption remained flat because new homes tended to be better insulated with more efficient heating equipment (space heating accounts for roughly 60 percent of residential energy consumption). In addition, growth in electricity consumption was moderate in this sector because efficiency improvements were only partially offset by further penetration of bigger and more powerful household appliances. Similar trends are expected for the future, since mandated minimum efficiency standards for household appliances and other energy-using devices in the residential sector went into effect in 1995 and now cover 75 percent of residential energy use.63 Canada also has a labelling programme for appliances and is setting up a programme to accelerate the penetration of existing high-efficiency products in the market. These and other energy efficiency programmes and regulations, some of which have been developed under the 1996 National Action Program on Climate Change, will assist in subduing residential energy demand growth, which is expected to be moderate at about 0.6 percent per annum to 2020.
GDP in the commercial sector is expected to grow at 2.6 percent per annum over the forecast period, while energy consumption for this sector increases by 1.5 percent per annum. After a glut in office space during most of the 1990s, strong economic growth revived construction of new floorspace after 2000. This puts upward pressure on gas demand, since most new buildings use gas for space heating; however, since new buildings tend to be more energy-efficient, demand is expected to grow at a diminishing rate. During the 1980s and 1990s the penetration of office equipment such as computers, printers and fax machines was the fastest-growing end-use in the commercial sector. Though penetration rates have started to slow and the inclusion of energy-saving technologies has become more common, many of these new machines have enhanced features that use more energy. Especially in the near term, electricity demand is expected to be strong, growing by about 1.6 percent per annum to 2020, against 1.3 percent per annum in 1990-99. Energy intensity is projected to decline about 1.1 percent per annum to 2020, compared with a fall of 0.5 percent per annum in 1990-99. Most of the improvement is projected to occur in the latter part of the forecast period.
In the industrial sector, robust growth of 3.3 percent per annum (faster than overall GDP growth of 2.8 percent) is the most important factor behind swift growth in energy consumption (2.2 percent per annum) to 2020. Energy-intensive and non-energy-intensive industrial segments grow at about the same pace; therefore, the structure of the industrial sector is not expected to change noticeably over the forecast period. DRI-WEFA forecasts strong growth in sub-sectors such as chemicals, mining and non-metallic mineral production. Strong growth in the oil and gas sector, notably oil sands developments, will also contribute to this demand growth as oil sands processing is very energy intensive. Energy intensity in industry is projected to fall from 358 toe per million 1990 US$ in 1999 to 286 toe per million 1990 US$ in 2020, a decline of about 1.1 percent per annum. These improvements will be driven by more efficient capital stock and improved processing technologies such as the use of mechanical pulping techniques and the uptake of the electric arc furnace for iron and steel production.
Transport is projected to grow at about 1.6 percent per annum to 2020. The road segment, accounting for 82 percent of transport energy use, is expected to increase by this rate. Demand for motor gasoline, roughly three-quarters of road consumption, is expected to rise by about 1.3 percent per annum. Growth is projected to be faster in the near term, due to the ongoing popularity of light trucks and sport utility vehicles for private passenger transport, and slower after 2010, due to the stabilisation of car/light truck ratios in the passenger vehicle stock as well as the expected penetration of new high-efficiency advanced technology cars such as hybrid electric vehicles. A strong industrial sector and export growth of 3.6 percent per annum over the forecast period will increase demand for truck services and push diesel demand to a robust 2.8 percent per annum to 2020. The bulk of Canada�s exports go to the United States and the majority of these shipments are moved across the border by truck. Demand for air travel, accounting for 11 percent of transport energy use in 1999, is projected to grow by 1.9 percent per annum during the forecast 63 OEE. (2001). State of Energy Efficiency in Canada.
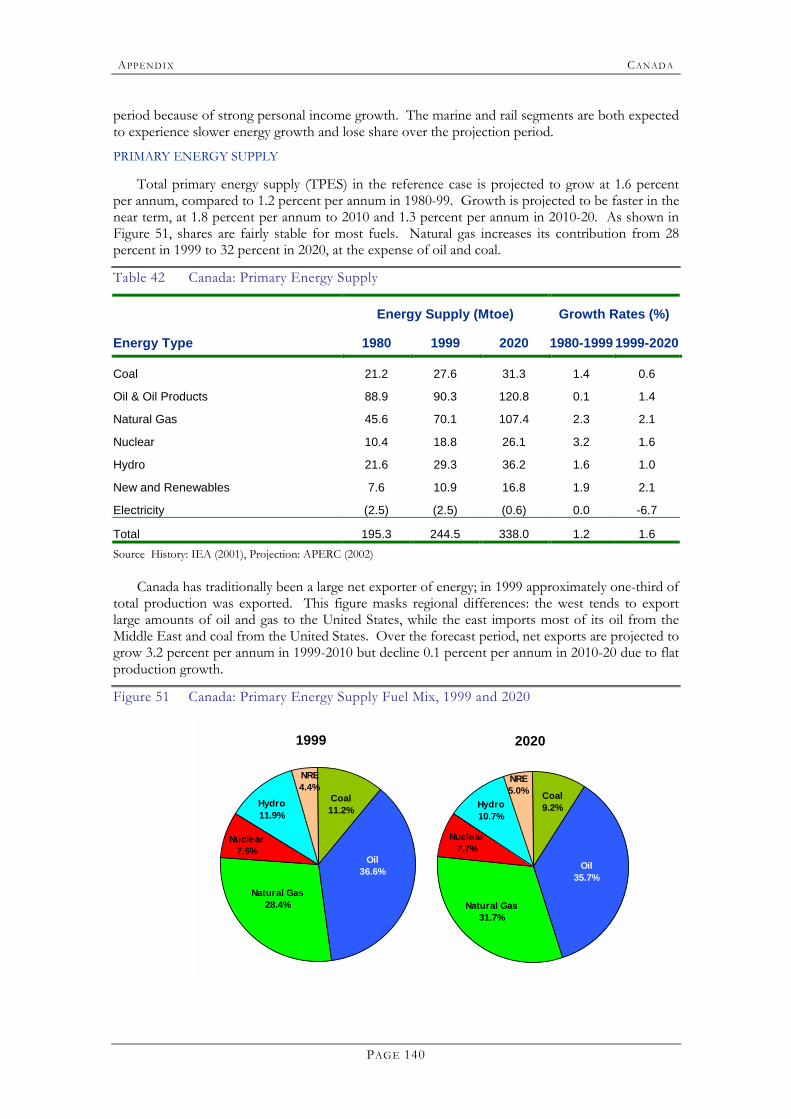
APPENDI X CAN AD A
PAGE 140
period because of strong personal income growth. The marine and rail segments are both expected to experience slower energy growth and lose share over the projection period.
PRIMARY ENERGY SUPPLY
Total primary energy supply (TPES) in the reference case is projected to grow at 1.6 percent per annum, compared to 1.2 percent per annum in 1980-99. Growth is projected to be faster in the near term, at 1.8 percent per annum to 2010 and 1.3 percent per annum in 2010-20. As shown in Figure 51, shares are fairly stable for most fuels. Natural gas increases its contribution from 28 percent in 1999 to 32 percent in 2020, at the expense of oil and coal.
Table 42 Canada: Primary Energy Supply
Energy Supply (Mtoe) Growth Rates (%)
Energy Type 1980 1999 2020 1980-1999 1999-2020
Coal 21.2 27.6 31.3 1.4 0.6
Oil & Oil Products 88.9 90.3 120.8 0.1 1.4
Natural Gas 45.6 70.1 107.4 2.3 2.1
Nuclear 10.4 18.8 26.1 3.2 1.6
Hydro 21.6 29.3 36.2 1.6 1.0
New and Renewables 7.6 10.9 16.8 1.9 2.1
Electricity (2.5) (2.5) (0.6) 0.0 -6.7
Total 195.3 244.5 338.0 1.2 1.6 Source History: IEA (2001), Projection: APERC (2002)
Canada has traditionally been a large net exporter of energy; in 1999 approximately one-third of total production was exported. This figure masks regional differences: the west tends to export large amounts of oil and gas to the United States, while the east imports most of its oil from the Middle East and coal from the United States. Over the forecast period, net exports are projected to grow 3.2 percent per annum in 1999-2010 but decline 0.1 percent per annum in 2010-20 due to flat production growth.
Figure 51 Canada: Primary Energy Supply Fuel Mix, 1999 and 2020
1999
Hydro11.9%
Nuclear7.6%
Oil 36.6%
Coal 11.2%
NRE4.4%
Natural Gas28.4%
2020
Natural Gas31.7%
NRE5.0% Coal
9.2%
Oil 35.7%
Nuclear7.7%
Hydro10.7%
APPENDI X CAN AD A
PAGE 141
Gas exports increase from 74.4 Mtoe in 1999 to 128.6 Mtoe in 2015 and remain at this level until 2020, resulting in average growth of 3.2 percent per annum to 2010 and 1.5 percent in 2010-20. Net oil exports peak in 2010 at 50.6 Mtoe and then fall to 36.9 Mtoe by 2020. Gluts in the international coal market, combined with the high cost of overseas transport, reduce net coal exports from 11.3 Mtoe in 1999 to 3.4 Mtoe in 2020, a decline of 5.5 percent per annum.
Over the forecast period, the fuel mix used to generate electricity shifts to favour natural gas at the expense of coal, hydro and oil. Hydro�s share is about 36.2 percent in 1999 and falls slightly to 33.6 percent by 2020. It is assumed that after 2010 a large hydro project goes ahead. Currently, big hydro developments are being seriously considered on the lower Churchill River in Labrador (2200 MW) and in the James Bay area of northern Quebec (1200 MW). Except for some new coal-fired plants in Alberta in 2005, no new coal capacity is expected, so coal�s fuel share falls from 29.4 percent in 1999 to 23.2 percent in 2020. Nuclear�s share increases from 23.3 percent in 1999 to 29.0 percent in 2005 due to the expected reopening of six nuclear power plants (four reactors at Pickering A and two at Bruce A) in Ontario in 2002-4; but declines to 24.2 percent by 2020.
In the electricity generation sector, new capacity additions are assumed to be mostly natural gas combined cycle and gas turbine. This is because these technologies are very efficient, gas is a relatively clean-burning fuel and additions can be flexible in size. Therefore natural gas is projected to be the fastest-growing fuel, increasing its share of fuels to generate electricity from 6.8 percent in 1999 to 15.6 percent in 2020. The federal Wind Power Production Incentive (WPPI) will provide financial support in the form of a subsidy for every kWh produced, to encourage the installation of 1,000 MW of new wind capacity from 2002 to 2007. As a result, renewable share electricity fuel inputs increase slightly to 2020. Due to the introduction of gas in the Atlantic, 64 oil�s share is expected to drop from 3.5 percent in 1999 to 1.2 percent in 2020.
OTHER ISSUES
ENVIRONMENT
Since 1980, Canada�s greenhouse gas emissions from fuel combustion have grown from 430 Mt of CO2 to 489.2 Mt in 1999, an increase of about 14 percent. In the APERC forecast, after taking into account current programmes, emissions reach 604.0 Mt of CO2 by 2010 and 695.5 Mt by 2020.
At the Kyoto conference in 1997, Canada agreed to reduce its greenhouse gas emissions to six percent below 1990 levels by 2008-12. Since 1997, to curb emissions growth the Canadian government has implemented a series of policies and measures; additional programmes and initiatives were announced recently in Action Plan 2000 and Budget 2001. In May 2002, the government released a report outlining four options for addressing the remaining gap and achieving Canada�s commitments under the Kyoto Protocol. Key issues raised by this report include the lack of recognition of the environmental benefits of Canada�s exports of cleaner energy (natural gas and hydro electricity) to the United States and concerns that Canadian competitiveness may suffer because it would be �the only country in the Americas to establish a mandatory emissions reduction target�. The discussion paper demonstrates that meeting Canada�s Kyoto targets will not be painless: there will be a negative impact on GDP growth, some regions will be more adversely affected than others, and (depending on the option chosen) energy prices could rise significantly.
It is uncertain whether Canada will ratify the Kyoto Protocol or whether any of the options outlined above will be implemented. Some environmental groups argue that the discussion paper released in May 2002 is an �exit strategy�. In the report, Canada expresses a clear preference for �clean energy credits� to help meet its commitments, a measure that is not part of the Kyoto Protocol and that is opposed by many of the signatories. If one of the four plans outlined in the 64 Natural gas from the offshore Sable island gas development only became available to the Atlantic region in December
1999. Due to high gas prices from 2000 to 2001, despite having converted some facilities to gas, NS and NB Power chose to sell their contracted gas to the US market instead of using it for power generation. Gas prices have returned to pre-1999 levels and both power companies are expected to start using gas in 2002.
APPENDI X CAN AD A
PAGE 142
discussion paper were to be implemented, it would have a significant impact on energy consumption levels in Canada to 2010 and beyond. Three of the options outlined in the discussion paper would involve some sort of emissions trading scheme. This would mean the polluter pays the cost of the permit, providing an incentive to invest in energy-efficient equipment and technologies to reduce emissions (and reduce the financial burden of buying permits). The final option, which is non-market based, would achieve the Kyoto cuts based solely on government programmes and initiatives. In the APERC forecast, only announced measures have been included in the forecast analysis.
ENERGY MARKETS
While climate change issues are pervasive and will undoubtedly strongly influence Canadian energy policy for the foreseeable future, there are a number of other issues that have the potential to significantly alter the energy landscape.
Among these are North American energy integration (following the Cheney report), the proposed Alaska gas pipeline and further electricity market deregulation.

APPENDI X CHILE
PAGE 143
C H I L E INTROD UCTION
Chile, one of the two APEC economies in South America, covers nearly 757,000 square km. It has some small island possessions including Easter Island in the South Pacific. The population lives mainly in urban areas, with nearly one-third of its 15 million inhabitants residing in Santiago, the capital. In 1999, real gross domestic product (GDP) was 1990 US$54.5 billion and per capita income was 1990 US$3,612 (see Table 43).
From 1984 to 1997, Chile had robust economic growth averaging 7.2 percent per annum. Due to its dependence on exports, the Asian financial crisis of 1997-98 reduced growth considerably in 1998-99, and the global economic slowdown did so in 2001-02. GDP is projected to stabilise by 2003 and triple during the forecast period (1999-2020), increasing by an average of 5.5 percent per annum, somewhat faster than the 4.8 percent per annum achieved between 1980 and 1999. Chile signed free trade agreements with its main trading partner, the European Union, in 2002, and in the near future will do so with Japan and the US. These should further increase trade flows and industrial production, but will also increase the economy�s vulnerability to external trade cycles. Incomes � an important driver for energy demand � are expected to continue growing strongly during the forecast period, rising by 4.2 percent per annum to 2020 (an increase to 2.4 times the 1999 value). On the other hand, energy intensity (in toe per million 1990 US$) will decrease by an average of 1.2 percent per annum, signalling a decoupling of GDP and energy consumption, a process that has already been experienced by more developed APEC economies. One of the main factors behind this trend is the increase in the share of the service sector in total value added, which will rise from 49 to 55 percent. Energy per capita and CO2 emissions per capita are forecast to nearly double by 2020, but they will still be well below the 1999 values of APEC�s more developed economies.
Table 43 Chile: Various Indicators
Absolute Levels Growth Rates (%)
1980 1999 2020 1980-1999 1999-2020
GDP (Billion 1990 US$) 22.3 54.5 166.6 4.8 5.5
Population (Millions) 11.1 15.1 19.4 1.6 1.2
GDP per capita 2,004 3,612 8,579 3.1 4.2
Energy Intensitya 432.7 464.9 361.2 0.4 -1.2
Energy per capita (toe/person) 0.9 1.7 3.1 3.5 3.0
CO2 Emissions per capitab 2.0 3.7 7.3 3.4 3.3
CO2 Emissions per $ of GDPc 1.0 1.0 0.9 0.2 -0.9 Source GDP and Population: DRI-WEFA (2001), Energy and CO2 (History): IEA (2001), Energy and CO2 (Projection):
APERC (2002) a toe per million 1990 US$; b tonnes; c kg per 1990 US$
Chile is endowed with modest amounts of energy resources. As of 1999, its energy reserves consisted of 4.8 MCM of crude oil, 45 MCM of natural gas and 155 Mt of coal. In that year Chile imported approximately 70 percent of its energy requirements, a figure that is forecast to increase.
APPENDI X CHILE
PAGE 144
SUMMARY OF FORECAST RESULTS
FINAL ENERGY CONSUMPTION
Final energy consumption is projected to increase by nearly 2.6 times (an average annual increase of 4.6 percent) over the forecast period, similar to the last 20 years (see Table 44). Of this increase, industry will account for 47 percent, transport 41 percent, residential nine percent and commercial three percent.
The industrial sector is forecast to have the fastest growth rate of all demand sectors, further increasing its share of final energy consumption from 37 to 43 percent between 1999 and 2020. This sector is expected to triple its energy consumption during the forecast period, at a higher rate than during 1980-99 (an average of 5.4 percent per annum to 2020 compared to 4.5 percent per annum). The main changes in the shares of total value added are expected to take place in the mining and quarrying sector � which in 1999 was second after services with a 10 percent share but is projected to fall to fourth place with a seven percent share � while that of chemicals, petroleum refining and plastics will increase from seven percent in 1999 to 10 percent in 2020. In spite of its decrease in share, mining (and especially copper production) is expected to continue playing an important role, both in economic and energy terms. Chile is the world�s largest producer of copper (most of which is exported), with a 35 percent share of total mine production � a percentage that is expected to increase � and nearly 25 percent of total copper reserves.65 In terms of industrial energy consumption, in 1999 copper production accounted for nearly 25 percent of the sectoral total and nearly 45 percent of the electricity consumed by industry, occupying first place.
Energy consumption in the pulp and paper industry � the second-highest share in industrial energy consumption after copper � is expected to stabilise in the near term because many plants are operating at peak capacity, but will then increase sharply with the start of operations of two new plants that will boost production by 40 percent. Though a 440 million tonne per year aluminium plant has been proposed which would make the industrial sector in Chile more energy intensive, it was assumed in the APERC forecast that the plant would not be built before 2020.
Growth in the transport sector is expected to be the second fastest after industry, with an annual average increase of 5.2 percent (a growth of 2.9 times its 1999 value). Its share in final energy demand will increase from 34 percent in 1999 to 38 percent in 2020, second after industry. Road transport will continue to be the main consuming sub-sector, with a stable share of 84 percent of total transport energy consumption and an average growth rate of 5.3 percent per annum for the period. Air travel will grow the fastest, at an annual average of 6.5 percent, thus increasing its share from eight percent to 14 percent of total transport energy consumption. Rail energy consumption is expected to increase by an average of 2.5 percent per year, mainly due to expansions in the subway system and to an increase in freight transport. Marine consumption is forecast to stay fairly stable, due to limits on fishing quotas and restrictions on competition in the domestic merchant marine market. The main driver behind the growth in transport energy consumption will be an increase in per capita income. This will be reflected in an increase in car ownership66 and use � with a corresponding decrease in less energy-intensive public transport modes � and more air travel. Increased car ownership represents a serious challenge to transport authorities, considering the already serious pollution and traffic congestion problems in Chile�s main cities.
In contrast with the other demand sectors, energy consumption growth in the commercial and residential sectors will be slower during the forecast period than in 1980-99. Energy demand in the commercial sector is expected to increase by 4.4 percent per year compared with 7.3 percent during the historical period, while the increase in residential sector demand will be 2.1 percent, compared with 4.0 percent. Their combined share in final energy demand will decrease from 29 percent to 19
65 U.S. Geological Survey (2002), �Mineral Commodity Summaries�. 66 In 1999, there where 125 cars, vans and light trucks per 1,000 people.
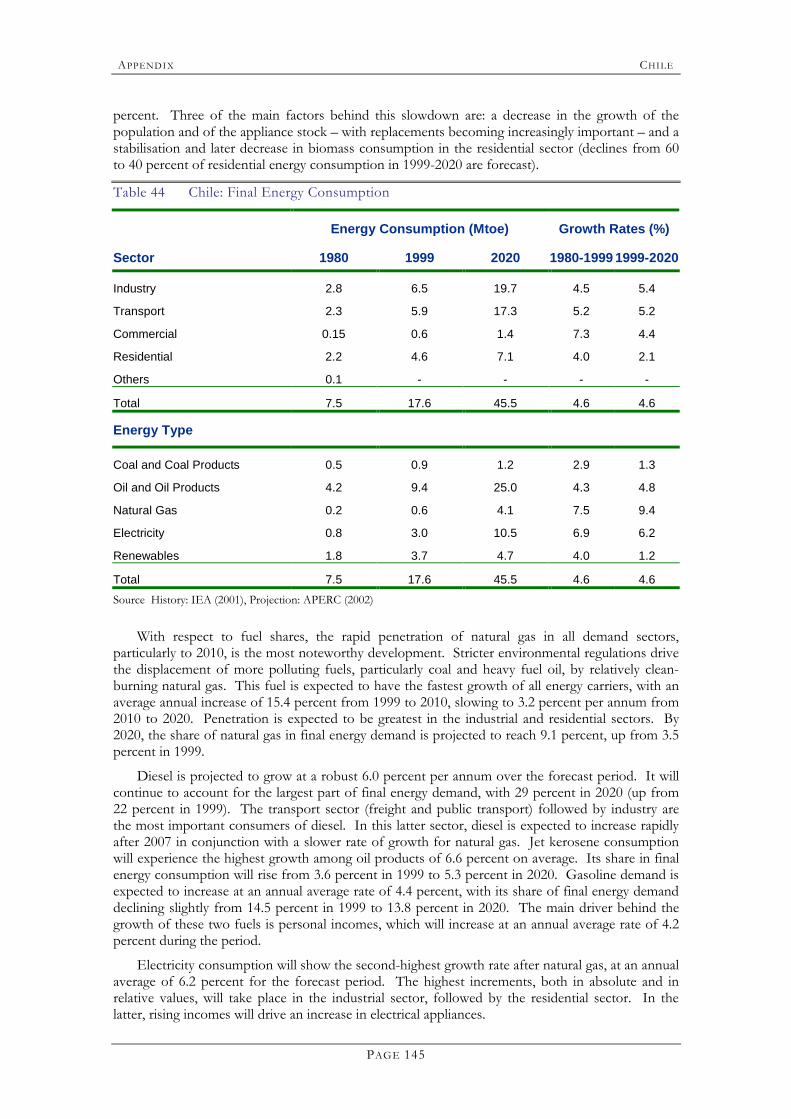
APPENDI X CHILE
PAGE 145
percent. Three of the main factors behind this slowdown are: a decrease in the growth of the population and of the appliance stock � with replacements becoming increasingly important � and a stabilisation and later decrease in biomass consumption in the residential sector (declines from 60 to 40 percent of residential energy consumption in 1999-2020 are forecast).
Table 44 Chile: Final Energy Consumption
Energy Consumption (Mtoe) Growth Rates (%)
Sector 1980 1999 2020 1980-1999 1999-2020
Industry 2.8 6.5 19.7 4.5 5.4
Transport 2.3 5.9 17.3 5.2 5.2
Commercial 0.15 0.6 1.4 7.3 4.4
Residential 2.2 4.6 7.1 4.0 2.1
Others 0.1 - - - -
Total 7.5 17.6 45.5 4.6 4.6
Energy Type
Coal and Coal Products 0.5 0.9 1.2 2.9 1.3
Oil and Oil Products 4.2 9.4 25.0 4.3 4.8
Natural Gas 0.2 0.6 4.1 7.5 9.4
Electricity 0.8 3.0 10.5 6.9 6.2
Renewables 1.8 3.7 4.7 4.0 1.2
Total 7.5 17.6 45.5 4.6 4.6 Source History: IEA (2001), Projection: APERC (2002)
With respect to fuel shares, the rapid penetration of natural gas in all demand sectors, particularly to 2010, is the most noteworthy development. Stricter environmental regulations drive the displacement of more polluting fuels, particularly coal and heavy fuel oil, by relatively clean-burning natural gas. This fuel is expected to have the fastest growth of all energy carriers, with an average annual increase of 15.4 percent from 1999 to 2010, slowing to 3.2 percent per annum from 2010 to 2020. Penetration is expected to be greatest in the industrial and residential sectors. By 2020, the share of natural gas in final energy demand is projected to reach 9.1 percent, up from 3.5 percent in 1999.
Diesel is projected to grow at a robust 6.0 percent per annum over the forecast period. It will continue to account for the largest part of final energy demand, with 29 percent in 2020 (up from 22 percent in 1999). The transport sector (freight and public transport) followed by industry are the most important consumers of diesel. In this latter sector, diesel is expected to increase rapidly after 2007 in conjunction with a slower rate of growth for natural gas. Jet kerosene consumption will experience the highest growth among oil products of 6.6 percent on average. Its share in final energy consumption will rise from 3.6 percent in 1999 to 5.3 percent in 2020. Gasoline demand is expected to increase at an annual average rate of 4.4 percent, with its share of final energy demand declining slightly from 14.5 percent in 1999 to 13.8 percent in 2020. The main driver behind the growth of these two fuels is personal incomes, which will increase at an annual average rate of 4.2 percent during the period.
Electricity consumption will show the second-highest growth rate after natural gas, at an annual average of 6.2 percent for the forecast period. The highest increments, both in absolute and in relative values, will take place in the industrial sector, followed by the residential sector. In the latter, rising incomes will drive an increase in electrical appliances.
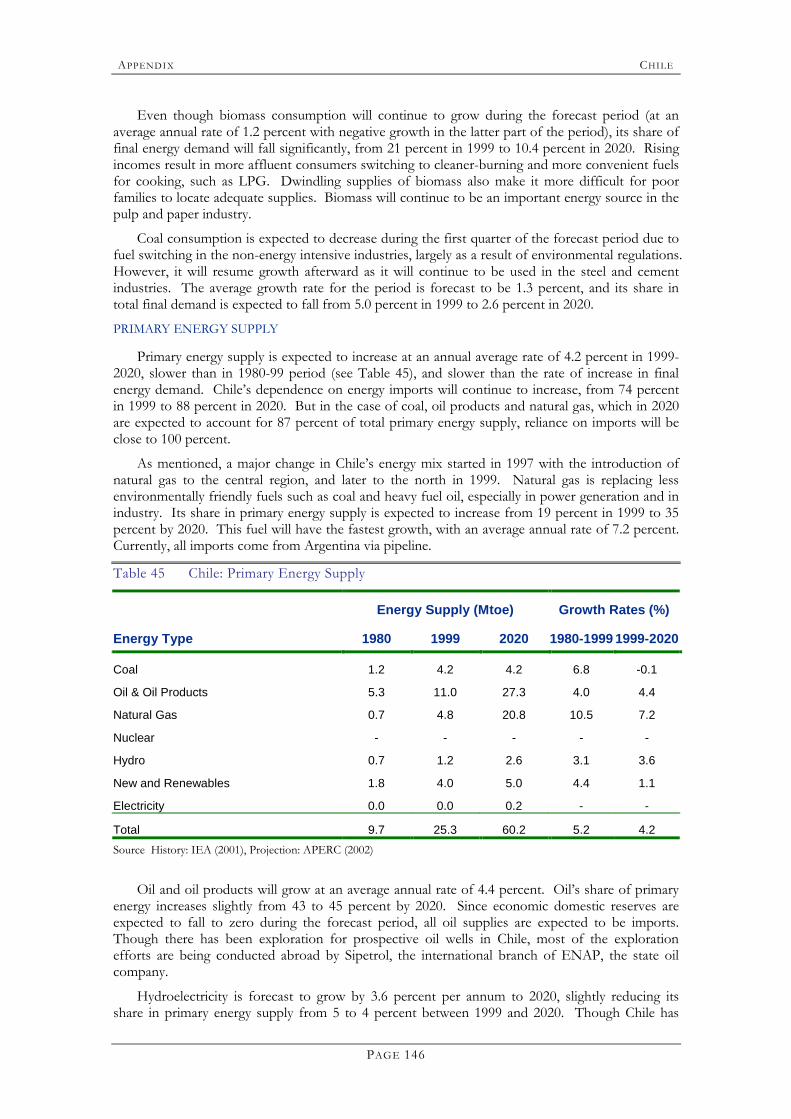
APPENDI X CHILE
PAGE 146
Even though biomass consumption will continue to grow during the forecast period (at an average annual rate of 1.2 percent with negative growth in the latter part of the period), its share of final energy demand will fall significantly, from 21 percent in 1999 to 10.4 percent in 2020. Rising incomes result in more affluent consumers switching to cleaner-burning and more convenient fuels for cooking, such as LPG. Dwindling supplies of biomass also make it more difficult for poor families to locate adequate supplies. Biomass will continue to be an important energy source in the pulp and paper industry.
Coal consumption is expected to decrease during the first quarter of the forecast period due to fuel switching in the non-energy intensive industries, largely as a result of environmental regulations. However, it will resume growth afterward as it will continue to be used in the steel and cement industries. The average growth rate for the period is forecast to be 1.3 percent, and its share in total final demand is expected to fall from 5.0 percent in 1999 to 2.6 percent in 2020.
PRIMARY ENERGY SUPPLY
Primary energy supply is expected to increase at an annual average rate of 4.2 percent in 1999-2020, slower than in 1980-99 period (see Table 45), and slower than the rate of increase in final energy demand. Chile�s dependence on energy imports will continue to increase, from 74 percent in 1999 to 88 percent in 2020. But in the case of coal, oil products and natural gas, which in 2020 are expected to account for 87 percent of total primary energy supply, reliance on imports will be close to 100 percent.
As mentioned, a major change in Chile�s energy mix started in 1997 with the introduction of natural gas to the central region, and later to the north in 1999. Natural gas is replacing less environmentally friendly fuels such as coal and heavy fuel oil, especially in power generation and in industry. Its share in primary energy supply is expected to increase from 19 percent in 1999 to 35 percent by 2020. This fuel will have the fastest growth, with an average annual rate of 7.2 percent. Currently, all imports come from Argentina via pipeline.
Table 45 Chile: Primary Energy Supply
Energy Supply (Mtoe) Growth Rates (%)
Energy Type 1980 1999 2020 1980-1999 1999-2020
Coal 1.2 4.2 4.2 6.8 -0.1
Oil & Oil Products 5.3 11.0 27.3 4.0 4.4
Natural Gas 0.7 4.8 20.8 10.5 7.2
Nuclear - - - - -
Hydro 0.7 1.2 2.6 3.1 3.6
New and Renewables 1.8 4.0 5.0 4.4 1.1
Electricity 0.0 0.0 0.2 - -
Total 9.7 25.3 60.2 5.2 4.2 Source History: IEA (2001), Projection: APERC (2002)
Oil and oil products will grow at an average annual rate of 4.4 percent. Oil�s share of primary energy increases slightly from 43 to 45 percent by 2020. Since economic domestic reserves are expected to fall to zero during the forecast period, all oil supplies are expected to be imports. Though there has been exploration for prospective oil wells in Chile, most of the exploration efforts are being conducted abroad by Sipetrol, the international branch of ENAP, the state oil company.
Hydroelectricity is forecast to grow by 3.6 percent per annum to 2020, slightly reducing its share in primary energy supply from 5 to 4 percent between 1999 and 2020. Though Chile has
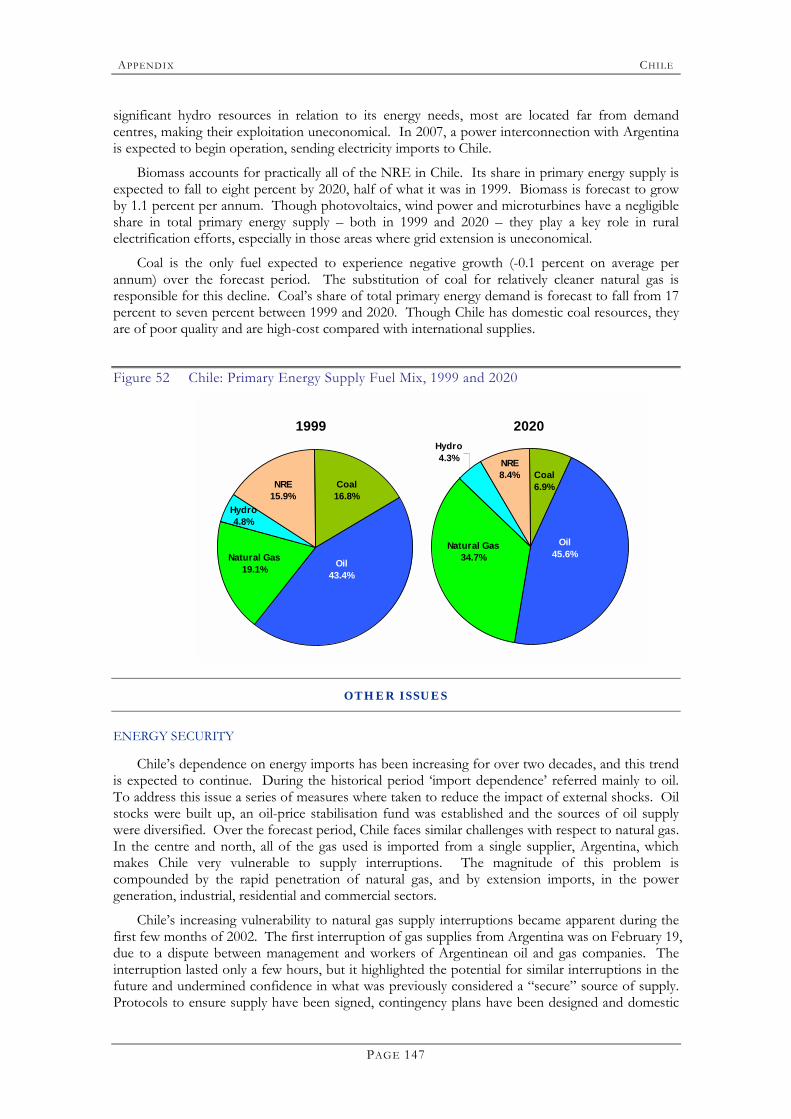
APPENDI X CHILE
PAGE 147
significant hydro resources in relation to its energy needs, most are located far from demand centres, making their exploitation uneconomical. In 2007, a power interconnection with Argentina is expected to begin operation, sending electricity imports to Chile.
Biomass accounts for practically all of the NRE in Chile. Its share in primary energy supply is expected to fall to eight percent by 2020, half of what it was in 1999. Biomass is forecast to grow by 1.1 percent per annum. Though photovoltaics, wind power and microturbines have a negligible share in total primary energy supply � both in 1999 and 2020 � they play a key role in rural electrification efforts, especially in those areas where grid extension is uneconomical.
Coal is the only fuel expected to experience negative growth (-0.1 percent on average per annum) over the forecast period. The substitution of coal for relatively cleaner natural gas is responsible for this decline. Coal�s share of total primary energy demand is forecast to fall from 17 percent to seven percent between 1999 and 2020. Though Chile has domestic coal resources, they are of poor quality and are high-cost compared with international supplies.
Figure 52 Chile: Primary Energy Supply Fuel Mix, 1999 and 2020
1999
Natural Gas19.1%
NRE15.9%
Coal 16.8%
Oil 43.4%
Hydro4.8%
2020
Natural Gas34.7%
NRE8.4% Coal
6.9%
Oil 45.6%
Hydro4.3%
OTHER ISSUES
ENERGY SECURITY
Chile�s dependence on energy imports has been increasing for over two decades, and this trend is expected to continue. During the historical period �import dependence� referred mainly to oil. To address this issue a series of measures where taken to reduce the impact of external shocks. Oil stocks were built up, an oil-price stabilisation fund was established and the sources of oil supply were diversified. Over the forecast period, Chile faces similar challenges with respect to natural gas. In the centre and north, all of the gas used is imported from a single supplier, Argentina, which makes Chile very vulnerable to supply interruptions. The magnitude of this problem is compounded by the rapid penetration of natural gas, and by extension imports, in the power generation, industrial, residential and commercial sectors.
Chile�s increasing vulnerability to natural gas supply interruptions became apparent during the first few months of 2002. The first interruption of gas supplies from Argentina was on February 19, due to a dispute between management and workers of Argentinean oil and gas companies. The interruption lasted only a few hours, but it highlighted the potential for similar interruptions in the future and undermined confidence in what was previously considered a �secure� source of supply. Protocols to ensure supply have been signed, contingency plans have been designed and domestic
APPENDI X CHILE
PAGE 148
short-term backup systems are in place, but a prolonged disruption of supply from Argentina would nevertheless seriously affect the economy. Another important gas-related issue was recently resolved. In March 2002, the Argentinean government withdrew a controversial proposal to impose taxes on gas exports, taxes that where not part of the framework when the gas projects in Chile were approved.
In APERC�s outlook it has been assumed that gas�s share increases sharply during the projection period, reflecting announced proposals. In light of recent events, the Chilean government and private companies may reconsider and possibly scale back their current natural gas use expansion plans. Alternatively, new sources of gas supply could be explored. In addition to short-term problems, long-term Argentinean gas supplies may not be assured, since reserves are finite and because gas exports to Chile could potentially be redirected to more lucrative markets in Argentina or Brazil. In the short term, however, new supply sources seem uneconomic given current excess capacity and inadequate returns on investment in existing pipelines. In the longer term, gas pipelines from Peru and/or Bolivia could become attractive.
ENVIRONMENT
Stricter environmental regulations and mounting public pressure are increasingly shaping energy policy in Chile. The siting and choice of power plant technology as well as the types of fuels consumed by industry have become controversial in recent years. Big hydroelectric projects have faced opposition, especially from indigenous inhabitants and environmental organisations. This has also been the case with combined cycle natural gas plants, especially those constructed in the Santiago Metropolitan Region, where NOx emissions are a problem. In the future, increased electricity imports from neighbouring economies, on top of the ones currently considered, could be part of the strategy adopted by companies to address this situation.
ENERGY EFFICIENCY
Until now, energy efficiency efforts by the government have concentrated mainly on information campaigns and studies. Some isolated actions have been taken by a few energy-intensive industries, most notably by CODELCO, the state-owned copper company. However, studies reveal that significant �no regrets�67 energy efficiency potentials remain untapped in virtually all end-use sectors. The experience of many APEC economies, both developed and developing, shows that decisive action leads to significant reductions in energy consumption, resulting in a win-win situation for companies, the state and consumers.
Chile could benefit from APEC�s experience in this area, reducing its energy supply needs, increasing productivity and efficiency and reducing the environmental impact related to energy production, transport and use.
67 In a �no regrets� policy, benefits exceed costs.
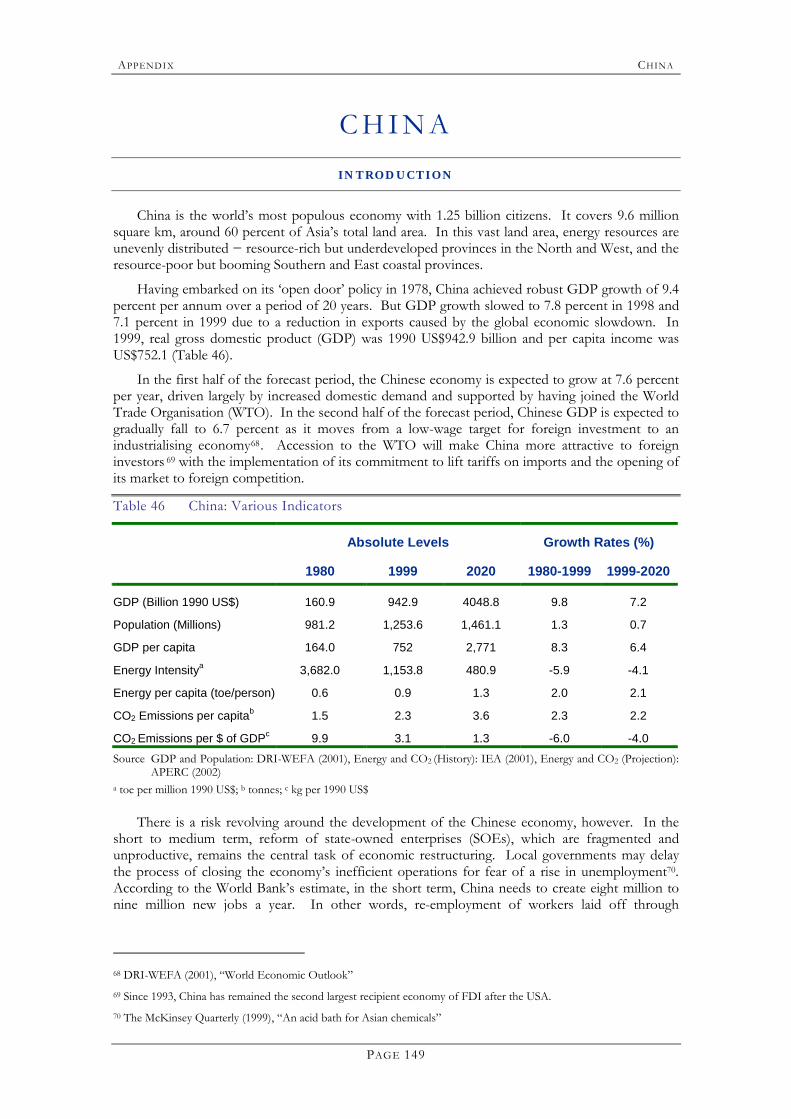
APPENDI X CHINA
PAGE 149
C H I N A INTROD UCTION
China is the world�s most populous economy with 1.25 billion citizens. It covers 9.6 million square km, around 60 percent of Asia�s total land area. In this vast land area, energy resources are unevenly distributed − resource-rich but underdeveloped provinces in the North and West, and the resource-poor but booming Southern and East coastal provinces.
Having embarked on its �open door� policy in 1978, China achieved robust GDP growth of 9.4 percent per annum over a period of 20 years. But GDP growth slowed to 7.8 percent in 1998 and 7.1 percent in 1999 due to a reduction in exports caused by the global economic slowdown. In 1999, real gross domestic product (GDP) was 1990 US$942.9 billion and per capita income was US$752.1 (Table 46).
In the first half of the forecast period, the Chinese economy is expected to grow at 7.6 percent per year, driven largely by increased domestic demand and supported by having joined the World Trade Organisation (WTO). In the second half of the forecast period, Chinese GDP is expected to gradually fall to 6.7 percent as it moves from a low-wage target for foreign investment to an industrialising economy68. Accession to the WTO will make China more attractive to foreign investors 69 with the implementation of its commitment to lift tariffs on imports and the opening of its market to foreign competition.
Table 46 China: Various Indicators
Absolute Levels Growth Rates (%)
1980 1999 2020 1980-1999 1999-2020
GDP (Billion 1990 US$) 160.9 942.9 4048.8 9.8 7.2
Population (Millions) 981.2 1,253.6 1,461.1 1.3 0.7
GDP per capita 164.0 752 2,771 8.3 6.4
Energy Intensitya 3,682.0 1,153.8 480.9 -5.9 -4.1
Energy per capita (toe/person) 0.6 0.9 1.3 2.0 2.1
CO2 Emissions per capitab 1.5 2.3 3.6 2.3 2.2
CO2 Emissions per $ of GDPc 9.9 3.1 1.3 -6.0 -4.0 Source GDP and Population: DRI-WEFA (2001), Energy and CO2 (History): IEA (2001), Energy and CO2 (Projection):
APERC (2002) a toe per million 1990 US$; b tonnes; c kg per 1990 US$
There is a risk revolving around the development of the Chinese economy, however. In the short to medium term, reform of state-owned enterprises (SOEs), which are fragmented and unproductive, remains the central task of economic restructuring. Local governments may delay the process of closing the economy�s inefficient operations for fear of a rise in unemployment70. According to the World Bank�s estimate, in the short term, China needs to create eight million to nine million new jobs a year. In other words, re-employment of workers laid off through
68 DRI-WEFA (2001), �World Economic Outlook� 69 Since 1993, China has remained the second largest recipient economy of FDI after the USA. 70 The McKinsey Quarterly (1999), �An acid bath for Asian chemicals�
APPENDI X CHINA
PAGE 150
restructuring, along with ensuring pensions for the old, is one of the important determinants of economic development in the transition period.
Population growth is projected to be restrained at 0.7 percent per year over the forecast period, compared with the previous two decades of 1.3 percent growth per year. Despite its modest growth rate, by 2020 China�s population will reach over 1.46 billion, comprising 20 percent of the total world population.
SUMMARY OF FORECAST RESULTS
FINAL ENERGY CONSUMPTION
Final energy consumption is expected to grow at 2.7 percent per annum over the forecast period, compared with annual growth in the previous two decades of 2.4 percent. The industrial sector is projected to account for the largest share at 46 percent, followed by residential at 30 percent, transport 15 percent, commercial six percent and others three percent.
Industry Sector
The industry sector will maintain its highest share in final energy demand at 46 percent during the next two decades, growing at 2.7 percent per year. Coal has been the primary source of energy in China�s industrial sector71, though other fuels such as oil and natural gas have nibbled away at its share. Over the forecast period, this trend will continue and is expected to reduce coal�s share in the industrial sector to 46 percent by 2020.
Coal demand by the industrial sector will grow at 1.8 percent per annum over the forecast period, compared with 1.6 percent the previous 20 years. The chemicals, cement, pulp and paper, and iron and steel industries are the main users of coal. The business performance and energy efficiency levels of these industries are expected to improve as a result of consolidation of small-scale producers, lessening coal demand. Fragmented, unproductive and energy-inefficient 72 , Chinese steel producers73 are being pushed to close obsolete plants and upgrade others to meet future growing demand and be competitive against coming multinationals due to the WTO accession. There are examples of consolidation. The Hualing Group in Hunan, for instance, has consolidated four small mills, raising profits and cutting costs.
Industrial oil demand is expected to show 3.3 percent annual growth during the coming two decades. Demand for naphtha as feedstock for ethylene is projected to lead growth in industrial oil demand. Additions to the capacity of ethylene plants are under way, and production is expected to increase from the current 4.42 million tonnes to eight million tonnes by 2010, then to 10 million in 2020. Despite the expansion of capacity, domestic production will meet only half of China�s total demand.
Over the forecast period, natural gas demand is expected grow by 5.3 percent per annum, compared with 3.1 percent in the previous two decades. Despite its relatively fast growth, the share of natural gas in total industrial demand is minuscule at 5.2 percent in 2020, compared with 3.1 percent in 1999. Currently, industrial gas use is limited to fertiliser production, which is heavily subsidised74. In view of future reform of natural gas pricing -- removing subsidies for industrial users -- industrial natural gas penetration is expected to be weak.
71 Share of coal in industry sector stood at 70 percent in 1980, and 56 percent in 1999. 72 In 1999, the Chinese iron and steel industry�s energy intensity was 0.55 toe/ton, while Japan was 0.23 toe/ton and U.S.
0.27 toe/ton. 73 China has the world�s largest market for steel, and the industry that supplies it is now the world�s largest. 74 The price of natural gas for fertiliser use is 0.51-0.63 yuan/m3, while for residential use it is 1.0-2.0 yuan/m3.
APPENDI X CHINA
PAGE 151
Transport Sector
Energy consumption in China�s transport sector is expected to reach 205 Mtoe by 2020, nearly tripling during the forecast period. This is equivalent to an annual average growth rate of 5.3 percent, the second highest among APEC economies after Viet Nam. At this rate, it is expected that China will surpass Japan by 2008 to become APEC�s second-largest consumer of transport energy. Energy consumption in road transport, which is forecast to grow at an average annual rate of 4.9 percent, will account for 55 percent of the incremental demand in the transport sector. Air transport energy consumption is forecast to experience the fastest growth rate among transport modes, with an average of 7.8 percent per annum for the period. Growth in marine transport is also expected to be high at 6.8 percent per annum. Rail transport will show the slowest growth rate of 4.7 percent per annum. During the forecast period, road transport is expected to decrease its share in transport energy consumption from 63 to 58 percent, and rail will decrease from 20 to 18 percent. But marine will rise from 9 to 12 percent, and air transport will increase from seven to 12 percent.
Several factors are expected to shape China�s transport sector during the forecast period. Car ownership is forecast to increase substantially from the level of 1999, which was approximately 10 cars per 1,000 people, one of the lowest in APEC, though public transport will continue to be the dominant mode. Rising personal incomes will be one of the main drivers behind this increase, with per capita GDP, at 1995 purchasing power parity dollars, expected to jump from approximately $3,550 in 1999 to $13,070 by 2020, equivalent to a 6.4 percent average annual increase. In addition, greater competition in the automobile industry, following China�s entry into the WTO, is expected to lower car prices, increase model availability and expand financing alternatives. The increase in car stocks will pose a serious challenge in terms of air pollution, traffic congestion and accidents, as well as the investment requirements in road and fuel supply infrastructure.
China�s increasing participation in world commerce, as well as rising incomes, will be important drivers behind the increase in marine, road freight and air transport energy consumption. China�s airports could become major hubs in Asia.
Environmental protection will be the main driver behind the increase in the number of alternative-fuelled vehicles, especially compressed natural gas buses and taxis in the main cities. Other measures such as emissions and fuel quality regulations will likely shape the composition and characteristics of the gasoline and diesel vehicle stock, as well as influencing refinery infrastructure and processes.
In the rail sector, China will be first in the world to put a magnetic levitation (maglev) train into commercial service, with operations projected to begin in 2003. It will connect Shanghai with its international airport in the Pudong New Area, covering the 30-km distance in just eight minutes at a top speed of 430 km per hour. There are plans to use the same technology to connect Beijing and Shanghai.
Residential and Commercial Sector
China�s ResCom energy demand has relied heavily on coal, which has accounted for roughly 90 percent of total ResCom demand for commercial fuel75 . Since 1996, however, ResCom coal demand has been declining. Over the forecast period, that trend will be maintained, resulting in a large reduction of coal�s share in total ResCom commercial fuels from 50 percent in 1999 to 11 percent in 2020.
Residential use of biomass is still significant in China, accounting for as much as 212 Mtoe in 1999. Driven by urbanisation, demand for biomass will decline at an annual rate of 0.1 percent in 1999-2020.
75 Commercial fuel excludes non-commercial fuel such as biomass.
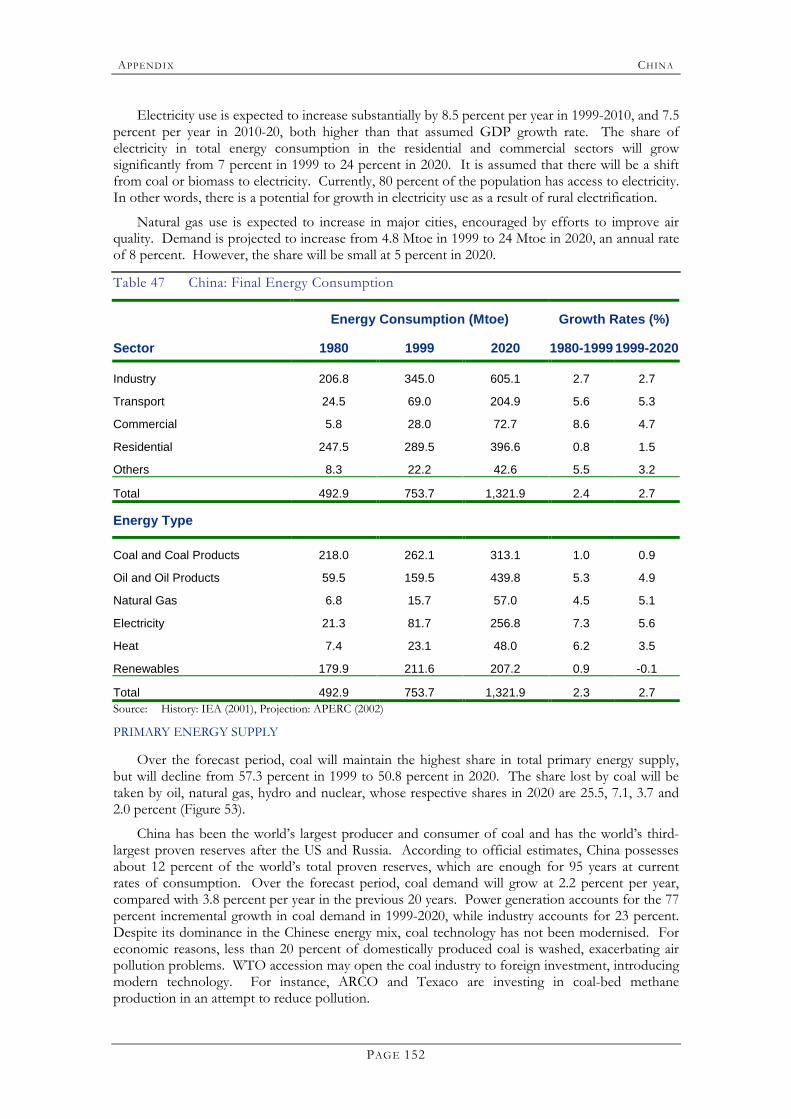
APPENDI X CHINA
PAGE 152
Electricity use is expected to increase substantially by 8.5 percent per year in 1999-2010, and 7.5 percent per year in 2010-20, both higher than that assumed GDP growth rate. The share of electricity in total energy consumption in the residential and commercial sectors will grow significantly from 7 percent in 1999 to 24 percent in 2020. It is assumed that there will be a shift from coal or biomass to electricity. Currently, 80 percent of the population has access to electricity. In other words, there is a potential for growth in electricity use as a result of rural electrification.
Natural gas use is expected to increase in major cities, encouraged by efforts to improve air quality. Demand is projected to increase from 4.8 Mtoe in 1999 to 24 Mtoe in 2020, an annual rate of 8 percent. However, the share will be small at 5 percent in 2020.
Table 47 China: Final Energy Consumption
Energy Consumption (Mtoe) Growth Rates (%)
Sector 1980 1999 2020 1980-1999 1999-2020
Industry 206.8 345.0 605.1 2.7 2.7
Transport 24.5 69.0 204.9 5.6 5.3
Commercial 5.8 28.0 72.7 8.6 4.7
Residential 247.5 289.5 396.6 0.8 1.5
Others 8.3 22.2 42.6 5.5 3.2
Total 492.9 753.7 1,321.9 2.4 2.7
Energy Type
Coal and Coal Products 218.0 262.1 313.1 1.0 0.9
Oil and Oil Products 59.5 159.5 439.8 5.3 4.9
Natural Gas 6.8 15.7 57.0 4.5 5.1
Electricity 21.3 81.7 256.8 7.3 5.6
Heat 7.4 23.1 48.0 6.2 3.5
Renewables 179.9 211.6 207.2 0.9 -0.1
Total 492.9 753.7 1,321.9 2.3 2.7 Source: History: IEA (2001), Projection: APERC (2002)
PRIMARY ENERGY SUPPLY
Over the forecast period, coal will maintain the highest share in total primary energy supply, but will decline from 57.3 percent in 1999 to 50.8 percent in 2020. The share lost by coal will be taken by oil, natural gas, hydro and nuclear, whose respective shares in 2020 are 25.5, 7.1, 3.7 and 2.0 percent (Figure 53).
China has been the world�s largest producer and consumer of coal and has the world�s third-largest proven reserves after the US and Russia. According to official estimates, China possesses about 12 percent of the world�s total proven reserves, which are enough for 95 years at current rates of consumption. Over the forecast period, coal demand will grow at 2.2 percent per year, compared with 3.8 percent per year in the previous 20 years. Power generation accounts for the 77 percent incremental growth in coal demand in 1999-2020, while industry accounts for 23 percent. Despite its dominance in the Chinese energy mix, coal technology has not been modernised. For economic reasons, less than 20 percent of domestically produced coal is washed, exacerbating air pollution problems. WTO accession may open the coal industry to foreign investment, introducing modern technology. For instance, ARCO and Texaco are investing in coal-bed methane production in an attempt to reduce pollution.
APPENDI X CHINA
PAGE 153
During the coming 20 years, oil demand is expected to grow at a yearly rate of 4.3 percent. China, currently the world�s third largest oil consumer after the US and Japan, is projected to overtake Japan in 2007. The transport sector will lead oil demand growth, accounting for 47 percent of incremental growth. Despite China being the world�s fifth-largest oil producer, 30 percent of domestic demand relies on imported crude oil. China became a net oil importer in 1993, and concern about energy security has been looming large since then. APERC�s reference case assumes that oil import dependence will expand to as high as 69 percent by 2020, primarily supplied from the Middle East. Recognising its vulnerability to outside shocks, China has been acquiring stakes in Kazakhstan, Venezuela, Sudan, Iraq, Iran and Peru. Also, China is extending its ties with neighbouring economies such as Indonesia and Russia to establish long-term relationships for securing oil supply. In January 2002, state-owned oil company CNOOC bought Indonesian oil and gas fields from Spanish company Repsol-UPF for $585 million76. Yukos, a Russian state-owned oil company, was scheduled to release a feasibility study on construction of an oil pipeline from Russia to China (Angarsk-Daqing) in July 200277. Including Beijing�s plans to build up strategic petroleum reserves, cooperation with neighbouring economies will be a key to ensuring oil supply security to meet growing future demand.
The Chinese government has set a target to increase the share of natural gas in TPES from the current two percent to 10-15 percent in 2020. Even though it is less than half of the proportion in the US or Europe, there are some impediments to achieving such a target. However, the West-East project (an $18 billion project to link Tarim Basin gas deposits to the coastal city of Shanghai), gas E&D (exploration and development) efforts and environmental considerations will encourage a further shift to using natural gas for power generation. The 2008 Olympics in Beijing will give a significant boost to natural gas consumption in the power sector as well. Taking into account these factors, APERC�s forecast result shows that natural gas�s share is expected to reach seven percent of TPES by 2020. In terms of growth rate, natural gas is projected to increase by 8.3 percent per annum in 1999-2020, after two decades that saw annual growth of 4.2 percent. The power sector contributes 66 percent of incremental growth, compared with industry at 19 percent and residential at 16 percent.
China started nuclear power generation with a 300 MW unit at Quishan in Shejiang province in May 1993. This was followed by two larger 900 MW reactors at Daya Bay in Guangdong province in August 1993. In APERC�s reference case, nuclear power generation is assumed to expand at an annual rate of 11.6 percent in 1999-2020, raising the current installed capacity of 2 GW to 12 GW in 2010 and 20 GW in 202078. In contrast, the government plan assumes installed capacity of 20 GW in 2010 and 40 GW in 2020, which may appear overly optimistic. Nuclear power generation was originally conceived of as a strategic policy response to meet rapidly growing demand in coastal and eastern provinces, which are poorly endowed with resources. However, these densely populated areas will face difficulty in adding further nuclear power capacity. Just as in other places overseas, Guangdong saw a protest against construction of third unit.
China is endowed with the world�s largest hydro potential due to its vast river network. The official estimate of potential hydro resources suggests nearly 380 gigawatts. Over the forecast period, hydro is expected to grow at an annual rate of 6.9 percent, doubling its share in total primary energy supply by 2020. As of 1999, China had 70 GW of installed capacity, accounting for 23.8 percent of total capacity. In the reference case, hydro is expected to expand to 240 GW. The Three Gorges Dam project, the world�s largest hydroelectric project, is scheduled for completion in 2009, providing a capacity of 18.2 GW. Plans were announced in March 2002 to reorganise the Three Gorges project into the China Three Gorges Electric Power Corporation79. The first task of
76 International Herald Tribune (2002) 77 Interfax News Agency, Investment Report, 28th June, 2002 78 Several nuclear projects are under construction involving project developers from Russia, France and Canada. 79 US DOE (2002)
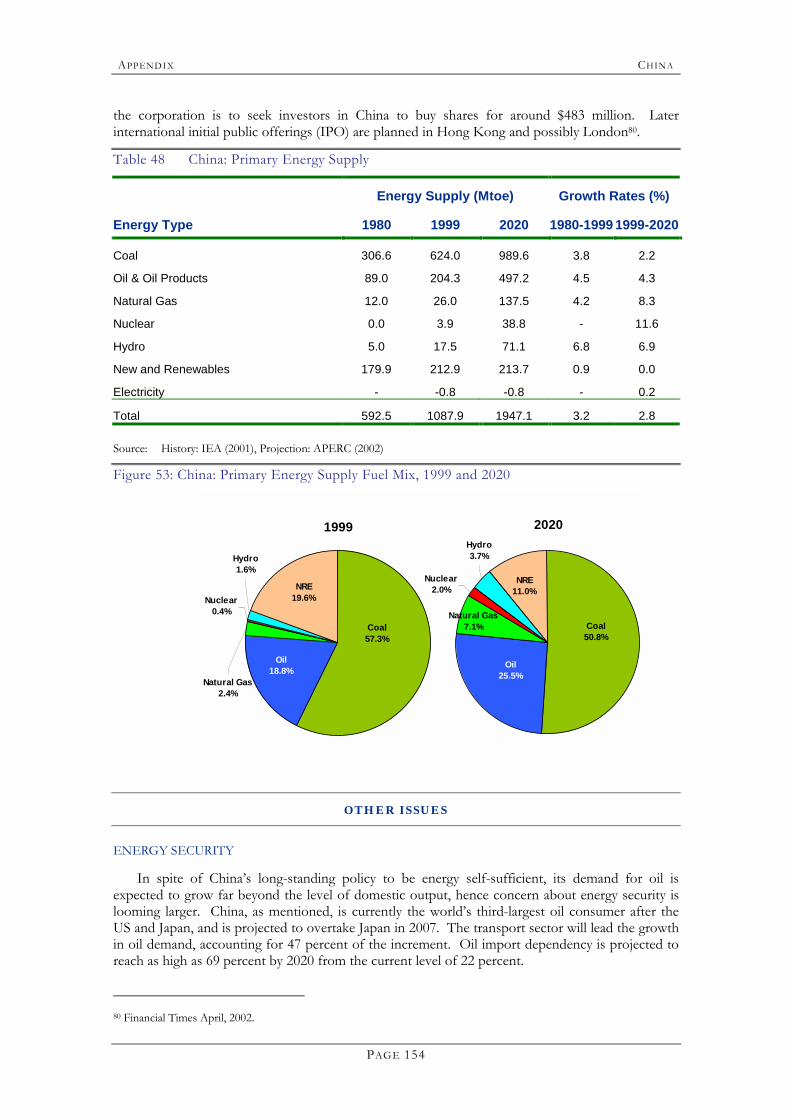
APPENDI X CHINA
PAGE 154
the corporation is to seek investors in China to buy shares for around $483 million. Later international initial public offerings (IPO) are planned in Hong Kong and possibly London80.
Table 48 China: Primary Energy Supply
Energy Supply (Mtoe) Growth Rates (%)
Energy Type 1980 1999 2020 1980-1999 1999-2020
Coal 306.6 624.0 989.6 3.8 2.2
Oil & Oil Products 89.0 204.3 497.2 4.5 4.3
Natural Gas 12.0 26.0 137.5 4.2 8.3
Nuclear 0.0 3.9 38.8 - 11.6
Hydro 5.0 17.5 71.1 6.8 6.9
New and Renewables 179.9 212.9 213.7 0.9 0.0
Electricity - -0.8 -0.8 - 0.2
Total 592.5 1087.9 1947.1 3.2 2.8 Source: History: IEA (2001), Projection: APERC (2002)
Figure 53: China: Primary Energy Supply Fuel Mix, 1999 and 2020
1999
Natural Gas2.4%
NRE19.6%
Coal 57.3%
Oil 18.8%
Nuclear0.4%
Hydro1.6%
2020
Natural Gas7.1%
NRE11.0%
Coal 50.8%
Oil 25.5%
Nuclear2.0%
Hydro3.7%
OTHER ISSUES
ENERGY SECURITY
In spite of China�s long-standing policy to be energy self-sufficient, its demand for oil is expected to grow far beyond the level of domestic output, hence concern about energy security is looming larger. China, as mentioned, is currently the world�s third-largest oil consumer after the US and Japan, and is projected to overtake Japan in 2007. The transport sector will lead the growth in oil demand, accounting for 47 percent of the increment. Oil import dependency is projected to reach as high as 69 percent by 2020 from the current level of 22 percent.
80 Financial Times April, 2002.
APPENDI X CHINA
PAGE 155
Recognising the vulnerability of energy supply structures to outside shocks, China has been intensifying efforts to enhance the security of its energy supply. Offshore exploration is a priority, mostly concentrated in the Bohai Sea east of the northern port city of Tianjin. Also, efforts to recover resources in the Ordos Basin are being intensified. The West-East project is supported by the Chinese government�s policy to enhance energy security by shifting energy demand towards natural gas. Regional cooperation to establish joint stockpiling will help enhance energy security.
MARKET REFORM
The pace and scope of developments to boost energy security will depend on the success of market reforms on the following points: (1) Reform of state-owned enterprises, (2) Reform of pricing, and (3) Reform of investment legislation.
Reform of state-owned enterprises
In 1998, China underwent a drastic restructuring of state-owned oil and gas assets to make them into two vertically integrated firms, namely the China National Petroleum Corporation (CNPC) and the China Petrochemical Corporation (Sinopec). Prior to the restructuring, these two companies were divided on the basis of function: CNPC specialised in oil and gas exploration, while Sinopec was engaged in refining and distribution. In 1998, the government ordered an asset swap between these two companies, which are divided on the basis of geography: CNPC is focused in the north and west, and Sinopec is focused in the south.
As a part of the restructuring of state-owned enterprises, the government has offered foreign investors the chance to buy shares in these companies. CNPC has established a subsidiary, PetroChina Company Limited. In April 2000, PetroChina made a successful IPO (initial public offering) of its shares in both Hong Kong and New York and attracted funds totalling US$2.9 billion. Sinopec has established a subsidiary called the China Petrochemical Corporation. On 19 October 2000, the China Petrochemical Corporation was listed on the Hong Kong, New York and London stock exchanges, the first Chinese enterprise to be listed on three overseas markets simultaneously. CNOOC Ltd, a subsidiary of China�s third-largest oil company, CNOOC (the China National Offshore Oil Corporation), specialising in managing offshore exploration and production, was listed on the New York stock exchange on 27 February 2001 and on the Hong Kong exchange on 28 February 2001.
Reform of pricing: Oil and Natural Gas
Prices of crude oil and petroleum products had been centrally controlled to protect domestic oil companies, namely CNPC, Sinopec and CNOOC. However, after China became a net importer in 1993, oil industries were faced with more complex realities and came under pressure to change the pricing system. Due to the low oil prices of the mid-1990s, CNPC and Sinopec lost a large amount of market share to the rising imports of crude oil. Consequently, in 1998 the Chinese government ended the centrally controlled pricing system. Currently, prices of both crude oil and petroleum products are determined based on those in the Singapore market. CNPC and Sinopec determine the prices of domestic crude oil and petroleum products based on the reference price in Singapore.
The use of natural gas in China is currently limited to fertiliser production, with heavy government subsidies. In the past there was no uniform pricing system for natural gas, limiting incentives for foreign investment in large projects. In an attempt to make the system more transparent and to encourage foreign investment to help raise the huge amount of capital needed for large-scale projects such as the West-East project and the Guandong LNG project, the government reformed the pricing system for new supply and pipeline projects. The new system of pricing is based on explicit cost and profit assumptions, allowing 12 percent of IRR (internal rates of return) in an attempt to reflect the true cost of projects.

APPENDI X CHINA
PAGE 156
Foreign investment legislation
Since 1993, China has been the world�s second-largest recipient of foreign direct investment after the USA. Foreign investment has been an essential vehicle for the growth of the Chinese economy. In relation to the energy sector, China has been successful in attracting foreign investment for both onshore and offshore projects. As of 1999, over 130 contracts and agreements worth roughly $5.5 billion had been signed. In contrast, FDI is prohibited for use in construction and management of electricity and gas and supply networks in the Catalogue of Industries for Guiding Overseas Investment.
Recognising the importance of foreign direct investment, China has been making efforts to improve its investment climate. These include harmonisation of provisions in the Chinese Foreign Investment Laws with other economic and commercial laws81. Also, there have been efforts to bring outdated legislation into line with current practice.
81 Zeng Huaqun (1998), �Chinese Foreign Investment Laws: Recent Developments towards a Market Economy�
APPENDI X HON G KONG, CHINA
PAGE 157
H O N G KO N G, C H I N A INTROD UCTION
Hong Kong, China, is a city-economy with a population of 6.7 million people (1999), located on the coast of southern China. Since 1997, it has been a Special Administrative Region (SAR) of the People�s Republic of China.
Hong Kong, China, is a modern economy with a high per capita GDP that in 1999 amounted to 1990 US$15,451. The service sector is responsible for 85 percent of GDP. The process of economic adjustment has resulted in a significant increase in trading and financial and other service activities. Hong Kong, China, is a principal service centre both in the Asia-Pacific region and globally.
Hong Kong, China, grew rapidly by 6.0 percent per annum between 1980 and 1997. GDP fell by 5.3 percent in 1998 due to the Asian financial crisis and only recovered in 2000, driven by strong growth in both domestic and international markets.
All energy consumed in Hong Kong, China, is imported as the city is completely without indigenous oil, gas or coal resources.
Table 49 Hong Kong, China: Various Indicators
Absolute Levels Growth Rates (%)
1980 1999 2020 1980-1999 1999-2020
GDP (Billion 1990 US$) 39.7 103.8 256.0 5.2 4.4
Population (Millions) 5.1 6.7 7.9 1.5 0.8
GDP per capita 7852 15,451 32,286 3.6 3.6
Energy Intensitya 137.6 172.2 152.0 1.2 -0.6
Energy per capita (toe/person) 1.1 2.7 4.9 4.9 3.0
CO2 Emissions per capitab 3.4 7.7 13.9 4.4 2.8
CO2 Emissions per $ of GDPc 0.44 0.50 0.43 0.7 -0.7 Source GDP and Population: DRI-WEFA (2001), Energy and CO2 (History): IEA (2001), Energy and CO2 (Projection):
APERC (2002) a toe per million 1990 US$; b tonnes; c kg per 1990 US$
SUMMARY OF FORECAST RESULTS
For the projection period in the reference case, the GDP growth rate in Hong Kong, China, stays relatively high at 4.4 percent per annum, although somewhat slower than the average of 5.2 percent per annum experienced between 1980 and 1999.
FINAL ENERGY CONSUMPTION
The transport sector dominates final energy consumption, holding a 58 percent share of demand in 2020, up slightly from 57 percent in 1999. By 2020, the commercial sector (18 percent) is expected to surpass industry (14 percent) as the second-largest final energy user.
The main energy sources are oil and electricity. Oil product demand is projected to grow more slowly than that for electricity during the forecast period, and its resulting share falls from 77.5
APPENDI X HON G KONG, CHINA
PAGE 158
percent in 1999 to 74 percent in 2020. With a growth rate of 4.7 percent per annum over the forecast period, electricity�s share increases from 22 percent in 1999 to 25 percent by 2020.
Table 50 Hong Kong, China: Final Energy Consumption
Energy Consumption (Mtoe) Growth Rates (%)
Sector 1980 1999 2020 1980-1999 1999-2020
Industry 1.1 2.3 4.5 4.2 3.2
Transport 1.6 7.8 18.1 8.6 4.1
Commercial 0.5 2.3 5.6 7.9 4.4
Residential 0.4 1.1 2.7 5.2 4.3
Others 0.1 0.2 0.2 3.2 1.4
Total 3.7 13.6 31.1 7.1 4.0
Energy Type
Coal and Coal Products 0.0 - - - -
Oil and Oil Products 2.7 10.6 23.0 7.6 3.8
Natural Gas 0.1 0.0 0.1 -6.8 5.1
Electricity 0.9 3.0 7.9 6.3 4.7
Renewables 0.1 0.1 0.0 0.2 -0.8
Total 3.7 13.6 31.1 7.1 4.0 Source History: IEA (2001), Projection: APERC (2002)
PRIMARY ENERGY SUPPLY
The reference case projects that primary energy supply will grow by four percent per annum to 2020, which is slower than in 1980-99, when it grew by 6.2 percent per year. Coal�s share falls significantly from 23 percent in 1999 to three percent in 2020. Coal is being displaced by relatively cleaner natural gas for electricity generation.
Table 51 Hong Kong, China: Primary Energy Supply
Energy Supply (Mtoe) Growth Rates (%)
Energy Type 1980 1999 2020 1980-1999 1999-2020
Coal 0.0 3.9 1.1 - -5.7
Oil & Oil Products 5.4 11.2 23.9 3.9 3.7
Natural Gas 0.0 1.9 13.0 - 9.7
Nuclear 0.0 0.0 0.0 - -
Hydro 0.0 0.0 0.0 - -
New and Renewables 0.1 0.1 0.1 0.2 1.0
Electricity - 0.8 0.8 - -
Total 5.5 17.9 38.9 6.2 3.9 Source History: IEA (2001), Projection: APERC (2002)
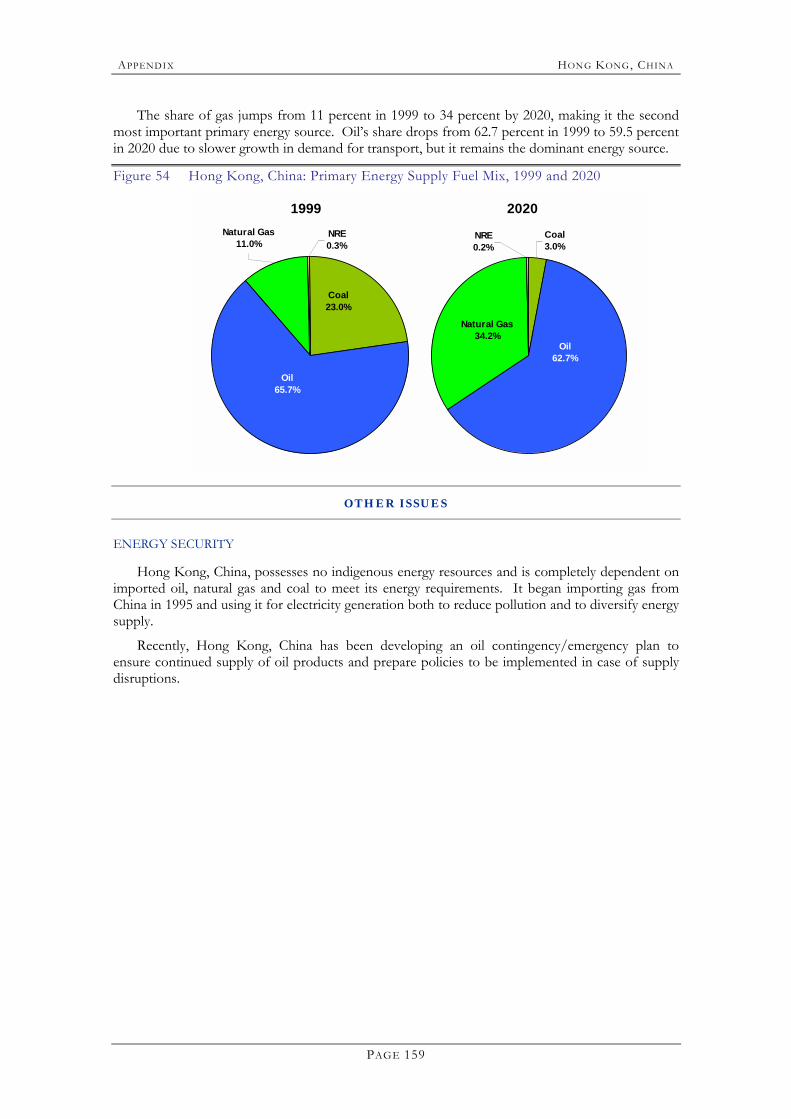
APPENDI X HON G KONG, CHINA
PAGE 159
The share of gas jumps from 11 percent in 1999 to 34 percent by 2020, making it the second most important primary energy source. Oil�s share drops from 62.7 percent in 1999 to 59.5 percent in 2020 due to slower growth in demand for transport, but it remains the dominant energy source.
Figure 54 Hong Kong, China: Primary Energy Supply Fuel Mix, 1999 and 2020
1999
Oil 65.7%
Coal 23.0%
NRE0.3%
Natural Gas11.0%
2020
Oil 62.7%
Natural Gas34.2%
NRE0.2%
Coal 3.0%
OTHER ISSUES
ENERGY SECURITY
Hong Kong, China, possesses no indigenous energy resources and is completely dependent on imported oil, natural gas and coal to meet its energy requirements. It began importing gas from China in 1995 and using it for electricity generation both to reduce pollution and to diversify energy supply.
Recently, Hong Kong, China has been developing an oil contingency/emergency plan to ensure continued supply of oil products and prepare policies to be implemented in case of supply disruptions.

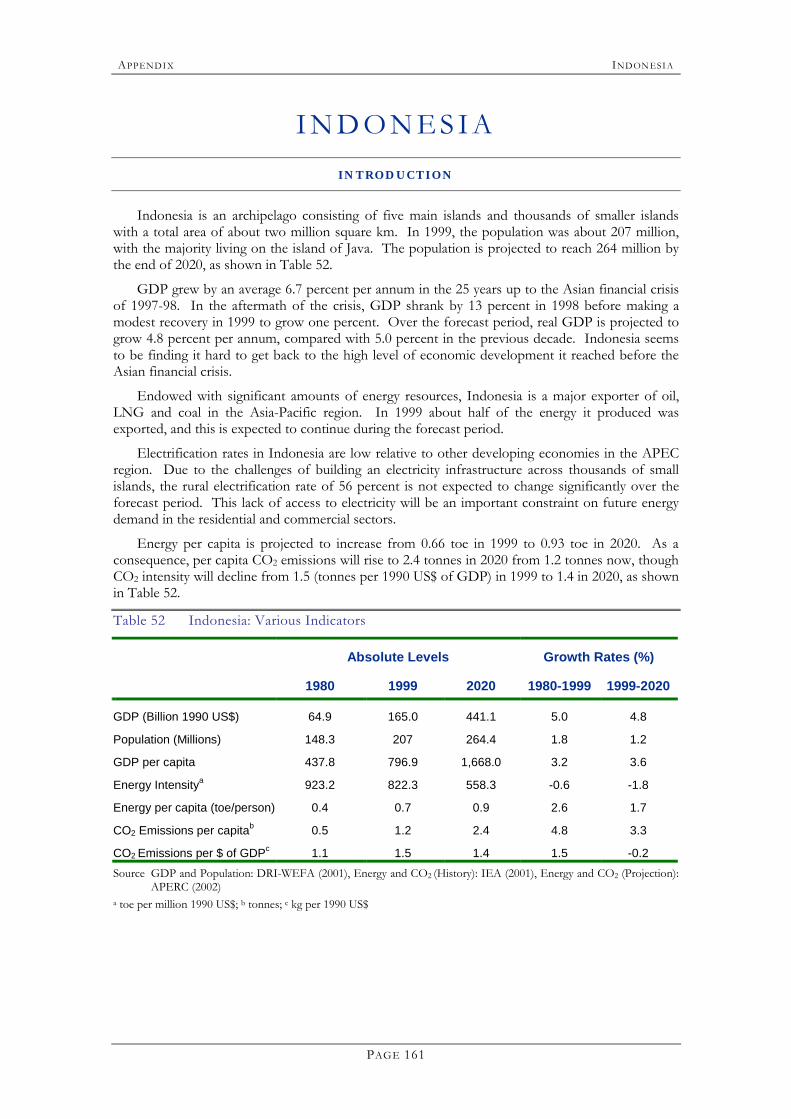
APPENDI X INDON ESI A
PAGE 161
I N D O N E S I A INTROD UCTION
Indonesia is an archipelago consisting of five main islands and thousands of smaller islands with a total area of about two million square km. In 1999, the population was about 207 million, with the majority living on the island of Java. The population is projected to reach 264 million by the end of 2020, as shown in Table 52.
GDP grew by an average 6.7 percent per annum in the 25 years up to the Asian financial crisis of 1997-98. In the aftermath of the crisis, GDP shrank by 13 percent in 1998 before making a modest recovery in 1999 to grow one percent. Over the forecast period, real GDP is projected to grow 4.8 percent per annum, compared with 5.0 percent in the previous decade. Indonesia seems to be finding it hard to get back to the high level of economic development it reached before the Asian financial crisis.
Endowed with significant amounts of energy resources, Indonesia is a major exporter of oil, LNG and coal in the Asia-Pacific region. In 1999 about half of the energy it produced was exported, and this is expected to continue during the forecast period.
Electrification rates in Indonesia are low relative to other developing economies in the APEC region. Due to the challenges of building an electricity infrastructure across thousands of small islands, the rural electrification rate of 56 percent is not expected to change significantly over the forecast period. This lack of access to electricity will be an important constraint on future energy demand in the residential and commercial sectors.
Energy per capita is projected to increase from 0.66 toe in 1999 to 0.93 toe in 2020. As a consequence, per capita CO2 emissions will rise to 2.4 tonnes in 2020 from 1.2 tonnes now, though CO2 intensity will decline from 1.5 (tonnes per 1990 US$ of GDP) in 1999 to 1.4 in 2020, as shown in Table 52.
Table 52 Indonesia: Various Indicators
Absolute Levels Growth Rates (%)
1980 1999 2020 1980-1999 1999-2020
GDP (Billion 1990 US$) 64.9 165.0 441.1 5.0 4.8
Population (Millions) 148.3 207 264.4 1.8 1.2
GDP per capita 437.8 796.9 1,668.0 3.2 3.6
Energy Intensitya 923.2 822.3 558.3 -0.6 -1.8
Energy per capita (toe/person) 0.4 0.7 0.9 2.6 1.7
CO2 Emissions per capitab 0.5 1.2 2.4 4.8 3.3
CO2 Emissions per $ of GDPc 1.1 1.5 1.4 1.5 -0.2 Source GDP and Population: DRI-WEFA (2001), Energy and CO2 (History): IEA (2001), Energy and CO2 (Projection):
APERC (2002) a toe per million 1990 US$; b tonnes; c kg per 1990 US$
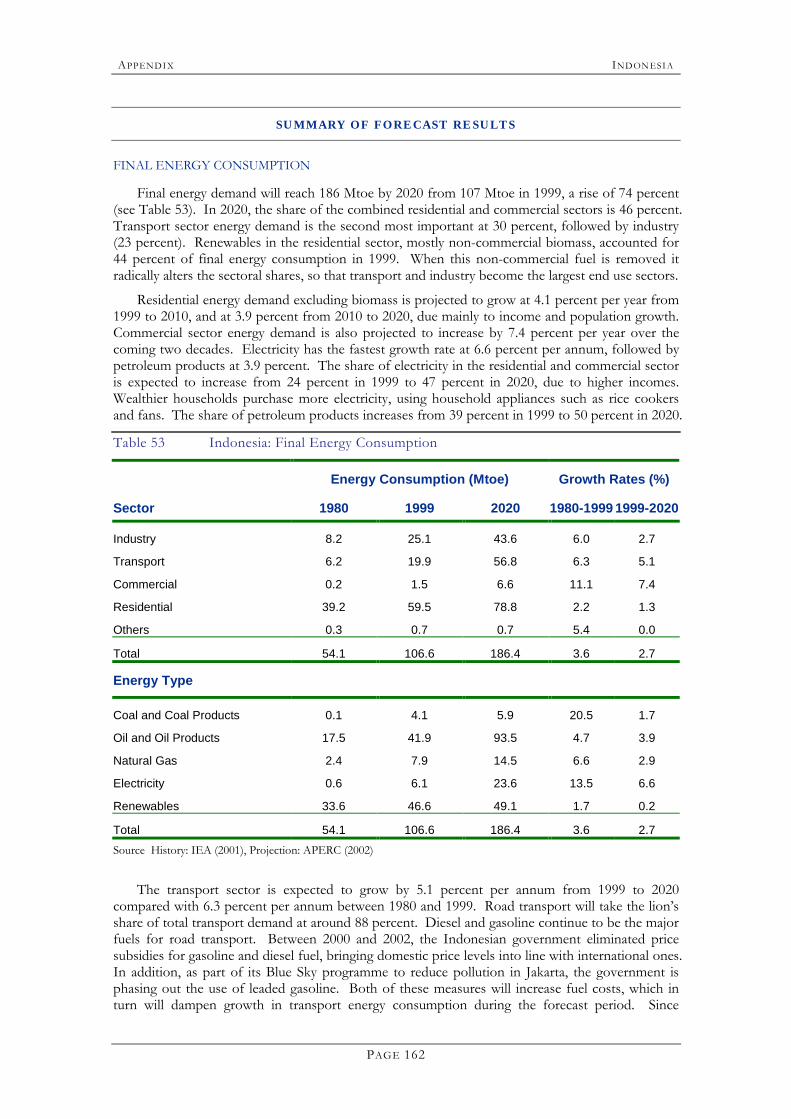
APPENDI X INDON ESI A
PAGE 162
SUMMARY OF FORECAST RESULTS
FINAL ENERGY CONSUMPTION
Final energy demand will reach 186 Mtoe by 2020 from 107 Mtoe in 1999, a rise of 74 percent (see Table 53). In 2020, the share of the combined residential and commercial sectors is 46 percent. Transport sector energy demand is the second most important at 30 percent, followed by industry (23 percent). Renewables in the residential sector, mostly non-commercial biomass, accounted for 44 percent of final energy consumption in 1999. When this non-commercial fuel is removed it radically alters the sectoral shares, so that transport and industry become the largest end use sectors.
Residential energy demand excluding biomass is projected to grow at 4.1 percent per year from 1999 to 2010, and at 3.9 percent from 2010 to 2020, due mainly to income and population growth. Commercial sector energy demand is also projected to increase by 7.4 percent per year over the coming two decades. Electricity has the fastest growth rate at 6.6 percent per annum, followed by petroleum products at 3.9 percent. The share of electricity in the residential and commercial sector is expected to increase from 24 percent in 1999 to 47 percent in 2020, due to higher incomes. Wealthier households purchase more electricity, using household appliances such as rice cookers and fans. The share of petroleum products increases from 39 percent in 1999 to 50 percent in 2020.
Table 53 Indonesia: Final Energy Consumption
Energy Consumption (Mtoe) Growth Rates (%)
Sector 1980 1999 2020 1980-1999 1999-2020
Industry 8.2 25.1 43.6 6.0 2.7
Transport 6.2 19.9 56.8 6.3 5.1
Commercial 0.2 1.5 6.6 11.1 7.4
Residential 39.2 59.5 78.8 2.2 1.3
Others 0.3 0.7 0.7 5.4 0.0
Total 54.1 106.6 186.4 3.6 2.7
Energy Type
Coal and Coal Products 0.1 4.1 5.9 20.5 1.7
Oil and Oil Products 17.5 41.9 93.5 4.7 3.9
Natural Gas 2.4 7.9 14.5 6.6 2.9
Electricity 0.6 6.1 23.6 13.5 6.6
Renewables 33.6 46.6 49.1 1.7 0.2
Total 54.1 106.6 186.4 3.6 2.7 Source History: IEA (2001), Projection: APERC (2002)
The transport sector is expected to grow by 5.1 percent per annum from 1999 to 2020 compared with 6.3 percent per annum between 1980 and 1999. Road transport will take the lion�s share of total transport demand at around 88 percent. Diesel and gasoline continue to be the major fuels for road transport. Between 2000 and 2002, the Indonesian government eliminated price subsidies for gasoline and diesel fuel, bringing domestic price levels into line with international ones. In addition, as part of its Blue Sky programme to reduce pollution in Jakarta, the government is phasing out the use of leaded gasoline. Both of these measures will increase fuel costs, which in turn will dampen growth in transport energy consumption during the forecast period. Since
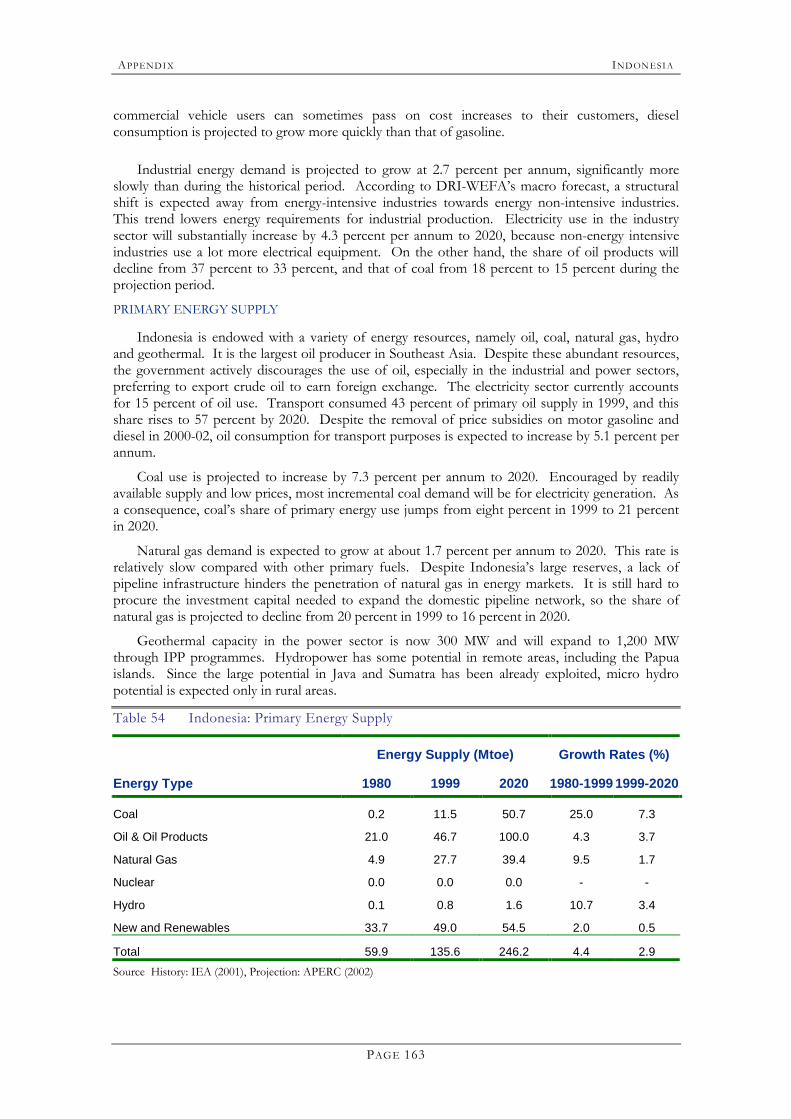
APPENDI X INDON ESI A
PAGE 163
commercial vehicle users can sometimes pass on cost increases to their customers, diesel consumption is projected to grow more quickly than that of gasoline.
Industrial energy demand is projected to grow at 2.7 percent per annum, significantly more slowly than during the historical period. According to DRI-WEFA�s macro forecast, a structural shift is expected away from energy-intensive industries towards energy non-intensive industries. This trend lowers energy requirements for industrial production. Electricity use in the industry sector will substantially increase by 4.3 percent per annum to 2020, because non-energy intensive industries use a lot more electrical equipment. On the other hand, the share of oil products will decline from 37 percent to 33 percent, and that of coal from 18 percent to 15 percent during the projection period.
PRIMARY ENERGY SUPPLY
Indonesia is endowed with a variety of energy resources, namely oil, coal, natural gas, hydro and geothermal. It is the largest oil producer in Southeast Asia. Despite these abundant resources, the government actively discourages the use of oil, especially in the industrial and power sectors, preferring to export crude oil to earn foreign exchange. The electricity sector currently accounts for 15 percent of oil use. Transport consumed 43 percent of primary oil supply in 1999, and this share rises to 57 percent by 2020. Despite the removal of price subsidies on motor gasoline and diesel in 2000-02, oil consumption for transport purposes is expected to increase by 5.1 percent per annum.
Coal use is projected to increase by 7.3 percent per annum to 2020. Encouraged by readily available supply and low prices, most incremental coal demand will be for electricity generation. As a consequence, coal�s share of primary energy use jumps from eight percent in 1999 to 21 percent in 2020.
Natural gas demand is expected to grow at about 1.7 percent per annum to 2020. This rate is relatively slow compared with other primary fuels. Despite Indonesia�s large reserves, a lack of pipeline infrastructure hinders the penetration of natural gas in energy markets. It is still hard to procure the investment capital needed to expand the domestic pipeline network, so the share of natural gas is projected to decline from 20 percent in 1999 to 16 percent in 2020.
Geothermal capacity in the power sector is now 300 MW and will expand to 1,200 MW through IPP programmes. Hydropower has some potential in remote areas, including the Papua islands. Since the large potential in Java and Sumatra has been already exploited, micro hydro potential is expected only in rural areas.
Table 54 Indonesia: Primary Energy Supply
Energy Supply (Mtoe) Growth Rates (%)
Energy Type 1980 1999 2020 1980-1999 1999-2020
Coal 0.2 11.5 50.7 25.0 7.3
Oil & Oil Products 21.0 46.7 100.0 4.3 3.7
Natural Gas 4.9 27.7 39.4 9.5 1.7
Nuclear 0.0 0.0 0.0 - -
Hydro 0.1 0.8 1.6 10.7 3.4
New and Renewables 33.7 49.0 54.5 2.0 0.5
Total 59.9 135.6 246.2 4.4 2.9 Source History: IEA (2001), Projection: APERC (2002)
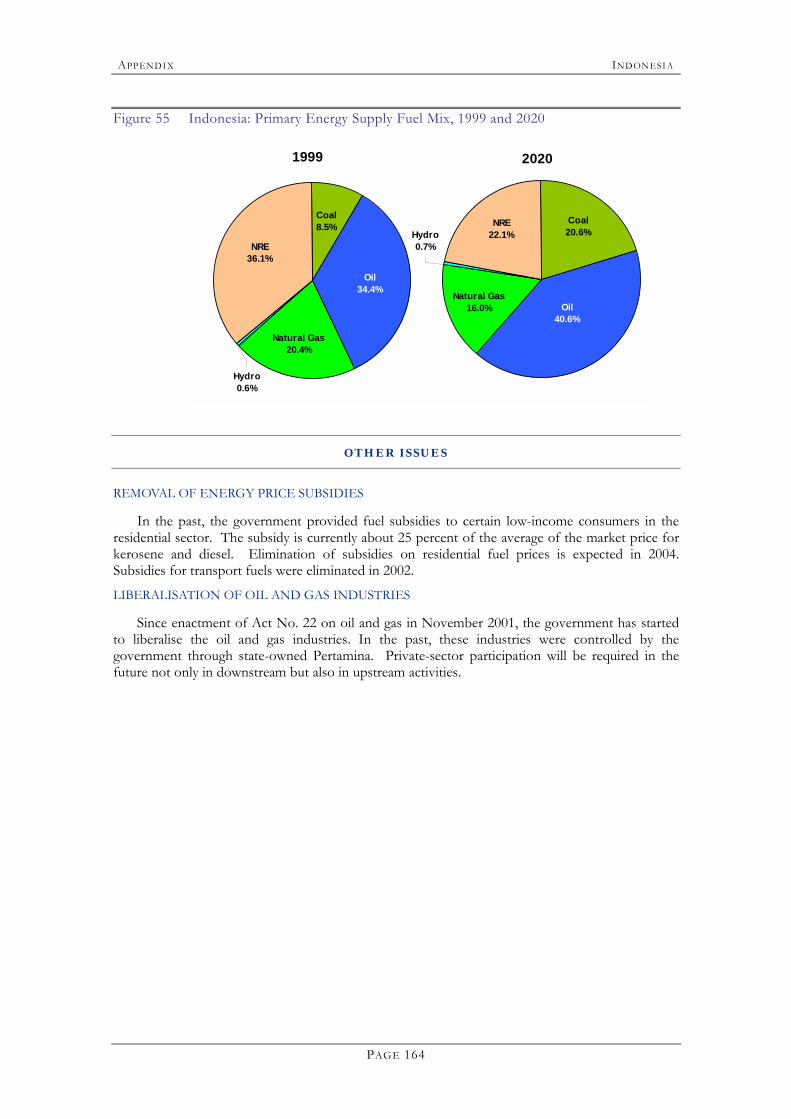
APPENDI X INDON ESI A
PAGE 164
Figure 55 Indonesia: Primary Energy Supply Fuel Mix, 1999 and 2020
1999
Natural Gas20.4%
NRE36.1%
Coal 8.5%
Oil 34.4%
Hydro0.6%
2020
Hydro0.7%
Oil 40.6%
Coal 20.6%
NRE22.1%
Natural Gas16.0%
OTHER ISSUES
REMOVAL OF ENERGY PRICE SUBSIDIES
In the past, the government provided fuel subsidies to certain low-income consumers in the residential sector. The subsidy is currently about 25 percent of the average of the market price for kerosene and diesel. Elimination of subsidies on residential fuel prices is expected in 2004. Subsidies for transport fuels were eliminated in 2002.
LIBERALISATION OF OIL AND GAS INDUSTRIES
Since enactment of Act No. 22 on oil and gas in November 2001, the government has started to liberalise the oil and gas industries. In the past, these industries were controlled by the government through state-owned Pertamina. Private-sector participation will be required in the future not only in downstream but also in upstream activities.
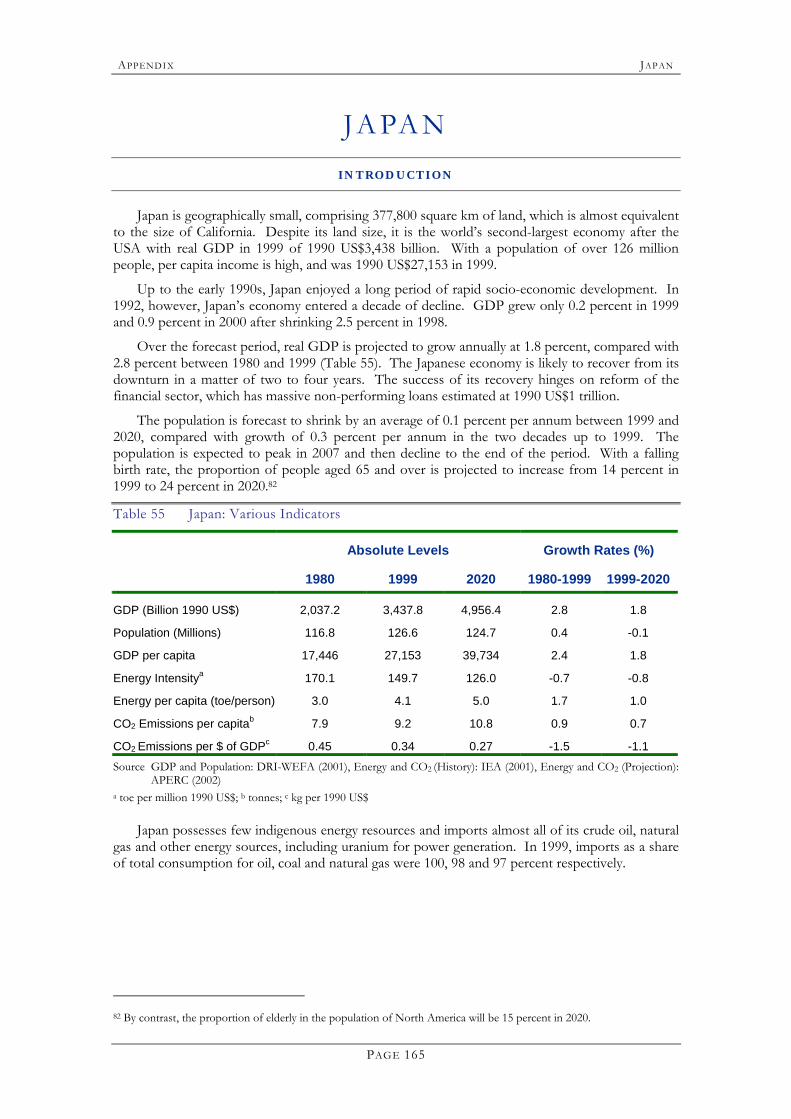
APPENDI X JAP AN
PAGE 165
JA PA N INTROD UCTION
Japan is geographically small, comprising 377,800 square km of land, which is almost equivalent to the size of California. Despite its land size, it is the world�s second-largest economy after the USA with real GDP in 1999 of 1990 US$3,438 billion. With a population of over 126 million people, per capita income is high, and was 1990 US$27,153 in 1999.
Up to the early 1990s, Japan enjoyed a long period of rapid socio-economic development. In 1992, however, Japan�s economy entered a decade of decline. GDP grew only 0.2 percent in 1999 and 0.9 percent in 2000 after shrinking 2.5 percent in 1998.
Over the forecast period, real GDP is projected to grow annually at 1.8 percent, compared with 2.8 percent between 1980 and 1999 (Table 55). The Japanese economy is likely to recover from its downturn in a matter of two to four years. The success of its recovery hinges on reform of the financial sector, which has massive non-performing loans estimated at 1990 US$1 trillion.
The population is forecast to shrink by an average of 0.1 percent per annum between 1999 and 2020, compared with growth of 0.3 percent per annum in the two decades up to 1999. The population is expected to peak in 2007 and then decline to the end of the period. With a falling birth rate, the proportion of people aged 65 and over is projected to increase from 14 percent in 1999 to 24 percent in 2020.82
Table 55 Japan: Various Indicators
Absolute Levels Growth Rates (%)
1980 1999 2020 1980-1999 1999-2020
GDP (Billion 1990 US$) 2,037.2 3,437.8 4,956.4 2.8 1.8
Population (Millions) 116.8 126.6 124.7 0.4 -0.1
GDP per capita 17,446 27,153 39,734 2.4 1.8
Energy Intensitya 170.1 149.7 126.0 -0.7 -0.8
Energy per capita (toe/person) 3.0 4.1 5.0 1.7 1.0
CO2 Emissions per capitab 7.9 9.2 10.8 0.9 0.7
CO2 Emissions per $ of GDPc 0.45 0.34 0.27 -1.5 -1.1 Source GDP and Population: DRI-WEFA (2001), Energy and CO2 (History): IEA (2001), Energy and CO2 (Projection):
APERC (2002) a toe per million 1990 US$; b tonnes; c kg per 1990 US$
Japan possesses few indigenous energy resources and imports almost all of its crude oil, natural gas and other energy sources, including uranium for power generation. In 1999, imports as a share of total consumption for oil, coal and natural gas were 100, 98 and 97 percent respectively.
82 By contrast, the proportion of elderly in the population of North America will be 15 percent in 2020.
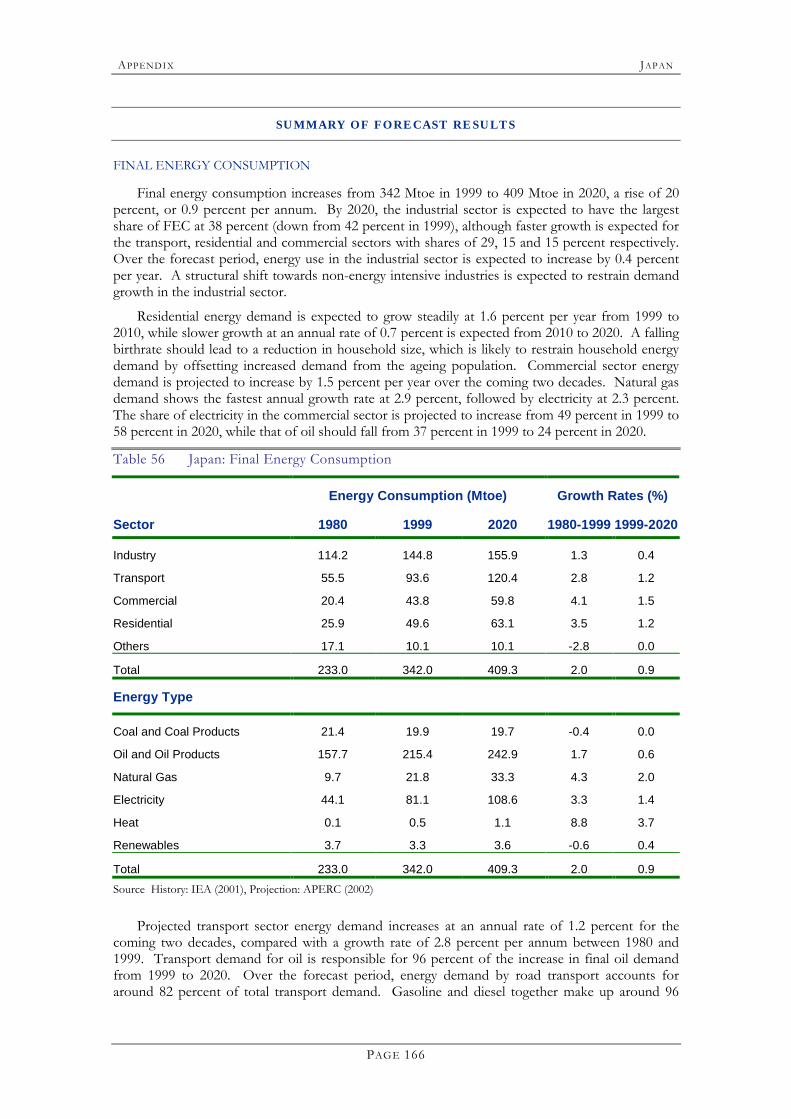
APPENDI X JAP AN
PAGE 166
SUMMARY OF FORECAST RESULTS
FINAL ENERGY CONSUMPTION
Final energy consumption increases from 342 Mtoe in 1999 to 409 Mtoe in 2020, a rise of 20 percent, or 0.9 percent per annum. By 2020, the industrial sector is expected to have the largest share of FEC at 38 percent (down from 42 percent in 1999), although faster growth is expected for the transport, residential and commercial sectors with shares of 29, 15 and 15 percent respectively. Over the forecast period, energy use in the industrial sector is expected to increase by 0.4 percent per year. A structural shift towards non-energy intensive industries is expected to restrain demand growth in the industrial sector.
Residential energy demand is expected to grow steadily at 1.6 percent per year from 1999 to 2010, while slower growth at an annual rate of 0.7 percent is expected from 2010 to 2020. A falling birthrate should lead to a reduction in household size, which is likely to restrain household energy demand by offsetting increased demand from the ageing population. Commercial sector energy demand is projected to increase by 1.5 percent per year over the coming two decades. Natural gas demand shows the fastest annual growth rate at 2.9 percent, followed by electricity at 2.3 percent. The share of electricity in the commercial sector is projected to increase from 49 percent in 1999 to 58 percent in 2020, while that of oil should fall from 37 percent in 1999 to 24 percent in 2020.
Table 56 Japan: Final Energy Consumption
Energy Consumption (Mtoe) Growth Rates (%)
Sector 1980 1999 2020 1980-1999 1999-2020
Industry 114.2 144.8 155.9 1.3 0.4
Transport 55.5 93.6 120.4 2.8 1.2
Commercial 20.4 43.8 59.8 4.1 1.5
Residential 25.9 49.6 63.1 3.5 1.2
Others 17.1 10.1 10.1 -2.8 0.0
Total 233.0 342.0 409.3 2.0 0.9
Energy Type
Coal and Coal Products 21.4 19.9 19.7 -0.4 0.0
Oil and Oil Products 157.7 215.4 242.9 1.7 0.6
Natural Gas 9.7 21.8 33.3 4.3 2.0
Electricity 44.1 81.1 108.6 3.3 1.4
Heat 0.1 0.5 1.1 8.8 3.7
Renewables 3.7 3.3 3.6 -0.6 0.4
Total 233.0 342.0 409.3 2.0 0.9 Source History: IEA (2001), Projection: APERC (2002)
Projected transport sector energy demand increases at an annual rate of 1.2 percent for the coming two decades, compared with a growth rate of 2.8 percent per annum between 1980 and 1999. Transport demand for oil is responsible for 96 percent of the increase in final oil demand from 1999 to 2020. Over the forecast period, energy demand by road transport accounts for around 82 percent of total transport demand. Gasoline and diesel together make up around 96
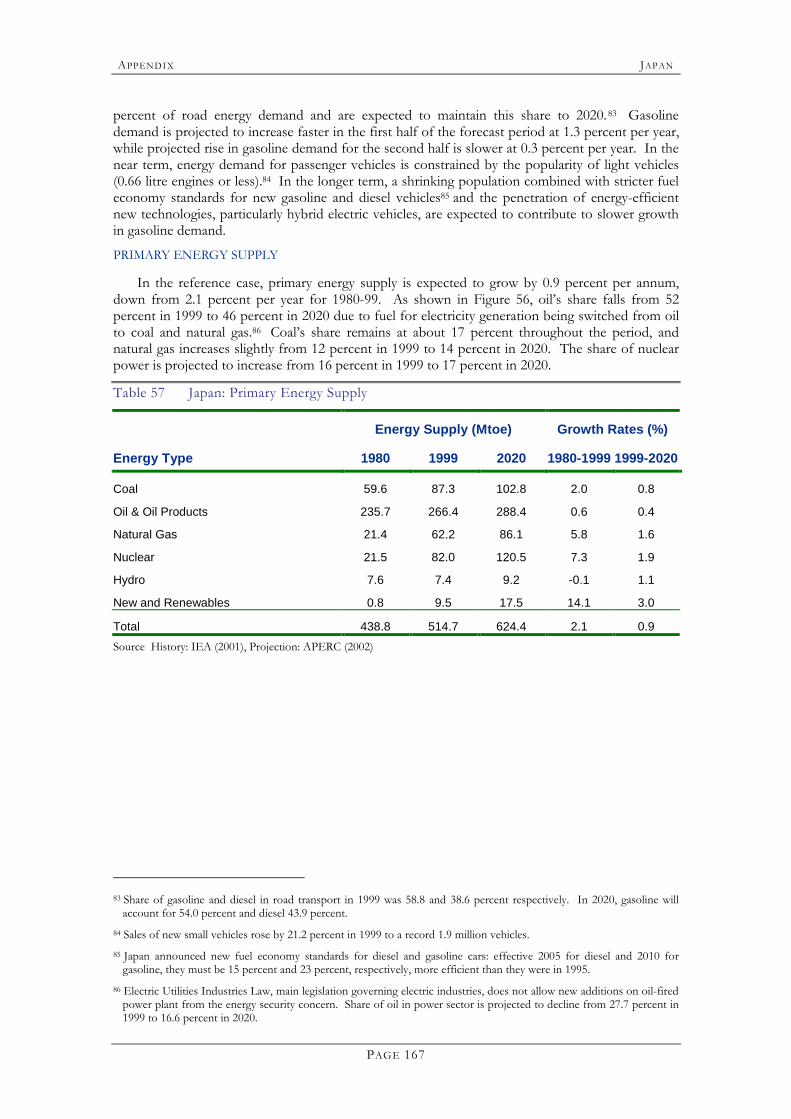
APPENDI X JAP AN
PAGE 167
percent of road energy demand and are expected to maintain this share to 2020.83 Gasoline demand is projected to increase faster in the first half of the forecast period at 1.3 percent per year, while projected rise in gasoline demand for the second half is slower at 0.3 percent per year. In the near term, energy demand for passenger vehicles is constrained by the popularity of light vehicles (0.66 litre engines or less).84 In the longer term, a shrinking population combined with stricter fuel economy standards for new gasoline and diesel vehicles85 and the penetration of energy-efficient new technologies, particularly hybrid electric vehicles, are expected to contribute to slower growth in gasoline demand.
PRIMARY ENERGY SUPPLY
In the reference case, primary energy supply is expected to grow by 0.9 percent per annum, down from 2.1 percent per year for 1980-99. As shown in Figure 56, oil�s share falls from 52 percent in 1999 to 46 percent in 2020 due to fuel for electricity generation being switched from oil to coal and natural gas.86 Coal�s share remains at about 17 percent throughout the period, and natural gas increases slightly from 12 percent in 1999 to 14 percent in 2020. The share of nuclear power is projected to increase from 16 percent in 1999 to 17 percent in 2020.
Table 57 Japan: Primary Energy Supply
Energy Supply (Mtoe) Growth Rates (%)
Energy Type 1980 1999 2020 1980-1999 1999-2020
Coal 59.6 87.3 102.8 2.0 0.8
Oil & Oil Products 235.7 266.4 288.4 0.6 0.4
Natural Gas 21.4 62.2 86.1 5.8 1.6
Nuclear 21.5 82.0 120.5 7.3 1.9
Hydro 7.6 7.4 9.2 -0.1 1.1
New and Renewables 0.8 9.5 17.5 14.1 3.0
Total 438.8 514.7 624.4 2.1 0.9 Source History: IEA (2001), Projection: APERC (2002)
83 Share of gasoline and diesel in road transport in 1999 was 58.8 and 38.6 percent respectively. In 2020, gasoline will
account for 54.0 percent and diesel 43.9 percent. 84 Sales of new small vehicles rose by 21.2 percent in 1999 to a record 1.9 million vehicles. 85 Japan announced new fuel economy standards for diesel and gasoline cars: effective 2005 for diesel and 2010 for
gasoline, they must be 15 percent and 23 percent, respectively, more efficient than they were in 1995. 86 Electric Utilities Industries Law, main legislation governing electric industries, does not allow new additions on oil-fired
power plant from the energy security concern. Share of oil in power sector is projected to decline from 27.7 percent in 1999 to 16.6 percent in 2020.
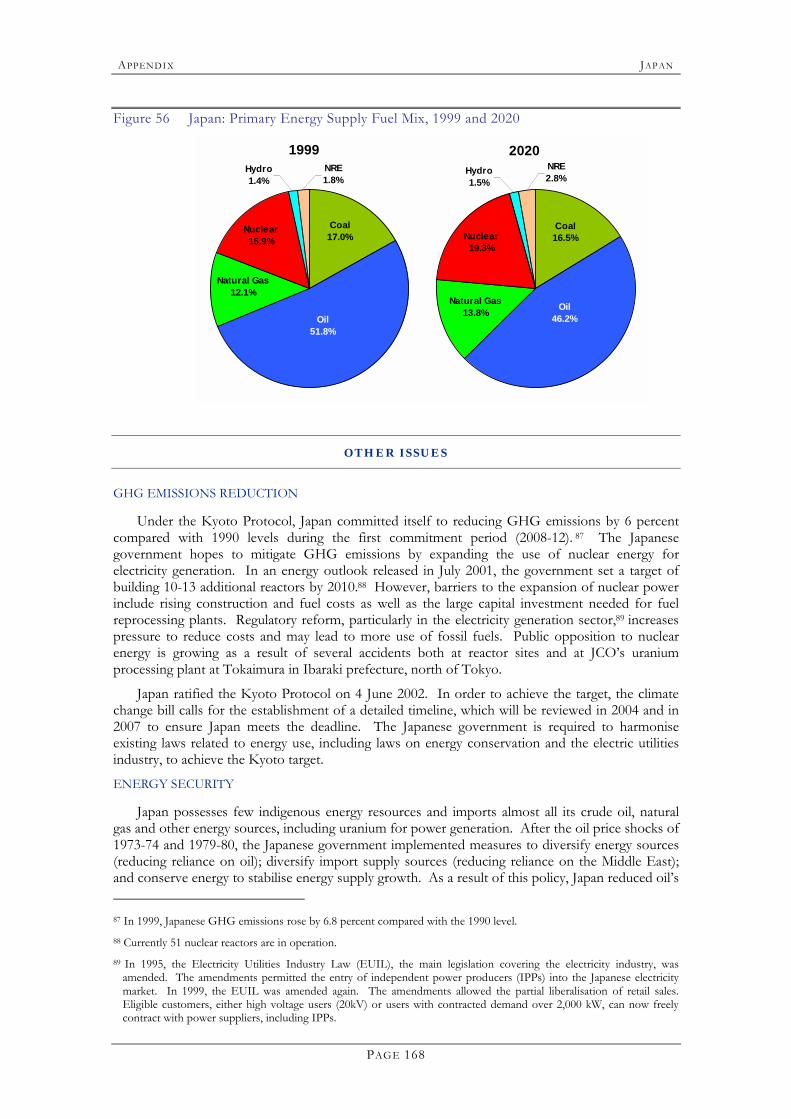
APPENDI X JAP AN
PAGE 168
Figure 56 Japan: Primary Energy Supply Fuel Mix, 1999 and 2020
1999Hydro1.4%
Nuclear15.9%
Oil 51.8%
Coal 17.0%
NRE1.8%
Natural Gas12.1%
2020
Natural Gas13.8%
NRE2.8%
Coal 16.5%
Oil 46.2%
Nuclear19.3%
Hydro1.5%
OTHER ISSUES
GHG EMISSIONS REDUCTION
Under the Kyoto Protocol, Japan committed itself to reducing GHG emissions by 6 percent compared with 1990 levels during the first commitment period (2008-12). 87 The Japanese government hopes to mitigate GHG emissions by expanding the use of nuclear energy for electricity generation. In an energy outlook released in July 2001, the government set a target of building 10-13 additional reactors by 2010.88 However, barriers to the expansion of nuclear power include rising construction and fuel costs as well as the large capital investment needed for fuel reprocessing plants. Regulatory reform, particularly in the electricity generation sector,89 increases pressure to reduce costs and may lead to more use of fossil fuels. Public opposition to nuclear energy is growing as a result of several accidents both at reactor sites and at JCO�s uranium processing plant at Tokaimura in Ibaraki prefecture, north of Tokyo.
Japan ratified the Kyoto Protocol on 4 June 2002. In order to achieve the target, the climate change bill calls for the establishment of a detailed timeline, which will be reviewed in 2004 and in 2007 to ensure Japan meets the deadline. The Japanese government is required to harmonise existing laws related to energy use, including laws on energy conservation and the electric utilities industry, to achieve the Kyoto target.
ENERGY SECURITY
Japan possesses few indigenous energy resources and imports almost all its crude oil, natural gas and other energy sources, including uranium for power generation. After the oil price shocks of 1973-74 and 1979-80, the Japanese government implemented measures to diversify energy sources (reducing reliance on oil); diversify import supply sources (reducing reliance on the Middle East); and conserve energy to stabilise energy supply growth. As a result of this policy, Japan reduced oil�s 87 In 1999, Japanese GHG emissions rose by 6.8 percent compared with the 1990 level. 88 Currently 51 nuclear reactors are in operation. 89 In 1995, the Electricity Utilities Industry Law (EUIL), the main legislation covering the electricity industry, was
amended. The amendments permitted the entry of independent power producers (IPPs) into the Japanese electricity market. In 1999, the EUIL was amended again. The amendments allowed the partial liberalisation of retail sales. Eligible customers, either high voltage users (20kV) or users with contracted demand over 2,000 kW, can now freely contract with power suppliers, including IPPs.

APPENDI X JAP AN
PAGE 169
share of total primary energy consumption from 77 percent in 1973 to 52 percent by 1999. APERC�s forecast projects that oil�s share will decline further to 46 percent by 2020.
Coal and natural gas will nibble at the share of oil over the forecast period. In light of Japan�s efforts to cut GHG emissions to meet the Kyoto targets, natural gas will be increasingly attractive as a fuel source for power generation. Japan is the world�s largest importer of LNG, accounting for 61 percent of global demand. Virtually all gas consumed in Japan comes in this form. In 1999, Japan consumed 62.2 Mtoe, 90 and APERC forecasts show natural gas demand of 78.7 Mtoe in 2010 and 86.1 Mtoe in 2020. If the current level of 68.0 Mtoe in long-term take-or-pay contracts is maintained to 2020, additional sources needed would amount to 10.7 Mtoe in 2010 and 18.1 Mtoe in 2020. In view of the future natural gas supply gap, Japan needs to cooperate more with neighbouring economies in order to secure supply sources not only in the form of LNG from East Asian economies, but also of pipeline natural gas from Sakhalin in Russia.
90 Equivalent to 50.1 million tonnes of LNG.

APPENDI X JAP AN
PAGE 170
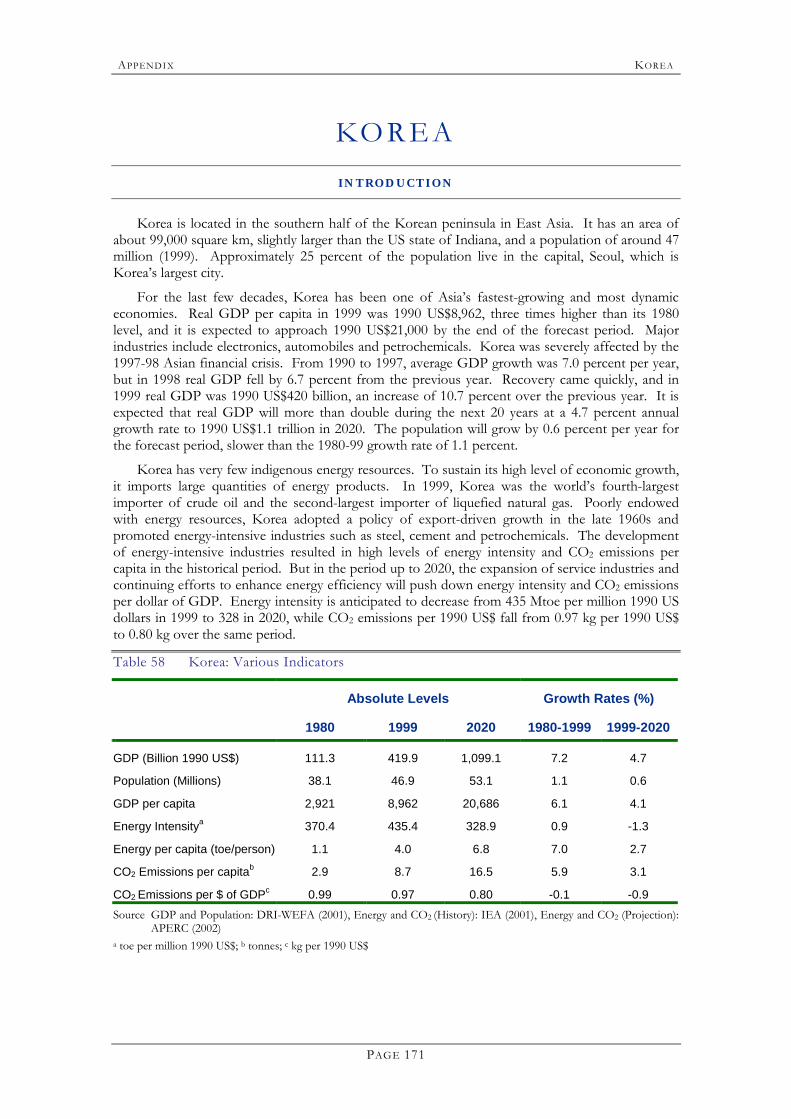
APPENDI X KOREA
PAGE 171
KO R E A INTROD UCTION
Korea is located in the southern half of the Korean peninsula in East Asia. It has an area of about 99,000 square km, slightly larger than the US state of Indiana, and a population of around 47 million (1999). Approximately 25 percent of the population live in the capital, Seoul, which is Korea�s largest city.
For the last few decades, Korea has been one of Asia�s fastest-growing and most dynamic economies. Real GDP per capita in 1999 was 1990 US$8,962, three times higher than its 1980 level, and it is expected to approach 1990 US$21,000 by the end of the forecast period. Major industries include electronics, automobiles and petrochemicals. Korea was severely affected by the 1997-98 Asian financial crisis. From 1990 to 1997, average GDP growth was 7.0 percent per year, but in 1998 real GDP fell by 6.7 percent from the previous year. Recovery came quickly, and in 1999 real GDP was 1990 US$420 billion, an increase of 10.7 percent over the previous year. It is expected that real GDP will more than double during the next 20 years at a 4.7 percent annual growth rate to 1990 US$1.1 trillion in 2020. The population will grow by 0.6 percent per year for the forecast period, slower than the 1980-99 growth rate of 1.1 percent.
Korea has very few indigenous energy resources. To sustain its high level of economic growth, it imports large quantities of energy products. In 1999, Korea was the world�s fourth-largest importer of crude oil and the second-largest importer of liquefied natural gas. Poorly endowed with energy resources, Korea adopted a policy of export-driven growth in the late 1960s and promoted energy-intensive industries such as steel, cement and petrochemicals. The development of energy-intensive industries resulted in high levels of energy intensity and CO2 emissions per capita in the historical period. But in the period up to 2020, the expansion of service industries and continuing efforts to enhance energy efficiency will push down energy intensity and CO2 emissions per dollar of GDP. Energy intensity is anticipated to decrease from 435 Mtoe per million 1990 US dollars in 1999 to 328 in 2020, while CO2 emissions per 1990 US$ fall from 0.97 kg per 1990 US$ to 0.80 kg over the same period.
Table 58 Korea: Various Indicators
Absolute Levels Growth Rates (%)
1980 1999 2020 1980-1999 1999-2020
GDP (Billion 1990 US$) 111.3 419.9 1,099.1 7.2 4.7
Population (Millions) 38.1 46.9 53.1 1.1 0.6
GDP per capita 2,921 8,962 20,686 6.1 4.1
Energy Intensitya 370.4 435.4 328.9 0.9 -1.3
Energy per capita (toe/person) 1.1 4.0 6.8 7.0 2.7
CO2 Emissions per capitab 2.9 8.7 16.5 5.9 3.1
CO2 Emissions per $ of GDPc 0.99 0.97 0.80 -0.1 -0.9 Source GDP and Population: DRI-WEFA (2001), Energy and CO2 (History): IEA (2001), Energy and CO2 (Projection):
APERC (2002) a toe per million 1990 US$; b tonnes; c kg per 1990 US$
APPENDI X KOREA
PAGE 172
SUMMARY OF FORECAST RESULTS
FINAL ENERGY CONSUMPTION
Industry has been the biggest energy consumer, with a 47 percent share in 1999, and showed strong growth of 7.8 percent per year between 1980 and 1999. Energy demand in this sector will grow more slowly during the forecast period at 2.6 percent per annum, but its share remains high at 40 percent in 2020. Industrial energy use is lower in the forecast period because GDP in energy-intensive industries such as iron and steel, cement and petrochemicals is projected to grow only three percent per annum during the forecast period.
Second to industry are the residential and commercial sectors, which had combined shares of 38 percent in 1980 and 26 percent in 1999. Commercial sector growth was very strong during the 1980s and 1990s at an average of 11.0 percent annually, in contrast with 1.7 percent in the residential sector. The very slow historical growth rate for total residential energy consumption in Korea masks rapid growth of eight percent per annum in electricity demand and income- and technology-driven fuel substitution. Traditionally in Korea, coal was used for heating and cooking, and in 1980 it accounted for 90 percent of energy use in the residential sector. By 1999 the picture had changed radically. As incomes reached a certain level and due to government policies, households started to switch to more efficient fuel oil and natural gas equipment for heating and LPG stoves for cooking. By 1999, coal�s share in the residential sector had fallen to just 5 percent.
Transport sector energy demand recorded the second-highest growth between 1980 and 1999 owing to transport needs for industrialisation and increasing car ownership. It is projected that the sector will continue to be the fastest-growing consumer for the next 20 years, with 5.3 percent annual average growth, and it will overtake the residential and commercial sectors combined by 2004.91
Natural gas will continue to be the fastest-growing energy source, thanks to it being convenient to use and environmentally friendly, with industrial sector use rising by 6 percent per annum and residential and commercial use by 4.4 percent for the forecast period. The annual growth rate in natural gas use reached as high as 47 percent in the 12 years from its introduction up to 1999, and is expected to expand by 5 percent per year. Accordingly, its share in final energy demand escalated to 7.4 percent in 1999 from a mere 0.2 percent in 1987 and is anticipated to reach over 10 percent by 2020.92
Oil was the most important energy source in 1999 with a 68 percent share, up from 57.5 percent in 1980 and rising by over eight percent annually. Although they will grow more slowly by an average 2.9 percent per year in the future, replaced in large part by natural gas in industries, they will maintain their position as the most popular fuel due to growing transport demand.
As incomes grow and consumers want more high-quality energy, electricity has shown solid growth at 11 percent per annum for the past 19 years, with a share of nine percent in 1980 and 16.6 percent in 1999. It is expected to keep on growing strongly by 4.7 percent annually. This is particularly so in the residential and commercial sectors, where its share is projected to be 22 percent in 2020. 93 Because of reduced demand for coal, particularly in the residential and commercial sectors, coal demand has decreased by around 3 percent per year for the past 19 years. Limited expansion in the iron and steel and cement industries is expected to lead to a lower growth rate in these industries of 1.3 percent per year for the next 20 years. Despite their rapid growth rates in the past, heat and new and renewables (NRE) are not anticipated to play a major role in Korea�s energy scene during the forecast period.
91 A recent national forecast (MOCIE (2002)) projects a rather lower growth rate of 3.2 percent from 2000 to 2020. 92 The aforementioned national forecast expects its share to be 14.4 percent in 2020. 93 In contrast to this strong growth projection for electricity, the national forecast expects it to grow at around 3 percent
per year between 2000 and 2020 and its share in 2020 to be 15.5 percent.
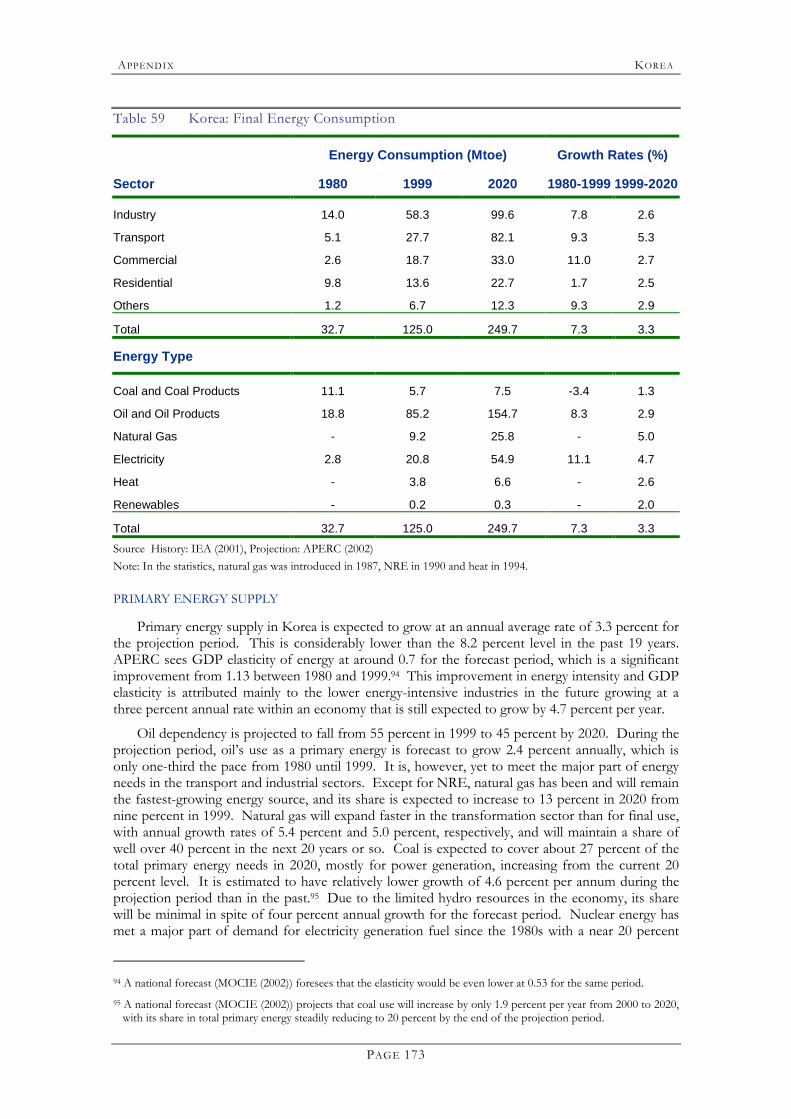
APPENDI X KOREA
PAGE 173
Table 59 Korea: Final Energy Consumption
Energy Consumption (Mtoe) Growth Rates (%)
Sector 1980 1999 2020 1980-1999 1999-2020
Industry 14.0 58.3 99.6 7.8 2.6
Transport 5.1 27.7 82.1 9.3 5.3
Commercial 2.6 18.7 33.0 11.0 2.7
Residential 9.8 13.6 22.7 1.7 2.5
Others 1.2 6.7 12.3 9.3 2.9
Total 32.7 125.0 249.7 7.3 3.3
Energy Type
Coal and Coal Products 11.1 5.7 7.5 -3.4 1.3
Oil and Oil Products 18.8 85.2 154.7 8.3 2.9
Natural Gas - 9.2 25.8 - 5.0
Electricity 2.8 20.8 54.9 11.1 4.7
Heat - 3.8 6.6 - 2.6
Renewables - 0.2 0.3 - 2.0
Total 32.7 125.0 249.7 7.3 3.3 Source History: IEA (2001), Projection: APERC (2002) Note: In the statistics, natural gas was introduced in 1987, NRE in 1990 and heat in 1994. PRIMARY ENERGY SUPPLY
Primary energy supply in Korea is expected to grow at an annual average rate of 3.3 percent for the projection period. This is considerably lower than the 8.2 percent level in the past 19 years. APERC sees GDP elasticity of energy at around 0.7 for the forecast period, which is a significant improvement from 1.13 between 1980 and 1999.94 This improvement in energy intensity and GDP elasticity is attributed mainly to the lower energy-intensive industries in the future growing at a three percent annual rate within an economy that is still expected to grow by 4.7 percent per year.
Oil dependency is projected to fall from 55 percent in 1999 to 45 percent by 2020. During the projection period, oil�s use as a primary energy is forecast to grow 2.4 percent annually, which is only one-third the pace from 1980 until 1999. It is, however, yet to meet the major part of energy needs in the transport and industrial sectors. Except for NRE, natural gas has been and will remain the fastest-growing energy source, and its share is expected to increase to 13 percent in 2020 from nine percent in 1999. Natural gas will expand faster in the transformation sector than for final use, with annual growth rates of 5.4 percent and 5.0 percent, respectively, and will maintain a share of well over 40 percent in the next 20 years or so. Coal is expected to cover about 27 percent of the total primary energy needs in 2020, mostly for power generation, increasing from the current 20 percent level. It is estimated to have relatively lower growth of 4.6 percent per annum during the projection period than in the past.95 Due to the limited hydro resources in the economy, its share will be minimal in spite of four percent annual growth for the forecast period. Nuclear energy has met a major part of demand for electricity generation fuel since the 1980s with a near 20 percent
94 A national forecast (MOCIE (2002)) foresees that the elasticity would be even lower at 0.53 for the same period. 95 A national forecast (MOCIE (2002)) projects that coal use will increase by only 1.9 percent per year from 2000 to 2020,
with its share in total primary energy steadily reducing to 20 percent by the end of the projection period.
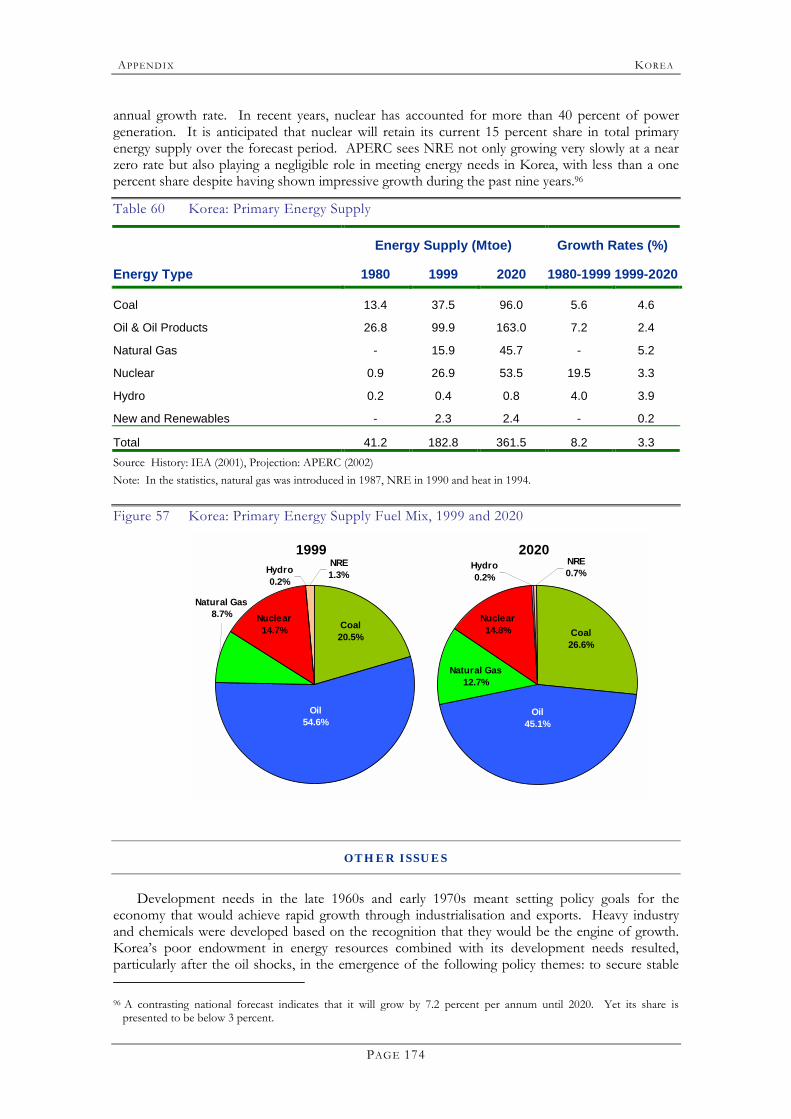
APPENDI X KOREA
PAGE 174
annual growth rate. In recent years, nuclear has accounted for more than 40 percent of power generation. It is anticipated that nuclear will retain its current 15 percent share in total primary energy supply over the forecast period. APERC sees NRE not only growing very slowly at a near zero rate but also playing a negligible role in meeting energy needs in Korea, with less than a one percent share despite having shown impressive growth during the past nine years.96
Table 60 Korea: Primary Energy Supply
Energy Supply (Mtoe) Growth Rates (%)
Energy Type 1980 1999 2020 1980-1999 1999-2020
Coal 13.4 37.5 96.0 5.6 4.6
Oil & Oil Products 26.8 99.9 163.0 7.2 2.4
Natural Gas - 15.9 45.7 - 5.2
Nuclear 0.9 26.9 53.5 19.5 3.3
Hydro 0.2 0.4 0.8 4.0 3.9
New and Renewables - 2.3 2.4 - 0.2
Total 41.2 182.8 361.5 8.2 3.3 Source History: IEA (2001), Projection: APERC (2002) Note: In the statistics, natural gas was introduced in 1987, NRE in 1990 and heat in 1994. Figure 57 Korea: Primary Energy Supply Fuel Mix, 1999 and 2020
1999
Natural Gas8.7%
NRE1.3%
Coal 20.5%
Oil 54.6%
Nuclear14.7%
Hydro0.2%
2020Hydro0.2%
Nuclear14.8%
Oil 45.1%
Coal 26.6%
NRE0.7%
Natural Gas12.7%
OTHER ISSUES
Development needs in the late 1960s and early 1970s meant setting policy goals for the economy that would achieve rapid growth through industrialisation and exports. Heavy industry and chemicals were developed based on the recognition that they would be the engine of growth. Korea�s poor endowment in energy resources combined with its development needs resulted, particularly after the oil shocks, in the emergence of the following policy themes: to secure stable 96 A contrasting national forecast indicates that it will grow by 7.2 percent per annum until 2020. Yet its share is
presented to be below 3 percent.
APPENDI X KOREA
PAGE 175
energy supplies; to develop and implement measures to reduce dependence on oil; to develop energy resources both domestically and abroad; and to conserve energy and improve energy efficiency. No significant changes have been made in these policy themes, except that the Korean government attempts to cope with the changing environment more comprehensively and more efficiently.
CHANGES IN ENERGY ENVIRONMENT
The Korean economy is expected to become one that is knowledge-based, in which knowledge and information will become the core element for value added. Integration of IT and traditional industries will accelerate. In parallel, polarisation between its global conglomerates and specialised companies is likely to become more marked. Businesses will utilise more and more network management and the e-business will tie together distribution, telecoms and finance. The social structure will become more �horizontal� and society will be more decentralised, with less power and authority wielded by central government.
It is anticipated that oil will remain the major energy source worldwide well into the future, with a 40 percent share in total energy consumption.97 Economic development in such large economies as China and India has prompted some concern about supply-demand imbalances. Korea is also concerned that increased world dependence on the Middle East for oil is unavoidable. More pressure on developing economies to cut greenhouse gas emissions is also likely. The trend for privatisation, liberalisation and globalisation of energy utilities will continue all over the world. Development of IT technology, globalisation of financial markets and the higher degree of energy market saturation in developed economies will accelerate capital movement into the energy sectors of less developed economies.
It will become more and more difficult to site energy facilities in Korea in face of public demand for a cleaner and safer environment. This is particularly true with coal and nuclear power. The increasing environmental costs will reshuffle the relative prices of energy sources and, consequently, change the energy mix and industry structure. The Korean government believes energy cooperation between the two Koreas is possible and desirable, aside from questions of their political reunification. The final goal in the energy dimension seems to be an integrated system across the Korean peninsula. Furthermore, the northern part of Northeast Asia − Eastern Siberia and the Russian Far East − is regarded as an energy treasure-house, for which China, Japan and Korea could be a good market. From the perspective of creating a Northeast Asian economic community, possibly including North Korea, the Korean government has added to its to-do list the policy goal of constructing an energy system linked to the Asian Continent.
ENERGY SECURITY
The Korean government has tried to secure and diversify energy supplies due to complete dependence on oil imports. To cope with short-term supply disruptions and to meet its obligations to the International Energy Agency (the Korean National Assembly ratified and submitted the agreement to the IEA in March 2002), the government plans to increase strategic oil stocks from 33 days of net imports in 2001 (65.6 million barrels) to 60 days by 2006. Korea anticipates that its IEA membership will bring great changes to its energy sector, for example in developing 90 days supply of oil stocks, coordinated utilisation of oil stocks, and implementation of IEA energy policies in the domestic market. It also believes that it will be able to enjoy substantial benefits such as a higher degree of energy security, greater influence in the world energy market, and more efficient and flexible energy policies.
In the longer term, to increase energy security the Korea National Oil Corporation (KNOC) has been investing in exploration and development projects off the Korean peninsula as well as in international petroleum joint reserve projects (JRP). To date, KNOC has equity stakes in 19 overseas exploration and production projects in 12 different economies including Russia, Australia
97 Both the International Energy Agency (2000) and the Energy Information Administration of the U.S. (2002) project a
40 percent share for oil in total primary energy during the next two decades.
APPENDI X KOREA
PAGE 176
and Indonesia. To encourage private companies to invest in the development of overseas mineral resources, the Korean government has expanded its policy of supplying long-term low-interest loans through a government-managed fund, the Special Account of Energy and Resources.
To enhance energy security, Korea has been diversifying energy sources. A good example is the introduction of natural gas in the late 1980s, a plan begun in the late 1970s. In promoting the use of natural gas, an important rationale for Korea has been a more uniform resource distribution of natural gas relative to oil, in addition to environmental considerations. A major part of the decreasing share of oil will be met by natural gas. Korea is also actively involved in Northeast Asian energy cooperation, an idea that combines the interests of both energy-consuming and energy-producing economies in the region by raising the possibility of interconnecting power and gas grids.
ENERGY MARKET REFORMS
The Korean government believes it is necessary to establish markets for utility services, where they can be traded as a commodity. To this end, programmes of unbundling and privatisation for the Korea Electric Power Corporation (KEPCO) and the Korea Gas Corporation (KOGAS) have been developed. Part of the plan has been implemented, including the establishment of the Korea Power Exchange and the Korea Power Commission in April 2001. Generating companies except for hydro and nuclear stations will be privatised step by step from 2002.
In the natural gas industry, it is planned to separate and sell off the import and wholesale arm of KOGAS in 2002, with part of it temporarily kept as a subsidiary for the purpose of balancing supply and demand. Unlike the electricity sector, the enactment and amendment of related laws awaits passage in the National Assembly, to allow time for more in-depth reviews and public hearings on such critical issues as disruption of LNG shipments, changes to existing gas sales and purchase agreements, as well as the impact on domestic gas prices of such moves.
The distribution sector in both industries is to stay a regional monopoly until bulk supply competition becomes effective. However, open access to distribution facilities, particularly in the gas industry, may be realised earlier than expected due to more pressure for competition once competitive elements are introduced in the market. It is too early to predict what will happen to the energy supply and demand situation in the future because there are many factors involved and details of market operating rules are still being worked out. Coal and natural gas will compete as power generation fuels, with competitiveness depending on market operating rules and environmental regulations. As more choices for gas services open up, gas consumption by industrial and commercial users is expected to increase.
The oil industry was the first to be liberalised. There are no legal entry barriers in any stage of the supply chain. Domestic oil prices were liberalised in January 1997. Restrictions on foreign capital participation in oil refining were abolished from the previous limit of 50 percent in October 1998. Foreign direct investment in oil stations (sales business) was liberalised in 1998. A consortium led by ARAMCO holds a share of about 80 percent in S-Oil, and IPIC, a national investment company of the UAE, has a 50 percent stake in Hyundai Refinery.
ENERGY EFFICIENCY AND NEW AND RENEWABLE ENERGY
Enhancing energy efficiency is an important goal for Korea as an economy poorly endowed with energy resources. Given Korea�s vulnerability to energy supply disruptions, the government adopted a policy of demand management and energy conservation after the oil shock of the early 1970s. The policy was unsuccessful, however, as shown by Korea�s GDP elasticity of 1.13 during the last 19 years.
In the industrial sector, the government enforced stringent administrative regulations in combination with financial and tax incentives. District heating and cogeneration for industrial parks, factories and large buildings were also encouraged. To further promote energy conservation, the government intends to develop voluntary agreements with large energy-consuming enterprises. It hopes to increase these from 67 in 1999 to 567 by 2003.
APPENDI X KOREA
PAGE 177
Korea has recently launched several conservation programmes aimed at the residential and commercial sectors. There are three major energy efficiency programmes in operation: (i) the Energy Efficiency Standards and Labelling Programme, which began in 1992 and which targets some household appliances, lighting and automobiles; (ii) the Certification of High Efficiency Energy-Using Appliance Programme, implemented in December 1996; and (iii) the Energy-Saving Office Equipment and Home Electronics Programme, which began in April 1999. The objective of these programmes is to encourage manufacturers to improve the energy efficiency of their products by giving them incentives, and to induce consumers to purchase more energy-efficient products.
NRE accounted for just over one percent of total primary energy supply in 1999. In 2000, more than 90 percent of NRE came from industrial and urban waste, with heat accounting for 98.4 percent of the final energy produced, with the balance being electricity. The Korean government believes a meagre R&D investment in NRE was due to the stability of oil prices in the latter part of the last decade and the high level of setup costs compared with other fossil fuels. It is considering diverse measures to foster the development, utilisation and penetration of NRE, including tax incentives, regulations on purchases price of electricity generated by NRE, amendment of construction-related laws, and institutionalising financial support for private-sector consumers. Although hard to achieve, an ambitious plan was announced for NRE�s share to reach the two percent level by 2003 through intensified R&D activities.
The practical uses of NRE technologies are evaluated in the Green Village Programme. Once established, a programme is expected to systemise and facilitate the whole process of development and deployment of technology by helping create a market and stimulating penetration of NRE products through enhanced reliability, resulting from performance tests and research on individual technologies. The programme will be located in �Green Villages� that will be supported by the central government as well as local governments. A Green Village will be a self-sufficient community supplied with only new and renewable forms of energy. A testing site for solar and wind energy was established in 2001 as a first step to test products and improve reliability and commercial viability.

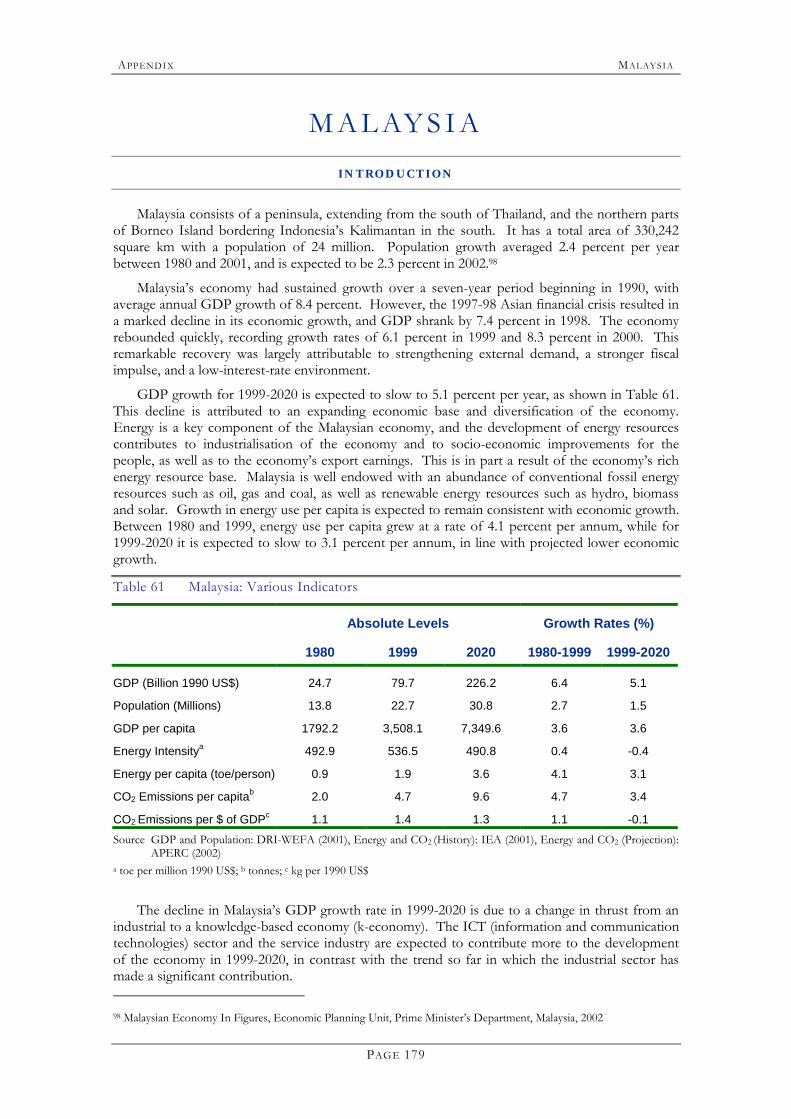
APPENDI X MALAYSIA
PAGE 179
M A L AY S I A INTROD UCTION
Malaysia consists of a peninsula, extending from the south of Thailand, and the northern parts of Borneo Island bordering Indonesia�s Kalimantan in the south. It has a total area of 330,242 square km with a population of 24 million. Population growth averaged 2.4 percent per year between 1980 and 2001, and is expected to be 2.3 percent in 2002.98
Malaysia�s economy had sustained growth over a seven-year period beginning in 1990, with average annual GDP growth of 8.4 percent. However, the 1997-98 Asian financial crisis resulted in a marked decline in its economic growth, and GDP shrank by 7.4 percent in 1998. The economy rebounded quickly, recording growth rates of 6.1 percent in 1999 and 8.3 percent in 2000. This remarkable recovery was largely attributable to strengthening external demand, a stronger fiscal impulse, and a low-interest-rate environment.
GDP growth for 1999-2020 is expected to slow to 5.1 percent per year, as shown in Table 61. This decline is attributed to an expanding economic base and diversification of the economy. Energy is a key component of the Malaysian economy, and the development of energy resources contributes to industrialisation of the economy and to socio-economic improvements for the people, as well as to the economy�s export earnings. This is in part a result of the economy�s rich energy resource base. Malaysia is well endowed with an abundance of conventional fossil energy resources such as oil, gas and coal, as well as renewable energy resources such as hydro, biomass and solar. Growth in energy use per capita is expected to remain consistent with economic growth. Between 1980 and 1999, energy use per capita grew at a rate of 4.1 percent per annum, while for 1999-2020 it is expected to slow to 3.1 percent per annum, in line with projected lower economic growth.
Table 61 Malaysia: Various Indicators
Absolute Levels Growth Rates (%)
1980 1999 2020 1980-1999 1999-2020
GDP (Billion 1990 US$) 24.7 79.7 226.2 6.4 5.1
Population (Millions) 13.8 22.7 30.8 2.7 1.5
GDP per capita 1792.2 3,508.1 7,349.6 3.6 3.6
Energy Intensitya 492.9 536.5 490.8 0.4 -0.4
Energy per capita (toe/person) 0.9 1.9 3.6 4.1 3.1
CO2 Emissions per capitab 2.0 4.7 9.6 4.7 3.4
CO2 Emissions per $ of GDPc 1.1 1.4 1.3 1.1 -0.1 Source GDP and Population: DRI-WEFA (2001), Energy and CO2 (History): IEA (2001), Energy and CO2 (Projection):
APERC (2002) a toe per million 1990 US$; b tonnes; c kg per 1990 US$
The decline in Malaysia�s GDP growth rate in 1999-2020 is due to a change in thrust from an industrial to a knowledge-based economy (k-economy). The ICT (information and communication technologies) sector and the service industry are expected to contribute more to the development of the economy in 1999-2020, in contrast with the trend so far in which the industrial sector has made a significant contribution. 98 Malaysian Economy In Figures, Economic Planning Unit, Prime Minister�s Department, Malaysia, 2002
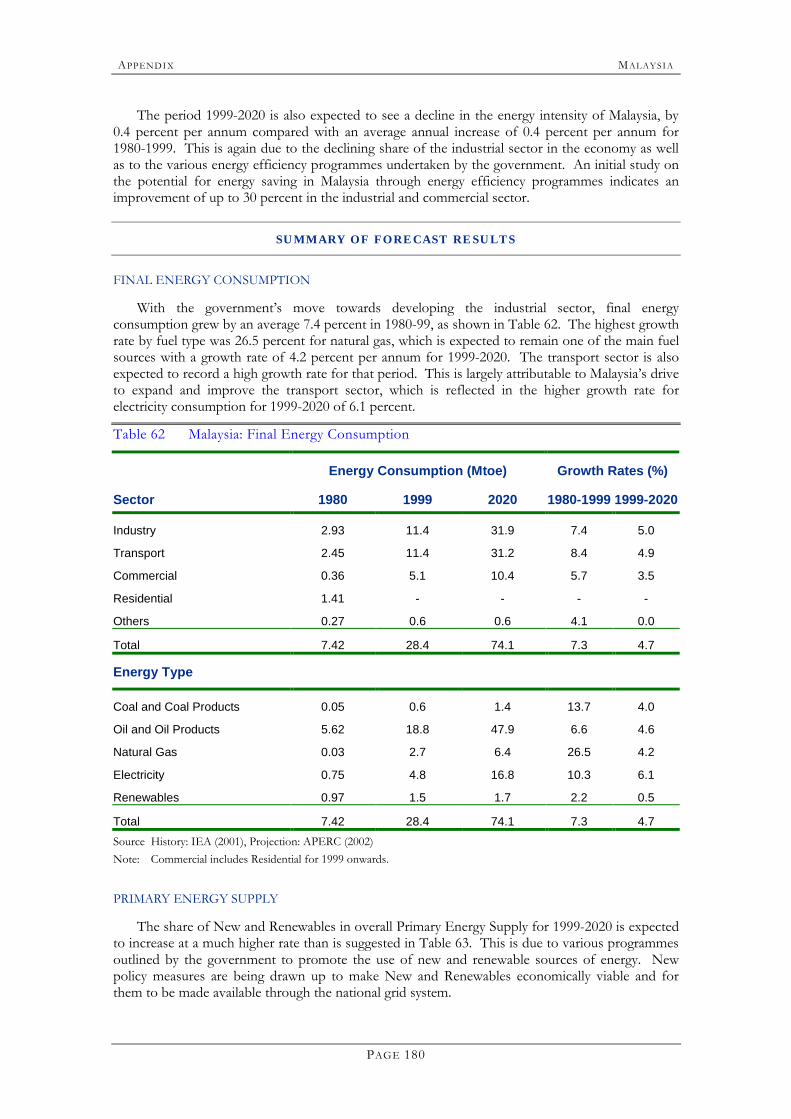
APPENDI X MALAYSIA
PAGE 180
The period 1999-2020 is also expected to see a decline in the energy intensity of Malaysia, by 0.4 percent per annum compared with an average annual increase of 0.4 percent per annum for 1980-1999. This is again due to the declining share of the industrial sector in the economy as well as to the various energy efficiency programmes undertaken by the government. An initial study on the potential for energy saving in Malaysia through energy efficiency programmes indicates an improvement of up to 30 percent in the industrial and commercial sector.
SUMMARY OF FORECAST RESULTS
FINAL ENERGY CONSUMPTION
With the government�s move towards developing the industrial sector, final energy consumption grew by an average 7.4 percent in 1980-99, as shown in Table 62. The highest growth rate by fuel type was 26.5 percent for natural gas, which is expected to remain one of the main fuel sources with a growth rate of 4.2 percent per annum for 1999-2020. The transport sector is also expected to record a high growth rate for that period. This is largely attributable to Malaysia�s drive to expand and improve the transport sector, which is reflected in the higher growth rate for electricity consumption for 1999-2020 of 6.1 percent.
Table 62 Malaysia: Final Energy Consumption
Energy Consumption (Mtoe) Growth Rates (%)
Sector 1980 1999 2020 1980-1999 1999-2020
Industry 2.93 11.4 31.9 7.4 5.0
Transport 2.45 11.4 31.2 8.4 4.9
Commercial 0.36 5.1 10.4 5.7 3.5
Residential 1.41 - - - -
Others 0.27 0.6 0.6 4.1 0.0
Total 7.42 28.4 74.1 7.3 4.7
Energy Type
Coal and Coal Products 0.05 0.6 1.4 13.7 4.0
Oil and Oil Products 5.62 18.8 47.9 6.6 4.6
Natural Gas 0.03 2.7 6.4 26.5 4.2
Electricity 0.75 4.8 16.8 10.3 6.1
Renewables 0.97 1.5 1.7 2.2 0.5
Total 7.42 28.4 74.1 7.3 4.7 Source History: IEA (2001), Projection: APERC (2002) Note: Commercial includes Residential for 1999 onwards.
PRIMARY ENERGY SUPPLY
The share of New and Renewables in overall Primary Energy Supply for 1999-2020 is expected to increase at a much higher rate than is suggested in Table 63. This is due to various programmes outlined by the government to promote the use of new and renewable sources of energy. New policy measures are being drawn up to make New and Renewables economically viable and for them to be made available through the national grid system.
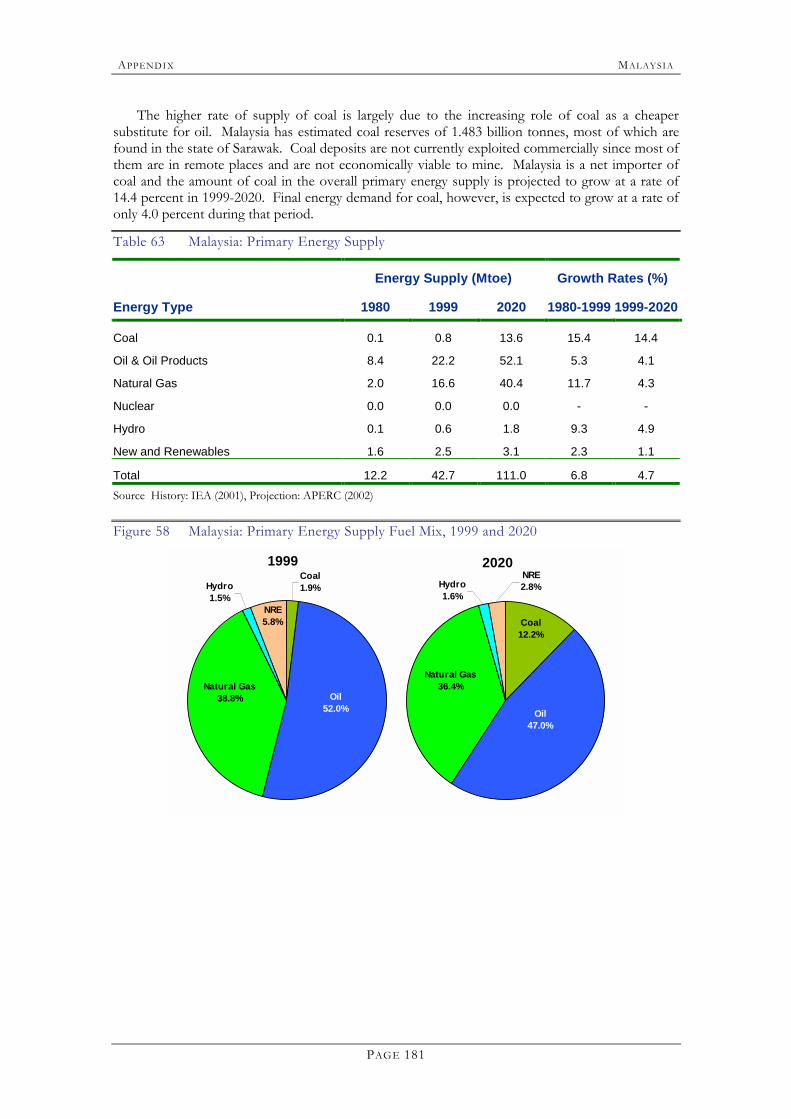
APPENDI X MALAYSIA
PAGE 181
The higher rate of supply of coal is largely due to the increasing role of coal as a cheaper substitute for oil. Malaysia has estimated coal reserves of 1.483 billion tonnes, most of which are found in the state of Sarawak. Coal deposits are not currently exploited commercially since most of them are in remote places and are not economically viable to mine. Malaysia is a net importer of coal and the amount of coal in the overall primary energy supply is projected to grow at a rate of 14.4 percent in 1999-2020. Final energy demand for coal, however, is expected to grow at a rate of only 4.0 percent during that period.
Table 63 Malaysia: Primary Energy Supply
Energy Supply (Mtoe) Growth Rates (%)
Energy Type 1980 1999 2020 1980-1999 1999-2020
Coal 0.1 0.8 13.6 15.4 14.4
Oil & Oil Products 8.4 22.2 52.1 5.3 4.1
Natural Gas 2.0 16.6 40.4 11.7 4.3
Nuclear 0.0 0.0 0.0 - -
Hydro 0.1 0.6 1.8 9.3 4.9
New and Renewables 1.6 2.5 3.1 2.3 1.1
Total 12.2 42.7 111.0 6.8 4.7 Source History: IEA (2001), Projection: APERC (2002) Figure 58 Malaysia: Primary Energy Supply Fuel Mix, 1999 and 2020
1999
Natural Gas38.8%
NRE5.8%
Coal 1.9%
Oil 52.0%
Hydro1.5%
2020Hydro1.6%
Oil 47.0%
Coal 12.2%
NRE2.8%
Natural Gas36.4%

APPENDI X MALAYSIA
PAGE 182
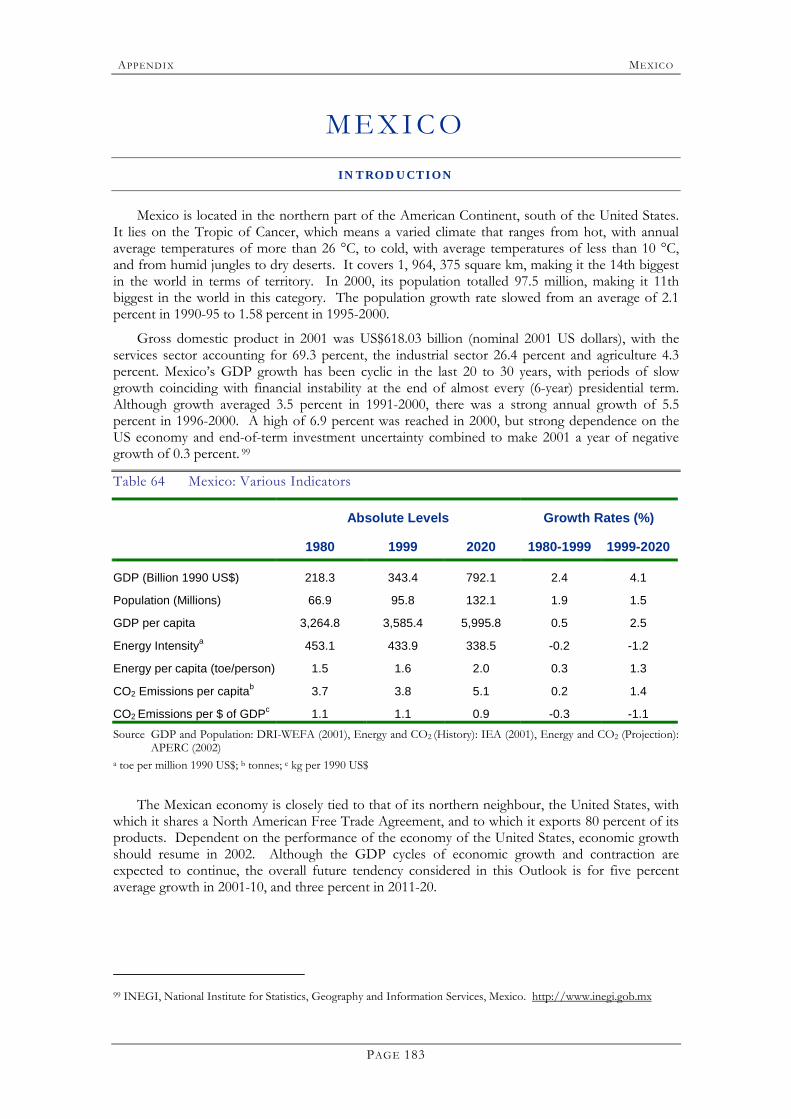
APPENDI X MEXICO
PAGE 183
M E X I C O INTROD UCTION
Mexico is located in the northern part of the American Continent, south of the United States. It lies on the Tropic of Cancer, which means a varied climate that ranges from hot, with annual average temperatures of more than 26 °C, to cold, with average temperatures of less than 10 °C, and from humid jungles to dry deserts. It covers 1, 964, 375 square km, making it the 14th biggest in the world in terms of territory. In 2000, its population totalled 97.5 million, making it 11th biggest in the world in this category. The population growth rate slowed from an average of 2.1 percent in 1990-95 to 1.58 percent in 1995-2000.
Gross domestic product in 2001 was US$618.03 billion (nominal 2001 US dollars), with the services sector accounting for 69.3 percent, the industrial sector 26.4 percent and agriculture 4.3 percent. Mexico�s GDP growth has been cyclic in the last 20 to 30 years, with periods of slow growth coinciding with financial instability at the end of almost every (6-year) presidential term. Although growth averaged 3.5 percent in 1991-2000, there was a strong annual growth of 5.5 percent in 1996-2000. A high of 6.9 percent was reached in 2000, but strong dependence on the US economy and end-of-term investment uncertainty combined to make 2001 a year of negative growth of 0.3 percent. 99
Table 64 Mexico: Various Indicators
Absolute Levels Growth Rates (%)
1980 1999 2020 1980-1999 1999-2020
GDP (Billion 1990 US$) 218.3 343.4 792.1 2.4 4.1
Population (Millions) 66.9 95.8 132.1 1.9 1.5
GDP per capita 3,264.8 3,585.4 5,995.8 0.5 2.5
Energy Intensitya 453.1 433.9 338.5 -0.2 -1.2
Energy per capita (toe/person) 1.5 1.6 2.0 0.3 1.3
CO2 Emissions per capitab 3.7 3.8 5.1 0.2 1.4
CO2 Emissions per $ of GDPc 1.1 1.1 0.9 -0.3 -1.1 Source GDP and Population: DRI-WEFA (2001), Energy and CO2 (History): IEA (2001), Energy and CO2 (Projection):
APERC (2002) a toe per million 1990 US$; b tonnes; c kg per 1990 US$
The Mexican economy is closely tied to that of its northern neighbour, the United States, with which it shares a North American Free Trade Agreement, and to which it exports 80 percent of its products. Dependent on the performance of the economy of the United States, economic growth should resume in 2002. Although the GDP cycles of economic growth and contraction are expected to continue, the overall future tendency considered in this Outlook is for five percent average growth in 2001-10, and three percent in 2011-20.
99 INEGI, National Institute for Statistics, Geography and Information Services, Mexico. http://www.inegi.gob.mx
APPENDI X MEXICO
PAGE 184
SUMMARY OF FORECAST RESULTS
FINAL ENERGY CONSUMPTION
Energy demand in the future is likely to grow at an accelerated pace, mainly as a result of strong industrial expansion, higher emphasis on exports and an expected rise in standards of living. Electricity and gas demand growth for 2000 surpassed averages for the last 20 years at 6.9 and 8.3 percent respectively.
The highest growth rates for fuel consumption in 1999-2020 will be seen in the industrial sector, with an average annual rise of 3.8 percent, and the commercial sector with 3.6 percent. The commercial sector, however, has a small share of total energy demand with 4.6 percent at the end of the period. The picture at the end of the 20-year study period shows industry at 44.4 percent, transport 35.5 percent and residential 14.3 percent.
In final consumption, electricity and natural gas are expected to have the highest growth rates. The highest growth in electricity demand will be in the industrial and the residential sectors, both having average growth rates of 5.8 percent during the period, although industrial demand volume dominates with a share of 67.7 percent. In the heavy industry subsector, an increasing proportion of demand being met by autoproducer 100 plants is expected. Total industrial average demand growth for 1999-2010 in this study is 6.3 percent, tapering off to 5.2 percent for the following decade. Transport electricity demand growth is three percent, reflecting an increase in subway system mileage in Mexico City and in other important cities in the economy.
Natural gas consumption patterns have changed noticeably in recent years as a consequence of internal reforms. On the one hand, it is being used more and more in power generation due to its cost and to recent regulations restricting carbon emissions. Also, power generation is attracting more participation from private investors in IPP schemes, auto- and co-generation. A full 86 percent of new generating capacity in the next 10 years is expected to be fuelled by natural gas. Reforms introduced in 1995 that allowed investors into natural gas transport and distribution enabled this fuel to reach a growing market and displace traditional fuels such as LPG, which has been important in the commercial and residential sectors. Natural gas demand in this study shows a high initial average growth rate of 7.4 percent for the first five years, gradually slowing to an average rate of 5.5 percent for 1999-2010, and finally reaching an average rate of 4.7 percent for the whole 20-year period.
Demand for natural gas, however, will have to be met with imports. Although Mexico has important gas reserves, most of its gas comes from oil production. Non-associated gas is at present only 28 percent of total production, and production from existing fields declines at a rate of 20 to 30 percent per year. Under such conditions, as much as 25 percent of the gas required in 2006 will need to be imported. Important investments will have to be made to develop natural gas fields. One of the measures being considered to fill the gap in the next 10 years is a pair of LNG receiving terminals proposed on the Gulf of Mexico coast and in the Baja California region on the Pacific Coast.
The refinery system in Mexico is undergoing restructuring to improve the quality of fuels, provide a larger yield of products with a higher economic value, diminish the yield of residuals and enable processing of heavier crude oils. Due to the nature of the economy�s oil reserves and to the higher market value of lighter crude types, heavy crude is expected to be increasingly available domestically in the future. Inefficient and potentially more contaminating fuels, such as fuel oil, will be gradually phased out in all sectors. This is reflected in the slower growth of oil and oil products in final energy consumption.
Also noticeable in final energy consumption is the low growth of renewables. Biomass in the form of firewood and sugarcane bagasse accounts for a significant part of renewable energy. These 100 Autoproducers are �entities that generate electricity and/or heat wholly or partly for their own use as an activity which
supports their primary activity.� (IEA, 2001).
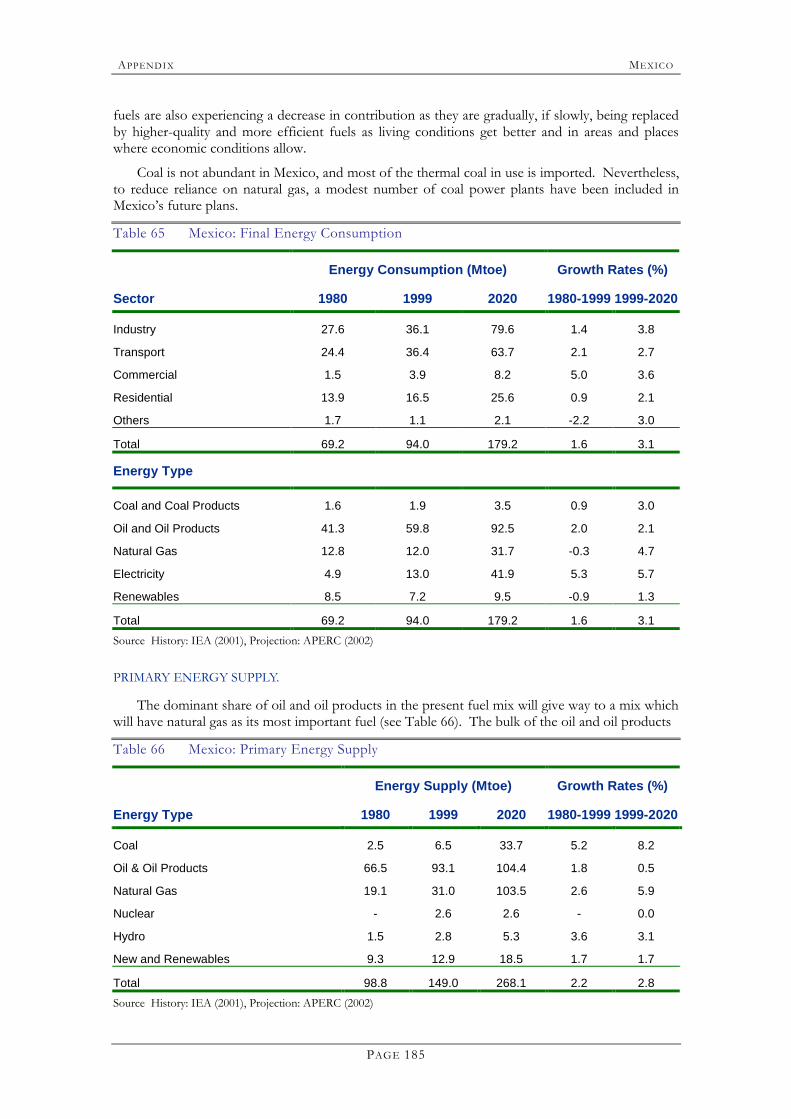
APPENDI X MEXICO
PAGE 185
fuels are also experiencing a decrease in contribution as they are gradually, if slowly, being replaced by higher-quality and more efficient fuels as living conditions get better and in areas and places where economic conditions allow.
Coal is not abundant in Mexico, and most of the thermal coal in use is imported. Nevertheless, to reduce reliance on natural gas, a modest number of coal power plants have been included in Mexico�s future plans.
Table 65 Mexico: Final Energy Consumption
Energy Consumption (Mtoe) Growth Rates (%)
Sector 1980 1999 2020 1980-1999 1999-2020
Industry 27.6 36.1 79.6 1.4 3.8
Transport 24.4 36.4 63.7 2.1 2.7
Commercial 1.5 3.9 8.2 5.0 3.6
Residential 13.9 16.5 25.6 0.9 2.1
Others 1.7 1.1 2.1 -2.2 3.0
Total 69.2 94.0 179.2 1.6 3.1
Energy Type
Coal and Coal Products 1.6 1.9 3.5 0.9 3.0
Oil and Oil Products 41.3 59.8 92.5 2.0 2.1
Natural Gas 12.8 12.0 31.7 -0.3 4.7
Electricity 4.9 13.0 41.9 5.3 5.7
Renewables 8.5 7.2 9.5 -0.9 1.3
Total 69.2 94.0 179.2 1.6 3.1 Source History: IEA (2001), Projection: APERC (2002)
PRIMARY ENERGY SUPPLY.
The dominant share of oil and oil products in the present fuel mix will give way to a mix which will have natural gas as its most important fuel (see Table 66). The bulk of the oil and oil products
Table 66 Mexico: Primary Energy Supply
Energy Supply (Mtoe) Growth Rates (%)
Energy Type 1980 1999 2020 1980-1999 1999-2020
Coal 2.5 6.5 33.7 5.2 8.2
Oil & Oil Products 66.5 93.1 104.4 1.8 0.5
Natural Gas 19.1 31.0 103.5 2.6 5.9
Nuclear - 2.6 2.6 - 0.0
Hydro 1.5 2.8 5.3 3.6 3.1
New and Renewables 9.3 12.9 18.5 1.7 1.7
Total 98.8 149.0 268.1 2.2 2.8 Source History: IEA (2001), Projection: APERC (2002)
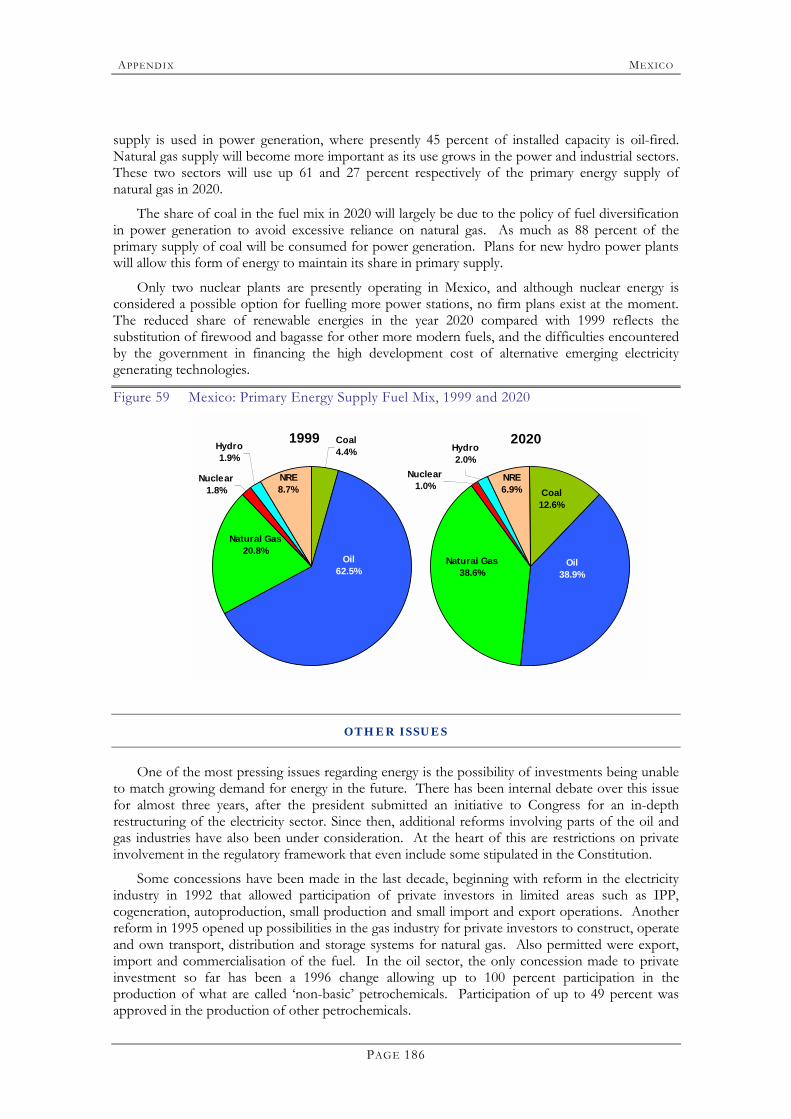
APPENDI X MEXICO
PAGE 186
supply is used in power generation, where presently 45 percent of installed capacity is oil-fired. Natural gas supply will become more important as its use grows in the power and industrial sectors. These two sectors will use up 61 and 27 percent respectively of the primary energy supply of natural gas in 2020.
The share of coal in the fuel mix in 2020 will largely be due to the policy of fuel diversification in power generation to avoid excessive reliance on natural gas. As much as 88 percent of the primary supply of coal will be consumed for power generation. Plans for new hydro power plants will allow this form of energy to maintain its share in primary supply.
Only two nuclear plants are presently operating in Mexico, and although nuclear energy is considered a possible option for fuelling more power stations, no firm plans exist at the moment. The reduced share of renewable energies in the year 2020 compared with 1999 reflects the substitution of firewood and bagasse for other more modern fuels, and the difficulties encountered by the government in financing the high development cost of alternative emerging electricity generating technologies.
Figure 59 Mexico: Primary Energy Supply Fuel Mix, 1999 and 2020
1999
Natural Gas20.8%
NRE8.7%
Coal 4.4%
Oil 62.5%
Nuclear1.8%
Hydro1.9%
2020Hydro2.0%
Nuclear1.0%
Oil 38.9%
Coal 12.6%
NRE6.9%
Natural Gas38.6%
OTHER ISSUES
One of the most pressing issues regarding energy is the possibility of investments being unable to match growing demand for energy in the future. There has been internal debate over this issue for almost three years, after the president submitted an initiative to Congress for an in-depth restructuring of the electricity sector. Since then, additional reforms involving parts of the oil and gas industries have also been under consideration. At the heart of this are restrictions on private involvement in the regulatory framework that even include some stipulated in the Constitution.
Some concessions have been made in the last decade, beginning with reform in the electricity industry in 1992 that allowed participation of private investors in limited areas such as IPP, cogeneration, autoproduction, small production and small import and export operations. Another reform in 1995 opened up possibilities in the gas industry for private investors to construct, operate and own transport, distribution and storage systems for natural gas. Also permitted were export, import and commercialisation of the fuel. In the oil sector, the only concession made to private investment so far has been a 1996 change allowing up to 100 percent participation in the production of what are called �non-basic� petrochemicals. Participation of up to 49 percent was approved in the production of other petrochemicals.
APPENDI X MEXICO
PAGE 187
Still, the government has reiterated that as much as US$20 billion per year will be needed to expand and refurbish the energy infrastructure over the next six years, almost double the amount spent in the previous six years. And owing to the need to use available resources for other priority areas, much effort is being spent on providing more opportunities for private investment here.
The latest proposals for restructuring the energy sector focus on fiscal reforms to reduce the tax burden on the state-owned oil company PEMEX and the main public electric utility CFE, allowing them to allocate more of their profits to infrastructure investments. They also include legal reforms that introduce novel ways to allow private participation in power generation, natural gas production and processing, oil refining, and renewable energy.
Investment requirements will represent an important opportunity for private investors both inside and outside of the economy once the reforms are finally agreed.
ENVIRONMENT
Mexico, in support of international efforts to safeguard the environment, has implemented policies related to its energy operations that will have an impact on fuel use patterns in the future. Some of these include the modernisation of refineries for the improvement of commercial fossil fuels, promotion of the use of natural gas in transport, industry and the residential sector, increased use of natural gas in electricity generation, and the establishment of environmental standards to limit atmospheric emissions and to determine the minimum quality of selected fossil fuels.
REFERENCES
INEGI, National Institute for Statistics, Geography and Information Services, Mexico. www.inegi.gob.mx
“Prospectiva del Mercado de Gas Licuado de Petróleo 2001 – 2010”. Secretaría de Energía. México, 2001.
“Prospectiva del Mercado de Gas Natural 2001 – 2010”. Secretaría de Energía. México, 2001.
“Prospectiva del Sector Eléctrico 2001 – 2010”. Secretaría de Energía. México, 2001.
“Prospectiva de Petrolíferos 2001 – 2010”. Secretaría de Energía. México, 2001.

APPENDI X MEXICO
PAGE 188
APPENDI X NEW ZEALAND
PAGE 189
N E W Z E A L A N D INTROD UCTION
New Zealand is a small island nation in the Southern Pacific comprising an area of 268, 680 square km. Its geography is similar to that of Japan with a significant amount of mountainous terrain and areas prone to seismic activity. Its temperate climate results in modest energy consumption in the residential sector but, on the other hand, its sparsity of population makes for comparatively high demand for private and freight transport. In 1999 the population of New Zealand was approximately 3.81 million.
From being a wealthy postwar economy, the last 20 years have seen relatively modest economic growth averaging 2.4 percent per annum, particularly taken together with a population growth over the same period of 1.1 percent per annum. Its per capita GDP of $14,400 (1990 US$) is low by developed economy standards.
New Zealand has modest energy requirements, being self-sufficient in electricity, gas and coal. Trade in energy products is limited to the export of crude oil and coal, and imports of oil and oil products, with an oil import dependency of around 65 percent. Around one-third of New Zealand�s primary energy supply is from renewable sources.
Over the forecast period, New Zealand�s real GDP is projected to grow annually at 3.24 percent, significantly higher than for the previous 30 years. Projected population growth is lower at 0.4 percent per annum. Taken together, these imply a significant increase in per capita income in the next two decades.
Table 67 New Zealand: Various Indicators
Absolute Levels Growth Rates (%)
1980 1999 2020 1980-1999 1999-2020
GDP (Billion 1990 US$) 34.8 54.9 107.2 2.4 3.2
Population (Millions) 3.1 3.8 4.1 1.1 0.4
GDP per capita 11,196.1 14,399.0 25,881.6 1.3 2.8
Energy Intensitya 264.5 331.0 220.8 1.2 -1.9
Energy per capita (toe/person) 3.0 4.8 5.7 2.5 0.9
CO2 Emissions per capitab 5.8 8.7 9.7 2.2 0.5
CO2 Emissions per $ of GDPc 0.5 0.6 0.4 0.8 -2.3 Source GDP and Population: DRI-WEFA (2001), Energy and CO2 (History): IEA (2001), Energy and CO2 (Projection):
APERC (2002) a toe per million 1990 US$; b tonnes; c kg per 1990 US$
SUMMARY OF FORECAST RESULTS
FINAL ENERGY CONSUMPTION
Final energy consumption is projected to increase from 13.0 Mtoe in 1999 to 16.3 Mtoe in 2020, an average growth rate of 1.1 percent per annum. Since the assumed economic growth rate over the same period is 3.24 percent per annum, this implies a rapidly declining (primary) energy intensity from 331 toe per million 1990 US$ in 1999 to 220.8 in 2020. This is due in part to the
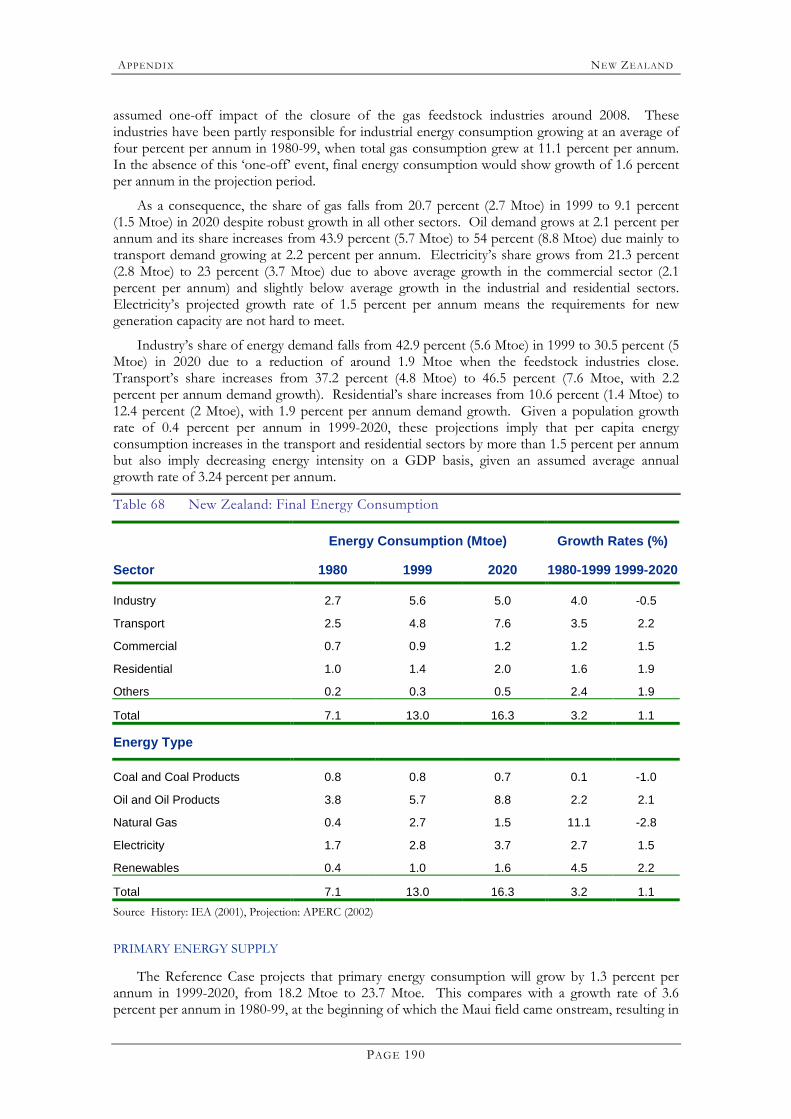
APPENDI X NEW ZEALAND
PAGE 190
assumed one-off impact of the closure of the gas feedstock industries around 2008. These industries have been partly responsible for industrial energy consumption growing at an average of four percent per annum in 1980-99, when total gas consumption grew at 11.1 percent per annum. In the absence of this �one-off� event, final energy consumption would show growth of 1.6 percent per annum in the projection period.
As a consequence, the share of gas falls from 20.7 percent (2.7 Mtoe) in 1999 to 9.1 percent (1.5 Mtoe) in 2020 despite robust growth in all other sectors. Oil demand grows at 2.1 percent per annum and its share increases from 43.9 percent (5.7 Mtoe) to 54 percent (8.8 Mtoe) due mainly to transport demand growing at 2.2 percent per annum. Electricity�s share grows from 21.3 percent (2.8 Mtoe) to 23 percent (3.7 Mtoe) due to above average growth in the commercial sector (2.1 percent per annum) and slightly below average growth in the industrial and residential sectors. Electricity�s projected growth rate of 1.5 percent per annum means the requirements for new generation capacity are not hard to meet.
Industry�s share of energy demand falls from 42.9 percent (5.6 Mtoe) in 1999 to 30.5 percent (5 Mtoe) in 2020 due to a reduction of around 1.9 Mtoe when the feedstock industries close. Transport�s share increases from 37.2 percent (4.8 Mtoe) to 46.5 percent (7.6 Mtoe, with 2.2 percent per annum demand growth). Residential�s share increases from 10.6 percent (1.4 Mtoe) to 12.4 percent (2 Mtoe), with 1.9 percent per annum demand growth. Given a population growth rate of 0.4 percent per annum in 1999-2020, these projections imply that per capita energy consumption increases in the transport and residential sectors by more than 1.5 percent per annum but also imply decreasing energy intensity on a GDP basis, given an assumed average annual growth rate of 3.24 percent per annum.
Table 68 New Zealand: Final Energy Consumption
Energy Consumption (Mtoe) Growth Rates (%)
Sector 1980 1999 2020 1980-1999 1999-2020
Industry 2.7 5.6 5.0 4.0 -0.5
Transport 2.5 4.8 7.6 3.5 2.2
Commercial 0.7 0.9 1.2 1.2 1.5
Residential 1.0 1.4 2.0 1.6 1.9
Others 0.2 0.3 0.5 2.4 1.9
Total 7.1 13.0 16.3 3.2 1.1
Energy Type
Coal and Coal Products 0.8 0.8 0.7 0.1 -1.0
Oil and Oil Products 3.8 5.7 8.8 2.2 2.1
Natural Gas 0.4 2.7 1.5 11.1 -2.8
Electricity 1.7 2.8 3.7 2.7 1.5
Renewables 0.4 1.0 1.6 4.5 2.2
Total 7.1 13.0 16.3 3.2 1.1 Source History: IEA (2001), Projection: APERC (2002)
PRIMARY ENERGY SUPPLY
The Reference Case projects that primary energy consumption will grow by 1.3 percent per annum in 1999-2020, from 18.2 Mtoe to 23.7 Mtoe. This compares with a growth rate of 3.6 percent per annum in 1980-99, at the beginning of which the Maui field came onstream, resulting in
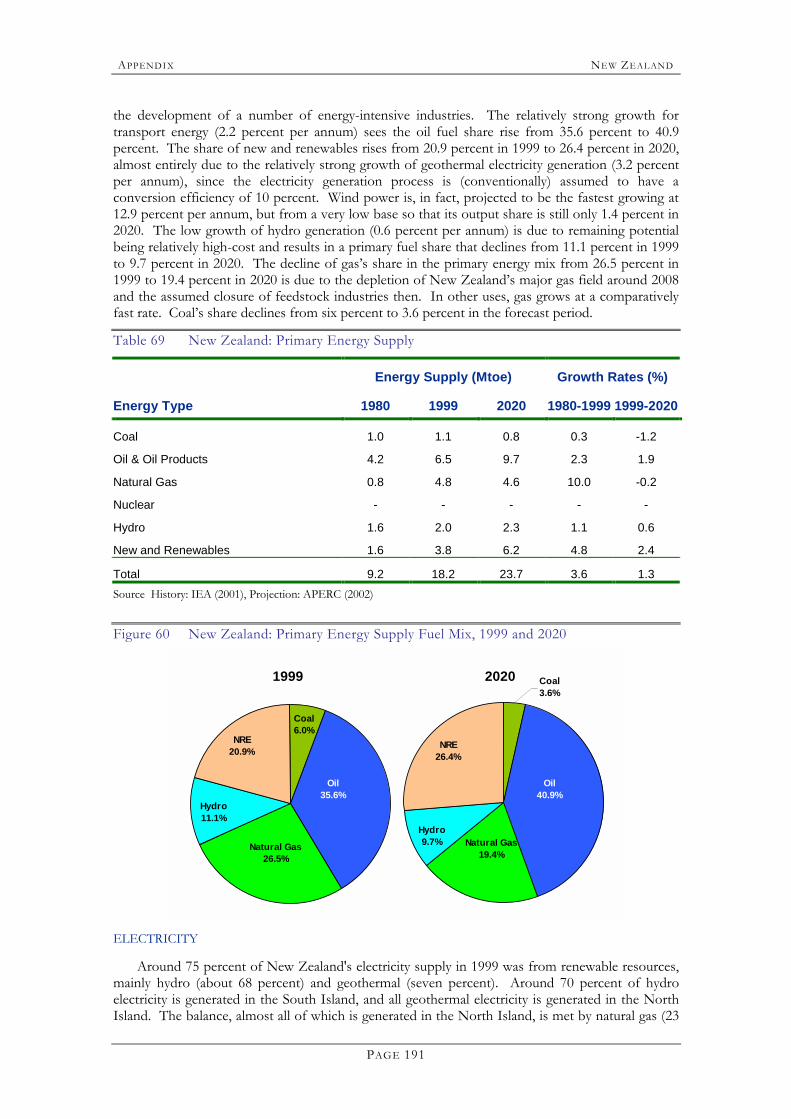
APPENDI X NEW ZEALAND
PAGE 191
the development of a number of energy-intensive industries. The relatively strong growth for transport energy (2.2 percent per annum) sees the oil fuel share rise from 35.6 percent to 40.9 percent. The share of new and renewables rises from 20.9 percent in 1999 to 26.4 percent in 2020, almost entirely due to the relatively strong growth of geothermal electricity generation (3.2 percent per annum), since the electricity generation process is (conventionally) assumed to have a conversion efficiency of 10 percent. Wind power is, in fact, projected to be the fastest growing at 12.9 percent per annum, but from a very low base so that its output share is still only 1.4 percent in 2020. The low growth of hydro generation (0.6 percent per annum) is due to remaining potential being relatively high-cost and results in a primary fuel share that declines from 11.1 percent in 1999 to 9.7 percent in 2020. The decline of gas�s share in the primary energy mix from 26.5 percent in 1999 to 19.4 percent in 2020 is due to the depletion of New Zealand�s major gas field around 2008 and the assumed closure of feedstock industries then. In other uses, gas grows at a comparatively fast rate. Coal�s share declines from six percent to 3.6 percent in the forecast period.
Table 69 New Zealand: Primary Energy Supply
Energy Supply (Mtoe) Growth Rates (%)
Energy Type 1980 1999 2020 1980-1999 1999-2020
Coal 1.0 1.1 0.8 0.3 -1.2
Oil & Oil Products 4.2 6.5 9.7 2.3 1.9
Natural Gas 0.8 4.8 4.6 10.0 -0.2
Nuclear - - - - -
Hydro 1.6 2.0 2.3 1.1 0.6
New and Renewables 1.6 3.8 6.2 4.8 2.4
Total 9.2 18.2 23.7 3.6 1.3 Source History: IEA (2001), Projection: APERC (2002)
Figure 60 New Zealand: Primary Energy Supply Fuel Mix, 1999 and 2020
1999
Natural Gas26.5%
NRE20.9%
Coal 6.0%
Oil 35.6%
Hydro11.1%
2020
Hydro9.7%
Oil 40.9%
Coal 3.6%
NRE26.4%
Natural Gas19.4%
ELECTRICITY
Around 75 percent of New Zealand's electricity supply in 1999 was from renewable resources, mainly hydro (about 68 percent) and geothermal (seven percent). Around 70 percent of hydro electricity is generated in the South Island, and all geothermal electricity is generated in the North Island. The balance, almost all of which is generated in the North Island, is met by natural gas (23
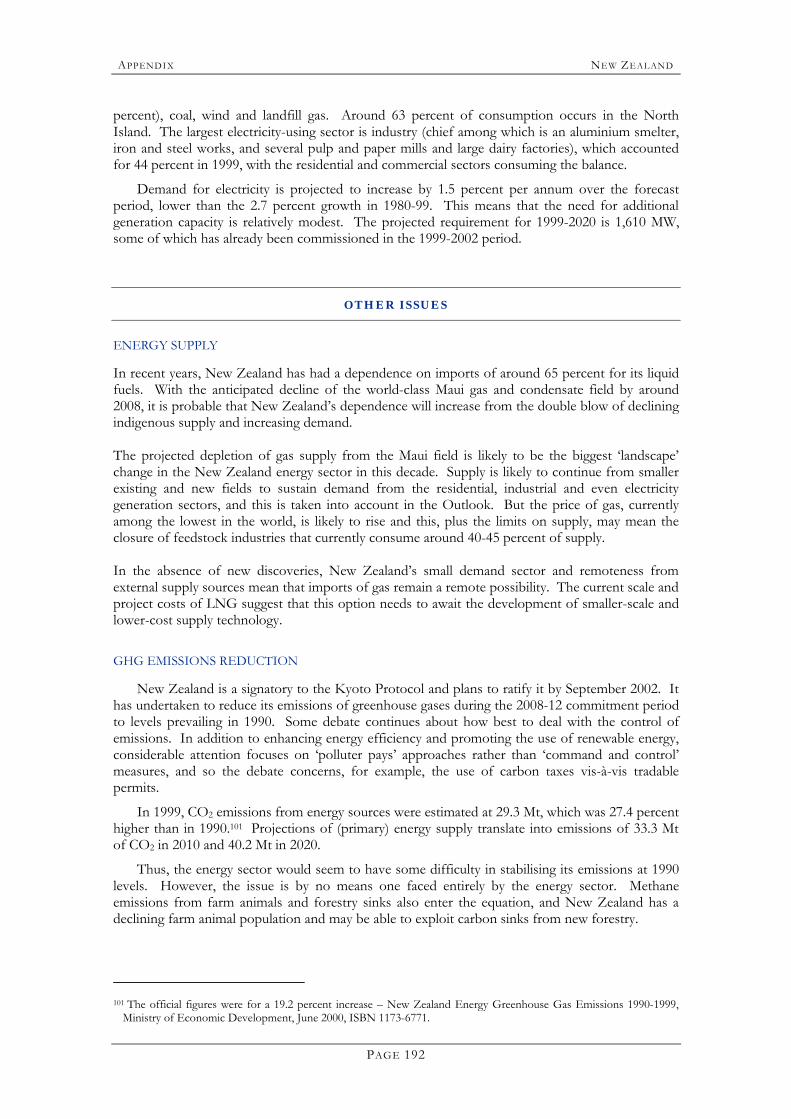
APPENDI X NEW ZEALAND
PAGE 192
percent), coal, wind and landfill gas. Around 63 percent of consumption occurs in the North Island. The largest electricity-using sector is industry (chief among which is an aluminium smelter, iron and steel works, and several pulp and paper mills and large dairy factories), which accounted for 44 percent in 1999, with the residential and commercial sectors consuming the balance.
Demand for electricity is projected to increase by 1.5 percent per annum over the forecast period, lower than the 2.7 percent growth in 1980-99. This means that the need for additional generation capacity is relatively modest. The projected requirement for 1999-2020 is 1,610 MW, some of which has already been commissioned in the 1999-2002 period.
OTHER ISSUES
ENERGY SUPPLY
In recent years, New Zealand has had a dependence on imports of around 65 percent for its liquid fuels. With the anticipated decline of the world-class Maui gas and condensate field by around 2008, it is probable that New Zealand�s dependence will increase from the double blow of declining indigenous supply and increasing demand. The projected depletion of gas supply from the Maui field is likely to be the biggest �landscape� change in the New Zealand energy sector in this decade. Supply is likely to continue from smaller existing and new fields to sustain demand from the residential, industrial and even electricity generation sectors, and this is taken into account in the Outlook. But the price of gas, currently among the lowest in the world, is likely to rise and this, plus the limits on supply, may mean the closure of feedstock industries that currently consume around 40-45 percent of supply. In the absence of new discoveries, New Zealand�s small demand sector and remoteness from external supply sources mean that imports of gas remain a remote possibility. The current scale and project costs of LNG suggest that this option needs to await the development of smaller-scale and lower-cost supply technology.
GHG EMISSIONS REDUCTION
New Zealand is a signatory to the Kyoto Protocol and plans to ratify it by September 2002. It has undertaken to reduce its emissions of greenhouse gases during the 2008-12 commitment period to levels prevailing in 1990. Some debate continues about how best to deal with the control of emissions. In addition to enhancing energy efficiency and promoting the use of renewable energy, considerable attention focuses on �polluter pays� approaches rather than �command and control� measures, and so the debate concerns, for example, the use of carbon taxes vis-à-vis tradable permits.
In 1999, CO2 emissions from energy sources were estimated at 29.3 Mt, which was 27.4 percent higher than in 1990.101 Projections of (primary) energy supply translate into emissions of 33.3 Mt of CO2 in 2010 and 40.2 Mt in 2020.
Thus, the energy sector would seem to have some difficulty in stabilising its emissions at 1990 levels. However, the issue is by no means one faced entirely by the energy sector. Methane emissions from farm animals and forestry sinks also enter the equation, and New Zealand has a declining farm animal population and may be able to exploit carbon sinks from new forestry.
101 The official figures were for a 19.2 percent increase � New Zealand Energy Greenhouse Gas Emissions 1990-1999,
Ministry of Economic Development, June 2000, ISBN 1173-6771.

APPENDI X NEW ZEALAND
PAGE 193
REGULATORY REFORM
New Zealand�s energy sector is significantly deregulated by world standards. Areas where government interventions are still in place include natural monopolies (such as electricity and gas transmission and distribution lines), environmental impacts, and barriers to energy efficiency uptake.
The oil and gas industries, from wellhead to retail, are all owned and operated by the private sector. The government retains ownership of much of the coal and electricity industries through state-owned enterprises (SOEs) that operate according to private-sector principles.
This Outlook anticipates only some �fine-tuning� to improve existing regulatory regimes and structures, and does not envisage privatisation of any of the SOEs in the foreseeable future.

APPENDI X NEW ZEALAND
PAGE 194
APPENDI X PAP UA NEW GUI NEA
PAGE 195
PA P UA N E W G U I N E A INTROD UCTION
Papua New Guinea (PNG) is in the South Pacific and has a land area of 462,840 square km. It is north of Australia and east of Indonesia, and shares the island of New Guinea with the Indonesian territory of Irian Jaya (now West Papua). The population was 5.19 million in 2000.102
Agriculture was the dominant sector of the economy prior to 1970, with export crops such as rubber, coffee, tea, cocoa, oil palm and copra. From the 1970s a mining boom rapidly surpassed the agriculture sector. From 1994 onwards, PNG�s economy entered into a period of decline, with GDP falling by 2.5 percent in 1998 before growing only 0.2 percent in 1999 and 0.9 percent in 2000.
Papua New Guinea is endowed with some indigenous energy resources: abundant biomass supply, hydro electricity generation potential, 397 BCM of natural gas, and light crude oil (61.1 MCM), which it is now exporting. There has also been a recent find of 60 MCM of oil by InterOil Ltd of Canada. Due to the lack of refining facilities, PNG has been dependent on oil product imports.103
Over the forecast period of 1999-2020, Papua New Guinea�s real GDP is projected to grow annually at 1.6 percent. This is down from three percent in 1980-99. According to the Asian Development Bank Outlook 2001104, the economy of Papua New Guinea is likely to recover from the recession which saw it contract between 1997 and 2001 due to poor macroeconomic management, the 1997 El Nino drought, the 1997-98 Asian financial crisis, low commodity prices, delays in gas and nickel-cobalt projects, and the phasing out of several mining activities. It will take at least four to five years to recover under the current government reforms of the economy, which have suffered immensely from corruption and mismanagement.
The Asian Development Bank predicts a similar trend to that of APERC for 2000-05. The declines in GDP experienced in 2000 and 2001 may also continue into 2002 and 2003. GDP growth has been projected at 1.2 percent in 2002 and 1.8 percent in 2003 by the PNG government. For 2004, the growth rate is projected by APERC to be one percent, which is consistent with the ADB�s outlook. For 2005-2020, GDP is expected to stabilise around two percent per year.
In 1999, PNG had real GDP of 1990 US$3.74 billion, inflation of around 13 percent and per capita income of 1990 US$ 795. 105
The population is forecast to increase by 1.9 percent per year, compared with 2.2 percent per year in 1980-99. But this is not a very significant reduction in rate so will not affect the growth in population, which is expected to double by 2020 from the 1980 level. The population increase will affect future energy demand in the household and transport sectors. GDP per capita is expected to shrink by 0.3 percent per year over the forecast period compared with 0.8 percent growth in 1980-99.
Energy intensity, energy per capita, and CO2 emissions per capita are projected to shrink by a yearly 0.1, 0.4 and 0.7 percent respectively.
102 Data from PNG National Statistics Office (2000 National Census) 103 APEC Energy Overview 2001 104 From ADB 105 WB World Development Indicators 2001
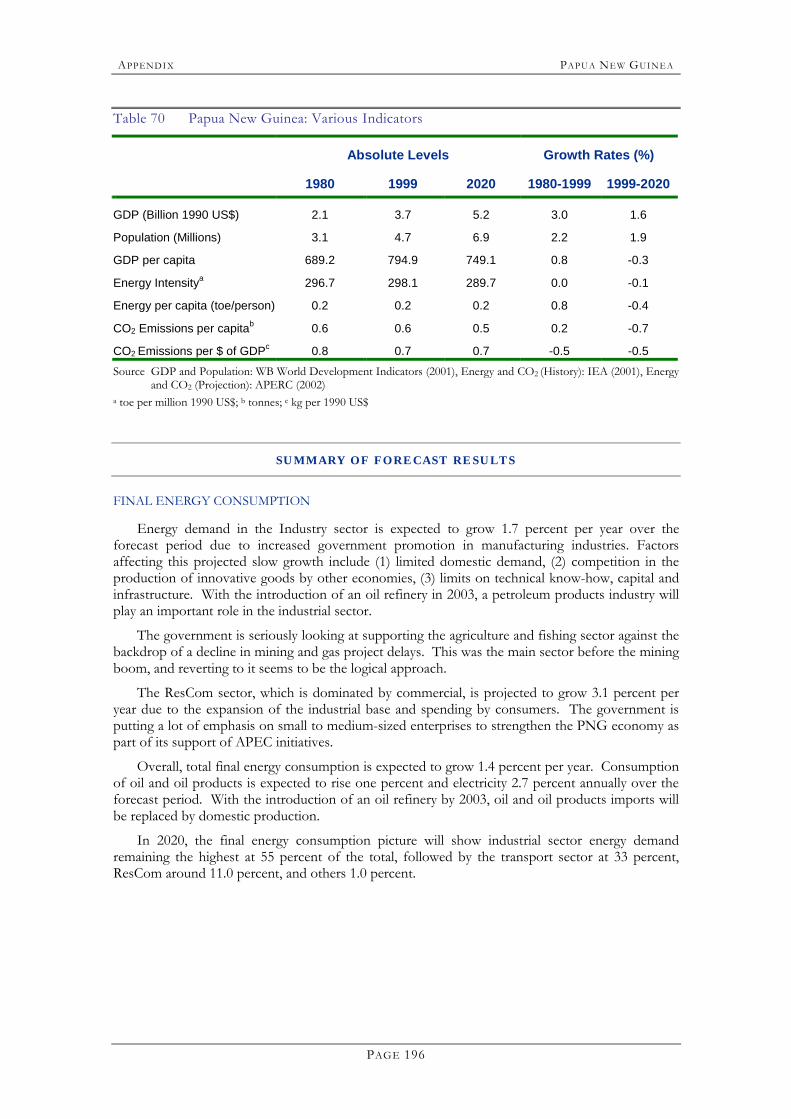
APPENDI X PAP UA NEW GUI NEA
PAGE 196
Table 70 Papua New Guinea: Various Indicators
Absolute Levels Growth Rates (%)
1980 1999 2020 1980-1999 1999-2020
GDP (Billion 1990 US$) 2.1 3.7 5.2 3.0 1.6
Population (Millions) 3.1 4.7 6.9 2.2 1.9
GDP per capita 689.2 794.9 749.1 0.8 -0.3
Energy Intensitya 296.7 298.1 289.7 0.0 -0.1
Energy per capita (toe/person) 0.2 0.2 0.2 0.8 -0.4
CO2 Emissions per capitab 0.6 0.6 0.5 0.2 -0.7
CO2 Emissions per $ of GDPc 0.8 0.7 0.7 -0.5 -0.5 Source GDP and Population: WB World Development Indicators (2001), Energy and CO2 (History): IEA (2001), Energy
and CO2 (Projection): APERC (2002) a toe per million 1990 US$; b tonnes; c kg per 1990 US$
SUMMARY OF FORECAST RESULTS
FINAL ENERGY CONSUMPTION
Energy demand in the Industry sector is expected to grow 1.7 percent per year over the forecast period due to increased government promotion in manufacturing industries. Factors affecting this projected slow growth include (1) limited domestic demand, (2) competition in the production of innovative goods by other economies, (3) limits on technical know-how, capital and infrastructure. With the introduction of an oil refinery in 2003, a petroleum products industry will play an important role in the industrial sector.
The government is seriously looking at supporting the agriculture and fishing sector against the backdrop of a decline in mining and gas project delays. This was the main sector before the mining boom, and reverting to it seems to be the logical approach.
The ResCom sector, which is dominated by commercial, is projected to grow 3.1 percent per year due to the expansion of the industrial base and spending by consumers. The government is putting a lot of emphasis on small to medium-sized enterprises to strengthen the PNG economy as part of its support of APEC initiatives.
Overall, total final energy consumption is expected to grow 1.4 percent per year. Consumption of oil and oil products is expected to rise one percent and electricity 2.7 percent annually over the forecast period. With the introduction of an oil refinery by 2003, oil and oil products imports will be replaced by domestic production.
In 2020, the final energy consumption picture will show industrial sector energy demand remaining the highest at 55 percent of the total, followed by the transport sector at 33 percent, ResCom around 11.0 percent, and others 1.0 percent.
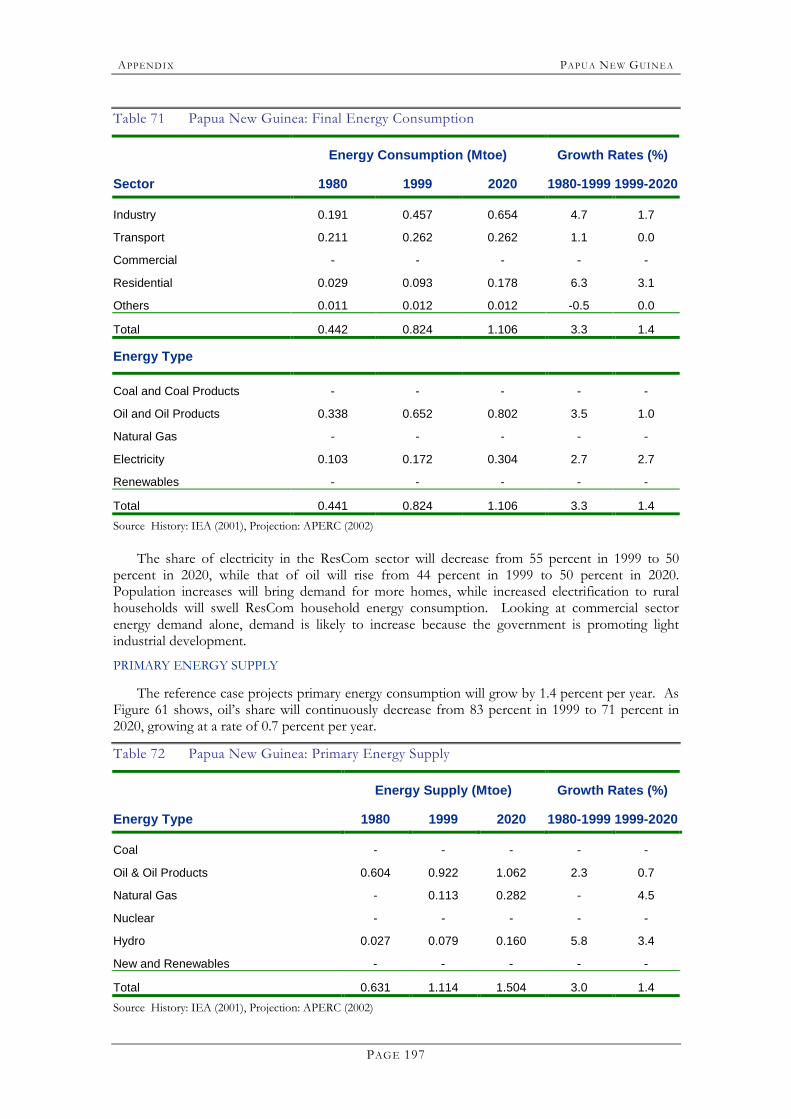
APPENDI X PAP UA NEW GUI NEA
PAGE 197
Table 71 Papua New Guinea: Final Energy Consumption
Energy Consumption (Mtoe) Growth Rates (%)
Sector 1980 1999 2020 1980-1999 1999-2020
Industry 0.191 0.457 0.654 4.7 1.7
Transport 0.211 0.262 0.262 1.1 0.0
Commercial - - - - -
Residential 0.029 0.093 0.178 6.3 3.1
Others 0.011 0.012 0.012 -0.5 0.0
Total 0.442 0.824 1.106 3.3 1.4
Energy Type
Coal and Coal Products - - - - -
Oil and Oil Products 0.338 0.652 0.802 3.5 1.0
Natural Gas - - - - -
Electricity 0.103 0.172 0.304 2.7 2.7
Renewables - - - - -
Total 0.441 0.824 1.106 3.3 1.4 Source History: IEA (2001), Projection: APERC (2002)
The share of electricity in the ResCom sector will decrease from 55 percent in 1999 to 50 percent in 2020, while that of oil will rise from 44 percent in 1999 to 50 percent in 2020. Population increases will bring demand for more homes, while increased electrification to rural households will swell ResCom household energy consumption. Looking at commercial sector energy demand alone, demand is likely to increase because the government is promoting light industrial development.
PRIMARY ENERGY SUPPLY
The reference case projects primary energy consumption will grow by 1.4 percent per year. As Figure 61 shows, oil�s share will continuously decrease from 83 percent in 1999 to 71 percent in 2020, growing at a rate of 0.7 percent per year.
Table 72 Papua New Guinea: Primary Energy Supply
Energy Supply (Mtoe) Growth Rates (%)
Energy Type 1980 1999 2020 1980-1999 1999-2020
Coal - - - - -
Oil & Oil Products 0.604 0.922 1.062 2.3 0.7
Natural Gas - 0.113 0.282 - 4.5
Nuclear - - - - -
Hydro 0.027 0.079 0.160 5.8 3.4
New and Renewables - - - - -
Total 0.631 1.114 1.504 3.0 1.4 Source History: IEA (2001), Projection: APERC (2002)
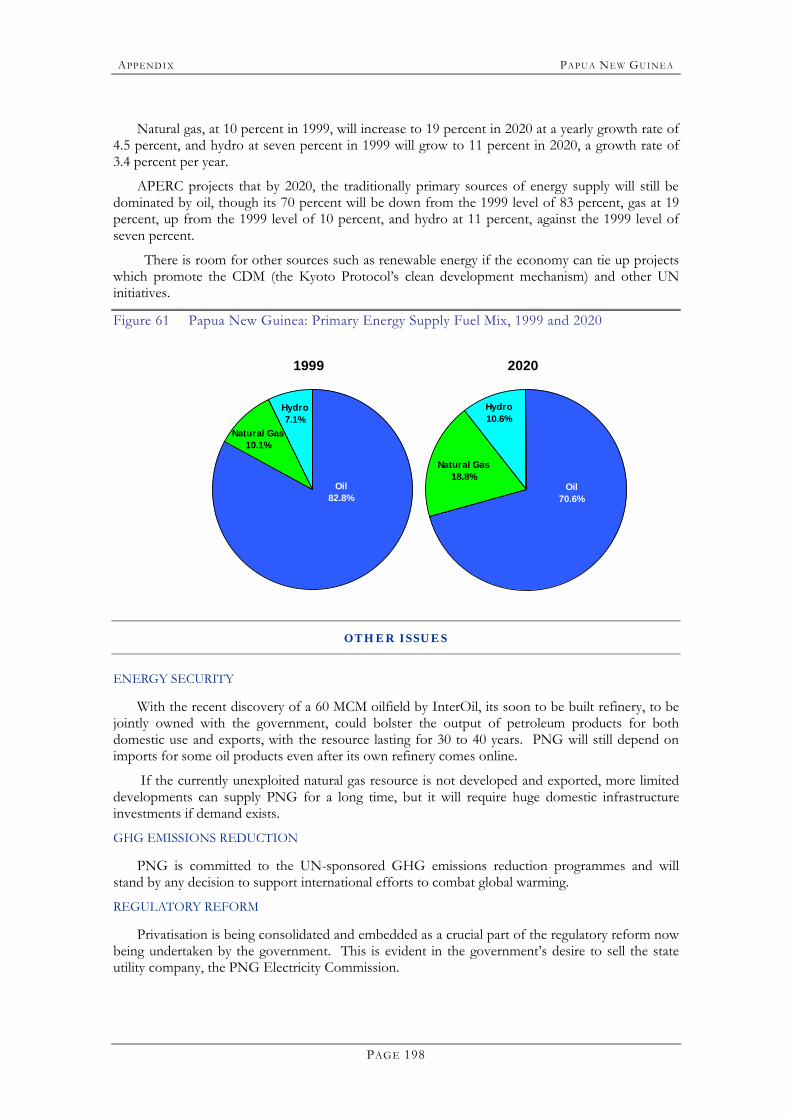
APPENDI X PAP UA NEW GUI NEA
PAGE 198
Natural gas, at 10 percent in 1999, will increase to 19 percent in 2020 at a yearly growth rate of
4.5 percent, and hydro at seven percent in 1999 will grow to 11 percent in 2020, a growth rate of 3.4 percent per year.
APERC projects that by 2020, the traditionally primary sources of energy supply will still be dominated by oil, though its 70 percent will be down from the 1999 level of 83 percent, gas at 19 percent, up from the 1999 level of 10 percent, and hydro at 11 percent, against the 1999 level of seven percent.
There is room for other sources such as renewable energy if the economy can tie up projects which promote the CDM (the Kyoto Protocol�s clean development mechanism) and other UN initiatives.
Figure 61 Papua New Guinea: Primary Energy Supply Fuel Mix, 1999 and 2020
1999
Natural Gas10.1%
Oil 82.8%
Hydro7.1%
2020
Hydro10.6%
Oil 70.6%
Natural Gas18.8%
OTHER ISSUES
ENERGY SECURITY
With the recent discovery of a 60 MCM oilfield by InterOil, its soon to be built refinery, to be jointly owned with the government, could bolster the output of petroleum products for both domestic use and exports, with the resource lasting for 30 to 40 years. PNG will still depend on imports for some oil products even after its own refinery comes online.
If the currently unexploited natural gas resource is not developed and exported, more limited developments can supply PNG for a long time, but it will require huge domestic infrastructure investments if demand exists.
GHG EMISSIONS REDUCTION
PNG is committed to the UN-sponsored GHG emissions reduction programmes and will stand by any decision to support international efforts to combat global warming.
REGULATORY REFORM
Privatisation is being consolidated and embedded as a crucial part of the regulatory reform now being undertaken by the government. This is evident in the government�s desire to sell the state utility company, the PNG Electricity Commission.
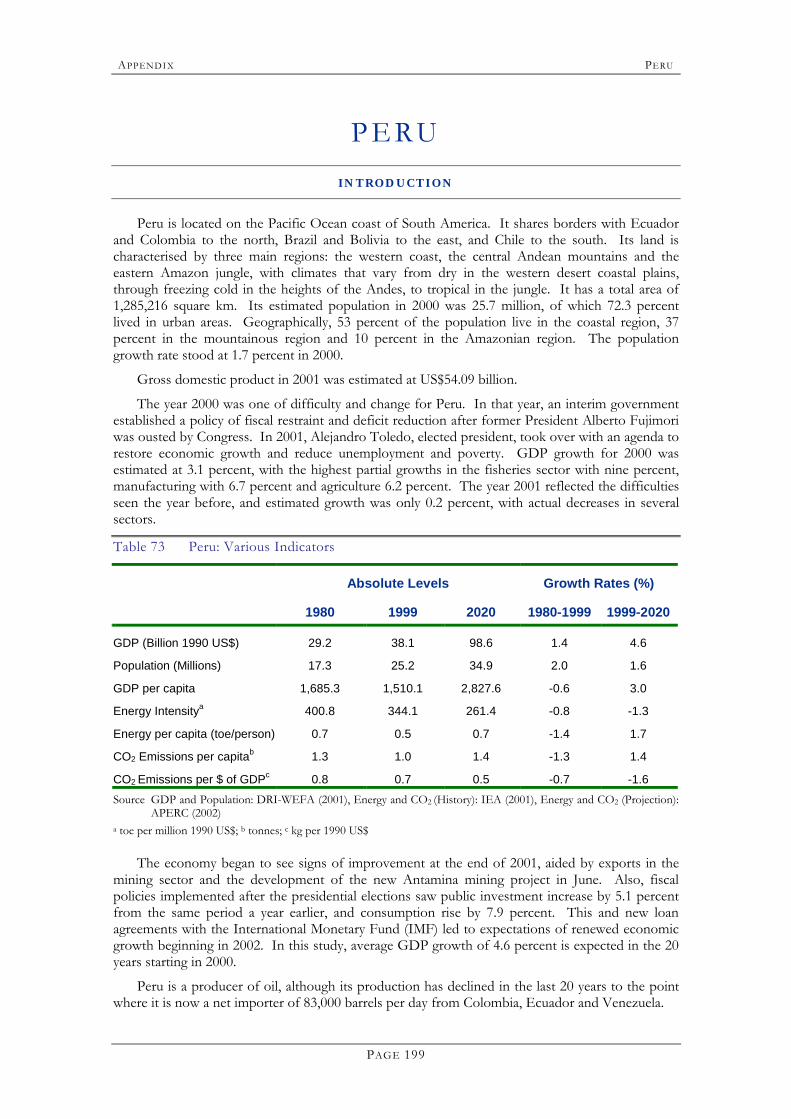
APPENDI X PERU
PAGE 199
P E RU INTROD UCTION
Peru is located on the Pacific Ocean coast of South America. It shares borders with Ecuador and Colombia to the north, Brazil and Bolivia to the east, and Chile to the south. Its land is characterised by three main regions: the western coast, the central Andean mountains and the eastern Amazon jungle, with climates that vary from dry in the western desert coastal plains, through freezing cold in the heights of the Andes, to tropical in the jungle. It has a total area of 1,285,216 square km. Its estimated population in 2000 was 25.7 million, of which 72.3 percent lived in urban areas. Geographically, 53 percent of the population live in the coastal region, 37 percent in the mountainous region and 10 percent in the Amazonian region. The population growth rate stood at 1.7 percent in 2000.
Gross domestic product in 2001 was estimated at US$54.09 billion.
The year 2000 was one of difficulty and change for Peru. In that year, an interim government established a policy of fiscal restraint and deficit reduction after former President Alberto Fujimori was ousted by Congress. In 2001, Alejandro Toledo, elected president, took over with an agenda to restore economic growth and reduce unemployment and poverty. GDP growth for 2000 was estimated at 3.1 percent, with the highest partial growths in the fisheries sector with nine percent, manufacturing with 6.7 percent and agriculture 6.2 percent. The year 2001 reflected the difficulties seen the year before, and estimated growth was only 0.2 percent, with actual decreases in several sectors.
Table 73 Peru: Various Indicators
Absolute Levels Growth Rates (%)
1980 1999 2020 1980-1999 1999-2020
GDP (Billion 1990 US$) 29.2 38.1 98.6 1.4 4.6
Population (Millions) 17.3 25.2 34.9 2.0 1.6
GDP per capita 1,685.3 1,510.1 2,827.6 -0.6 3.0
Energy Intensitya 400.8 344.1 261.4 -0.8 -1.3
Energy per capita (toe/person) 0.7 0.5 0.7 -1.4 1.7
CO2 Emissions per capitab 1.3 1.0 1.4 -1.3 1.4
CO2 Emissions per $ of GDPc 0.8 0.7 0.5 -0.7 -1.6 Source GDP and Population: DRI-WEFA (2001), Energy and CO2 (History): IEA (2001), Energy and CO2 (Projection):
APERC (2002) a toe per million 1990 US$; b tonnes; c kg per 1990 US$
The economy began to see signs of improvement at the end of 2001, aided by exports in the mining sector and the development of the new Antamina mining project in June. Also, fiscal policies implemented after the presidential elections saw public investment increase by 5.1 percent from the same period a year earlier, and consumption rise by 7.9 percent. This and new loan agreements with the International Monetary Fund (IMF) led to expectations of renewed economic growth beginning in 2002. In this study, average GDP growth of 4.6 percent is expected in the 20 years starting in 2000.
Peru is a producer of oil, although its production has declined in the last 20 years to the point where it is now a net importer of 83,000 barrels per day from Colombia, Ecuador and Venezuela.
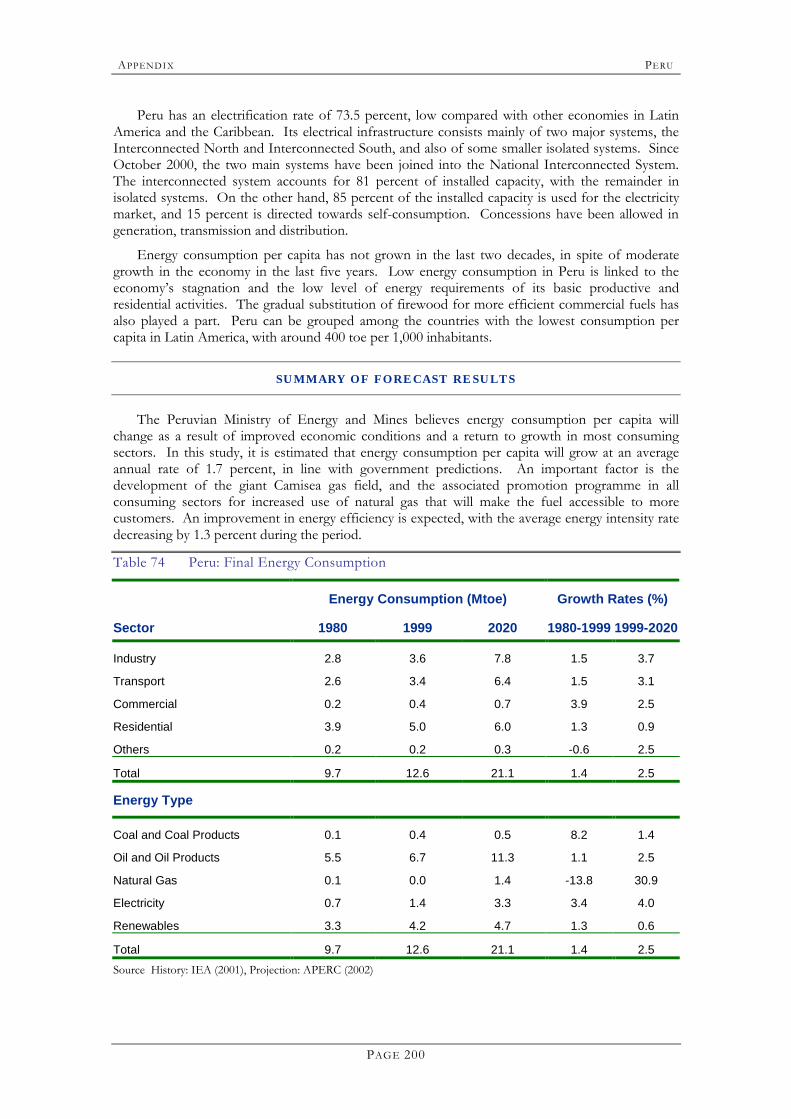
APPENDI X PERU
PAGE 200
Peru has an electrification rate of 73.5 percent, low compared with other economies in Latin America and the Caribbean. Its electrical infrastructure consists mainly of two major systems, the Interconnected North and Interconnected South, and also of some smaller isolated systems. Since October 2000, the two main systems have been joined into the National Interconnected System. The interconnected system accounts for 81 percent of installed capacity, with the remainder in isolated systems. On the other hand, 85 percent of the installed capacity is used for the electricity market, and 15 percent is directed towards self-consumption. Concessions have been allowed in generation, transmission and distribution.
Energy consumption per capita has not grown in the last two decades, in spite of moderate growth in the economy in the last five years. Low energy consumption in Peru is linked to the economy�s stagnation and the low level of energy requirements of its basic productive and residential activities. The gradual substitution of firewood for more efficient commercial fuels has also played a part. Peru can be grouped among the countries with the lowest consumption per capita in Latin America, with around 400 toe per 1,000 inhabitants.
SUMMARY OF FORECAST RESULTS
The Peruvian Ministry of Energy and Mines believes energy consumption per capita will change as a result of improved economic conditions and a return to growth in most consuming sectors. In this study, it is estimated that energy consumption per capita will grow at an average annual rate of 1.7 percent, in line with government predictions. An important factor is the development of the giant Camisea gas field, and the associated promotion programme in all consuming sectors for increased use of natural gas that will make the fuel accessible to more customers. An improvement in energy efficiency is expected, with the average energy intensity rate decreasing by 1.3 percent during the period.
Table 74 Peru: Final Energy Consumption
Energy Consumption (Mtoe) Growth Rates (%)
Sector 1980 1999 2020 1980-1999 1999-2020
Industry 2.8 3.6 7.8 1.5 3.7
Transport 2.6 3.4 6.4 1.5 3.1
Commercial 0.2 0.4 0.7 3.9 2.5
Residential 3.9 5.0 6.0 1.3 0.9
Others 0.2 0.2 0.3 -0.6 2.5
Total 9.7 12.6 21.1 1.4 2.5
Energy Type
Coal and Coal Products 0.1 0.4 0.5 8.2 1.4
Oil and Oil Products 5.5 6.7 11.3 1.1 2.5
Natural Gas 0.1 0.0 1.4 -13.8 30.9
Electricity 0.7 1.4 3.3 3.4 4.0
Renewables 3.3 4.2 4.7 1.3 0.6
Total 9.7 12.6 21.1 1.4 2.5 Source History: IEA (2001), Projection: APERC (2002)
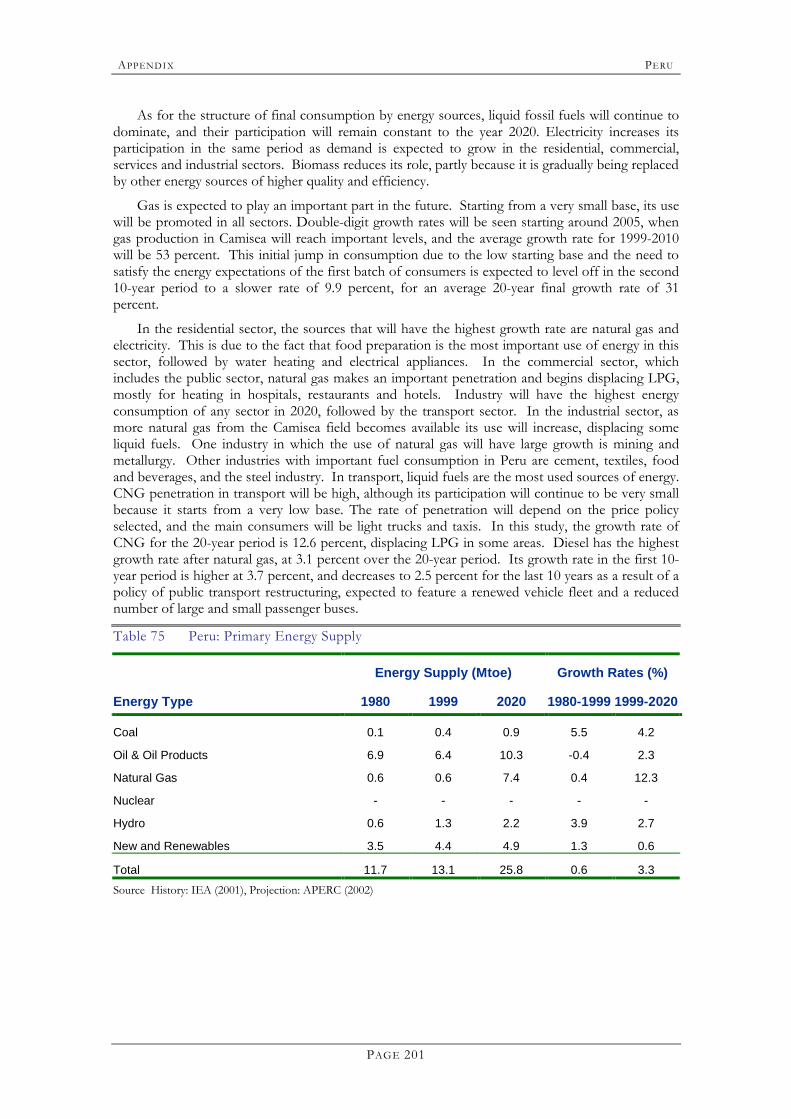
APPENDI X PERU
PAGE 201
As for the structure of final consumption by energy sources, liquid fossil fuels will continue to dominate, and their participation will remain constant to the year 2020. Electricity increases its participation in the same period as demand is expected to grow in the residential, commercial, services and industrial sectors. Biomass reduces its role, partly because it is gradually being replaced by other energy sources of higher quality and efficiency.
Gas is expected to play an important part in the future. Starting from a very small base, its use will be promoted in all sectors. Double-digit growth rates will be seen starting around 2005, when gas production in Camisea will reach important levels, and the average growth rate for 1999-2010 will be 53 percent. This initial jump in consumption due to the low starting base and the need to satisfy the energy expectations of the first batch of consumers is expected to level off in the second 10-year period to a slower rate of 9.9 percent, for an average 20-year final growth rate of 31 percent.
In the residential sector, the sources that will have the highest growth rate are natural gas and electricity. This is due to the fact that food preparation is the most important use of energy in this sector, followed by water heating and electrical appliances. In the commercial sector, which includes the public sector, natural gas makes an important penetration and begins displacing LPG, mostly for heating in hospitals, restaurants and hotels. Industry will have the highest energy consumption of any sector in 2020, followed by the transport sector. In the industrial sector, as more natural gas from the Camisea field becomes available its use will increase, displacing some liquid fuels. One industry in which the use of natural gas will have large growth is mining and metallurgy. Other industries with important fuel consumption in Peru are cement, textiles, food and beverages, and the steel industry. In transport, liquid fuels are the most used sources of energy. CNG penetration in transport will be high, although its participation will continue to be very small because it starts from a very low base. The rate of penetration will depend on the price policy selected, and the main consumers will be light trucks and taxis. In this study, the growth rate of CNG for the 20-year period is 12.6 percent, displacing LPG in some areas. Diesel has the highest growth rate after natural gas, at 3.1 percent over the 20-year period. Its growth rate in the first 10-year period is higher at 3.7 percent, and decreases to 2.5 percent for the last 10 years as a result of a policy of public transport restructuring, expected to feature a renewed vehicle fleet and a reduced number of large and small passenger buses.
Table 75 Peru: Primary Energy Supply
Energy Supply (Mtoe) Growth Rates (%)
Energy Type 1980 1999 2020 1980-1999 1999-2020
Coal 0.1 0.4 0.9 5.5 4.2
Oil & Oil Products 6.9 6.4 10.3 -0.4 2.3
Natural Gas 0.6 0.6 7.4 0.4 12.3
Nuclear - - - - -
Hydro 0.6 1.3 2.2 3.9 2.7
New and Renewables 3.5 4.4 4.9 1.3 0.6
Total 11.7 13.1 25.8 0.6 3.3 Source History: IEA (2001), Projection: APERC (2002)
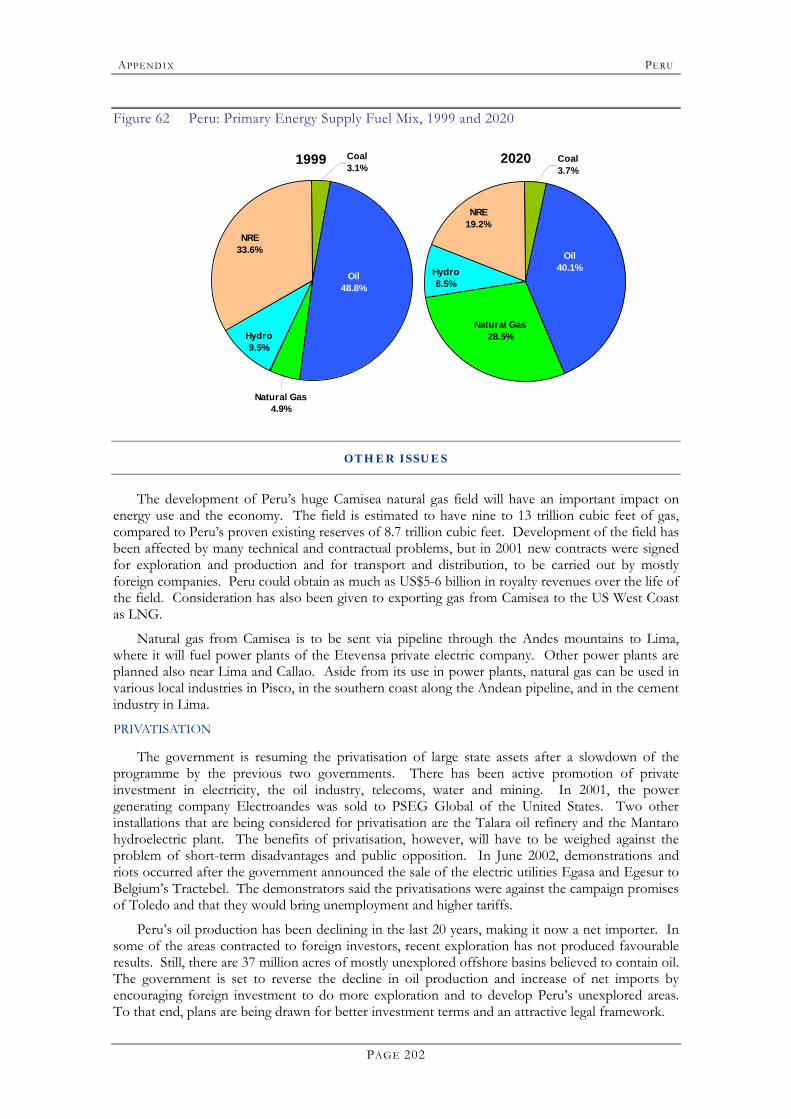
APPENDI X PERU
PAGE 202
Figure 62 Peru: Primary Energy Supply Fuel Mix, 1999 and 2020
1999
Natural Gas4.9%
NRE33.6%
Coal 3.1%
Oil 48.8%
Hydro9.5%
2020
Hydro8.5%
Oil 40.1%
Coal 3.7%
NRE19.2%
Natural Gas28.5%
OTHER ISSUES
The development of Peru�s huge Camisea natural gas field will have an important impact on energy use and the economy. The field is estimated to have nine to 13 trillion cubic feet of gas, compared to Peru�s proven existing reserves of 8.7 trillion cubic feet. Development of the field has been affected by many technical and contractual problems, but in 2001 new contracts were signed for exploration and production and for transport and distribution, to be carried out by mostly foreign companies. Peru could obtain as much as US$5-6 billion in royalty revenues over the life of the field. Consideration has also been given to exporting gas from Camisea to the US West Coast as LNG.
Natural gas from Camisea is to be sent via pipeline through the Andes mountains to Lima, where it will fuel power plants of the Etevensa private electric company. Other power plants are planned also near Lima and Callao. Aside from its use in power plants, natural gas can be used in various local industries in Pisco, in the southern coast along the Andean pipeline, and in the cement industry in Lima.
PRIVATISATION
The government is resuming the privatisation of large state assets after a slowdown of the programme by the previous two governments. There has been active promotion of private investment in electricity, the oil industry, telecoms, water and mining. In 2001, the power generating company Electroandes was sold to PSEG Global of the United States. Two other installations that are being considered for privatisation are the Talara oil refinery and the Mantaro hydroelectric plant. The benefits of privatisation, however, will have to be weighed against the problem of short-term disadvantages and public opposition. In June 2002, demonstrations and riots occurred after the government announced the sale of the electric utilities Egasa and Egesur to Belgium�s Tractebel. The demonstrators said the privatisations were against the campaign promises of Toledo and that they would bring unemployment and higher tariffs.
Peru�s oil production has been declining in the last 20 years, making it now a net importer. In some of the areas contracted to foreign investors, recent exploration has not produced favourable results. Still, there are 37 million acres of mostly unexplored offshore basins believed to contain oil. The government is set to reverse the decline in oil production and increase of net imports by encouraging foreign investment to do more exploration and to develop Peru�s unexplored areas. To that end, plans are being drawn for better investment terms and an attractive legal framework.
APPENDI X PERU
PAGE 203
REFERENCES
“Anuario Estadístico sobre el Mercado de Valores 2001”. Comisión Nacional Supervisora de Empresas y
Valores. Perú, 2001.
“Marco Macroeconómico Multianual 2002-2004�. Ministerio de Economía y Finanzas. Peru, 2001.
“Plan Referencial de Energía al 2015”. Ministerio de Energía y Minas. Oficina Técnica de Energía. Perú, 2002.
“Plan Referencial de Electricidad 2001 – 2010”. Ministerio de Energía y Minas. Perú, 2001.
“Plan Referencial de Hidrocarburos 2001”. Ministerio de Energía y Minas. Perú, 2001.
“Country Analysis Briefs: Peru”. Energy Information Administration. March 2002.

APPENDI X PERU
PAGE 204
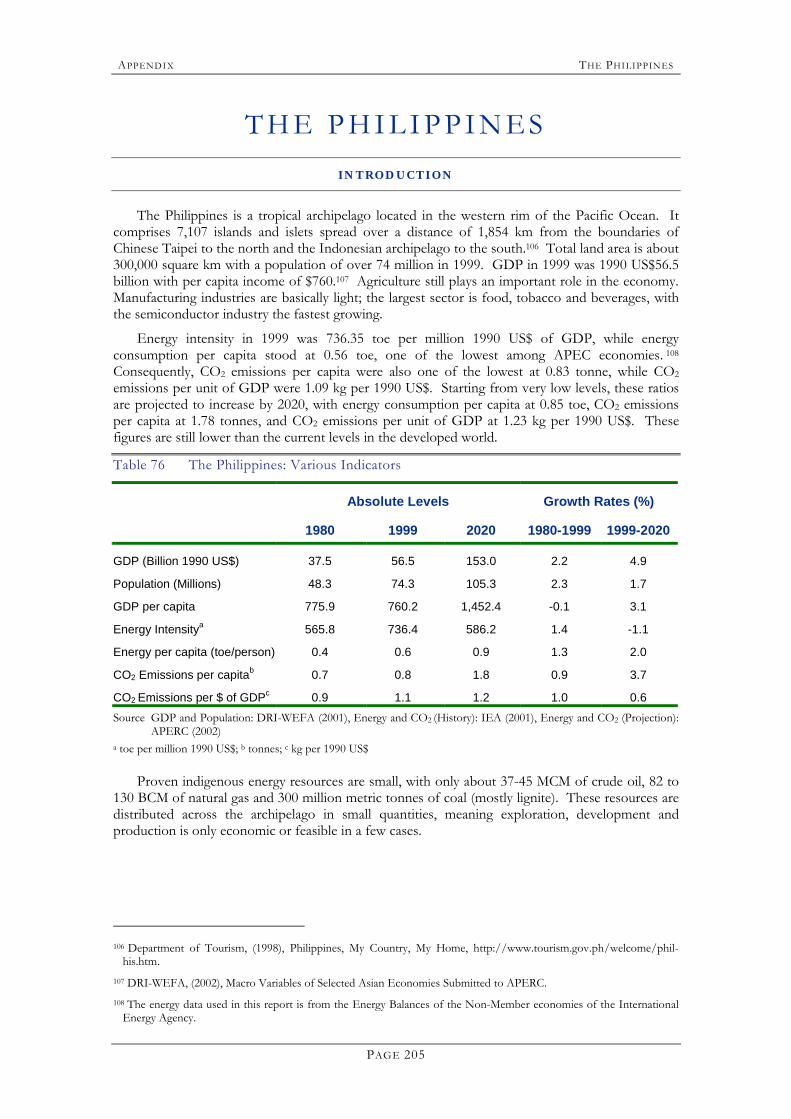
APPENDI X THE PHI LIPPIN ES
PAGE 205
T H E P H I L I P P I N E S INTROD UCTION
The Philippines is a tropical archipelago located in the western rim of the Pacific Ocean. It comprises 7,107 islands and islets spread over a distance of 1,854 km from the boundaries of Chinese Taipei to the north and the Indonesian archipelago to the south.106 Total land area is about 300,000 square km with a population of over 74 million in 1999. GDP in 1999 was 1990 US$56.5 billion with per capita income of $760.107 Agriculture still plays an important role in the economy. Manufacturing industries are basically light; the largest sector is food, tobacco and beverages, with the semiconductor industry the fastest growing.
Energy intensity in 1999 was 736.35 toe per million 1990 US$ of GDP, while energy consumption per capita stood at 0.56 toe, one of the lowest among APEC economies. 108 Consequently, CO2 emissions per capita were also one of the lowest at 0.83 tonne, while CO2 emissions per unit of GDP were 1.09 kg per 1990 US$. Starting from very low levels, these ratios are projected to increase by 2020, with energy consumption per capita at 0.85 toe, CO2 emissions per capita at 1.78 tonnes, and CO2 emissions per unit of GDP at 1.23 kg per 1990 US$. These figures are still lower than the current levels in the developed world.
Table 76 The Philippines: Various Indicators
Absolute Levels Growth Rates (%)
1980 1999 2020 1980-1999 1999-2020
GDP (Billion 1990 US$) 37.5 56.5 153.0 2.2 4.9
Population (Millions) 48.3 74.3 105.3 2.3 1.7
GDP per capita 775.9 760.2 1,452.4 -0.1 3.1
Energy Intensitya 565.8 736.4 586.2 1.4 -1.1
Energy per capita (toe/person) 0.4 0.6 0.9 1.3 2.0
CO2 Emissions per capitab 0.7 0.8 1.8 0.9 3.7
CO2 Emissions per $ of GDPc 0.9 1.1 1.2 1.0 0.6 Source GDP and Population: DRI-WEFA (2001), Energy and CO2 (History): IEA (2001), Energy and CO2 (Projection):
APERC (2002) a toe per million 1990 US$; b tonnes; c kg per 1990 US$
Proven indigenous energy resources are small, with only about 37-45 MCM of crude oil, 82 to 130 BCM of natural gas and 300 million metric tonnes of coal (mostly lignite). These resources are distributed across the archipelago in small quantities, meaning exploration, development and production is only economic or feasible in a few cases.
106 Department of Tourism, (1998), Philippines, My Country, My Home, http://www.tourism.gov.ph/welcome/phil-
his.htm. 107 DRI-WEFA, (2002), Macro Variables of Selected Asian Economies Submitted to APERC. 108 The energy data used in this report is from the Energy Balances of the Non-Member economies of the International
Energy Agency.
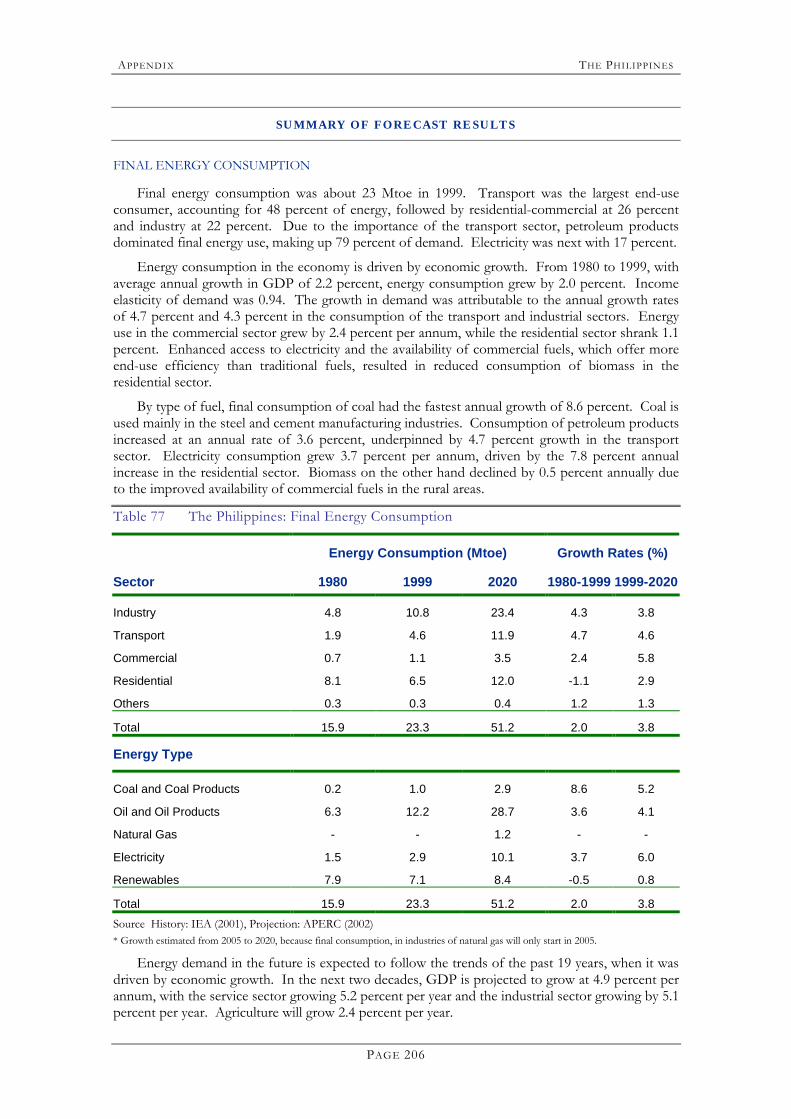
APPENDI X THE PHI LIPPIN ES
PAGE 206
SUMMARY OF FORECAST RESULTS
FINAL ENERGY CONSUMPTION
Final energy consumption was about 23 Mtoe in 1999. Transport was the largest end-use consumer, accounting for 48 percent of energy, followed by residential-commercial at 26 percent and industry at 22 percent. Due to the importance of the transport sector, petroleum products dominated final energy use, making up 79 percent of demand. Electricity was next with 17 percent.
Energy consumption in the economy is driven by economic growth. From 1980 to 1999, with average annual growth in GDP of 2.2 percent, energy consumption grew by 2.0 percent. Income elasticity of demand was 0.94. The growth in demand was attributable to the annual growth rates of 4.7 percent and 4.3 percent in the consumption of the transport and industrial sectors. Energy use in the commercial sector grew by 2.4 percent per annum, while the residential sector shrank 1.1 percent. Enhanced access to electricity and the availability of commercial fuels, which offer more end-use efficiency than traditional fuels, resulted in reduced consumption of biomass in the residential sector.
By type of fuel, final consumption of coal had the fastest annual growth of 8.6 percent. Coal is used mainly in the steel and cement manufacturing industries. Consumption of petroleum products increased at an annual rate of 3.6 percent, underpinned by 4.7 percent growth in the transport sector. Electricity consumption grew 3.7 percent per annum, driven by the 7.8 percent annual increase in the residential sector. Biomass on the other hand declined by 0.5 percent annually due to the improved availability of commercial fuels in the rural areas.
Table 77 The Philippines: Final Energy Consumption
Energy Consumption (Mtoe) Growth Rates (%)
Sector 1980 1999 2020 1980-1999 1999-2020
Industry 4.8 10.8 23.4 4.3 3.8
Transport 1.9 4.6 11.9 4.7 4.6
Commercial 0.7 1.1 3.5 2.4 5.8
Residential 8.1 6.5 12.0 -1.1 2.9
Others 0.3 0.3 0.4 1.2 1.3
Total 15.9 23.3 51.2 2.0 3.8
Energy Type
Coal and Coal Products 0.2 1.0 2.9 8.6 5.2
Oil and Oil Products 6.3 12.2 28.7 3.6 4.1
Natural Gas - - 1.2 - -
Electricity 1.5 2.9 10.1 3.7 6.0
Renewables 7.9 7.1 8.4 -0.5 0.8
Total 15.9 23.3 51.2 2.0 3.8 Source History: IEA (2001), Projection: APERC (2002) * Growth estimated from 2005 to 2020, because final consumption, in industries of natural gas will only start in 2005.
Energy demand in the future is expected to follow the trends of the past 19 years, when it was driven by economic growth. In the next two decades, GDP is projected to grow at 4.9 percent per annum, with the service sector growing 5.2 percent per year and the industrial sector growing by 5.1 percent per year. Agriculture will grow 2.4 percent per year.
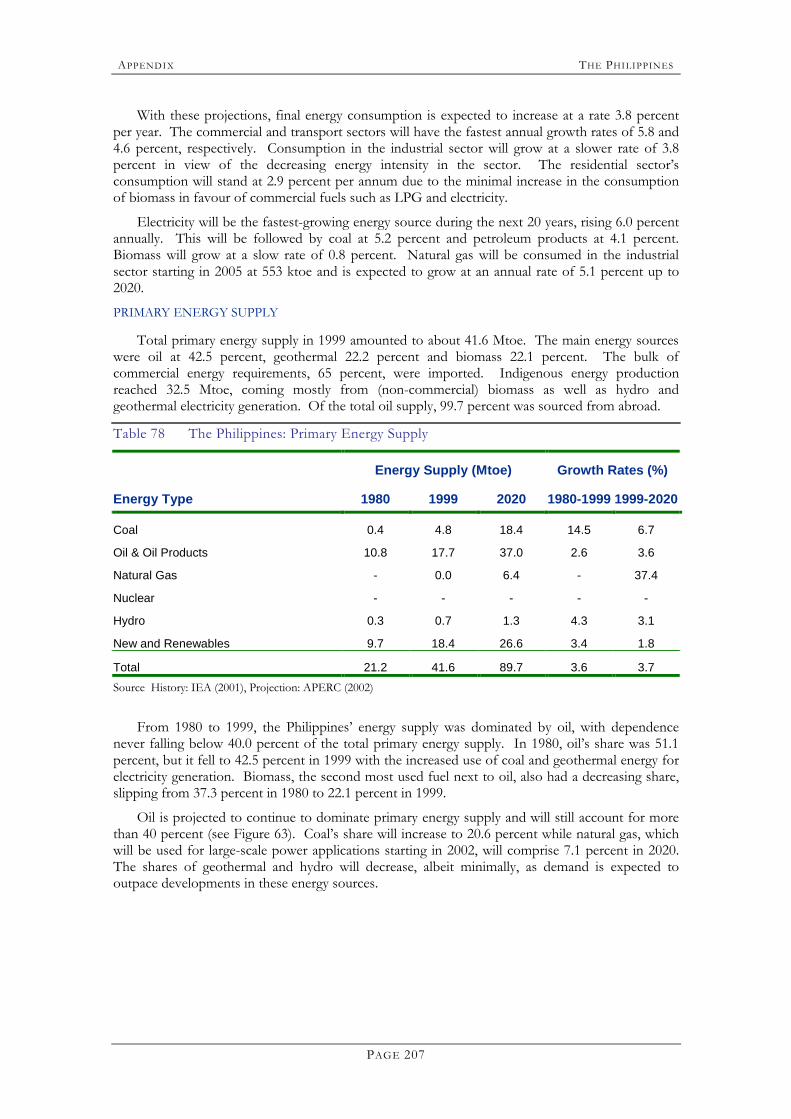
APPENDI X THE PHI LIPPIN ES
PAGE 207
With these projections, final energy consumption is expected to increase at a rate 3.8 percent per year. The commercial and transport sectors will have the fastest annual growth rates of 5.8 and 4.6 percent, respectively. Consumption in the industrial sector will grow at a slower rate of 3.8 percent in view of the decreasing energy intensity in the sector. The residential sector�s consumption will stand at 2.9 percent per annum due to the minimal increase in the consumption of biomass in favour of commercial fuels such as LPG and electricity.
Electricity will be the fastest-growing energy source during the next 20 years, rising 6.0 percent annually. This will be followed by coal at 5.2 percent and petroleum products at 4.1 percent. Biomass will grow at a slow rate of 0.8 percent. Natural gas will be consumed in the industrial sector starting in 2005 at 553 ktoe and is expected to grow at an annual rate of 5.1 percent up to 2020.
PRIMARY ENERGY SUPPLY
Total primary energy supply in 1999 amounted to about 41.6 Mtoe. The main energy sources were oil at 42.5 percent, geothermal 22.2 percent and biomass 22.1 percent. The bulk of commercial energy requirements, 65 percent, were imported. Indigenous energy production reached 32.5 Mtoe, coming mostly from (non-commercial) biomass as well as hydro and geothermal electricity generation. Of the total oil supply, 99.7 percent was sourced from abroad.
Table 78 The Philippines: Primary Energy Supply
Energy Supply (Mtoe) Growth Rates (%)
Energy Type 1980 1999 2020 1980-1999 1999-2020
Coal 0.4 4.8 18.4 14.5 6.7
Oil & Oil Products 10.8 17.7 37.0 2.6 3.6
Natural Gas - 0.0 6.4 - 37.4
Nuclear - - - - -
Hydro 0.3 0.7 1.3 4.3 3.1
New and Renewables 9.7 18.4 26.6 3.4 1.8
Total 21.2 41.6 89.7 3.6 3.7 Source History: IEA (2001), Projection: APERC (2002)
From 1980 to 1999, the Philippines� energy supply was dominated by oil, with dependence never falling below 40.0 percent of the total primary energy supply. In 1980, oil�s share was 51.1 percent, but it fell to 42.5 percent in 1999 with the increased use of coal and geothermal energy for electricity generation. Biomass, the second most used fuel next to oil, also had a decreasing share, slipping from 37.3 percent in 1980 to 22.1 percent in 1999.
Oil is projected to continue to dominate primary energy supply and will still account for more than 40 percent (see Figure 63). Coal�s share will increase to 20.6 percent while natural gas, which will be used for large-scale power applications starting in 2002, will comprise 7.1 percent in 2020. The shares of geothermal and hydro will decrease, albeit minimally, as demand is expected to outpace developments in these energy sources.
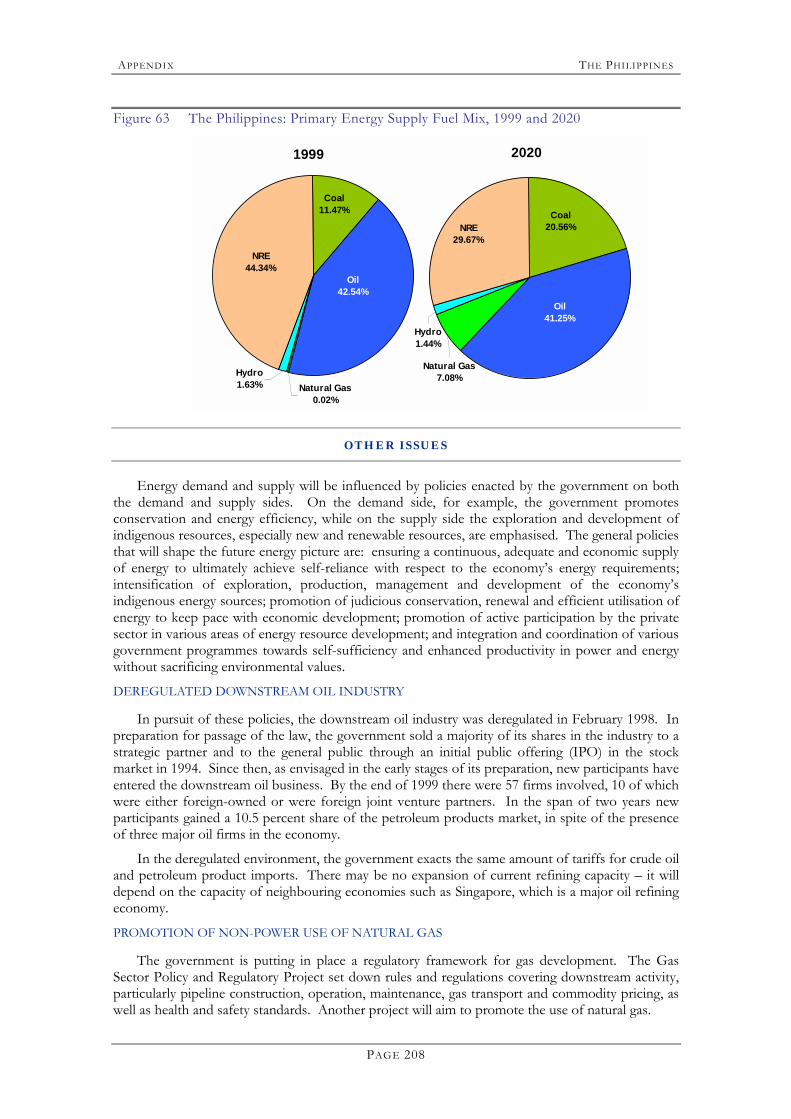
APPENDI X THE PHI LIPPIN ES
PAGE 208
Figure 63 The Philippines: Primary Energy Supply Fuel Mix, 1999 and 2020
1999
Natural Gas0.02%
NRE44.34%
Coal 11.47%
Oil 42.54%
Hydro1.63%
2020
Hydro1.44%
Oil 41.25%
Coal 20.56%NRE
29.67%
Natural Gas7.08%
OTHER ISSUES
Energy demand and supply will be influenced by policies enacted by the government on both the demand and supply sides. On the demand side, for example, the government promotes conservation and energy efficiency, while on the supply side the exploration and development of indigenous resources, especially new and renewable resources, are emphasised. The general policies that will shape the future energy picture are: ensuring a continuous, adequate and economic supply of energy to ultimately achieve self-reliance with respect to the economy�s energy requirements; intensification of exploration, production, management and development of the economy�s indigenous energy sources; promotion of judicious conservation, renewal and efficient utilisation of energy to keep pace with economic development; promotion of active participation by the private sector in various areas of energy resource development; and integration and coordination of various government programmes towards self-sufficiency and enhanced productivity in power and energy without sacrificing environmental values.
DEREGULATED DOWNSTREAM OIL INDUSTRY
In pursuit of these policies, the downstream oil industry was deregulated in February 1998. In preparation for passage of the law, the government sold a majority of its shares in the industry to a strategic partner and to the general public through an initial public offering (IPO) in the stock market in 1994. Since then, as envisaged in the early stages of its preparation, new participants have entered the downstream oil business. By the end of 1999 there were 57 firms involved, 10 of which were either foreign-owned or were foreign joint venture partners. In the span of two years new participants gained a 10.5 percent share of the petroleum products market, in spite of the presence of three major oil firms in the economy.
In the deregulated environment, the government exacts the same amount of tariffs for crude oil and petroleum product imports. There may be no expansion of current refining capacity � it will depend on the capacity of neighbouring economies such as Singapore, which is a major oil refining economy.
PROMOTION OF NON-POWER USE OF NATURAL GAS
The government is putting in place a regulatory framework for gas development. The Gas Sector Policy and Regulatory Project set down rules and regulations covering downstream activity, particularly pipeline construction, operation, maintenance, gas transport and commodity pricing, as well as health and safety standards. Another project will aim to promote the use of natural gas.
APPENDI X THE PHI LIPPIN ES
PAGE 209
With the operation of the 2,700 MW of natural-gas combined-cycle power plants starting 2002, it is projected that industries in the vicinity of power plants will have access to the pipelines for their energy requirements, replacing fuel oil. Likewise, the natural gas pipeline that ends at the power stations will be extended to bring natural gas to industrial zones. The construction of a terminal to facilitate LNG imports is also being considered to provide for the petrochemical industry complex and oil-fired thermal facilities in Metro Manila, which will be converted to natural gas combined-cycle power plants. Industries along the route are also expected to source their fuel requirements from the pipeline that will be built from the terminal to the power plants.
DEREGULATION AND PRIVATISATION OF ELECTRICITY INDUSTRY
To encourage efficiency and ease the burden of financing power projects, the government enacted a law paving the way for deregulation of the electricity industry and privatisation of the National Power Corporation (NPC) in June 2001. After full deregulation, the industry will become a private undertaking and market forces will be the basis for decision making on investment in new capacity and pricing of electricity.
FULL ELECTRIFICATION OF THE ECONOMY
The Philippines is one of several APEC economies with a large proportion of the population still lacking access to electricity. Hence, the government plans to complete electrification of every village in the economy by 2006 through extension of the grid wherever feasible and the installation of distributed generation to remote and isolated villages.109 The use of new and renewable energy systems is being considered for distributed generation.
CREATION OF A STABLE CAPITAL MARKET
To meet increasing demand in the next two decades, the Philippine economy has huge capital investment requirements. While the government tries to allow the private sector to undertake such investment through its privatisation programme, it needs to create an environment conducive to foreign and domestic investors alike. The most common source of investment in the developed world is the capital market. It is therefore imperative for the government to help develop a stable capital market in order to ensure that the required energy infrastructures will be funded.
REFERENCES
DOE (Philippines). (2002). Philippine Energy Plan 2002-20011. Department of Energy. Manila.
DOE (Philippines). (2001). �Notable Developments in the Energy Sector Since EWG 20.� Document submitted to the 21st APEC EWG Meeting, May 2001, Kuala Lumpur, Malaysia.
Department of Tourism (Philippines). (1998). "Philippines, My Country, My Home", http://www.tourism.gov.ph/welcome/phil-his.htm.
IEA. (2001). Energy Statistics of Non-OECD Economies. International Energy Agency, Paris.
109 Department of Energy (DOE), (2002), Philippine Energy Plan 2002-2011, Manila.

APPENDI X THE PHI LIPPIN ES
PAGE 210
APPENDI X RUSSI A
PAGE 211
RU S S I A INTROD UCTION
Russia (the Russian Federation) has the world�s largest landmass, covering 17,100,000 square km in Europe and Asia. Despite being huge in geographic terms, its economic size is moderate with real GDP in 1999 of 1990 US$275.3 billion110. With a population of 145.9 million, per capita income in 1999 was US$1,886.
Russia was a centrally planned economy until the early 1990s, when there was a transition to a market economy accompanied by a severe economic crisis. In the second half of 1999 a recovery began in all the macro sectors of the national economy, which have exhibited stable positive growth rates since then. It was supported by high international energy prices and a drastic devaluation in the national currency, boosting export revenues and the competitiveness of domestic producers. It is expected that this process will continue in the next two decades.
However, some important hurdles need to be overcome to ensure robust growth. No structural reforms have been implemented in the last decade of economic transformation, meaning there has been a prolonged operation of obsolete and inefficient industries. Changing legislation and an unstable tax regime pose additional barriers for development of effective businesses. In the upstream operations of oil and natural gas, a production sharing law is still under consideration in the Russian Parliament, and is subject to amendments. For long-term investment decisions, political risks are still high for foreign investors.
Russia has abundant natural energy resources, possessing the world�s largest proven reserves of natural gas (48.14 TCM, or 33 percent of the world total in 1999), 4.7 percent of the world�s proven oil reserves (6.7 billion tonnes in 1999), and 16 percent of the world�s coal reserves (157.01 billion tonnes in 1999). The economic potential of hydropower is estimated at 852 TWh per year, near 20 percent of which is already developed. Economic reserves of uranium ore comprise about 14 percent of the world total.
The energy sector is and will continue to be very important to Russia�s economic development. In 1999, the energy industry accounted for approximately 10 percent of GDP. At the same time its share of federal budget revenues was about 50 percent. The employment share was only three percent of the total work force. Oil and gas exports comprised 52 percent of total merchandise exports in 1999. The relative weight of the energy sector in the national economy will be maintained in the next two decades.
Over the forecast period, the Russia�s real GDP is projected to grow 5.2 percent annually, compared with an average 5.4 percent decline in the previous 10 years. Russia�s economy is likely to recover from the 1990s decade-long recession in the course of the next decade. A successful recovery requires broad structural reform and finding its appropriate place in the global economy. The broad economic recovery from the low base of the late 1990s gained momentum after the new government introduced a reform package covering business legislation and fiscal policy in 2000. It includes introduction of a low flat-rate income tax, reduction in the profit tax, measures to promote small and medium-sized business, and less complicated registration rules. Russia is adopting the generally accepted accounting principles to make business reports internationally comparable after 2004.
In macroeconomic policy, the government aims to maintain an annual budget surplus, in order to reduce external debt. Accession to the WTO is a priority of national economic policy, as it would provide greater opportunities in international trade.
110 DRI-WEFA (2001).
APPENDI X RUSSI A
PAGE 212
The main factor on the energy scene in Russia in 2000-20 will be higher efficiency of energy use as a result of the application of energy-saving technologies and more efficient power generation. Technological retrofitting and special national programs in energy savings are the main tools to improve efficiency.
In macroeconomic development the prevailing tendency will be a structural shift to less energy-intensive economic activity � services and light industry. This means an increasing share of services in GDP, and preferential development of higher value-added industries, such as more oil refining versus crude oil exports, and making finished products in the wood processing industry and in basic metals.
These two trends combined will result in a fast decline in the energy intensity of GDP at a rate of 2.4 percent per year. In 1999, Russia�s GDP energy intensity was 2,170 toe per million 1990 US$, the highest in APEC (Table 79). This rate is again achievable and it could be compared with the 2.5 percent annual decline in the energy intensity of GDP in Western European economies in the late 1970s to early 1980s after the 1973-74 oil shock.
The population is forecast to shrink by 0.3 percent per year, extending the demographic trend that emerged in the early 1990s. The population reached its peak of 149.5 million in 1991, and then started to decline. Demographic change will limit growth in energy demand in the residential sector.
Table 79 Russia: Various Indicators
Absolute Levels Growth Rates (%)
1992 1999 2020 1992-1999 1999-2020
GDP (Billion 1990 US$) 368.6 275.3 802.9 -4.1 5.2
Population (Millions) 148.7 145.9 137.9 -0.3 -0.3
GDP per capita 2,479.2 1,886.2 5,823.5 -3.8 5.5
Energy Intensitya 2,102.1 2,169.3 1,284.0 0.5 -2.5
Energy per capita (toe/person) 5.2 4.1 7.5 -3.4 2.9
CO2 Emissions per capitab 13.0 10.1 18.2 -3.5 2.9
CO2 Emissions per $ of GDPc 5.2 5.4 3.1 0.3 -2.5 Source GDP and Population: DRI-WEFA (2001), Energy and CO2 (History): IEA (2001), Energy and CO2 (Projection):
APERC (2002) a toe per million 1990 US$; b tonnes; c kg per 1990 US$
SUMMARY OF FORECAST RESULTS
FINAL ENERGY CONSUMPTION
Total final energy consumption is projected to grow by 2.8 percent annually up to 2020 (Table 80).
Energy use in the industrial sector will grow by 4.0 percent per year over the forecast period � the highest rate among the macro sectors.
Residential energy demand is expected to grow steadily by 1.5 percent per year in 1999-2020. Commercial-sector energy demand is projected to increase by two percent per year over the coming two decades. Heat represents about half of total energy consumption in these sectors, and maintains its share.
In the transport sector, projected energy demand shows an increase at an annual rate of two percent in road transport, 5.1 percent in aviation, 1.4 percent in rail and three percent in the marine
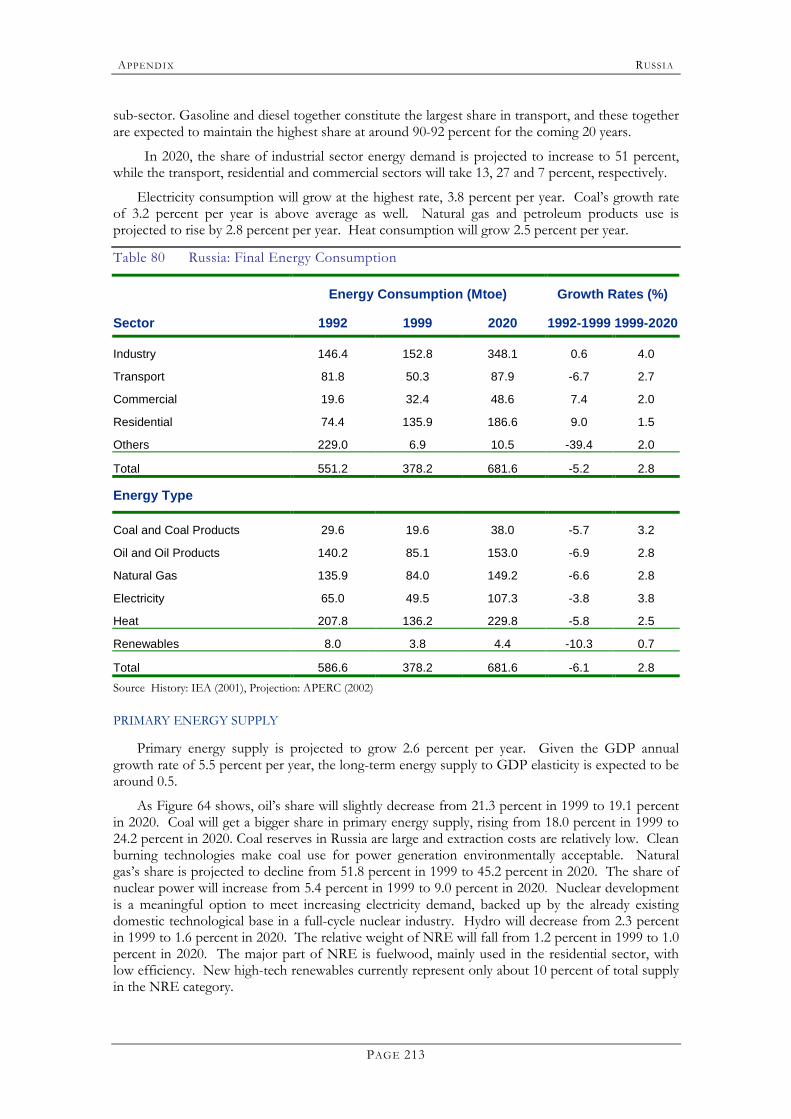
APPENDI X RUSSI A
PAGE 213
sub-sector. Gasoline and diesel together constitute the largest share in transport, and these together are expected to maintain the highest share at around 90-92 percent for the coming 20 years.
In 2020, the share of industrial sector energy demand is projected to increase to 51 percent, while the transport, residential and commercial sectors will take 13, 27 and 7 percent, respectively.
Electricity consumption will grow at the highest rate, 3.8 percent per year. Coal�s growth rate of 3.2 percent per year is above average as well. Natural gas and petroleum products use is projected to rise by 2.8 percent per year. Heat consumption will grow 2.5 percent per year.
Table 80 Russia: Final Energy Consumption
Energy Consumption (Mtoe) Growth Rates (%)
Sector 1992 1999 2020 1992-1999 1999-2020
Industry 146.4 152.8 348.1 0.6 4.0
Transport 81.8 50.3 87.9 -6.7 2.7
Commercial 19.6 32.4 48.6 7.4 2.0
Residential 74.4 135.9 186.6 9.0 1.5
Others 229.0 6.9 10.5 -39.4 2.0
Total 551.2 378.2 681.6 -5.2 2.8
Energy Type
Coal and Coal Products 29.6 19.6 38.0 -5.7 3.2
Oil and Oil Products 140.2 85.1 153.0 -6.9 2.8
Natural Gas 135.9 84.0 149.2 -6.6 2.8
Electricity 65.0 49.5 107.3 -3.8 3.8
Heat 207.8 136.2 229.8 -5.8 2.5
Renewables 8.0 3.8 4.4 -10.3 0.7
Total 586.6 378.2 681.6 -6.1 2.8 Source History: IEA (2001), Projection: APERC (2002) PRIMARY ENERGY SUPPLY
Primary energy supply is projected to grow 2.6 percent per year. Given the GDP annual growth rate of 5.5 percent per year, the long-term energy supply to GDP elasticity is expected to be around 0.5.
As Figure 64 shows, oil�s share will slightly decrease from 21.3 percent in 1999 to 19.1 percent in 2020. Coal will get a bigger share in primary energy supply, rising from 18.0 percent in 1999 to 24.2 percent in 2020. Coal reserves in Russia are large and extraction costs are relatively low. Clean burning technologies make coal use for power generation environmentally acceptable. Natural gas�s share is projected to decline from 51.8 percent in 1999 to 45.2 percent in 2020. The share of nuclear power will increase from 5.4 percent in 1999 to 9.0 percent in 2020. Nuclear development is a meaningful option to meet increasing electricity demand, backed up by the already existing domestic technological base in a full-cycle nuclear industry. Hydro will decrease from 2.3 percent in 1999 to 1.6 percent in 2020. The relative weight of NRE will fall from 1.2 percent in 1999 to 1.0 percent in 2020. The major part of NRE is fuelwood, mainly used in the residential sector, with low efficiency. New high-tech renewables currently represent only about 10 percent of total supply in the NRE category.
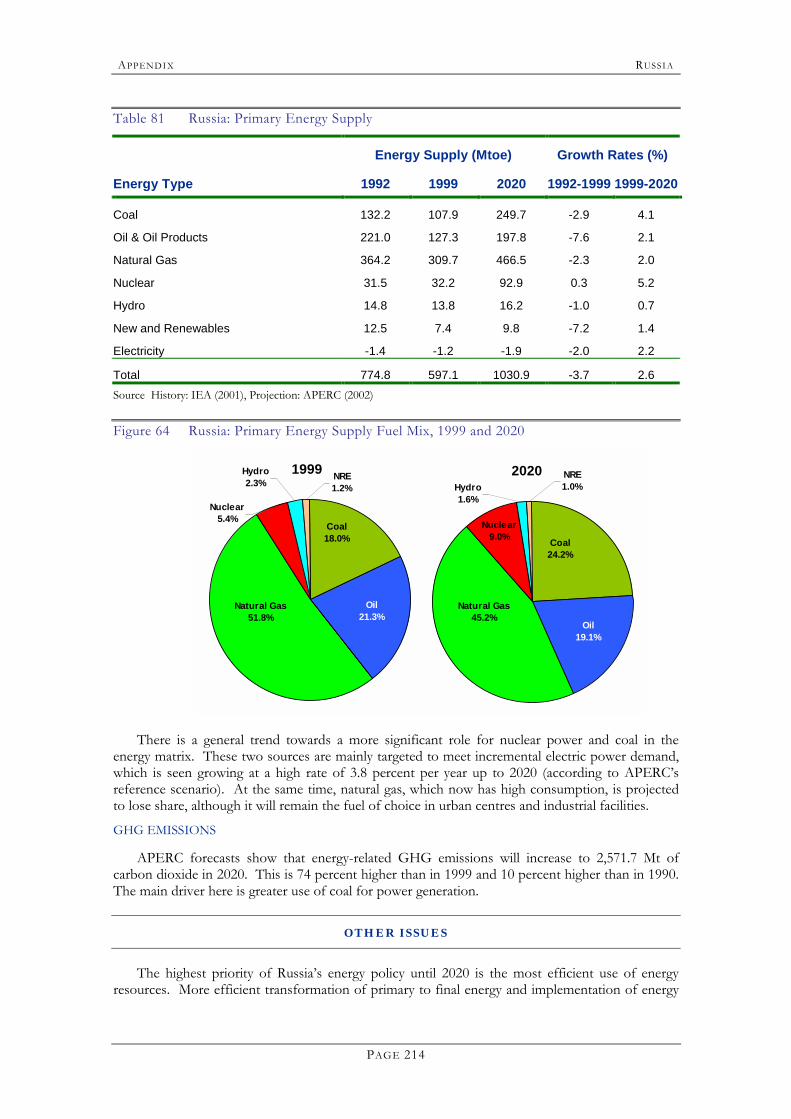
APPENDI X RUSSI A
PAGE 214
Table 81 Russia: Primary Energy Supply
Energy Supply (Mtoe) Growth Rates (%)
Energy Type 1992 1999 2020 1992-1999 1999-2020
Coal 132.2 107.9 249.7 -2.9 4.1
Oil & Oil Products 221.0 127.3 197.8 -7.6 2.1
Natural Gas 364.2 309.7 466.5 -2.3 2.0
Nuclear 31.5 32.2 92.9 0.3 5.2
Hydro 14.8 13.8 16.2 -1.0 0.7
New and Renewables 12.5 7.4 9.8 -7.2 1.4
Electricity -1.4 -1.2 -1.9 -2.0 2.2
Total 774.8 597.1 1030.9 -3.7 2.6 Source History: IEA (2001), Projection: APERC (2002) Figure 64 Russia: Primary Energy Supply Fuel Mix, 1999 and 2020
1999Hydro2.3%
Nuclear5.4%
Oil 21.3%
Coal 18.0%
NRE1.2%
Natural Gas51.8%
2020
Natural Gas45.2%
NRE1.0%
Coal 24.2%
Oil 19.1%
Nuclear9.0%
Hydro1.6%
There is a general trend towards a more significant role for nuclear power and coal in the energy matrix. These two sources are mainly targeted to meet incremental electric power demand, which is seen growing at a high rate of 3.8 percent per year up to 2020 (according to APERC�s reference scenario). At the same time, natural gas, which now has high consumption, is projected to lose share, although it will remain the fuel of choice in urban centres and industrial facilities.
GHG EMISSIONS
APERC forecasts show that energy-related GHG emissions will increase to 2,571.7 Mt of carbon dioxide in 2020. This is 74 percent higher than in 1999 and 10 percent higher than in 1990. The main driver here is greater use of coal for power generation.
OTHER ISSUES
The highest priority of Russia�s energy policy until 2020 is the most efficient use of energy resources. More efficient transformation of primary to final energy and implementation of energy
APPENDI X RUSSI A
PAGE 215
efficiency measures in end-use should allow it to meet aggressive targets in energy/GDP intensity reduction.
Power industry reform, on the way since 2001, will develop the wholesale national market, unbundling generation transport and distribution businesses.
Replacement of ageing physical capital and infrastructure is a crucial factor for development of an energy sector in the next two decades. Creation of a benign investment climate for domestic and foreign investors is a prerequisite for this process.
Energy pricing concerns price, tax and customs policies aimed at regulation of the price level and correlation between domestic and international fuel and energy prices. It seeks elimination of internal price distortions for different fuels and gradual convergence with international market prices.
A better legislative and regulatory base in the energy sector will mean standardisation, certification and better licensing of energy market participants.
Energy exports will be maintained at a considerably high level, especially in natural gas and liquid fuels, with special emphasis on petroleum products. Energy exports are expected to become more diversified through penetration of the energy markets of East Asia and increasing direct supply of oil and products to the US. But the traditional European export direction will still be a priority.
The most successful upstream developments in Eastern Russia are the Sakhalin-1 and Sakhalin-2 projects. Overall crude oil production levels for Sakhalin can be estimated at 0.7 Mb/d in 2020, with corresponding export volumes of about 0.5 Mb/d. Production figures for East Siberia can be estimated at 0.8 Mb/d in 2020 with probable export figures of 0.4 Mb/d. Eastern Russia as a whole could supply the Asia-Pacific market with up to 0.9 Mb/d in 2020 under favourable pricing conditions. Natural gas production is expected to start around 2010, though transport remains the main problem to be overcome.
At the beginning of 2002 the state oil transport company Transneft announced a plan to build by 2008-10 a 3,765 km oil pipeline on an Angarsk-Khabarovsk-Nakhodka route with a capacity of one Mb/d. It should be filled with �big� oil from the West Siberian fields and new prospective deposits in East Siberia.
The �Kovykta� natural gas field in Eastern Siberia has proven reserves of 2,000 BCM, which is enough for 50 BCM per year production for 30-40 years. Development of this field could become another cornerstone (in addition to Sakhalin) in energy cooperation with East Asian economies in the next two decades.
REFERENCES
IEA. (2001). “Energy Statistics of Non-OECD Countries”. International Energy Agency, OECD. Paris, 2001.
Energy Ministry of Russia. (2001) �Main Provisions of Russia’s Energy Strategy up to 2020”. Moscow, 2001.

APPENDI X RUSSI A
PAGE 216
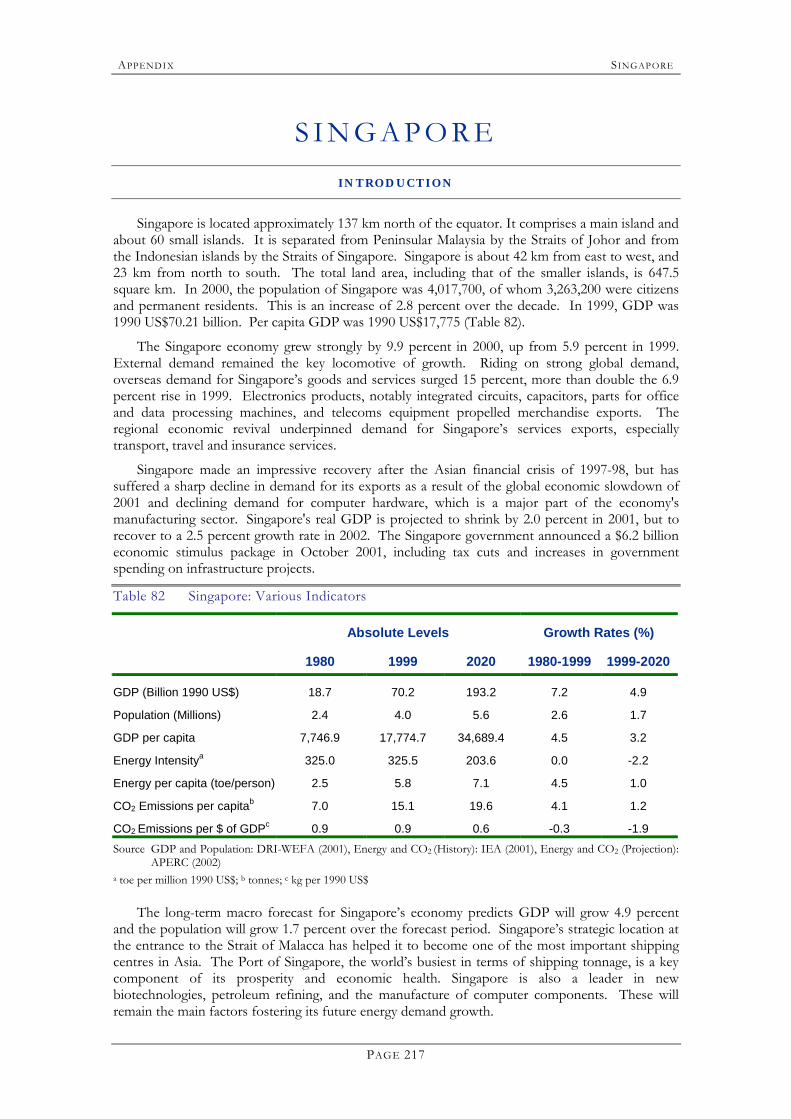
APPENDI X SINGAP ORE
PAGE 217
S I N G A P O R E INTROD UCTION
Singapore is located approximately 137 km north of the equator. It comprises a main island and about 60 small islands. It is separated from Peninsular Malaysia by the Straits of Johor and from the Indonesian islands by the Straits of Singapore. Singapore is about 42 km from east to west, and 23 km from north to south. The total land area, including that of the smaller islands, is 647.5 square km. In 2000, the population of Singapore was 4,017,700, of whom 3,263,200 were citizens and permanent residents. This is an increase of 2.8 percent over the decade. In 1999, GDP was 1990 US$70.21 billion. Per capita GDP was 1990 US$17,775 (Table 82).
The Singapore economy grew strongly by 9.9 percent in 2000, up from 5.9 percent in 1999. External demand remained the key locomotive of growth. Riding on strong global demand, overseas demand for Singapore�s goods and services surged 15 percent, more than double the 6.9 percent rise in 1999. Electronics products, notably integrated circuits, capacitors, parts for office and data processing machines, and telecoms equipment propelled merchandise exports. The regional economic revival underpinned demand for Singapore�s services exports, especially transport, travel and insurance services.
Singapore made an impressive recovery after the Asian financial crisis of 1997-98, but has suffered a sharp decline in demand for its exports as a result of the global economic slowdown of 2001 and declining demand for computer hardware, which is a major part of the economy's manufacturing sector. Singapore's real GDP is projected to shrink by 2.0 percent in 2001, but to recover to a 2.5 percent growth rate in 2002. The Singapore government announced a $6.2 billion economic stimulus package in October 2001, including tax cuts and increases in government spending on infrastructure projects.
Table 82 Singapore: Various Indicators
Absolute Levels Growth Rates (%)
1980 1999 2020 1980-1999 1999-2020
GDP (Billion 1990 US$) 18.7 70.2 193.2 7.2 4.9
Population (Millions) 2.4 4.0 5.6 2.6 1.7
GDP per capita 7,746.9 17,774.7 34,689.4 4.5 3.2
Energy Intensitya 325.0 325.5 203.6 0.0 -2.2
Energy per capita (toe/person) 2.5 5.8 7.1 4.5 1.0
CO2 Emissions per capitab 7.0 15.1 19.6 4.1 1.2
CO2 Emissions per $ of GDPc 0.9 0.9 0.6 -0.3 -1.9 Source GDP and Population: DRI-WEFA (2001), Energy and CO2 (History): IEA (2001), Energy and CO2 (Projection):
APERC (2002) a toe per million 1990 US$; b tonnes; c kg per 1990 US$
The long-term macro forecast for Singapore�s economy predicts GDP will grow 4.9 percent and the population will grow 1.7 percent over the forecast period. Singapore�s strategic location at the entrance to the Strait of Malacca has helped it to become one of the most important shipping centres in Asia. The Port of Singapore, the world�s busiest in terms of shipping tonnage, is a key component of its prosperity and economic health. Singapore is also a leader in new biotechnologies, petroleum refining, and the manufacture of computer components. These will remain the main factors fostering its future energy demand growth.
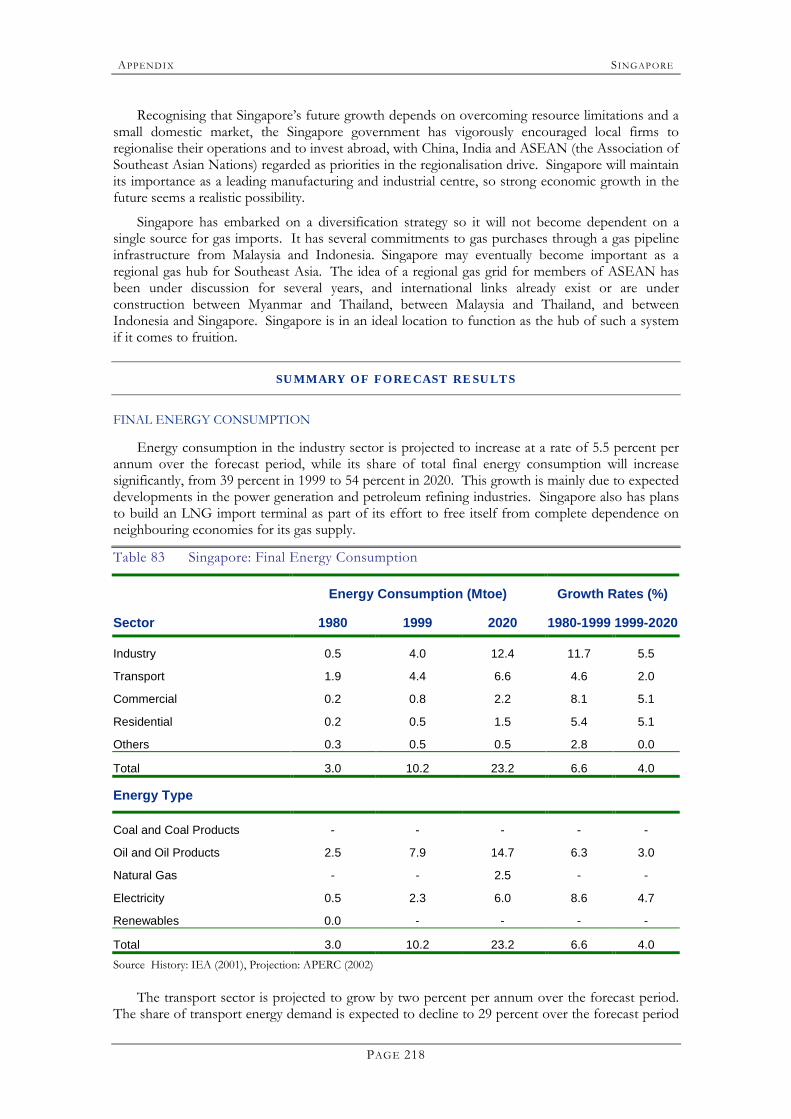
APPENDI X SINGAP ORE
PAGE 218
Recognising that Singapore�s future growth depends on overcoming resource limitations and a small domestic market, the Singapore government has vigorously encouraged local firms to regionalise their operations and to invest abroad, with China, India and ASEAN (the Association of Southeast Asian Nations) regarded as priorities in the regionalisation drive. Singapore will maintain its importance as a leading manufacturing and industrial centre, so strong economic growth in the future seems a realistic possibility.
Singapore has embarked on a diversification strategy so it will not become dependent on a single source for gas imports. It has several commitments to gas purchases through a gas pipeline infrastructure from Malaysia and Indonesia. Singapore may eventually become important as a regional gas hub for Southeast Asia. The idea of a regional gas grid for members of ASEAN has been under discussion for several years, and international links already exist or are under construction between Myanmar and Thailand, between Malaysia and Thailand, and between Indonesia and Singapore. Singapore is in an ideal location to function as the hub of such a system if it comes to fruition.
SUMMARY OF FORECAST RESULTS
FINAL ENERGY CONSUMPTION
Energy consumption in the industry sector is projected to increase at a rate of 5.5 percent per annum over the forecast period, while its share of total final energy consumption will increase significantly, from 39 percent in 1999 to 54 percent in 2020. This growth is mainly due to expected developments in the power generation and petroleum refining industries. Singapore also has plans to build an LNG import terminal as part of its effort to free itself from complete dependence on neighbouring economies for its gas supply.
Table 83 Singapore: Final Energy Consumption
Energy Consumption (Mtoe) Growth Rates (%)
Sector 1980 1999 2020 1980-1999 1999-2020
Industry 0.5 4.0 12.4 11.7 5.5
Transport 1.9 4.4 6.6 4.6 2.0
Commercial 0.2 0.8 2.2 8.1 5.1
Residential 0.2 0.5 1.5 5.4 5.1
Others 0.3 0.5 0.5 2.8 0.0
Total 3.0 10.2 23.2 6.6 4.0
Energy Type
Coal and Coal Products - - - - -
Oil and Oil Products 2.5 7.9 14.7 6.3 3.0
Natural Gas - - 2.5 - -
Electricity 0.5 2.3 6.0 8.6 4.7
Renewables 0.0 - - - -
Total 3.0 10.2 23.2 6.6 4.0 Source History: IEA (2001), Projection: APERC (2002)
The transport sector is projected to grow by two percent per annum over the forecast period. The share of transport energy demand is expected to decline to 29 percent over the forecast period
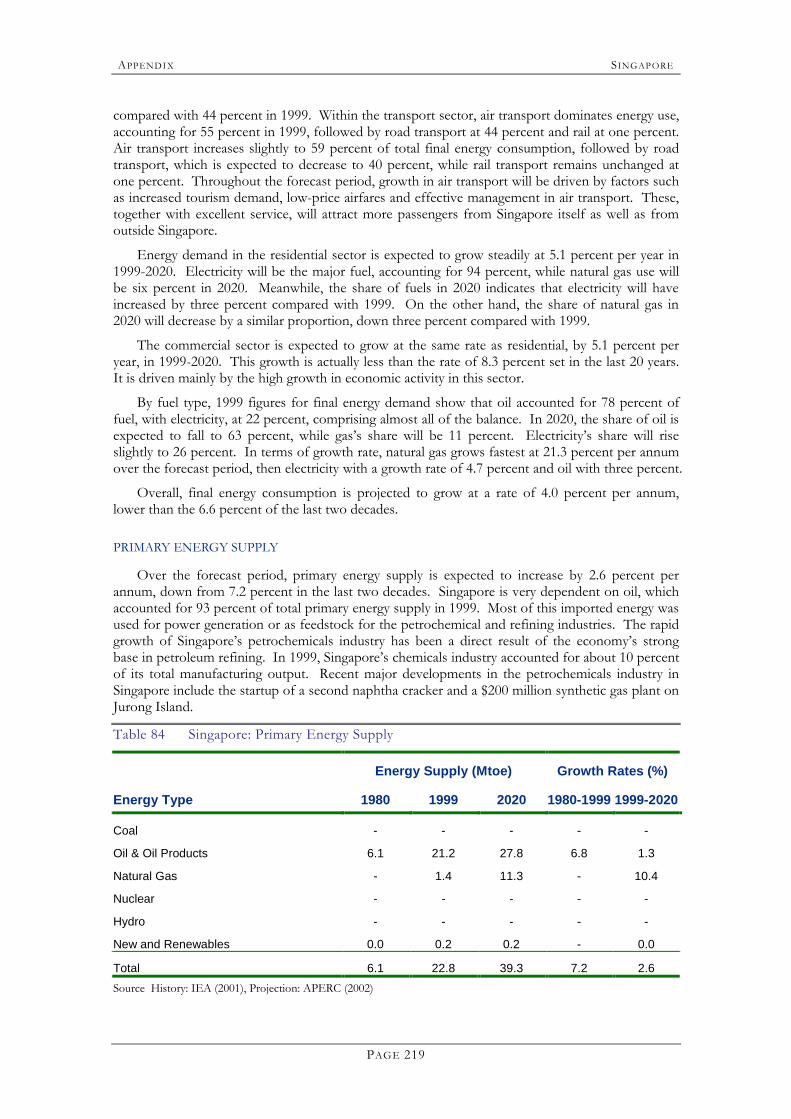
APPENDI X SINGAP ORE
PAGE 219
compared with 44 percent in 1999. Within the transport sector, air transport dominates energy use, accounting for 55 percent in 1999, followed by road transport at 44 percent and rail at one percent. Air transport increases slightly to 59 percent of total final energy consumption, followed by road transport, which is expected to decrease to 40 percent, while rail transport remains unchanged at one percent. Throughout the forecast period, growth in air transport will be driven by factors such as increased tourism demand, low-price airfares and effective management in air transport. These, together with excellent service, will attract more passengers from Singapore itself as well as from outside Singapore.
Energy demand in the residential sector is expected to grow steadily at 5.1 percent per year in 1999-2020. Electricity will be the major fuel, accounting for 94 percent, while natural gas use will be six percent in 2020. Meanwhile, the share of fuels in 2020 indicates that electricity will have increased by three percent compared with 1999. On the other hand, the share of natural gas in 2020 will decrease by a similar proportion, down three percent compared with 1999.
The commercial sector is expected to grow at the same rate as residential, by 5.1 percent per year, in 1999-2020. This growth is actually less than the rate of 8.3 percent set in the last 20 years. It is driven mainly by the high growth in economic activity in this sector.
By fuel type, 1999 figures for final energy demand show that oil accounted for 78 percent of fuel, with electricity, at 22 percent, comprising almost all of the balance. In 2020, the share of oil is expected to fall to 63 percent, while gas�s share will be 11 percent. Electricity�s share will rise slightly to 26 percent. In terms of growth rate, natural gas grows fastest at 21.3 percent per annum over the forecast period, then electricity with a growth rate of 4.7 percent and oil with three percent.
Overall, final energy consumption is projected to grow at a rate of 4.0 percent per annum, lower than the 6.6 percent of the last two decades. PRIMARY ENERGY SUPPLY
Over the forecast period, primary energy supply is expected to increase by 2.6 percent per annum, down from 7.2 percent in the last two decades. Singapore is very dependent on oil, which accounted for 93 percent of total primary energy supply in 1999. Most of this imported energy was used for power generation or as feedstock for the petrochemical and refining industries. The rapid growth of Singapore�s petrochemicals industry has been a direct result of the economy�s strong base in petroleum refining. In 1999, Singapore�s chemicals industry accounted for about 10 percent of its total manufacturing output. Recent major developments in the petrochemicals industry in Singapore include the startup of a second naphtha cracker and a $200 million synthetic gas plant on Jurong Island.
Table 84 Singapore: Primary Energy Supply
Energy Supply (Mtoe) Growth Rates (%)
Energy Type 1980 1999 2020 1980-1999 1999-2020
Coal - - - - -
Oil & Oil Products 6.1 21.2 27.8 6.8 1.3
Natural Gas - 1.4 11.3 - 10.4
Nuclear - - - - -
Hydro - - - - -
New and Renewables 0.0 0.2 0.2 - 0.0
Total 6.1 22.8 39.3 7.2 2.6 Source History: IEA (2001), Projection: APERC (2002)
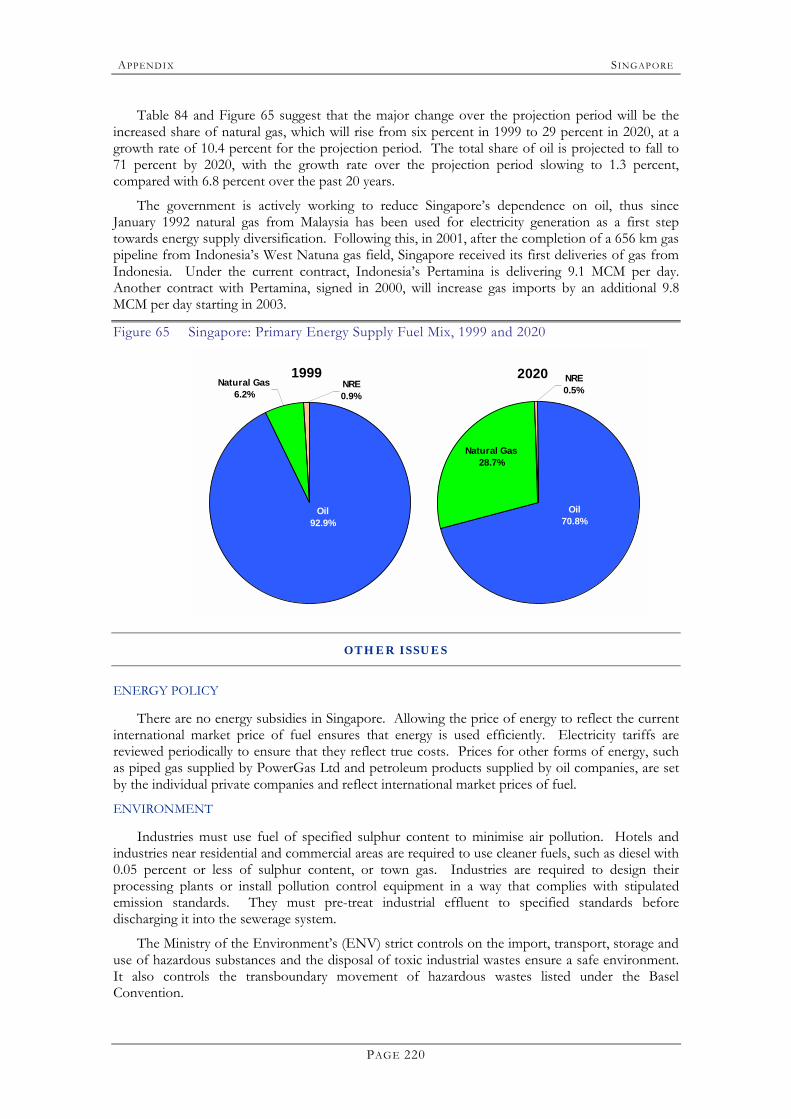
APPENDI X SINGAP ORE
PAGE 220
Table 84 and Figure 65 suggest that the major change over the projection period will be the increased share of natural gas, which will rise from six percent in 1999 to 29 percent in 2020, at a growth rate of 10.4 percent for the projection period. The total share of oil is projected to fall to 71 percent by 2020, with the growth rate over the projection period slowing to 1.3 percent, compared with 6.8 percent over the past 20 years.
The government is actively working to reduce Singapore�s dependence on oil, thus since January 1992 natural gas from Malaysia has been used for electricity generation as a first step towards energy supply diversification. Following this, in 2001, after the completion of a 656 km gas pipeline from Indonesia�s West Natuna gas field, Singapore received its first deliveries of gas from Indonesia. Under the current contract, Indonesia�s Pertamina is delivering 9.1 MCM per day. Another contract with Pertamina, signed in 2000, will increase gas imports by an additional 9.8 MCM per day starting in 2003.
Figure 65 Singapore: Primary Energy Supply Fuel Mix, 1999 and 2020
1999Natural Gas
6.2%NRE0.9%
Oil 92.9%
2020
Oil 70.8%
NRE0.5%
Natural Gas28.7%
OTHER ISSUES
ENERGY POLICY
There are no energy subsidies in Singapore. Allowing the price of energy to reflect the current international market price of fuel ensures that energy is used efficiently. Electricity tariffs are reviewed periodically to ensure that they reflect true costs. Prices for other forms of energy, such as piped gas supplied by PowerGas Ltd and petroleum products supplied by oil companies, are set by the individual private companies and reflect international market prices of fuel.
ENVIRONMENT
Industries must use fuel of specified sulphur content to minimise air pollution. Hotels and industries near residential and commercial areas are required to use cleaner fuels, such as diesel with 0.05 percent or less of sulphur content, or town gas. Industries are required to design their processing plants or install pollution control equipment in a way that complies with stipulated emission standards. They must pre-treat industrial effluent to specified standards before discharging it into the sewerage system.
The Ministry of the Environment�s (ENV) strict controls on the import, transport, storage and use of hazardous substances and the disposal of toxic industrial wastes ensure a safe environment. It also controls the transboundary movement of hazardous wastes listed under the Basel Convention.
APPENDI X SINGAP ORE
PAGE 221
REFERENCES
APERC. (2001). �Energy Supply Infrastructure Development in the APEC Region”. Asia Pacific Energy Research Centre. Tokyo. March, 2001.
Ministry of Information, Communications and Arts. Singapore. http://www.mita.gov.sg/bkstld.htm
APEC Energy Database � Energy Info, Country Analysis Brief and Other Analyses.

APPENDI X SINGAP ORE
PAGE 222
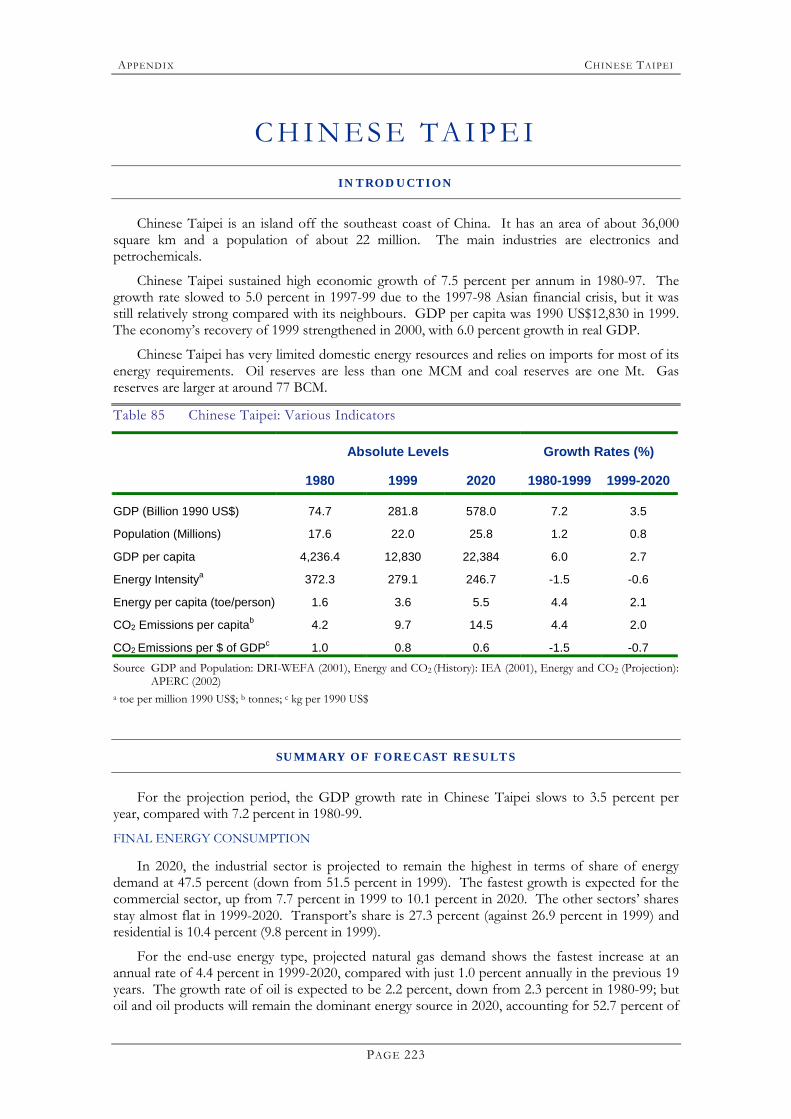
APPENDI X CHINESE TAIPEI
PAGE 223
C H I N E S E TA I P E I INTROD UCTION
Chinese Taipei is an island off the southeast coast of China. It has an area of about 36,000 square km and a population of about 22 million. The main industries are electronics and petrochemicals.
Chinese Taipei sustained high economic growth of 7.5 percent per annum in 1980-97. The growth rate slowed to 5.0 percent in 1997-99 due to the 1997-98 Asian financial crisis, but it was still relatively strong compared with its neighbours. GDP per capita was 1990 US$12,830 in 1999. The economy�s recovery of 1999 strengthened in 2000, with 6.0 percent growth in real GDP.
Chinese Taipei has very limited domestic energy resources and relies on imports for most of its energy requirements. Oil reserves are less than one MCM and coal reserves are one Mt. Gas reserves are larger at around 77 BCM.
Table 85 Chinese Taipei: Various Indicators
Absolute Levels Growth Rates (%)
1980 1999 2020 1980-1999 1999-2020
GDP (Billion 1990 US$) 74.7 281.8 578.0 7.2 3.5
Population (Millions) 17.6 22.0 25.8 1.2 0.8
GDP per capita 4,236.4 12,830 22,384 6.0 2.7
Energy Intensitya 372.3 279.1 246.7 -1.5 -0.6
Energy per capita (toe/person) 1.6 3.6 5.5 4.4 2.1
CO2 Emissions per capitab 4.2 9.7 14.5 4.4 2.0
CO2 Emissions per $ of GDPc 1.0 0.8 0.6 -1.5 -0.7 Source GDP and Population: DRI-WEFA (2001), Energy and CO2 (History): IEA (2001), Energy and CO2 (Projection):
APERC (2002) a toe per million 1990 US$; b tonnes; c kg per 1990 US$
SUMMARY OF FORECAST RESULTS
For the projection period, the GDP growth rate in Chinese Taipei slows to 3.5 percent per year, compared with 7.2 percent in 1980-99.
FINAL ENERGY CONSUMPTION
In 2020, the industrial sector is projected to remain the highest in terms of share of energy demand at 47.5 percent (down from 51.5 percent in 1999). The fastest growth is expected for the commercial sector, up from 7.7 percent in 1999 to 10.1 percent in 2020. The other sectors� shares stay almost flat in 1999-2020. Transport�s share is 27.3 percent (against 26.9 percent in 1999) and residential is 10.4 percent (9.8 percent in 1999).
For the end-use energy type, projected natural gas demand shows the fastest increase at an annual rate of 4.4 percent in 1999-2020, compared with just 1.0 percent annually in the previous 19 years. The growth rate of oil is expected to be 2.2 percent, down from 2.3 percent in 1980-99; but oil and oil products will remain the dominant energy source in 2020, accounting for 52.7 percent of
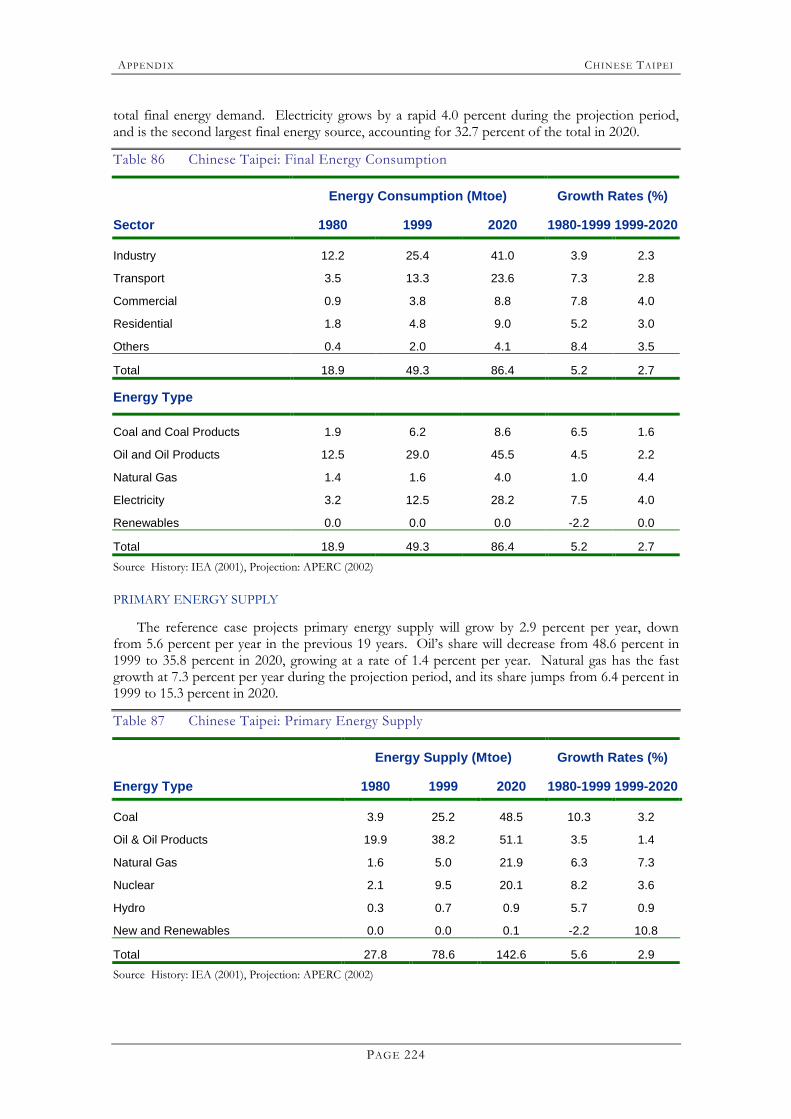
APPENDI X CHINESE TAIPEI
PAGE 224
total final energy demand. Electricity grows by a rapid 4.0 percent during the projection period, and is the second largest final energy source, accounting for 32.7 percent of the total in 2020.
Table 86 Chinese Taipei: Final Energy Consumption
Energy Consumption (Mtoe) Growth Rates (%)
Sector 1980 1999 2020 1980-1999 1999-2020
Industry 12.2 25.4 41.0 3.9 2.3
Transport 3.5 13.3 23.6 7.3 2.8
Commercial 0.9 3.8 8.8 7.8 4.0
Residential 1.8 4.8 9.0 5.2 3.0
Others 0.4 2.0 4.1 8.4 3.5
Total 18.9 49.3 86.4 5.2 2.7
Energy Type
Coal and Coal Products 1.9 6.2 8.6 6.5 1.6
Oil and Oil Products 12.5 29.0 45.5 4.5 2.2
Natural Gas 1.4 1.6 4.0 1.0 4.4
Electricity 3.2 12.5 28.2 7.5 4.0
Renewables 0.0 0.0 0.0 -2.2 0.0
Total 18.9 49.3 86.4 5.2 2.7 Source History: IEA (2001), Projection: APERC (2002) PRIMARY ENERGY SUPPLY
The reference case projects primary energy supply will grow by 2.9 percent per year, down from 5.6 percent per year in the previous 19 years. Oil�s share will decrease from 48.6 percent in 1999 to 35.8 percent in 2020, growing at a rate of 1.4 percent per year. Natural gas has the fast growth at 7.3 percent per year during the projection period, and its share jumps from 6.4 percent in 1999 to 15.3 percent in 2020.
Table 87 Chinese Taipei: Primary Energy Supply
Energy Supply (Mtoe) Growth Rates (%)
Energy Type 1980 1999 2020 1980-1999 1999-2020
Coal 3.9 25.2 48.5 10.3 3.2
Oil & Oil Products 19.9 38.2 51.1 3.5 1.4
Natural Gas 1.6 5.0 21.9 6.3 7.3
Nuclear 2.1 9.5 20.1 8.2 3.6
Hydro 0.3 0.7 0.9 5.7 0.9
New and Renewables 0.0 0.0 0.1 -2.2 10.8
Total 27.8 78.6 142.6 5.6 2.9 Source History: IEA (2001), Projection: APERC (2002)
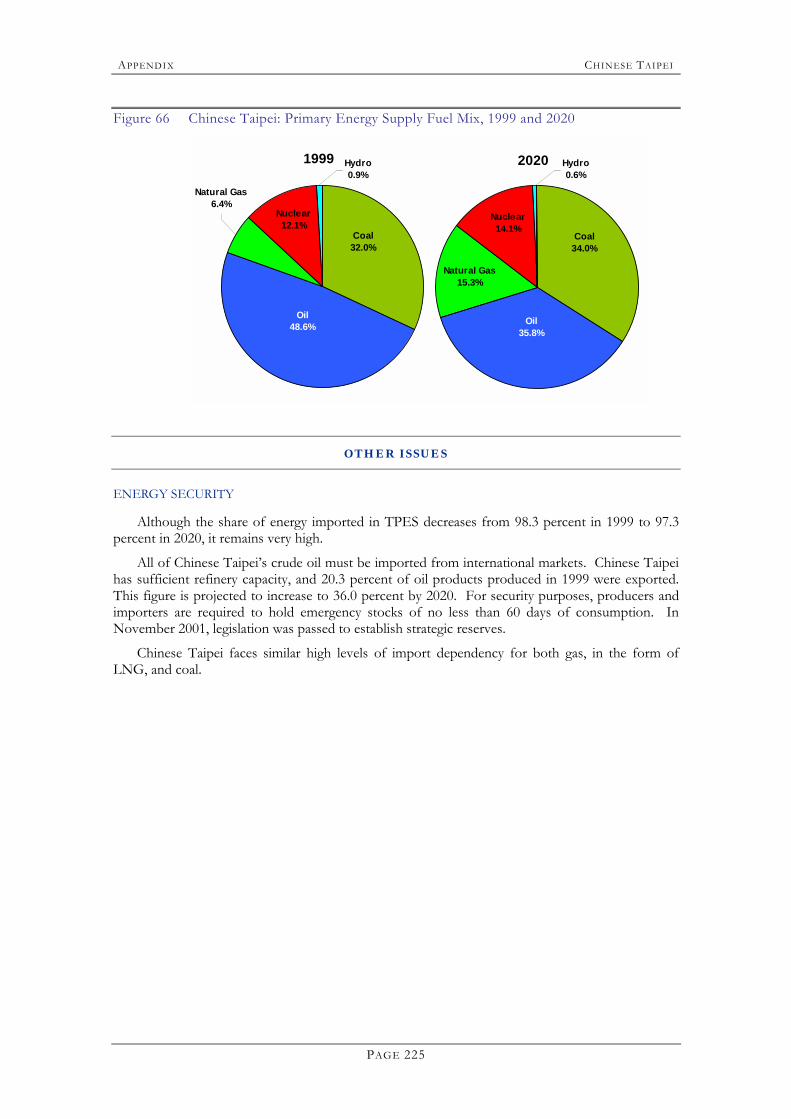
APPENDI X CHINESE TAIPEI
PAGE 225
Figure 66 Chinese Taipei: Primary Energy Supply Fuel Mix, 1999 and 2020
1999 Hydro0.9%
Nuclear12.1%
Oil 48.6%
Coal 32.0%
Natural Gas6.4%
2020
Natural Gas15.3%
Coal 34.0%
Oil 35.8%
Nuclear14.1%
Hydro0.6%
OTHER ISSUES
ENERGY SECURITY
Although the share of energy imported in TPES decreases from 98.3 percent in 1999 to 97.3 percent in 2020, it remains very high.
All of Chinese Taipei�s crude oil must be imported from international markets. Chinese Taipei has sufficient refinery capacity, and 20.3 percent of oil products produced in 1999 were exported. This figure is projected to increase to 36.0 percent by 2020. For security purposes, producers and importers are required to hold emergency stocks of no less than 60 days of consumption. In November 2001, legislation was passed to establish strategic reserves.
Chinese Taipei faces similar high levels of import dependency for both gas, in the form of LNG, and coal.

APPENDI X CHINESE TAIPEI
PAGE 226
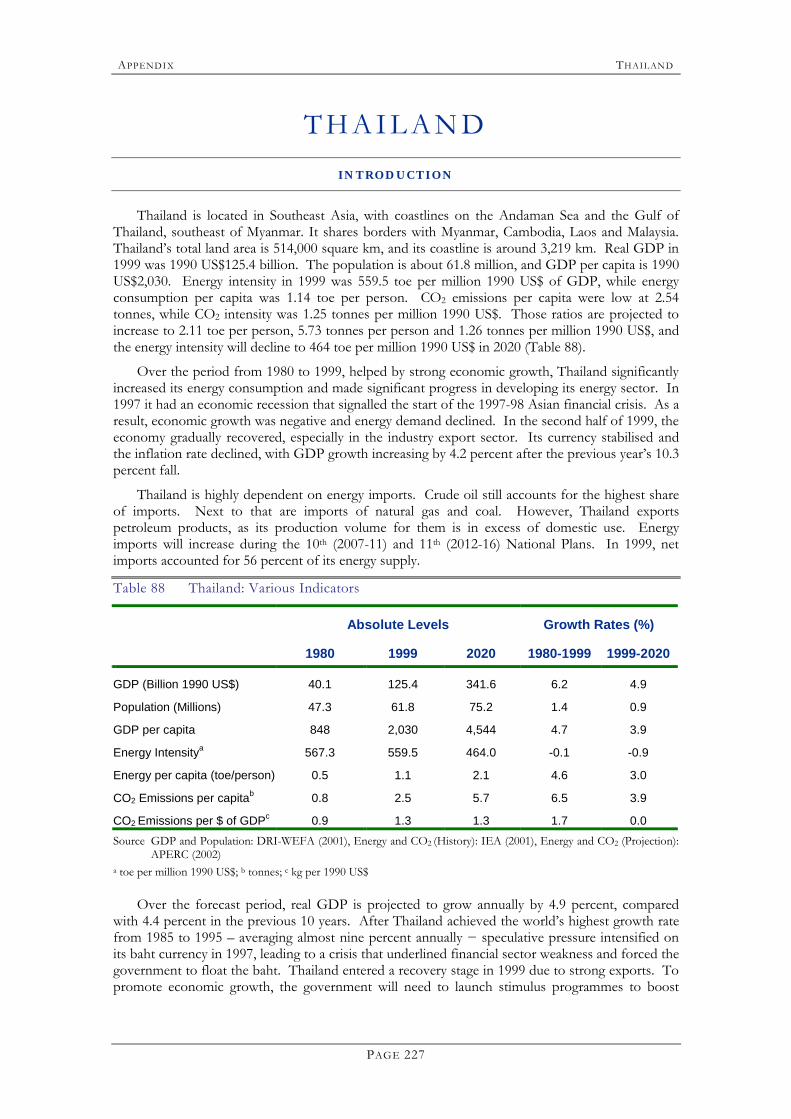
APPENDI X THAILAN D
PAGE 227
T H A I L A N D INTROD UCTION
Thailand is located in Southeast Asia, with coastlines on the Andaman Sea and the Gulf of Thailand, southeast of Myanmar. It shares borders with Myanmar, Cambodia, Laos and Malaysia. Thailand�s total land area is 514,000 square km, and its coastline is around 3,219 km. Real GDP in 1999 was 1990 US$125.4 billion. The population is about 61.8 million, and GDP per capita is 1990 US$2,030. Energy intensity in 1999 was 559.5 toe per million 1990 US$ of GDP, while energy consumption per capita was 1.14 toe per person. CO2 emissions per capita were low at 2.54 tonnes, while CO2 intensity was 1.25 tonnes per million 1990 US$. Those ratios are projected to increase to 2.11 toe per person, 5.73 tonnes per person and 1.26 tonnes per million 1990 US$, and the energy intensity will decline to 464 toe per million 1990 US$ in 2020 (Table 88).
Over the period from 1980 to 1999, helped by strong economic growth, Thailand significantly increased its energy consumption and made significant progress in developing its energy sector. In 1997 it had an economic recession that signalled the start of the 1997-98 Asian financial crisis. As a result, economic growth was negative and energy demand declined. In the second half of 1999, the economy gradually recovered, especially in the industry export sector. Its currency stabilised and the inflation rate declined, with GDP growth increasing by 4.2 percent after the previous year�s 10.3 percent fall.
Thailand is highly dependent on energy imports. Crude oil still accounts for the highest share of imports. Next to that are imports of natural gas and coal. However, Thailand exports petroleum products, as its production volume for them is in excess of domestic use. Energy imports will increase during the 10th (2007-11) and 11th (2012-16) National Plans. In 1999, net imports accounted for 56 percent of its energy supply.
Table 88 Thailand: Various Indicators
Absolute Levels Growth Rates (%)
1980 1999 2020 1980-1999 1999-2020
GDP (Billion 1990 US$) 40.1 125.4 341.6 6.2 4.9
Population (Millions) 47.3 61.8 75.2 1.4 0.9
GDP per capita 848 2,030 4,544 4.7 3.9
Energy Intensitya 567.3 559.5 464.0 -0.1 -0.9
Energy per capita (toe/person) 0.5 1.1 2.1 4.6 3.0
CO2 Emissions per capitab 0.8 2.5 5.7 6.5 3.9
CO2 Emissions per $ of GDPc 0.9 1.3 1.3 1.7 0.0 Source GDP and Population: DRI-WEFA (2001), Energy and CO2 (History): IEA (2001), Energy and CO2 (Projection):
APERC (2002) a toe per million 1990 US$; b tonnes; c kg per 1990 US$
Over the forecast period, real GDP is projected to grow annually by 4.9 percent, compared with 4.4 percent in the previous 10 years. After Thailand achieved the world�s highest growth rate from 1985 to 1995 � averaging almost nine percent annually − speculative pressure intensified on its baht currency in 1997, leading to a crisis that underlined financial sector weakness and forced the government to float the baht. Thailand entered a recovery stage in 1999 due to strong exports. To promote economic growth, the government will need to launch stimulus programmes to boost
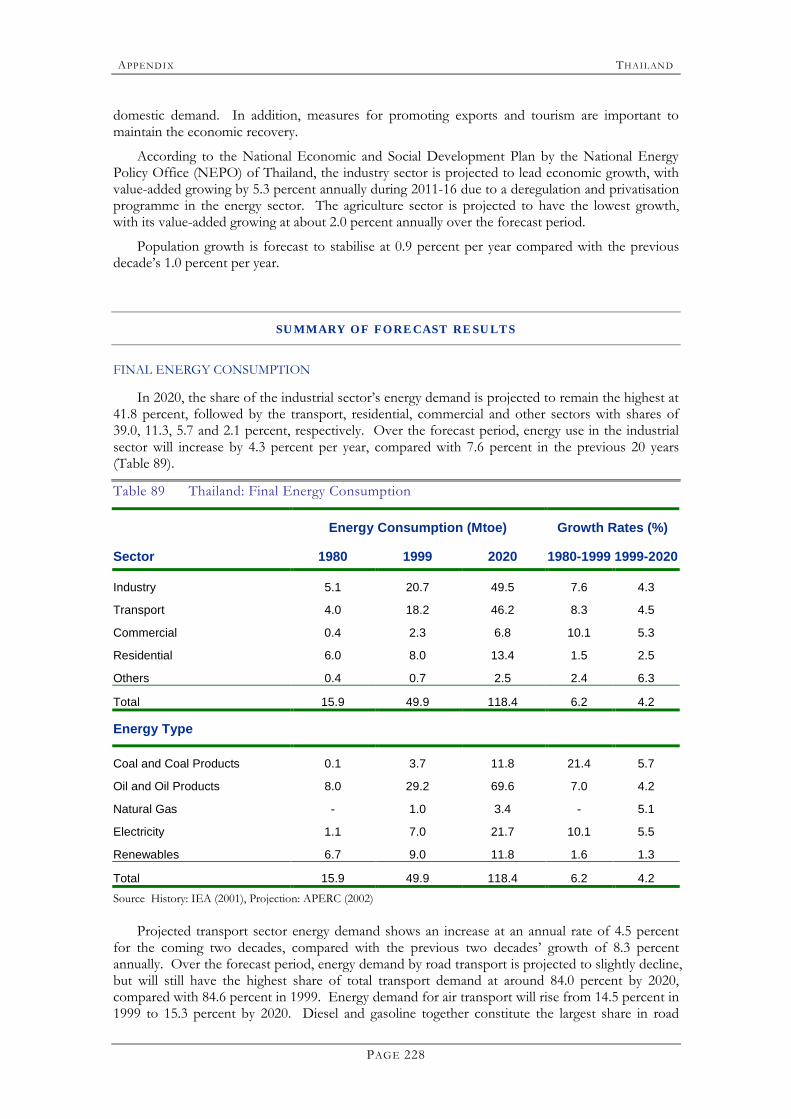
APPENDI X THAILAN D
PAGE 228
domestic demand. In addition, measures for promoting exports and tourism are important to maintain the economic recovery.
According to the National Economic and Social Development Plan by the National Energy Policy Office (NEPO) of Thailand, the industry sector is projected to lead economic growth, with value-added growing by 5.3 percent annually during 2011-16 due to a deregulation and privatisation programme in the energy sector. The agriculture sector is projected to have the lowest growth, with its value-added growing at about 2.0 percent annually over the forecast period.
Population growth is forecast to stabilise at 0.9 percent per year compared with the previous decade�s 1.0 percent per year.
SUMMARY OF FORECAST RESULTS
FINAL ENERGY CONSUMPTION
In 2020, the share of the industrial sector�s energy demand is projected to remain the highest at 41.8 percent, followed by the transport, residential, commercial and other sectors with shares of 39.0, 11.3, 5.7 and 2.1 percent, respectively. Over the forecast period, energy use in the industrial sector will increase by 4.3 percent per year, compared with 7.6 percent in the previous 20 years (Table 89).
Table 89 Thailand: Final Energy Consumption
Energy Consumption (Mtoe) Growth Rates (%)
Sector 1980 1999 2020 1980-1999 1999-2020
Industry 5.1 20.7 49.5 7.6 4.3
Transport 4.0 18.2 46.2 8.3 4.5
Commercial 0.4 2.3 6.8 10.1 5.3
Residential 6.0 8.0 13.4 1.5 2.5
Others 0.4 0.7 2.5 2.4 6.3
Total 15.9 49.9 118.4 6.2 4.2
Energy Type
Coal and Coal Products 0.1 3.7 11.8 21.4 5.7
Oil and Oil Products 8.0 29.2 69.6 7.0 4.2
Natural Gas - 1.0 3.4 - 5.1
Electricity 1.1 7.0 21.7 10.1 5.5
Renewables 6.7 9.0 11.8 1.6 1.3
Total 15.9 49.9 118.4 6.2 4.2 Source History: IEA (2001), Projection: APERC (2002)
Projected transport sector energy demand shows an increase at an annual rate of 4.5 percent for the coming two decades, compared with the previous two decades� growth of 8.3 percent annually. Over the forecast period, energy demand by road transport is projected to slightly decline, but will still have the highest share of total transport demand at around 84.0 percent by 2020, compared with 84.6 percent in 1999. Energy demand for air transport will rise from 14.5 percent in 1999 to 15.3 percent by 2020. Diesel and gasoline together constitute the largest share in road

APPENDI X THAILAN D
PAGE 229
transport and they are expected to maintain the highest share at around 71.4 and 26.8 percent, respectively, in 2020.
Residential energy demand is expected to grow steadily at 2.5 percent per year in 1999-2020, faster than in the previous two decades, when it grew by 1.5 percent annually. The shares of electricity and LPG in the residential sector are projected to grow over the forecast period from 19.6 and 18.1 percent in 1999 to 31.8 and 28.5 percent in 2020, respectively. Growth rates of electricity and LPG will be 4.9 and 4.7 percent per year during the forecast period. Biomass and charcoal will decline from 32.0 and 29.9 percent in 1999 to 20.4 and 19.1 percent in 2020, respectively, growing at the same rate of 0.3 percent per year. Commercial sector energy demand is projected to increase by 5.3 percent per year over the coming two decades, compared with a growth rate of 10.1 percent in the two previous decades. Energy demand in the commercial sector shows electricity growing at a rate of 5.3 percent per year.
PRIMARY ENERGY SUPPLY
The reference case projects primary energy supply will grow by 4.0 percent per year, down from 6.1 percent in the previous two decades. As Table 90 and Figure 67 show, the shares of oil and oil products will slightly decrease from 48.4 percent in 1999 to 46.7 percent in 2020, growing at a rate of 3.7 percent per year. Slow growth in oil supply is due to increases in coal and natural gas, which will replace oil, particularly in the power sector. Coal�s share will rise continuously, from 10.5 percent in 1999 to 20.7 percent in 2020, with a growth rate of 7.4 percent per year. Natural gas�s share is projected to slightly decline from 21.3 percent to 20.4 percent in 2020, growing at a rate of 3.7 percent per year. Imported electricity is projected to grow faster during the forecast period, rising at a rate of 11.5 percent per year, compared with 5.5 percent per year in the previous two decades.
Table 90 Thailand: Primary Energy Supply
Energy Supply (Mtoe) Growth Rates (%)
Energy Type 1980 1999 2020 1980-1999 1999-2020
Coal 0.5 7.3 32.5 15.5 7.4
Oil & Oil Products 11.5 33.9 73.1 5.8 3.7
Natural Gas - 14.9 32.0 12.7 3.7
Nuclear - - - - -
Hydro 0.1 0.3 0.8 5.1 5.3
New and Renewables 10.6 13.6 18.3 1.3 1.4
Electricity 0.1 0.2 1.8 5.5 11.5
Total 22.7 70.2 158.5 6.1 4.0 Source History: IEA (2001), Projection: APERC (2002)
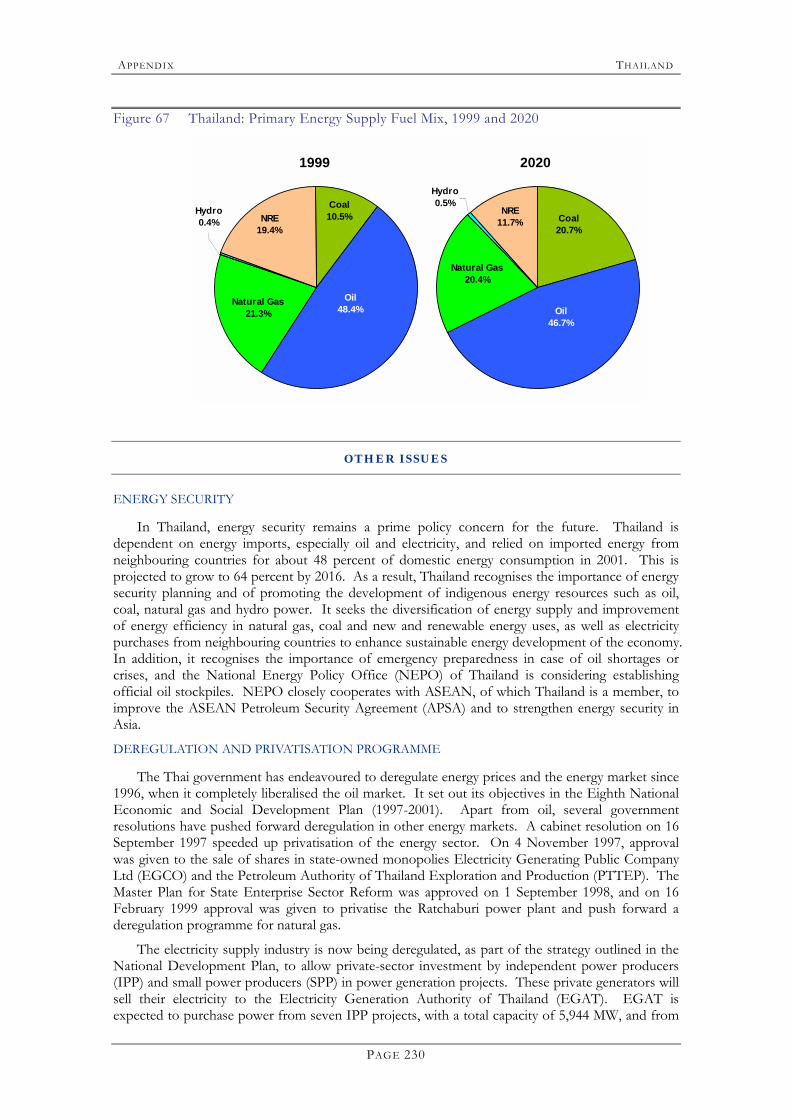
APPENDI X THAILAN D
PAGE 230
Figure 67 Thailand: Primary Energy Supply Fuel Mix, 1999 and 2020
1999
Natural Gas21.3%
NRE19.4%
Coal 10.5%
Oil 48.4%
Hydro0.4%
2020
Hydro0.5%
Oil 46.7%
Coal 20.7%
NRE11.7%
Natural Gas20.4%
OTHER ISSUES
ENERGY SECURITY
In Thailand, energy security remains a prime policy concern for the future. Thailand is dependent on energy imports, especially oil and electricity, and relied on imported energy from neighbouring countries for about 48 percent of domestic energy consumption in 2001. This is projected to grow to 64 percent by 2016. As a result, Thailand recognises the importance of energy security planning and of promoting the development of indigenous energy resources such as oil, coal, natural gas and hydro power. It seeks the diversification of energy supply and improvement of energy efficiency in natural gas, coal and new and renewable energy uses, as well as electricity purchases from neighbouring countries to enhance sustainable energy development of the economy. In addition, it recognises the importance of emergency preparedness in case of oil shortages or crises, and the National Energy Policy Office (NEPO) of Thailand is considering establishing official oil stockpiles. NEPO closely cooperates with ASEAN, of which Thailand is a member, to improve the ASEAN Petroleum Security Agreement (APSA) and to strengthen energy security in Asia. DEREGULATION AND PRIVATISATION PROGRAMME
The Thai government has endeavoured to deregulate energy prices and the energy market since 1996, when it completely liberalised the oil market. It set out its objectives in the Eighth National Economic and Social Development Plan (1997-2001). Apart from oil, several government resolutions have pushed forward deregulation in other energy markets. A cabinet resolution on 16 September 1997 speeded up privatisation of the energy sector. On 4 November 1997, approval was given to the sale of shares in state-owned monopolies Electricity Generating Public Company Ltd (EGCO) and the Petroleum Authority of Thailand Exploration and Production (PTTEP). The Master Plan for State Enterprise Sector Reform was approved on 1 September 1998, and on 16 February 1999 approval was given to privatise the Ratchaburi power plant and push forward a deregulation programme for natural gas.
The electricity supply industry is now being deregulated, as part of the strategy outlined in the National Development Plan, to allow private-sector investment by independent power producers (IPP) and small power producers (SPP) in power generation projects. These private generators will sell their electricity to the Electricity Generation Authority of Thailand (EGAT). EGAT is expected to purchase power from seven IPP projects, with a total capacity of 5,944 MW, and from
APPENDI X THAILAN D
PAGE 231
approximately 55 SPP projects, with estimated total sales of 2,500 MW. Purchases from IPPs and SPPs will reduce the amount of power generation infrastructure investment required by EGAT.
The natural gas supply industry (GSI) currently operates as a state-owned monopoly. Plans outlined in the National Development Plan to introduce third-party access to PTTEP's natural gas pipeline system are still in the development stage. Third-party access would allow gas traders, other than PTTEP, to access transport services and would facilitate direct gas sales between gas producers and gas users.
To facilitate its programme of privatisation and deregulation in the energy sector and promote competition in liberalised energy markets, the government has introduced a bill that would allow a number of state enterprises to be privatised without any further change in the law. Under the bill, expected to become law soon, privatisation could be implemented without delay. In other cases, state enterprises need to be turned into corporations first.
ENERGY CONSERVATION
In 2000, under a newly established government, Thailand declared �energy conservation� a crucial component of energy policy. The policy aims to achieve sustainable development; that is, to promote the efficient use of energy without depleting domestic natural resources or harming the environment. Efforts are also being made to reduce dependence on foreign energy sources. In accordance with this policy, the government continues to promote the use and exploitation of domestic natural gas and alternative energy sources. The government also promotes research and development of innovative energy sources. The government is emphasising energy management to increase the competitiveness of the industrial sector and to enhance the stability of energy prices through appropriate monetary, fiscal and managerial measures.
GHG EMISSION REDUCTION
Thailand is working to minimise air pollution from energy production and usage, in accordance with objectives outlined in the Eighth National Economic and Social Development Plan (1997-2001). In 1999, to correspond with vehicle emission standards, low-sulphur diesel (sulphur content of 0.05 percent or less) was made mandatory. Sulphur content in fuel oil for electricity generation and industry was also reduced, to two percent in Bangkok, Samut Prakarn and other provinces where a large number of industrial factories are located. The government is also promoting the use of clean fuels, such as natural gas and LPG, as substitutes for oil in power plants and industrial factories, as well as in commercial vehicles in the Bangkok Metropolitan area.
REFERENCES
IEA Data base, 2000
APERC�s data, 2002
“Forecast on Thailand’s Energy Situation during the Period 2001-2016”. NEPO. 2001.
“Sectoral Analysis Demand and Forecasting”. NEPO. 2001.

APPENDI X THAILAN D
PAGE 232

APPENDI X UNITED STAT ES
PAGE 233
U N I T E D S TAT E S INTROD UCTION
The United States (US) is the world�s largest and most influential economy. In 1999, total GDP was 1990 US$7.66 trillion or 48.5 percent of the APEC total. The US is located in North America between Canada and Mexico, has a population of 272 million people (1999) and a geographical size of 9.3 million square km.
The United States has enjoyed economic growth of about 3.2 percent per annum between 1980 and 1999. Growth has averaged 3.5 percent per annum since the recession of 1991 and was particularly robust from 1995 to 2000, with the economy expanding by four percent per annum. Inflation at 3.4 percent and unemployment at 4.1 percent were both low in 2000. Since then, the bursting of the �technology bubble�, wider corporate weakness, a number of large corporate �Chapter 11� bankruptcies, notably Enron and Worldcom, and associated corporate malfeasance as well as the terrorist attacks of September 11th have contributed to slower economic growth in the short-term.
However, there remains considerable optimism regarding continued superior (by developed economy standards) economic performance in the longer term. For this Outlook, the long-term forecast for the US economy is for GDP to grow at approximately 3.2 percent. Population growth at 1.1 percent annually to 2020 (Table 91), driven strongly by immigration (accounting for about 40 percent) will add almost three million people per year through to 2020. Increasing population will contribute to GDP, and will require housing and transport services. Economic and population growth are expected to be the main drivers of continued energy demand growth despite improvements in energy efficiency and economic productivity.
Table 91 United States: Various Indicators
Absolute Levels Growth Rates (%)
1980 1999 2020 1980-1999 1999-2020
GDP (Billion 1990 US$) 4,239.9 7,662.1 14,887.9 3.2 3.2
Population (Millions) 227.2 272.2 342.3 1.0 1.1
GDP per capita 18,660 28,145 43,491 2.2 2.1
Energy Intensitya 427.3 296.3 202.5 -1.9 -1.8
Energy per capita (toe/person) 8.0 8.3 8.8 0.2 0.3
CO2 Emissions per capitab 21.0 20.8 22.7 0.0 0.4
CO2 Emissions per $ of GDPc 1.1 0.7 0.5 -2.1 -1.7 Source GDP and Population: DRI-WEFA (2001), Energy and CO2 (History): IEA (2001), Energy and CO2 (Projection):
APERC (2002) a toe per million 1990 US$; b tonnes; c kg per 1990 US$
SUMMARY OF FORECAST RESULTS
FINAL ENERGY CONSUMPTION
Final energy consumption in the USA is projected to grow by 1.6 percent per annum over the next two decades. The transport sector leads the growth with 2.1 percent, followed by the
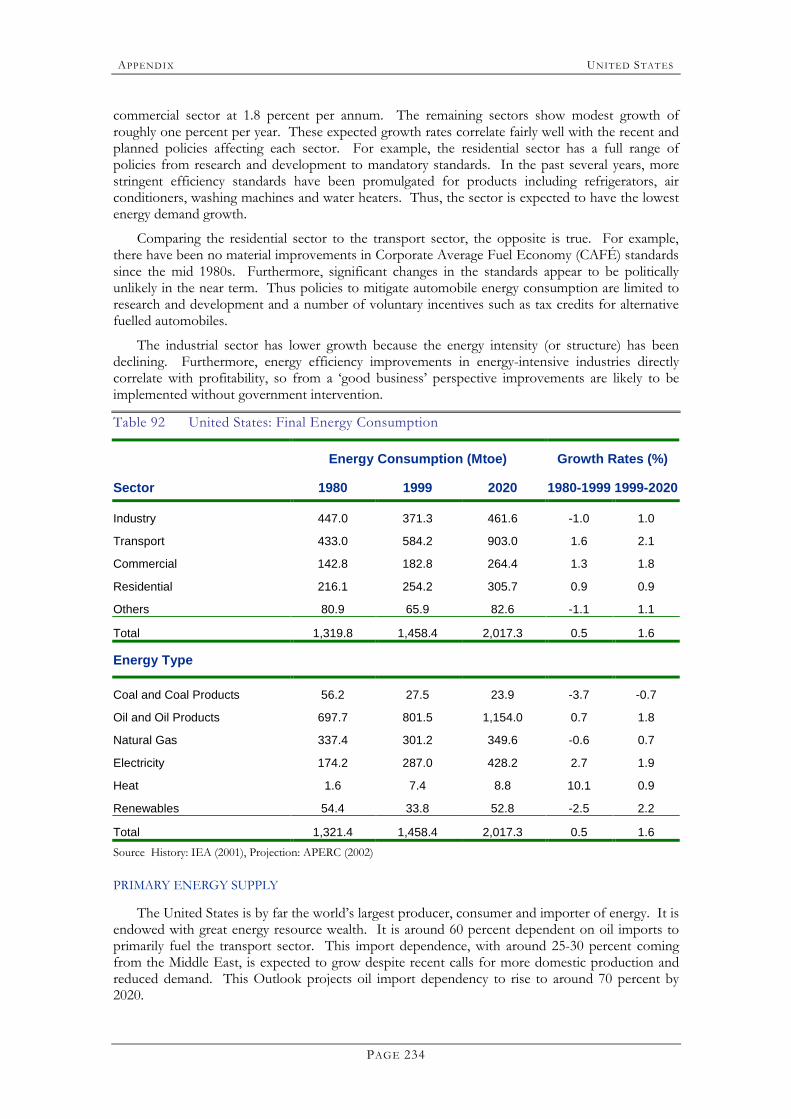
APPENDI X UNITED STAT ES
PAGE 234
commercial sector at 1.8 percent per annum. The remaining sectors show modest growth of roughly one percent per year. These expected growth rates correlate fairly well with the recent and planned policies affecting each sector. For example, the residential sector has a full range of policies from research and development to mandatory standards. In the past several years, more stringent efficiency standards have been promulgated for products including refrigerators, air conditioners, washing machines and water heaters. Thus, the sector is expected to have the lowest energy demand growth.
Comparing the residential sector to the transport sector, the opposite is true. For example, there have been no material improvements in Corporate Average Fuel Economy (CAFÉ) standards since the mid 1980s. Furthermore, significant changes in the standards appear to be politically unlikely in the near term. Thus policies to mitigate automobile energy consumption are limited to research and development and a number of voluntary incentives such as tax credits for alternative fuelled automobiles.
The industrial sector has lower growth because the energy intensity (or structure) has been declining. Furthermore, energy efficiency improvements in energy-intensive industries directly correlate with profitability, so from a �good business� perspective improvements are likely to be implemented without government intervention.
Table 92 United States: Final Energy Consumption
Energy Consumption (Mtoe) Growth Rates (%)
Sector 1980 1999 2020 1980-1999 1999-2020
Industry 447.0 371.3 461.6 -1.0 1.0
Transport 433.0 584.2 903.0 1.6 2.1
Commercial 142.8 182.8 264.4 1.3 1.8
Residential 216.1 254.2 305.7 0.9 0.9
Others 80.9 65.9 82.6 -1.1 1.1
Total 1,319.8 1,458.4 2,017.3 0.5 1.6
Energy Type
Coal and Coal Products 56.2 27.5 23.9 -3.7 -0.7
Oil and Oil Products 697.7 801.5 1,154.0 0.7 1.8
Natural Gas 337.4 301.2 349.6 -0.6 0.7
Electricity 174.2 287.0 428.2 2.7 1.9
Heat 1.6 7.4 8.8 10.1 0.9
Renewables 54.4 33.8 52.8 -2.5 2.2
Total 1,321.4 1,458.4 2,017.3 0.5 1.6 Source History: IEA (2001), Projection: APERC (2002) PRIMARY ENERGY SUPPLY
The United States is by far the world�s largest producer, consumer and importer of energy. It is endowed with great energy resource wealth. It is around 60 percent dependent on oil imports to primarily fuel the transport sector. This import dependence, with around 25-30 percent coming from the Middle East, is expected to grow despite recent calls for more domestic production and reduced demand. This Outlook projects oil import dependency to rise to around 70 percent by 2020.
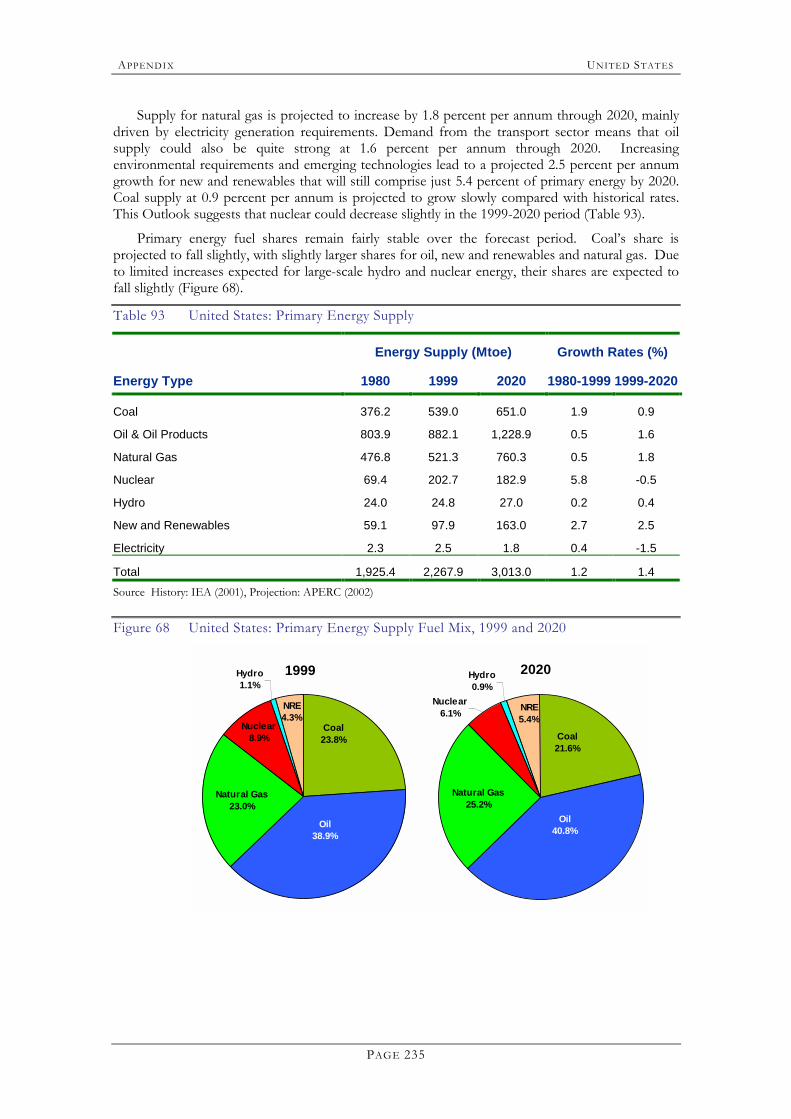
APPENDI X UNITED STAT ES
PAGE 235
Supply for natural gas is projected to increase by 1.8 percent per annum through 2020, mainly driven by electricity generation requirements. Demand from the transport sector means that oil supply could also be quite strong at 1.6 percent per annum through 2020. Increasing environmental requirements and emerging technologies lead to a projected 2.5 percent per annum growth for new and renewables that will still comprise just 5.4 percent of primary energy by 2020. Coal supply at 0.9 percent per annum is projected to grow slowly compared with historical rates. This Outlook suggests that nuclear could decrease slightly in the 1999-2020 period (Table 93).
Primary energy fuel shares remain fairly stable over the forecast period. Coal�s share is projected to fall slightly, with slightly larger shares for oil, new and renewables and natural gas. Due to limited increases expected for large-scale hydro and nuclear energy, their shares are expected to fall slightly (Figure 68).
Table 93 United States: Primary Energy Supply
Energy Supply (Mtoe) Growth Rates (%)
Energy Type 1980 1999 2020 1980-1999 1999-2020
Coal 376.2 539.0 651.0 1.9 0.9
Oil & Oil Products 803.9 882.1 1,228.9 0.5 1.6
Natural Gas 476.8 521.3 760.3 0.5 1.8
Nuclear 69.4 202.7 182.9 5.8 -0.5
Hydro 24.0 24.8 27.0 0.2 0.4
New and Renewables 59.1 97.9 163.0 2.7 2.5
Electricity 2.3 2.5 1.8 0.4 -1.5
Total 1,925.4 2,267.9 3,013.0 1.2 1.4 Source History: IEA (2001), Projection: APERC (2002) Figure 68 United States: Primary Energy Supply Fuel Mix, 1999 and 2020
1999Hydro1.1%
Nuclear8.9%
Oil 38.9%
Coal 23.8%
NRE4.3%
Natural Gas23.0%
2020
Natural Gas25.2%
NRE5.4%
Coal 21.6%
Oil 40.8%
Nuclear6.1%
Hydro0.9%
APPENDI X UNITED STAT ES
PAGE 236
OTHER ISSUES
ENERGY SECURITY
The US has strongly supported the APEC Energy Security Initiative and was prominent in its formation.
There is heightened concern regarding energy security because of the September 11th attacks. There has been a renewed interest in increasing domestic oil and gas production by drilling in the protected Arctic National Wildlife Refuge in Alaska. There is opposition to this by the public and many political leaders. The US continues to diversify its oil imports with significant amounts coming from the Middle East, Canada, Mexico, South America and increasing from Africa. Recently, it received its first shipments from Russia.
The US operates a Strategic Petroleum Reserve (SPR) that at its peak in 1994 held 592 million barrels of oil. For many years since its inception in 1977, the SPR held the equivalent of over 100 days of imports. In recent years, this coverage has fallen to around 50-60 days of imports. In November 2001, President Bush instructed the Department of Energy to fill the SPR to its capacity of 700 million barrels. In practice, the facility, which has a number of storage facilities in Texas and Louisiana, has a maximum sustainable withdrawal rate of around 4.1 mbd for ninety days and lower thereafter, if necessary.
Additionally, there has been a renewed interest in increasing the stringency of the CAFE standards for automobiles. However, neither measure was included in a recent energy bill. Thus, there are no new policies in place to significantly alter the trend of increasing oil demand and import dependence.
The Farm Security and Rural Investment Act of 2002 will provide for increased subsidies to promote biodiesel and fuel-grade ethanol production along with other energy-efficiency investments, but these are not expected to make a material difference to US energy demand or to import dependence.
ENERGY EFFICIENCY
Funding for energy efficiency and renewable energy research and development, and deployment programmes for all sectors of the economy, will continue to improve the overall efficiency of the economy. Energy consumption per unit of GDP will continue to decline, but total energy demand will continue to grow (at a projected rate of 1.4 percent per annum for primary energy). Initiatives such as Renewable Portfolio Standards (RPS), specifying fixed portions of electricity generation by some states, will enable total renewable energy sources to grow at extraordinary rates, but overall, carbon-intensive resources will continue to overshadow environmentally friendly production.
CARBON EMISSIONS
Under the Kyoto Protocol, the US agreed to reduce its emissions to seven percent below 1990 levels in the 2008-12 commitment period. The projections in this Outlook suggest that this target is unlikely to be met. However the target does not become binding until the Protocol is ratified. In February 2002, the Bush Administration announced that it would not ratify the Protocol in its present form, citing that it would damage the US economy.
APPENDI X VIET NAM
PAGE 237
V I E T N A M INTROD UCTION
Viet Nam�s territory covers 331,111 square km. It has a coastline of 3,444 km and land borders of 4,639 km with China, Cambodia and Laos. Real GDP in 1999 was 1990 US$16.53 billion. The population was 77.5 million as of 1999. GDP per capita at 1990 US$213.2 is low by APEC standards (Table 94).
Energy intensity in 1999 was 2.130 toe per million 1990 US$ of GDP while energy consumption per capita was 0.45 toe. Viet Nam has one of the lowest levels of per capita income and energy consumption among APEC members. Consequently, CO2 emissions per capita were among the lowest at 0.49 tonnes, while CO2 intensity was 2.28 tonnes per million 1990 US$. Starting at very low levels, those ratios are projected to increase to 0.82 toe per person, 1.77 tonnes per person and 3.07 tonnes per million 1990 US$, and energy intensity to decline to 1,434 toe per million 1990 US$ in 2020, respectively.
Viet Nam successfully carried out its planned socio-economic renovation (doi moi) from 1986. The most important socio-economic changes in this period were: 1) Changing the economy from a centralised structure reliant on government planning to one in which the state takes an overview, setting only general regulations on pricing and market mechanisms; 2) Switching from reliance on state and collective ownership to a multi-component economy; 3) Changing from a closed to an �open door� economy with multilateral international cooperation. Even so, the State sector continues to play a leading role in the economy:
By 1995, the Viet Nam economy had fully recovered from the long-lasting effects of the Viet Nam War and could list achievements including continuous growth in food production; ending stagnation in industrial production; rapidly increasing foreign direct investment (FDI); rapidly increasing exports of goods; and continuous high economic growth. The inflation rate declined from 500 percent in 1988 to 14.4 percent in 1994 and five percent in 2001.
The contribution to GDP of industry rose from 22.6 percent in 1990 to 29.1 percent in 1995 and 36.6 percent in 2000, but that of agriculture declined from 38.7 percent in 1990 to 29 percent in 1995 and 24.3 percent in 2000. The service sector also increased its contribution from 38.6 percent in 1990 to 41.9 percent in 1995 and 39.1 percent in 2000.
Table 94 Viet Nam: Various Indicators
Absolute Levels Growth Rates (%)
1990 1999 2020 1990-1999 1999-2020
GDP (Billion 1990 US$) 7.0 16.5 59.0 10.0 6.2
Population (Millions) 61.1 77.5 102.6 2.7 1.3
GDP per capita 114.4 213.2 575.5 7.2 4.8
Energy Intensitya 3,531.8 2,130.1 1,433.9 -5.5 -1.9
Energy per capita (toe/person) 0.4 0.5 0.8 1.3 2.9
CO2 Emissions per capitab 0.3 0.5 1.8 5.8 6.3
CO2 Emissions per $ of GDPc 2.6 2.3 3.1 -1.3 1.4 Source GDP and Population: DRI-WEFA (2001), Energy and CO2 (History): IEA (2001), Energy and CO2 (Projection):
APERC (2002) a toe per million 1990 US$; b tonnes; c kg per 1990 US$
APPENDI X VIET NAM
PAGE 238
Real GDP is projected to grow 6.2 percent per year in 1999-2020, which is lower than the previous 14 years, when it grew by 6.8 percent per year.
The population is projected to increase by 1.3 percent per year in the forecast period, compared with a growth rate of 1.8 percent per year in the previous 14 years.
SUMMARY OF FORECAST RESULTS
FINAL ENERGY CONSUMPTION
In 2020, the share of energy demand by the residential sector is projected to remain the highest of any sector at 44.6 percent, though the average growth will slow to 1.4 percent per year, slower than the previous two decades, when it grew by 2.3 percent per year. The share is comparatively high due to the inclusion of biomass. Faster growth is expected for transport, with a share of 33.6 percent, industry and agriculture with a 18.5 percent share, and commercial with 3.3 percent. Over 1999-2020, energy use in industry and agriculture will increase by 6.0 percent per year (Table 95). The share of energy demand in the industry sector will rise when Viet Nam builds up a number of heavy industries such as petroleum, metallurgy, mechanical engineering, basic chemicals, fertiliser, power plants and building materials.
Energy demand in the commercial sector is projected to rise by 4.2 percent per year during the forecast period. In this sector, electricity demand shows fast annual growth of 7.0 percent, which is followed by diesel, fuel oil, kerosene, LPG and other petroleum products at 4.0 percent. The lowest growth rate is coal with 1.0 percent. The share of electricity in the commercial sector will increase from 10.7 percent in 1999 to 18.5 percent in 2020, while that of coal will fall from 8.8 percent in 1999 to 4.6 percent in 2020.
Table 95 Viet Nam: Final Energy Consumption
Energy Consumption (Mtoe) Growth Rates (%)
Sector 1990 1999 2020 1990-1999 1999-2020
Industry 2.3 3.8 13.0 6.0 6.0
Transport 1.4 4.5 23.6 13.6 8.1
Commercial 0.2 1.0 2.3 21.7 4.2
Residential 0.7 23.1 31.2 47.6 1.4
Others 0.0 - - -100.0 -
Total 4.6 32.5 70.1 24.2 3.7
Energy Type
Coal and Coal Products 1.6 2.2 4.3 3.6 3.3
Oil and Oil Products 2.5 7.0 31.9 12.1 7.5
Natural Gas - - 1.0 - -
Electricity 0.5 1.7 8.9 13.6 8.2
Renewables - 21.6 24.0 - 0.5
Total 4.6 32.5 70.1 24.2 3.7 Source History: IEA (2001), Projection: APERC (2002)
In the transport sector, energy demand is projected to rise by 8.1 percent per year. Transport demand for diesel will continue to have the highest share, and is projected to be 60.5 percent in
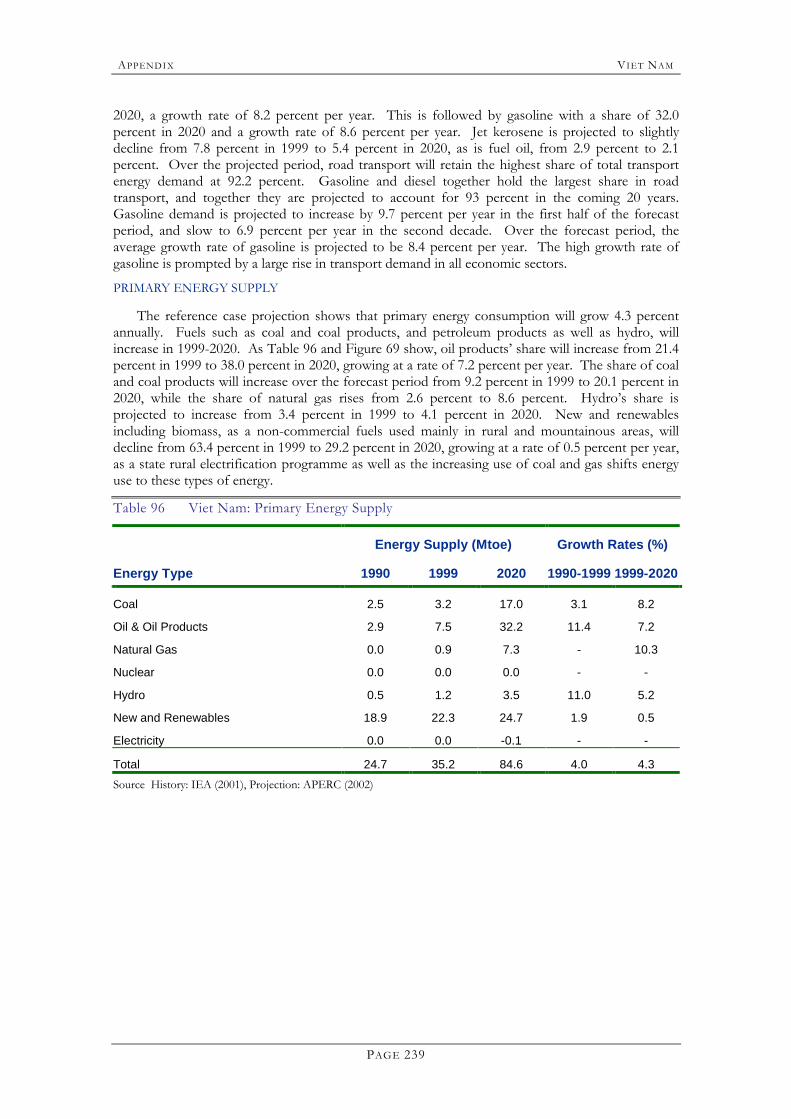
APPENDI X VIET NAM
PAGE 239
2020, a growth rate of 8.2 percent per year. This is followed by gasoline with a share of 32.0 percent in 2020 and a growth rate of 8.6 percent per year. Jet kerosene is projected to slightly decline from 7.8 percent in 1999 to 5.4 percent in 2020, as is fuel oil, from 2.9 percent to 2.1 percent. Over the projected period, road transport will retain the highest share of total transport energy demand at 92.2 percent. Gasoline and diesel together hold the largest share in road transport, and together they are projected to account for 93 percent in the coming 20 years. Gasoline demand is projected to increase by 9.7 percent per year in the first half of the forecast period, and slow to 6.9 percent per year in the second decade. Over the forecast period, the average growth rate of gasoline is projected to be 8.4 percent per year. The high growth rate of gasoline is prompted by a large rise in transport demand in all economic sectors.
PRIMARY ENERGY SUPPLY
The reference case projection shows that primary energy consumption will grow 4.3 percent annually. Fuels such as coal and coal products, and petroleum products as well as hydro, will increase in 1999-2020. As Table 96 and Figure 69 show, oil products� share will increase from 21.4 percent in 1999 to 38.0 percent in 2020, growing at a rate of 7.2 percent per year. The share of coal and coal products will increase over the forecast period from 9.2 percent in 1999 to 20.1 percent in 2020, while the share of natural gas rises from 2.6 percent to 8.6 percent. Hydro�s share is projected to increase from 3.4 percent in 1999 to 4.1 percent in 2020. New and renewables including biomass, as a non-commercial fuels used mainly in rural and mountainous areas, will decline from 63.4 percent in 1999 to 29.2 percent in 2020, growing at a rate of 0.5 percent per year, as a state rural electrification programme as well as the increasing use of coal and gas shifts energy use to these types of energy.
Table 96 Viet Nam: Primary Energy Supply
Energy Supply (Mtoe) Growth Rates (%)
Energy Type 1990 1999 2020 1990-1999 1999-2020
Coal 2.5 3.2 17.0 3.1 8.2
Oil & Oil Products 2.9 7.5 32.2 11.4 7.2
Natural Gas 0.0 0.9 7.3 - 10.3
Nuclear 0.0 0.0 0.0 - -
Hydro 0.5 1.2 3.5 11.0 5.2
New and Renewables 18.9 22.3 24.7 1.9 0.5
Electricity 0.0 0.0 -0.1 - -
Total 24.7 35.2 84.6 4.0 4.3 Source History: IEA (2001), Projection: APERC (2002)
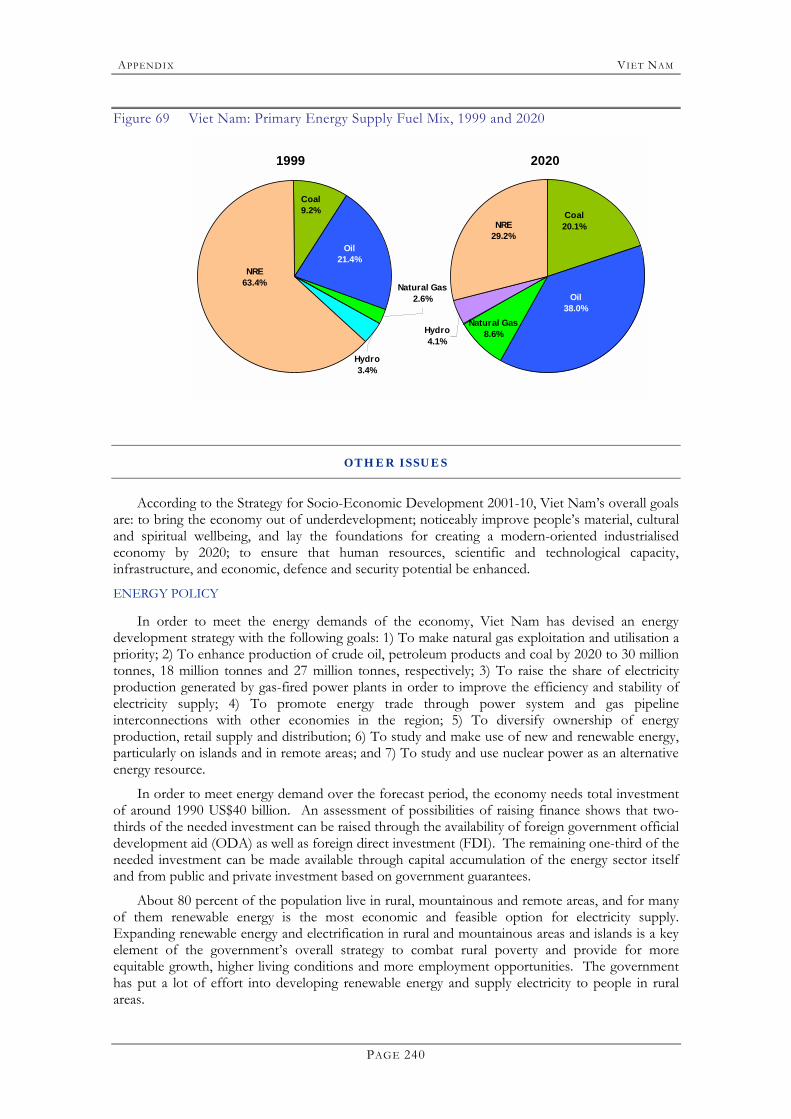
APPENDI X VIET NAM
PAGE 240
Figure 69 Viet Nam: Primary Energy Supply Fuel Mix, 1999 and 2020
1999
Hydro3.4%
Oil 21.4%
Coal 9.2%
NRE63.4% Natural Gas
2.6%
2020
Hydro4.1%
Oil 38.0%
Coal 20.1%NRE
29.2%
Natural Gas8.6%
OTHER ISSUES
According to the Strategy for Socio-Economic Development 2001-10, Viet Nam�s overall goals are: to bring the economy out of underdevelopment; noticeably improve people�s material, cultural and spiritual wellbeing, and lay the foundations for creating a modern-oriented industrialised economy by 2020; to ensure that human resources, scientific and technological capacity, infrastructure, and economic, defence and security potential be enhanced.
ENERGY POLICY
In order to meet the energy demands of the economy, Viet Nam has devised an energy development strategy with the following goals: 1) To make natural gas exploitation and utilisation a priority; 2) To enhance production of crude oil, petroleum products and coal by 2020 to 30 million tonnes, 18 million tonnes and 27 million tonnes, respectively; 3) To raise the share of electricity production generated by gas-fired power plants in order to improve the efficiency and stability of electricity supply; 4) To promote energy trade through power system and gas pipeline interconnections with other economies in the region; 5) To diversify ownership of energy production, retail supply and distribution; 6) To study and make use of new and renewable energy, particularly on islands and in remote areas; and 7) To study and use nuclear power as an alternative energy resource.
In order to meet energy demand over the forecast period, the economy needs total investment of around 1990 US$40 billion. An assessment of possibilities of raising finance shows that two-thirds of the needed investment can be raised through the availability of foreign government official development aid (ODA) as well as foreign direct investment (FDI). The remaining one-third of the needed investment can be made available through capital accumulation of the energy sector itself and from public and private investment based on government guarantees.
About 80 percent of the population live in rural, mountainous and remote areas, and for many of them renewable energy is the most economic and feasible option for electricity supply. Expanding renewable energy and electrification in rural and mountainous areas and islands is a key element of the government�s overall strategy to combat rural poverty and provide for more equitable growth, higher living conditions and more employment opportunities. The government has put a lot of effort into developing renewable energy and supply electricity to people in rural areas.
APPENDI X VIET NAM
PAGE 241
ENERGY SECURITY
Viet Nam is currently implementing reforms in the energy sector. The government is focusing on institutional restructuring, energy pricing and energy financing. Viet Nam is also trying to diversify its consumption of energy products. By developing indigenous resources and expanding regional cooperation, Viet Nam hopes to minimise its dependence on oil. Another priority is to ensure that it has adequate energy supplies to meet the needs of a growing population and to support socio-economic development. To meet this goal, energy conservation and efficient use of energy are encouraged. Another benefit of using energy wisely is that it supports sustainable economic development and minimises harm to the environment.
GHG EMISSION REDUCTION
In 1994, the National Assembly established the Law on Environmental Protection. It has regulations on permissible limits of discharge of smoke, dust, wastewater, toxic gases and deforestation. GHG emissions are being monitored by state environmental climate agencies.
From 1994 until now, Viet Nam has eliminated more than 40 percent of ozone depleting substances (ODS) with support from world organisations, in a project that aims to eliminate 232 million tons of ODS.
REFERENCES
IEA Data base, 2000
“Strategy for Socio-economic Development 2001-2010”. Central committee, 8th Tenure to the 9th National Congress.
“National Energy Policy until 2010 and 2020”. Hanoi, 2000
“Viet Nam Energy Review”, Hanoi, 1995
“Science base on Socio-economic Development Strategy of Viet Nam up to 2010 and 2020”. Hanoi, 2001.
“Viet Nam Economy 1955 –2000 period”. Hanoi, 2000
“Master Plan of Coal Development until 2020 and estimate to 2030”. VINACOAL. 2000
“Master plan of Gas development up to 2020”. PetroVietnam. 1997.
“General Electricity Development of Viet Nam up to 2010 and estimates to 2020”. Hanoi, 2000
“Viet Nam Development News”. Hanoi, December 1999