![Potential temperature section [Deg C] Intermediate Water Atlantic cold Atlantic warm Polar water.](https://static.fdocuments.in/doc/165x107/56649ece5503460f94bdb881/potential-temperature-section-deg-c-intermediate-water-atlantic-cold-atlantic.jpg)
Potential temperature section [Deg C] Intermediate Water Atlantic cold Atlantic warm Polar water.
Upload
duongduongCategory
view
222download
4


2016 Sacramento River Temperature Management Plan
Bureau of Reclamation
June 7, 2016 (updated June 24, 2016)
This document represents the Bureau of Reclamation’s (Reclamation) Sacramento River
Temperature Management Plan for Water Year 2016 (2016 Plan) pursuant to the Reasonable and
Prudent Alternative (RPA) Action I.2.4 of the 2009 National Marine Fisheries Service (NMFS)
Biological Opinion (2009 BiOp) for the Coordinated Long-Term Operation of the Central Valley
Project (CVP) and State Water Project (SWP), as well as State Water Resources Control Board
(SWRCB) Order 90-5. The 2016 Plan was formulated with considerable technical input from
Federal and State biologists and from stakeholders. The Plan represents Reclamation’s best
effort to balance numerous system-wide water demands and the seasonal river temperatures to be
protective of winter-run Chinook salmon in their early life stages. The Plan helps maintain water
supplies and provides a foundation to improve summer outflow to benefit delta smelt.
Plan Description
Base Operations
After several severe drought years, storage conditions at Shasta Lake are much better than in
water year (WY) 2014 and WY 2015 in terms of both total storage and volume of cold water.
The 2016 Plan consists of Keswick releases through the summer ranging from average monthly
flows of 9,000 cfs in June and 10,500 cfs in July to 5,500 cfs by November. These flows are
consistent with the operations outlined by Reclamation in March of this year. The temperature
compliance point and metric would be not to exceed 56.0° Fahrenheit (F) daily average
temperature (DAT) at Balls Ferry, in compliance with RPA Action I.2.4 of the 2009 BiOp. To
achieve compliance at this location, an average release temperature of 52.5°F is planned from
Keswick Dam. Anticipated temperature performance of the 2016 Plan is reflected in Table 1, as
well as the projected temperatures at various locations in the Sacramento River (Attachment A).
Average flows by month are shown in Table 1 below, and would be subject to adjustment for
real-time conditions based on performance of the plan. The timing for reductions in flows in
September and October would be scheduled in coordination with the fishery agencies to reduce
risk of redd dewatering. Fall flow reductions would occur once all winter-run Chinook salmon
fry are estimated to have emerged from their redds, but as early as possible to reduce stranding of
fall-run Chinook redds in the upper Sacramento reach. Under the 2016 Plan, full side gate
operation of the Shasta Dam Temperature Control Device (TCD) is not projected to occur until
October 9, 2016.

2
Table 1 - Average Monthly Flow/Temperature
June July August September October
Keswick Average Flow (cfs) 9,000 10,500 10,000 9,000 6,500
Keswick Average Temperature (deg F) 52.42 52.41 52.39 52.35 52.30
Balls Ferry Average Temperature (deg F) 55.03 54.96 54.58 53.85 53.01
Jellys Ferry Average Temperature (deg F) 56.42 56.37 55.82 54.75 53.47
In order to mitigate risk for maintenance of the temperature at this location, the modeling is
based on a 90% exceedance hydrology forecast, and a 10% L3MTO (local 3 month temperature
outlook) meteorological data set. Reclamation will monitor temperature performance, TCD
operations, and isothermobath characteristics on a weekly basis through increased monitoring of
the Shasta Lake isothermobath profile and temperature modeling to provide an opportunity for
in-season assessment of cold water volume and monthly release objectives.
Real-time Management
The average flows shown in Table 1 are guidelines for base operations; actual daily releases will
be based on real-time monitoring to ensure temperature compliance is accomplished, winter-run
redd dewatering is minimized, and other downstream diversion, flow, and Delta requirements are
met. Decision-making for significant changes in real-time operations will be coordinated with a
group of Federal and State agencies including Reclamation, NMFS, the U.S. Fish and Wildlife
Service, California Department of Water Resources, California Department of Fish and Wildlife,
and State Water Resources Control Board. This group, recently referred to as the Shasta Water
Interagency Management (SWIM) Team, will utilize information from its member agencies, as
well as technical information from the Sacramento River Temperature Task Group (SRTTG) and
other relevant stakeholders, to inform decisions and changes in operations.
Reclamation will monitor temperature performance, TCD operations, and isothermobath
characteristics on a weekly basis. The specific tasks include:
Increased frequency of temperature profiles at Shasta Lake (weekly on Mondays, on
Tuesdays if the Monday is a holiday);
Temperature Model update every week based on the new profile (to be provided to the
SWIM Team 2 days after the temperature profiles);

3
Comparison of forecasted inflow volume and air temperatures with observed;
Weekly SWIM team update calls.
o Reclamation will ensure that materials are sent out to the SWIM Team members
prior to the weekly meetings. These materials will include the results of all real-
time monitoring [including reporting of the 7-day average of the daily maximums
(7DADM) temperatures at the SAC and CCR CDEC gaging stations] and
modeling efforts. Reclamation also commits to sharing all data files within 24
hours of requests;
o The SWIM Team will strive to reach consensus on various temperature
management strategies including anticipated TCD gate operations and
intermediate river temperatures upstream of Balls Ferry (e.g. viability of a
supplemental or exception criteria for a 7DADM objective through the spawning
areas). The SWIM team shall consider the location of redds, the weather
forecasts, the volume of available cold water, inflows, the integrated operations
with the Trinity River Division, and other real-time considerations. The SWIM
team will also provide advice on minimizing potential effects of redd de-watering
and stranding, based on any flow changes resulting from implementation of the
Plan. If SWIM Team consensus cannot be reached, then Reclamation will
formulate an action consistent with the Plan, which can be implemented pending
Reclamation consultation with NMFS. At all times, 56.0°F DAT at Balls Ferry
will be maintained as the temperature compliance location.
Continue the Monthly in-person SRTTG meetings. These meetings will include a
phone-in option for members who cannot participate in person.
Based on the monitoring information and temperature model results, Reclamation will closely
track the following critical monitoring metrics, and Reclamation will promptly make operational
adjustments as outlined below to carry out the objectives in the plan.
Verify that 56.0°F DAT at Balls Ferry can continue to be met through the temperature
management season. If not, Reclamation will adjust the flow schedule so that the Balls
Ferry temperature compliance point can be met;
Verify Full Side Gate operation is not forecasted prior to October 9. The June 7, 2016,
temperature model run (basis for the plan) indicates that Full Side Gate operations will
begin starting 9 October, but if the Full Side Gate operation shifts and is predicted prior

4
to October 9, Reclamation will adjust the flow schedule so that Full Side Gate operation
is not needed before October 9;
Verify that the volume of water < 49°F is not less than 95% of the forecasted volume as
predicted by the June 7, 2016, temperature model run (basis for the plan). For this year,
Reclamation will use the volume of water < 49°F as a surrogate to track the overall status
of the cold pool volume. If this volume is less than 95% of the forecasted amount,
Reclamation will reduce Keswick releases by 1,000 cfs for one week in an effort to allow
the volume of water < 49° F to make progress back to at least 100% of the 7 June
projection. If, after one week the volume of water < 49°F is not equal to or greater than
100% of the June 7 projection, Reclamation will reduce the Keswick release by another
1,000 cfs (but not to a release less than 8,000 cfs), and Reclamation will immediately call
a special Directors-level meeting to assess whether the variation in overall cold water
pool is significant enough to require a reformulation of the Plan.
If overall conditions are better than forecasted (e.g., greater than anticipated cold water
volume), then the plan may be revised through the SWIM team process with the goal to
create a modified temperature compliance metric and location of 55.0°F 7DADM through
the spawning area.
It is understood that any needed reductions in the planned Keswick release schedule will have
water supply effects and that some water deliveries could be delayed or reduced as a result of
these changes.
Additional Actions
The estimated 10,500 cfs Keswick release rate for July represents a monthly average release, but
Reclamation has agreed to cap daily average releases through the temperature management
season at this flow rate in order to reduce the potential for winter-run redd dewatering later in the
season. In reaching the 10,500 cfs release in July, flows would be ramped up in two 750 cfs
increments, each based on, and following the review of, the weekly Shasta Lake temperature
profiles and temperature model runs to ensure that all metrics (e.g., full side gate operation,
56.0°F DAT at Balls Ferry, cold water pool volume at <49°F) continue to be attainable.
To benefit Delta fisheries, the 10,500 cfs July release includes, at a minimum, water diverted
through the Glenn Colusa Irrigation District system to support smelt actions in the Yolo Bypass,
as well as an increased Delta Outflow Index for the month of July.
Also, Reclamation will closely monitor temperature conditions (including 7DADM) in the
Sacramento River at the SAC gage location (approximately 0.75 river miles upstream of the
5
Highway 44 Bridge and 6 miles downstream of Keswick Dam) and the CCR gage location (at
Bonnyview Bridge, approximately 14 miles downstream of Keswick Dam).
Although the temperature compliance point would remain at Balls Ferry (approximately 26 miles
downstream of Keswick Dam), Reclamation is willing to make short-term operational changes to
adjust water temperatures at the most downstream redd, which is currently approximately 1.2
miles downstream of the SAC gage location (i.e., the recent Painters Riffle restoration project
funded by CVPIA Section 3406 b13) to try and maintain water temperatures below 55°F
7DADM, provided such operational adjustments do not impede Reclamation’s ability to meet the
temperature compliance metric and location of 56.0°F DAT at Balls Ferry.
Reclamation will operate in a manner to avoid any exceedance of 56.0°F DAT at Balls Ferry and
Reclamation will promptly implement steps to reduce the temperature to the compliance
objective to deal with any unforeseen transitions to periods of very high air temperatures and to
assure that any exceedance is minimized. In addition, during any exceedance, Reclamation will
take immediate action to lower the daily maximum water temperatures to at or below 55.0°F
through the area of the most downstream redd and will maintain the 55.0°F daily maximum
water temperature through the period where water temperatures at Balls Ferry may exceed
56.0°F
Throughout the temperature management season, Reclamation will be watchful for opportunities
to optimize the release of cold water from Shasta Lake. The use of Power Bypass is available as
a tool to access cold water should the need arise.
Biological Analysis of Plan
Status of winter-run Chinook Salmon
Winter-run Chinook Salmon are most sensitive to temperature during their early life stages
(eggs, alevin, and fry). A conceptual model provides a holistic framework to consider effects of
summer operations on winter-run Chinook salmon eggs and early juvenile stages (Figures 1-2,
Johnson et al. 2016). Operational and temperature modeling provide information to evaluated
potential temperature and flow related biological response of the 2016 Plan. In other cases,
habitat attributed have been monitored as part of the enhanced monitoring program over the past
two years to evaluate effects of drought operations, and the observations related to
disease/pathogens and dissolve oxygen provide information regarding predicted effects of these
habitat attributes in the 2016 Plan.

6
Figure 1. Conceptual model of Winter-run Chinook Salmon egg and alevin in the upper
Sacramento River.
Figure 2. Conceptual model of Winter-run Chinook Salmon fry in the upper Sacramento River.

7
The last three cohorts of winter-run Chinook salmon have been impacted by poor freshwater
survival during the egg and juvenile life stages due to prolonged drought and very low Shasta
storage conditions. In WY 2015, a temperature management strategy to maintain suboptimal, yet
stable temperature throughout the temperature control period was implemented and temperature-
dependent mortality appeared to be extremely high (85%; NMFS 2016). In WY 2014, a
temperature management strategy to maintain optimal temperature as long as possible was
implemented. Control of Shasta reservoir release temperatures was lost in September, which was
a few weeks earlier than predicted by the model and temperature-dependent mortality appeared
to also be very high (77%; NMFS 2016). Some lessons from these two recent years is that
temperature management (especially in low storage years) should focus on a strategy that
maintains suitable temperature throughout the period (potentially May 15 through October 31)
when eggs are incubating, delays use of the full side gate configuration until later in the fall
operations, and provides some adaptability if the actual operations and cold water pool
characteristics do not reflect forecasted operations and reservoir characteristics.
The 2016 spawning winter-run Chinook salmon are the first returning cohort impacted by
drought conditions during WY 2014 (Reclamation 2015), and the 2016 carcass survey is the
second lowest on record as of June 20. A majority of carcasses have been observed above
Highway 44 (63.8%), although more carcasses have been observed between Clear Creek and
Balls Ferry than on average (13.8% vs. 3.2% (2003-2015)). Aerial redd surveys show a similar
distribution and have observed a majority of redds to be upstream of Highway 44 (75.0%),
although a greater proportion of redds between this location and Clear Creek have been seen so
far this year than on average (25.0% vs. 11.3% (2003-2015)). Spawning appears to be focused
upstream of Highway 44 with a moderate proportion downstream to Clear Creek. In this way, the
winter-run Chinook salmon spawning distribution appears similar to brood year (BY) 2011
spawning distribution.
Chinook salmon egg incubation and emergence is typically modeled between 73 to 87 days, and
it is estimated fry could emerge as soon as July 29 from the first observed redds (May 17). This
is a week later than the average first capture date of winter-run Chinook salmon in the Red Bluff
Diversion Dam (RBDD) rotary screw trap juvenile salmonid monitoring (Poytress et al. 2014),
but the same week as the first winter-run Chinook observed in 2011 RBDD monitoring.
Spawning will likely continue into early August, with close to 15% of carcasses typically
recovered during August. Eggs spawned in August are estimated to emerge in October.
Maintaining cold water temperatures and stable release rates in spawning areas through mid-
October is needed for avoiding increased temperature-dependent or dewatering egg mortality in
the BY16 cohort.

8
Biological Modeling of Temperature Management Plan
In spring 2016, Sacramento River temperature management planning efforts have focused on
determining the appropriate strategy for maintaining maximum egg incubation temperatures less
than 56°F. This strategy relied on extensive operational and biological modeling to forecast
critical cold water operations necessary to avoid further endangerment of imperiled winter-run
Chinook salmon. A number of biological metrics (Table 2) are useful for considering how the
2016 temperature management plan are predicted to influence habitat attributes and biological
responses of winter-run Chinook Salmon.
Table 2. Biological and Operational Metrics of Temperature Management Plan Scenario.
Metric Temperature Management Plan Scenario
Estimated Date of Full Side Gate
Configuration
October 9
Zeug et al. (2012) Egg to emergence
temperature dependent mortality above Clear
Creek
6.0%
Zeug et al. (2012) Egg to emergence
Temperature dependent mortality above CCR
with 0.5-1.0°F increase
7.4-9.2%
Martin et al (2016) Temperature dependent
mortality estimates
(95% Confidence Interval)
4.6%
(0.08 – 43.01)
Martin et al (2016) Temperature dependent
mortality estimates
w/ 0.5–1.0oF sensitivity analysis (95% CI)
8.0 – 15.7%
(0.08 – 61.00)
Winter-run Chinook Redd dewatering September and October flow reduction to be
managed in-season to avoid dewatering.
Fall-run Chinook Redd dewatering
(FWS 2006)
Percent of total redd dewatering based on
9,000 cfs spawning flows is 1.1%.
In 2015, the date of full side gate use was an important criterion for temperature management
decision making since it represents the date when the coldest water is being accessed and
temperatures can no longer be modified through TCD operation. The modeled temperature
management plan predicts full side gate use in early October (October 9). A set of modeled
sensitivity scenarios (see Attachment B) were reviewed by the SWIM Team during plan
development, and these runs show earlier full side gate use when a cooler release temperature

9
value or a higher release rate was modeled. The sensitivity analysis also showed that lower
release rates led to earlier use of the lower row of gates (Pressure Relief Gates) creating an
earlier draw on the coldest water stored in Shasta Lake. Based on these sensitivity runs and
various estimates of temperature related mortality, the proposed plan was formulated to best
balance management of the cold water resources, operation of the TCD, and meet system-wide
water supply needs. The risk of increased temperature-dependent mortality late in the egg
incubation period is low with the proposed plan based on projected full side gate operation,
utilization of the overall cold water pool, and proposed temperature compliance point.
Modeled daily temperatures from the proposed temperature management plan indicate a
temperature compliance point and limit of 56.0°F DAT at Balls Ferry can be met through the
control period. The single simulated temperature exceedance observed in late June is due to
extremely high air temperatures embedded in the input data set. As the season progresses, it is
estimated that temperatures at Balls Ferry should be consistently lower than 56.0°F by August.
These modeled seasonal temperatures result in estimates of low temperature dependent egg
mortality (6.0% and 4.6%) with the Zeug et al. (2012) model and Martin et al. (2016) model,
respectively.
Recent discussions have also focused on the imprecision of the model to consistently predict late
summer TCD operations and temperatures when temperature plans are developed early in the
spring. In particular, the challenge of predicting spring lake stratification and the late season
temperature management in low storage years like 2008, 2009, 2014 and 2015. In these low
storage years, observed September and October water temperature have deviated at times by
more than 0.5°F from a 56°F objective. Fortunately Shasta Lake storage levels are much higher
this year increasing confidence in the forecasted late-season temperature performance.
Recognizing that increased egg mortality will occur if observed temperatures are higher than the
forecasted values, various model assumptions have been adjusted over the last two years to better
account for temperature related uncertainties. These include use of a 10% exceedance
probability for meteorological data and TCD strategies to delay key critical gate configurations
that tap into the coldest regions of the seasonal cold water pool.
To further assess potential risk factors associated with higher than anticipated late-summer and
fall water temperatures, an additional sensitivity evaluation was conducted to estimate increased
temperature mortality if September and October estimates of water temperatures were
consistently higher by 0.5°F and 1.0°F over both months. For this sensitivity evaluation,
increased egg mortality is observed in the modeled scenarios when 0.5°F is added over these
months demonstrating a sensitivity of winter-run Chinook salmon to extended exceedances from
the predicted temperatures. When assessing this uncertainty by adding 1.0°F to the predicted
temperature at Clear Creek over September and October, temperature-dependent mortality

10
increases approximately to 9.2%. The Martin et al. (2016) model show greater temperature-
dependent mortality (15.7%) if 1.0°F is added to the modeled Keswick release temperatures.
Close monitoring to ensure that summer 2016 observed water temperatures do not deviate from
the implemented temperature management plan’s predicted isothermobath characteristics will
greatly help reduce risks of higher late summer egg-to-emergence mortality than predicted from
the modeled temperature forecast.
Temperatures and flows in this 2016 Plan may influence other habitat attributes that cause
mortality. In early fall 2015, rearing habitats of winter-run Chinook salmon were highly
infectious for Ceratonova Shasta and prevalence of C. Shasta infections was likely higher than
observed by histology based on high prevalence of Parvicapsula minibicornis, another
myxozoan parasite that uses the same polychaete alternative host as C. Shasta. In 2015, the
infection of winter-run Chinook salmon was largely at an early stage, but conditions could have
resulted in disease-related impairment of survival of out-migrants (Foott 2015). The
susceptibility of infection is hypothesized to be increased with the warmer water temperatures
observed (>60°F river exposure and >64°F laboratory rearing) in 2015. The 2016 predicted early
fall temperatures are unlikely to increase susceptibility of egg or juvenile winter-run Chinook
salmon to pathogens and disease.
In 2014, enhanced dissolved oxygen (DO) monitoring of winter-run Chinook redds showered
that overall DO levels in the Sacramento River were suitable for Chinook survival throughout the
spawning and red juvenile occupancy period (CDFW 2015). In 2015, enhanced DO monitoring
adjacent to redds found variable results among sites, some of which were suspected to be caused
by sensor inaccuracy. In 2015, low DO could have contributed to some early life stage mortality
in monitored redds where DO fell to 0mg/L. In a majority of 2015 monitored sites, observed DO
levels were fairly consistent and remained above 6mg/L (CDFW 2015), which is greater than
levels causing egg mortality or juvenile rearing (Bergendorf 2002, Allen and Hassler 1986).
With predicted cooler temperatures and higher release rates in the 2016 temperature management
plan, dissolved oxygen is not predicted to cause detrimental effects to winter-run Chinook
salmon eggs and juveniles
One objective of the 2016 Plan is to avoid winter-run Chinook Salmon redd dewatering by
carefully planning flow reductions until the last winter-run Chinook fry have emerged from the
gravel in October. The 2013 and 2014 dewatering surveys included Keswick release reductions
below 10,500 cfs in later summer, but did not detect any dewatering of redds until releases were
reduced below 8,000 cfs (Jarrett and Killam 2014, 2015). Although not anticipated due to the
tenets of the 2016 Plan regarding avoiding winter-run red dewatering and recent observations of
redd dewatering in 2013 and 2014, the potential effect being avoided by including this objective
in the Plan can be assessed based on a RIVER2D redd dewatering model (USFWS 2006). Based

11
on summer spawning flows of 10,500 cfs, the estimated percent of winter-run Chinook salmon
redd dewatering at late summer release rates of 8,000 cfs is 2.9%. The risks of redds dewatering
increases with higher spawning flows. Regardless, redd dewatering is dependent on location and
the relationship is likely not linear (J. Roberts, pers comm). Although the estimated potential
winter-run dewatering is minimal, actual location of at-risk redds will be monitored closely.
Another objective of the 2016 Plan is to reduce Keswick releases immediately following 100%
winter-run fry emergence, and stabilize those flow through the fall-run incubation season.
However, during September through November spring-run and fall-run Chinook salmon spawn
in the upper Sacramento River. Although redds surveyed during September are typically
considered to be constructed by spring-run Chinook salmon with fall-run Chinook salmon redds
starting to be built in October (CDFW 2016), Fisher (1994) described spawning during late
September to be fall-run Chinook salmon. Williams (2006) estimated 5% of fall-run Chinook
salmon spawn in the Sacramento by mid-October. Although redd surveys are frequently limited
by conditions and occur irregularly during the spawning period of spring-run and fall-run
Chinook salmon during the 72 aerial redd surveys (2001-2015) more than 24,854 redds were
enumerated between August 29 and December 16 (CDFW 2016). From these surveys, less than
1% of redds were counted in September, approximately 15% were counted in October, and the
approximately 85% of the remaining fall-run Chinook salmon redds were observed in November
and early December (Table 3). In the 2016 Plan, reductions in releases rates during the two-week
periods in September and October may increase spring-run and fall-run Chinook redd
dewatering. Based upon redd surveys in the past, the first two weeks in October are when redd
constructions increases, and over this period represented 5.8% of redd building on average.
Table 3. Late Summer/Fall redd survey data from 2001-2015 (CDFW 2016)

12
Potential redd dewatering risk for fall-run Chinook salmon with this strategy was evaluated
based on a RIVER2D redd dewatering model (USFWS 2006). Based on early fall spawning
flows of 9,000 cfs, the estimated percent of fall-run Chinook salmon redd dewatering at late fall
release rates of 5,500 cfs is 13.5%. Based on 8.1% of upper Sacramento River Chinook
spawning during this period (long term survey averages between 9/2-10/13) and 13.5% of these
redds being dewatered, it is predicted that 1.1% of fall-run Chinook redds built in September and
early October are likely to be dewatered. The exact overall percentage of the fall-run will depend
on run timing that will also be monitored, and the later into October release rates remain above
5,500 cfs, the greater that proportion of fall-run Chinook redds that will be affected by the flow
reductions.
Impacts of Lower Flow Scenarios
During the development of the 2016 Plan, Reclamation worked with other Federal and State
agencies to evaluate potential scenarios with differing ranges of release rates (see Attachment B).
The 2016 Plan represents an effort to minimize the impact to winter-run egg and fry incubation,
while striving to ensure that other requirements of the CVP and SWP system are met and impacts
to other beneficial uses of the system are limited to the extent possible. Based on these efforts,
the 2016 Plan contains a set of flowrates that, if reduced, would result in impacts to other
beneficial uses of the CVP and SWP. Those impacts include, but are not limited to:
● Reduced storage in Folsom Reservoir, potentially resulting in the triggering of an off-
ramp criteria from the American River flow actions contained in RPA II.1 of the 2009
BiOp later in the water year. The 2016 Plan is expected to result in an end-of-September
storage in Folsom of about 300,000 acre-feet; reductions in flows in the Sacramento
River would likely impact the ability to maintain this projected storage level.
● Cuts to CVP water service contractors along the Sacramento River.
● Loss of the 5% allocation for CVP water service contractors south-of-Delta.
● Shortage of water at Mendota Pool to supply San Joaquin River Exchange Contractors,
requiring supplemental releases from Millerton Lake and resulting in high channel losses
and subsequent supply reductions to Friant Division contractors.
● Likely limitations to potential summer supplies for south-of-Delta refuges.
● Increased CVP debt under the Coordinated Operation Agreement (COA), resulting in
potential future impacts to CVP water supplies.
Reclamation acknowledges that some of these impacts may occur under the 2016 Plan, should
real-time operations require adjustments so that actual conditions more closely match projected
modeled results. Attached is a draft operational forecast illustrating the projected operation of
other components of the CVP based on the Sacramento River flowrates contained in the 2016
Plan (Attachment C).

13
Cited Literature
Allen, M.A. and T.J. Hassler. 1986. Species Profile: Life Histories and Environmental
Requirements of Coastal Fishes and Invertebrates (Pacific Southwest)—Chinook Salmon. U.S.
Fish and Wildlife Service Biological Report 82. U.S. Army Corps of Engineers, TR EL-82-4. 26
p.
Bergendorf, D. 2002. The influence of in-stream habitat characteristics on Chinook Salmon
(Oncorhynchus tshawytscha). Northerst Fisheries Science Center, NOAA. 46 p.
California Department of Fish and Wildlife (CDFW). 2014. Drought monitoring of water quality
for spawning Chinook salmon in the upper Sacramento River in 2014. RBFO Technical Report
No 01-2015. Red Bluff Fisheries Office, Northern Region, Red Bluff, CA. 126 p.
California Department of Fish and Wildlife (CDFW). 2015. Drought monitoring of water quality
for Sacramento River winter-run Chinook Salmon spawning in the Sacramento River in 2015.
Red Bluff Fisheries Office, Northern Region, Red Bluff, CA. 49 p.
California Department of Fish and Wildlife (CDFW). 2016. 2016 AERIAL REDD Sacramento
River summary as of 6-2-16.xlsx. Data file. Red Bluff Fish and Wildlife Office.
Fisher, F. 1994. Past and present status of Central Valley Chinook Salmon. Conservation
Biology 8: 870-873.
Foott, J.S. 2016. Parasite infection of juvenile late fall and winter-run Chinook in the Sacramento
River: September – November 2015 observations in the Balls Ferry to Red Bluff reach.
Memorandum. U.S. Fish and Wildlife Service, California-Nevada Fish Health Center, Anderson,
CA.
Jarrett, P and D. Killam. 2014. Redd dewatering and juvenile stranding in the Upper Sacramento
River, Year 2013-2014. RBFO Technical Report No. 01-2014. 67 p.
Jarrett, P and D. Killam. 2015. Redd dewatering and juvenile stranding in the Upper Sacramento
River, Year 2014-2015. RBFO Technical Report No. 02-2015. 86 p.
Johnson, R.C., S. Windell, P. Brandes, J.L. Conrad, J. Ferguson, P. Goertler, B. Harvey, J.
Heublein, J.A. Israel, J. Kirsch, R. Perry, J. Pisciotto, W. Poytress, K. Reece, and B. Swart. 2016.
Increasing the management value of life stage monitoring networks for three imperiled fishes in
California's regulated rivers: case study Sacramento Winter-run Chinook salmon. Submitted to
San Francisco and Estuary Water Sciences.
Martin, B. S. John, A. Pike, J. Roberts, E. Danner. 2016. Modeling temperature dependent
mortality of winter-run Sacramento River Chinook Salmon. Attachment in Letter from Mrs.

14
Maria Rea to Mr. Ron Milligan. Re: Response to March 15, 2016 Preliminary Sacramento River
Temperature Modeling Results. March 18, 2016. West Coast Region, Sacramento, CA. 34 p.
National Marine Fisheries Service (NMFS). 2016. Letter from Mrs. Maria Rea to Mr. Ron
Milligan. Re: Response to March 15, 2016 Preliminary Sacramento River Temperature Modeling
Results. March 18, 2016. West Coast Region, Sacramento, CA. 34 p.
Poytress, W. R., J. J. Gruber, F. D. Carrillo and S. D. Voss. 2014. Compendium report of Red
Bluff Diversion Dam rotary trap juvenile anadromous fish production indices for years 2002-
2012. Report of U.S. Fish and Wildlife Service to California Department of Fish and Wildlife
and US Bureau of Reclamation. U.S. Fish and Wildlife Service, Red Bluff Fish and Wildlife
Office, Red Bluff, CA.
Reclamation. 2015. Brood Year 2013 winter-run Chinook Salmon drought operation and
monitoring assessment. Report. Mid-Pacific Region, Sacramento CA. March 2015.
U.S. Fish and Wildlife Service. 2006. Relationship between flow fluctuations and redd
dewatering and juvenile stranding for Chinook Salmon and Steelhead in the Sacramento River
between Keswick Dam and Battle Creek. Sacramento Fish and Wildlife Office, Sacramento CA.
94 p.
William, J. 2006. A perspective on Chinook and Steelhead in the Central Valley of California.
San Francisco Estuary and Watershed Sciences. 4: http://escholarship.org/uc/item/21v9x1t7
419p
Zeug, S.C., P.S. Bergman, B.J. Cavallo, and K.S. Jones. 2012. Application of a life cycle
simulation model to evaluate impacts of water management and conservation actions on an
endangered population of Chinook salmon. Environmental Modeling & Assessment 17: 455-467.

414243444546474849505152535455565758596061626364656667
6/1 6/16 7/1 7/16 7/31 8/15 8/30 9/14 9/29 10/14 10/29 11/13
Tem
pera
ture
(˚F)
Sacramento River Modeled Temperature2016 June 90%- Hydrology
2016 Temperature Management Plan -- Attachment A
SHASTA KESWICK BALLS_FERRY Jellys Ferry
Kes Releases: June at 9,000, July at 10,500, Aug at 10,000, Sept at 9,000, Oct at 6,500EOM Sept storage: 2.6 MAF ‐‐ TCD Side gate: Oct 9 Trinity profile date : 5/4/2016Whiskeytown profile date: 5/2/2016Shasta profile date: 5/31/201610% Met ‐ Exceedence: May '66, June '73, July '00, Aug '88, Sept '22, Oct '52 and Nov '62Model ‐‐ Original Model
Temp Run date: June 7, 2016

Attachment B - Summary of Sensitivity Analysis
Bureau of Reclamation
2016 Sacramento River Temperature Management Plan
June 7, 2016
Introduction
Attachment B-1 contains a table and plots showing the temperature performance and
characteristics of sensitivity modeling scenarios. These scenarios illustrate the temperature
performance of a variety of different potential water operations, ranging from lower flow
scenarios that focus on conserving storage, to higher flow scenarios that more fully utilize
available storage. The modeling of these scenarios is based on the May 31, 2016 Shasta Lake
temperature profile. The scenarios evaluated do not represent potential operating plans, but these
results helped inform the formulation of the plan.
By design, all scenarios generally target a similar release water temperature at Keswick Dam of
approximately 51.9° F through August 2016. In order to accomplish this target for the various
flow rates, different configurations of the gates on the Shasta Dam Temperature Control Device
must be utilized. The purpose of this analysis was to illustrate the range of potential end-of-
season temperatures and to help assess the range of direct temperature related effects to winter-
run Chinook salmon.
Discussion
The table and plots in Attachment B-1 highlight the trade-offs of the various approaches for
managing storage and the available cold water pool (CWP) in Shasta Lake. The table and plots
illustrate two points:
1) The combination of higher release rates and a low early season release temperature result
in increased late season temperatures as the final full side gate operation of the TCD is
called on earlier with these higher flow scenarios. This final full side gate operation
signals the need to access the remainder of the CWP. For example, “Scenario 8,000”
shows that with lower releases of approximately 8,000 cubic feet per second (cfs), the
final full side gate operation occurs October 1 (with an initial opening and closing of the
side gates in late August due to cold water requirements), whereas “Scenario 10,000”
with releases of approximately 10,000 cfs requires final full use of the side gates on the
TCD by September 16. The 10,000 cfs scenario results in final release temperatures from
Shasta Dam approaching 54°F, whereas release temperatures later in the season are closer
to 52°F under the 8,000 cfs scenario.
2) Lower release rates result in the need to utilize the coldest water stored in Shasta Lake at
an earlier date. This is identified in the table by the dates when the use of the Pressure
Relief Gates (PRGs) on the TCD are fully utilized under the various scenarios. The dates
of the use of the PRGs are generally earlier for lower flow scenarios. The reason this
occurs is that at lower release rates, cooler water must be released from Shasta Dam in
order to meet a particular target release temperature from Keswick due to increased
heating of the water between Shasta and Keswick Dams, particularly during the summer
months. For example, the plot for the 8,000 cfs scenario illustrates that in order to meet a
target daily average Keswick release temperature of approximately 51.9° F, Shasta Dam

release temperatures closer to 48° F must be maintained. The plot for the 10,000 cfs
scenario shows that the same Keswick release temperature target can be held using
Shasta Dam release temperatures generally near 49°F. The higher flow rates have the
effect of pushing the cool water downstream from Shasta Dam to Keswick Dam with less
heating, allowing for the use of slightly warmer releases from Shasta Dam and reducing
the need to access the coldest water earlier in the season. The table shows that for these
two scenarios, the use of the PRGs begins at July 14 and August 1 respectively,
illustrating the need to more fully access the coldest water in the reservoir earlier with
lower flows. This also increases the risks associated with loosing temperature control in
the late summer/early fall as a result of running out of the majority of the CWP resource.
It should be noted that a similar condition of increased heating in lower flow scenarios can be
seen in the river water temperatures downstream of Keswick Dam. The table and plots show
that, particularly during the summer months of June through August, the water temperatures
reaching Balls Ferry and Jellys Ferry under the higher flow scenarios is slightly cooler.
Summary
Overall, the sensitivity analysis provides an evaluation of the performance of two management
approaches. Under the first approach, lower flows are used and overall storage is conserved, but
due to the increased need for colder water to offset the increased heating that occurs in the river
downstream at these lower flowrates, the deeper CWP resource is accessed earlier ultimately
utilizing a smaller portion of the total CWP.
The other approach utilizes higher flow rates and more of the overall storage. With these
increased flows there is not as much early dependence on the colder water that exists deeper in
Shasta Lake, since the higher flows lessen the effects of the heating that occurs downstream of
Shasta Dam. However, the higher release rates coupled with a low early season release
temperature can result in higher temperatures later in September and October. This condition is
associated with earlier use of the full side gates on the TCD.
Ultimately, selection of a plan involves the melding of these two considerations to create a
seasonal temperature target that can be maintained at appropriate flow rates without risking later-
season temperature increases associated with depletion of the CWP and not limiting use of the
CWP through early use of the PRGs only. This is accomplished by setting an initial Keswick
Dam release temperature that can be maintained without triggering the need for full side gate
operation too early in the temperature management season.

Scenario 8,000 June July Aug Sep Oct Nov
PRG Only
Full Side Gates
Sept Shasta Storage
July Export
Aug Export
Sep Export
Folsom EOM Sept
Storage System‐Wide Effects
Egg to Emergence temp dependent mortality above Clear Creek (Zeug et al 2012)
Martin et al (2015) Temperature dependent mortality estimates
Keswick 8000 8000 8000 8000 6500 5500
Keswick 51.88 51.87 51.90 52.43 51.98
Balls Ferry 54.91 55.24 54.65 54.07 52.75
Jellys Ferry 56.47 56.98 56.13 55.04 53.23***Wilkins had to be cut by 600 cfs in July
Scenario 9,000 June July Aug Sep Oct Nov
PRG Only
Full Side Gates
Sept Shasta Storage
July Export
Aug Export
Sep Export
Folsom EOM Sept
Storage System‐Wide Effects
Egg to Emergence temp dependent mortality above Clear Creek (Zeug et al 2012)
Martin et al (2015) Temperature dependent mortality estimates
Keswick 9000 9000 9000 8500 6800 5500
Keswick 51.88 51.83 51.95 52.14 52.97
Balls Ferry 54.61 54.84 54.43 53.83 53.27
Jellys Ferry 56.05 56.45 55.79 54.81 53.70
Scenario 10,000 June July Aug Sep Oct Nov
PRG Only
Full Side Gates
Sept Shasta Storage
July Export
Aug Export
Sep Export
Folsom EOM Sept
Storage System‐Wide Effects
Egg to Emergence temp dependent mortality above Clear Creek (Zeug et al 2012)
Martin et al (2015) Temperature dependent mortality estimates
Keswick 9000 10000 10000 8500 6800 5500
Keswick 51.85 51.91 51.94 52.28 53.13
Balls Ferry 54.56 54.64 54.19 53.86 53.64
Jellys Ferry 56.02 56.13 55.45 54.80 54.03
Scenario 11,500 June July Aug Sep Oct Nov
PRG Only
Full Side Gates
Sept Shasta Storage
July Export
Aug Export
Sep Export
Folsom EOM Sept
Storage System‐Wide Effects
Egg to Emergence temp dependent mortality above Clear Creek (Zeug et al 2012)
Martin et al (2015) Temperature dependent mortality estimates
Keswick 10000 11500 10000 8500 6800 5500
Keswick 52.03 51.88 51.83 52.54 53.83
Balls Ferry 54.46 54.31 53.13 54.07 54.22
Jellys Ferry 55.78 55.66 55.36 54.99 54.57
Attachment B-1
Aug 23/ Aug 31/ Oct 1
10‐Sep
16‐Sep
9‐Sep
* loss of 5% SOD allocation * Friant releases needed for Exchange Contractors * Delta Outflow ‐ difficult to meet * Off Ramp year at Folsom
5.0% 2.9%
* 5% SOD allocation preserved * Friant releases not needed * Delta Outflow met * Folsom storage met
5.2% 5.0%
20‐Jul 2.8 75 160 270 361
5.1% 3.4%
31‐Jul 2.5 230 258 270 403
3.1%
1‐Aug 2.7 140 250 270 403
* 5% SOD allocation reduced * Friant releases may be needed * Delta Outflow is met * Folsom storage target met
14‐Jul 2.9 60 150 270 305
* loss of 5% SOD allocation * Friant releases needed for Exchange Contractors * Delta Outflow ‐ difficult to meet * Off Ramp year at Folsom
5%
1

414243444546474849505152535455565758596061626364656667
6/1 6/16 7/1 7/16 7/31 8/15 8/30 9/14 9/29 10/14 10/29 11/13
Tem
pera
ture
(˚F)
Sacramento River Modeled Temperature2016 June 90%- Hydrology
Scenario 8,000
SHASTA KESWICK BALLS_FERRY JELLYS FERRY
Kes Releases: June ‐ Sept at 8,000, Oct at 6,500EOM Sept storage: 2.9 MAF ‐‐ TCD Side gate: Oct 1 Trinity profile date : 5/4/2016Whiskeytown profile date: 5/2/2016Shasta profile date: 5/31/201610% Met ‐ Exceedence: May '66, June '73, July '00, Aug '88, Sept '22, Oct '52 and Nov '62Model ‐‐ Original Model
Temp Run date: May 31, 2016
2

414243444546474849505152535455565758596061626364656667
6/1 6/16 7/1 7/16 7/31 8/15 8/30 9/14 9/29 10/14 10/29 11/13
Tem
pera
ture
(˚F)
Sacramento River Modeled Temperature2016 June 90%- Hydrology
Scenario 9,000
SHASTA KESWICK BALLS_FERRY Jellys Ferry
Kes Releases: June ‐ Aug at 9,000, Sep at 8500, Oct at 6,800 Nov at 5,500EOM Sept storage: 2.8 MAF ‐‐ TCD Side gate: Sep 10Trinity profile date : 5/4/2016Whiskeytown profile date: 5/2/2016Shasta profile date: 5/31/201610% Met ‐ Exceedence: May '66, June '73, July '00, Aug '88, Sept '22, Oct '52 and Nov '62Model ‐‐ Original Model
Temp Run date: June 2, 2016
3

414243444546474849505152535455565758596061626364656667
6/1 6/16 7/1 7/16 7/31 8/15 8/30 9/14 9/29 10/14 10/29 11/13
Tem
pera
ture
(˚F)
Sacramento River Modeled Temperature2016 June 90%- Hydrology
Scenario 10,000
SHASTA KESWICK BALLS_FERRY Jellys Ferry
Kes Releases: June at 9,000, July‐Aug at 10,000, Sept at 8,500, Oct at 6,800, Nov at 5,500EOM Sept storage: 2.7 MAF ‐‐ TCD Side gate: Sep 16 Trinity profile date : 5/4/2016Whiskeytown profile date: 5/2/2016Shasta profile date: 5/31/201610% Met ‐ Exceedence: May '66, June '73, July '00, Aug '88, Sept '22, Oct '52 and Nov '62Model ‐‐ Original Model
Temp Run date: June 1, 2016
4
414243444546474849505152535455565758596061626364656667
6/1 6/16 7/1 7/16 7/31 8/15 8/30 9/14 9/29 10/14 10/29 11/13
Tem
pera
ture
(˚F)
Sacramento River Modeled Temperature2016 June 90%- Hydrology
Scenario 11,500
SHASTA KESWICK BALLS_FERRY Jellys Ferry
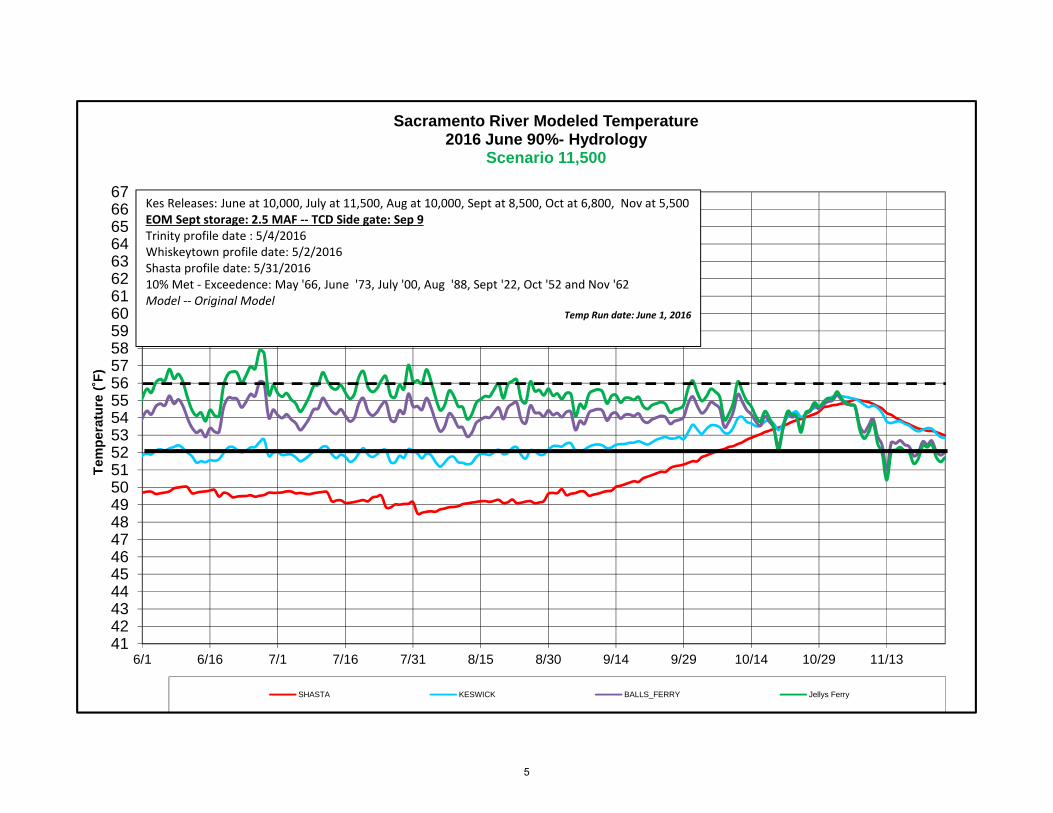
Kes Releases: June at 10,000, July at 11,500, Aug at 10,000, Sept at 8,500, Oct at 6,800, Nov at 5,500EOM Sept storage: 2.5 MAF ‐‐ TCD Side gate: Sep 9 Trinity profile date : 5/4/2016Whiskeytown profile date: 5/2/2016Shasta profile date: 5/31/201610% Met ‐ Exceedence: May '66, June '73, July '00, Aug '88, Sept '22, Oct '52 and Nov '62Model ‐‐ Original Model
Temp Run date: June 1, 2016
5

2016 Sacramento River Temperature Plan
Attachment C
Storages End of the Month Storage/Elevation (TAF/Feet)
Jun Jul Aug Sep Oct Nov Dec
Trinity 1392 1233 1110 1002 900 887 876 878
Elev. 2279 2267 2255 2244 2242 2240 2241
Whiskeytown 232 238 238 238 230 206 206 206
Elev. 1209 1209 1209 1207 1199 1199 1199
Shasta 4167 3876 3405 2968 2599 2426 2351 2373
Elev. 1043 1025 1004 989 980 977 978
Folsom 826 699 474 349 328 269 233 218
Elev. 439 413 395 392 382 374 371
New Melones 624 617 565 515 470 460 477 495
Elev. 881 871 861 851 849 853 856
Total San
Luis (TAF) 677 467 584 671 656 785 955 1190
Monthly River Releases (TAF/cfs)
Trinity TAF 150 68 45 44 23 18 18
cfs 2,526 1,102 734 744 373 300 300
Clear Creek TAF 9 7 5 9 14 10 11
cfs 150 120 85 150 225 175 175
Sacramento TAF 535 645 615 535 400 327 307
cfs 9000 10500 10000 9000 6500 5500 5000
American TAF 268 306 203 96 95 76 77
cfs 4505 4984 3301 1612 1543 1283 1250
Stanislaus TAF 15 12 12 12 35 12 12
cfs 250 200 200 200 577 200 200
Trinity Diversions (TAF)Jun Jul Aug Sep Oct Nov Dec
Carr PP 73 68 67 62 0 14 19
Spring Crk. PP 60 60 60 60 12 5 12
Delta Summary (TAF)Jun Jul Aug Sep Oct Nov Dec
Tracy 79 150 165 272 282 270 225
USBR Banks 0 0 0 0 0 0 0
Contra Costa 9.8 11.1 12.7 14.0 16.8 18.4 18.3
Total USBR 89 161 178 286 299 288 243
COA Balance -54 -63 -63 -6 40 0 0
Old/Middle River Std.
Old/Middle R. calc. -3,478 -7,617 -7,684 -5,772 -6,334 -6,081 -5,905
Computed DOI 7094 6507 5401 4656 4002 4505 7678
Excess Outflow 0 0 0 0 0 0 3172
% Export/Inflow 28% 46% 49% 47% 59% 58% 48%
% Export/Inflow std. 35% 65% 65% 65% 65% 65% 65%
CVP actual operations do not follow any forecasted operation or outlook; actual operations are based on real-time conditions.
CVP operational forecasts or outlooks represent general system-wide dynamics and do not necessarily address specific watershed/tributary details.
CVP releases or export values represent monthly averages.
CVP Operations are updated monthly as new hydrology information is made available December through May.
6/27/2016