SAA Report
54
STATISTICAL PROCESS CONTROL RUN TESTS PROCESS CAPABILITY OC CURVE
-
Upload
sonny-aguilar -
Category
Documents
-
view
237 -
download
0
Transcript of SAA Report

8/2/2019 SAA Report
http://slidepdf.com/reader/full/saa-report 1/54
STATISTICALPROCESS
CONTROL
RUN TESTS
PROCESS CAPABILITY
OC CURVE

8/2/2019 SAA Report
http://slidepdf.com/reader/full/saa-report 2/54
Run Tests
An additional test for randomness
Even if all points are within the control limits the process may
not be random
Any sort of pattern in the data would suggest a non-random
process
SAA
8/2/2019 SAA Report
http://slidepdf.com/reader/full/saa-report 3/54
Nonrandom Patternsin Control Charts
Cycle
Trend
SAA

8/2/2019 SAA Report
http://slidepdf.com/reader/full/saa-report 4/54
UCL
LCL
UCL
LCL
UCL
LCL
Bias
Mean shift
Too muchdispersion
SAA

8/2/2019 SAA Report
http://slidepdf.com/reader/full/saa-report 5/54
U U D U D U D U U D
B A A B A B B B A A B
Counting Runs
Counting Above/Below Median
Counting Ups/Down
7
8SAA

8/2/2019 SAA Report
http://slidepdf.com/reader/full/saa-report 6/54
Run Tests Procedures
Ensure that process arein statistical control
based on the controlcharts
Make a run tests ofproducts and make
measurements ofdeviations from processspecifications or median
or mean
Count number ofobserved runs from thegraph, grouping similar consecutive patters as
one
Compute for z
Compute for thestandard deviation of
the run:
Ợmed= ( 1)/4
ỢU/D= (16 29)/90
Compute for theexpected run values:
E( r )med =
+ 1
E( r )u/d =−
SAA

8/2/2019 SAA Report
http://slidepdf.com/reader/full/saa-report 7/54
ILLUSTRATION:
Twenty sample means have beentaken from a process. The means are
shown in the following table. Usemedian and up/down run tests with z= 2 to determine if assignable causesof variation are present. Assume the
median is 11.
SAA

8/2/2019 SAA Report
http://slidepdf.com/reader/full/saa-report 8/54
Given:
Sample Mean
1 10.0
2 10.4
3 10.2
4 11.5
5 10.8
6 11.6
7 11.1
8 11.2
9 10.6
10 10.9
11 10.7
12 11.3
13 10.8
14 11.8
15 11.2
16 11.6
17 11.2
18 10.6
19 10.7
20 11.9
A/B
B
B
B
A
B
A
A
A
B
B
B
A
B
A
A
A
A
B
B
A
9.5
10
10.5
11
11.5
12
0 5 10 15 20 25
Mean
Mean
Median
N = 20z = 2
Median = 11
Observed Runmed = 10SAA

8/2/2019 SAA Report
http://slidepdf.com/reader/full/saa-report 9/54
Observed RunU/D = 17
9.5
10.0
10.5
11.0
11.5
12.0
0 5 10 15 20 25
M
e
a
n
Sample
Ups/Downs Chart
Mean
Sample Mean
1 10.0
2 10.4
3 10.2
4 11.5
5 10.8
6 11.6
7 11.18 11.2
9 10.6
10 10.9
11 10.7
12 11.3
13 10.8
14 11.815 11.2
16 11.6
17 11.2
18 10.6
19 10.7
20 11.9
Ups and DownsU/D
D
U
D
U
D
U D
U
D
U
D
U
D
U
D
D
U
U
D
SAA

8/2/2019 SAA Report
http://slidepdf.com/reader/full/saa-report 10/54
Computation of Expected Run (Er)
E( r )med =
+ 1 =
+ 1 = 11 10
E( r )u/d =−
2(20) 1
3 13 17
Er Or
SAA

8/2/2019 SAA Report
http://slidepdf.com/reader/full/saa-report 11/54
Chance Variability Computation
Ợmed= ( 1)/4 = (20 1)/4
ỢU/D= (16 29)/90 = (16(20) 29)/90
SAA

8/2/2019 SAA Report
http://slidepdf.com/reader/full/saa-report 12/54

8/2/2019 SAA Report
http://slidepdf.com/reader/full/saa-report 13/54
Decision Point
Run Tests Computed Value ≤≥ ZDesired Findings
Zmed -0.46 < ±2 Random
ZU/D 2.22 > ±2 Not Random
SAA

8/2/2019 SAA Report
http://slidepdf.com/reader/full/saa-report 14/54

8/2/2019 SAA Report
http://slidepdf.com/reader/full/saa-report 15/54
Common Terms For Variability Of Process
Tolerances or specifications
Range of acceptable values established by engineering
design or customer requirements
Process variability
Natural variability in a process
Process capability
Process variability relative to specification
SAA

8/2/2019 SAA Report
http://slidepdf.com/reader/full/saa-report 16/54
Capability Analysis
Lower
Specification
Upper
Specification
A. Process variability
matches specifications
LowerSpecification UpperSpecification
B. Process variability
well within specificationsLowerSpecification
UpperSpecification
C. Process variability
exceeds specificationsSAA

8/2/2019 SAA Report
http://slidepdf.com/reader/full/saa-report 17/54
(a) Acceptance sampling(Some bad units
accepted)
(b) Statistical processcontrol (Keep theprocess in control)
(c) Cpk >1 (Designa process thatis in control)
Lowerspecification
limit
Upperspecification
limit
Process mean, m SAA

8/2/2019 SAA Report
http://slidepdf.com/reader/full/saa-report 18/54
Actions In Case Of Tightness
redesign the process so that it can achieve thedesired output
use an alternative process that can achieve the
desired output retain the current process but attempt to
eliminate unacceptable output using 100 percentinspection; and,
examine the specifications to see whether they
are necessary or could be relaxed withoutadversely affecting customer satisfaction
SAA

8/2/2019 SAA Report
http://slidepdf.com/reader/full/saa-report 19/54
Process Capability
The natural variation of a process should be small enough to produce products that meet the standards required
A process in statistical control does not necessarily meet the design specifications
Process capability is a measure of the relationship between the naturalvariation of the process and the design specifications SAA

8/2/2019 SAA Report
http://slidepdf.com/reader/full/saa-report 20/54
Process Capability Ratio Cp
Cp =Upper Specification - Lower Specification
6s
A capable process must have a Cp of at least 1.0
Does not look at how well the process iscentered in the specification range
Often a target value of Cp = 1.33 isused to allow for off-center processes
Six Sigma quality requires a Cp = 2.0SAA

8/2/2019 SAA Report
http://slidepdf.com/reader/full/saa-report 21/54
Process Capability Ratio
Cp =Upper Specification - Lower Specification
6s
Insurance claims process
Process mean x = 210.0 minutes
Process standard deviation s = .516 minutesDesign specification = 210 ± 3 minutes
SAA

8/2/2019 SAA Report
http://slidepdf.com/reader/full/saa-report 22/54
Process Capability Ratio
Cp =Upper Specification - Lower Specification
6s
Insurance claims process
Process mean x = 210.0 minutes
Process standard deviation s = .516 minutesDesign specification = 210 ± 3 minutes
= = 1.938213 - 207
6(.516)
SAA

8/2/2019 SAA Report
http://slidepdf.com/reader/full/saa-report 23/54
Process Capability Ratio
Cp =Upper Specification - Lower Specification
6s
Insurance claims process
Process mean x = 210.0 minutes
Process standard deviation s = .516 minutesDesign specification = 210 ± 3 minutes
= = 1.938213 - 207
6(.516)Process iscapable
SAA

8/2/2019 SAA Report
http://slidepdf.com/reader/full/saa-report 24/54

8/2/2019 SAA Report
http://slidepdf.com/reader/full/saa-report 25/54
ILLUSTRATION
Standard
Deviation
(mm)
Machine
Capability
(sd x 6)
Cp
(c/U-L)
0.13 0.78 1.03
0.08 0.48 1.67
0.16 0.96 0.83
0.78
0.48
0.96
1.03
1.67
0.83
B’s Cp of 1.67 > 1.33SAA

8/2/2019 SAA Report
http://slidepdf.com/reader/full/saa-report 26/54
Process
mean
Lowerspecification
Upper
specification
1350 ppm 1350 ppm
1.7 ppm 1.7 ppm
+/- 3 Sigma
+/- 6 Sigma
3 Sigma and 6 Sigma Quality
SAA

8/2/2019 SAA Report
http://slidepdf.com/reader/full/saa-report 27/54
Cpk
SAA

8/2/2019 SAA Report
http://slidepdf.com/reader/full/saa-report 28/54
A capable process must have a Cpk of at
least 1.0 A capable process is not necessarily in the
center of the specification, but it falls withinthe specification limit at both extremes
Cpk = minimum of ,
Upper Specification - x
Limit 3s
Lower x - Specification
Limit 3s
SAA

8/2/2019 SAA Report
http://slidepdf.com/reader/full/saa-report 29/54
New Cutting Machine
New process mean x = .250 inches Process standard deviation s = .0005 inches
Upper Specification Limit = .251 inchesLower Specification Limit = .249 inches
SAA

8/2/2019 SAA Report
http://slidepdf.com/reader/full/saa-report 30/54

8/2/2019 SAA Report
http://slidepdf.com/reader/full/saa-report 31/54
New Cutting Machine
New process mean x = .250 inches Process standard deviation s = .0005 inches
Upper Specification Limit = .251 inchesLower Specification Limit = .249 inches
Cpk = = 0.67.001
.0015
New machine isNOT capable
Cpk = minimum of ,(.251) - .250
(3).0005
.250 - (.249)
(3).0005
Both calculations result in
SAA

8/2/2019 SAA Report
http://slidepdf.com/reader/full/saa-report 32/54
Cpk = negative number
Cpk = zero
Cpk = between 0 and 1
Cpk = 1
Cpk > 1SAA

8/2/2019 SAA Report
http://slidepdf.com/reader/full/saa-report 33/54

8/2/2019 SAA Report
http://slidepdf.com/reader/full/saa-report 34/54
ILLUSTRATION
A process has a mean of 9.20 grams and a standard
deviation of .30 gram. The lower specification limit
is 7.50 grams and the upper specification limit is
10.50 grams. Compute Cpk·
Cpk =10.50−9.20
3(.30
)
(upper specs.)
=9.20−7.50
3(.30)(lower specs.)
SAA

8/2/2019 SAA Report
http://slidepdf.com/reader/full/saa-report 35/54

8/2/2019 SAA Report
http://slidepdf.com/reader/full/saa-report 36/54
IMPROVING PROCESS
CAPABILITY
Simplify
StandardizeMistake-proof
Upgrade equipmentAutomate
SAA

8/2/2019 SAA Report
http://slidepdf.com/reader/full/saa-report 37/54
Acceptance Sampling
Form of quality testing used for incoming materials or finished goods
Take samples at random from a lot(shipment) of items
Inspect each of the items in the sample
Decide whether to reject the whole lot
based on the inspection results
Only screens lots; does not drivequality improvement efforts SAA

8/2/2019 SAA Report
http://slidepdf.com/reader/full/saa-report 38/54
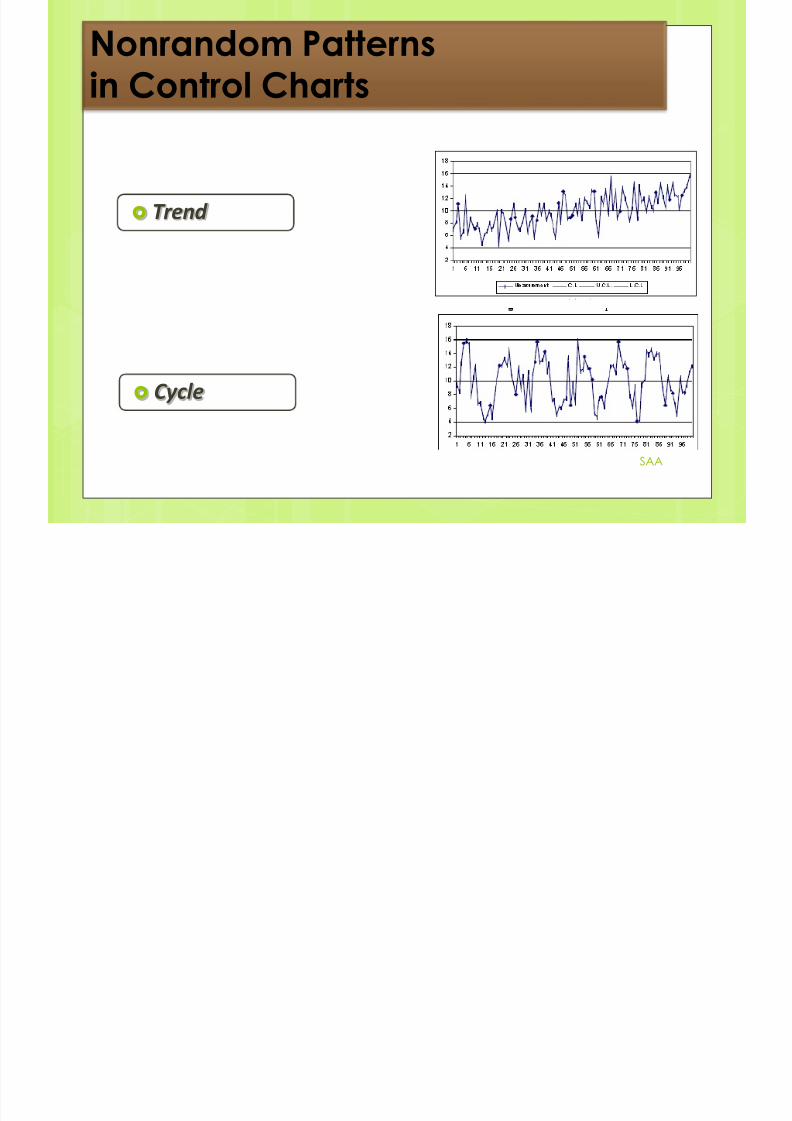
Operating Characteristic Curve
Shows how well a sampling plandiscriminates between good andbad lots (shipments)
Shows the relationship betweenthe probability of accepting a lot
and its quality level
SAA
8/2/2019 SAA Report
http://slidepdf.com/reader/full/saa-report 39/54
Return wholeshipment
% Defective in Lot
P ( A c c
e p t W h o l e
S h i p m
e n t )
100 –
75 –
50 –
25 –
0 – | | | | | | | | | | |
0 10 20 30 40 50 60 70 80 90 100
Cut-Off
Keepwhole
shipment
SAA

8/2/2019 SAA Report
http://slidepdf.com/reader/full/saa-report 40/54
AQL and LTPD
Acceptable Quality Level (AQL)
Poorest level of quality we arewilling to accept
Lot Tolerance Percent Defective(LTPD)
Quality level we consider bad
Consumer (buyer) does not wantto accept lots with more defectsthan LTPD SAA

8/2/2019 SAA Report
http://slidepdf.com/reader/full/saa-report 41/54
Producer’s and Consumer’s Risks
Producer's risk ()
Probability of rejecting a good lot
Probability of rejecting a lot when thefraction defective is at or above theAQL
Consumer's risk (b)
Probability of accepting a bad lot
Probability of accepting a lot whenfraction defective is below the LTPDSAA

8/2/2019 SAA Report
http://slidepdf.com/reader/full/saa-report 42/54
Probability ofAcceptance
Percentdefective
| | | | | | | | |
0 1 2 3 4 5 6 7 8
100 – 95 –
75 –
50 –
25 –
10 –
0 –
= 0.05 producer’s risk for AQL
b = 0.10
Consumer’srisk for LTPD
LTPDAQL
Bad lotsIndifference
zoneGoodlots
SAA
8/2/2019 SAA Report
http://slidepdf.com/reader/full/saa-report 43/54
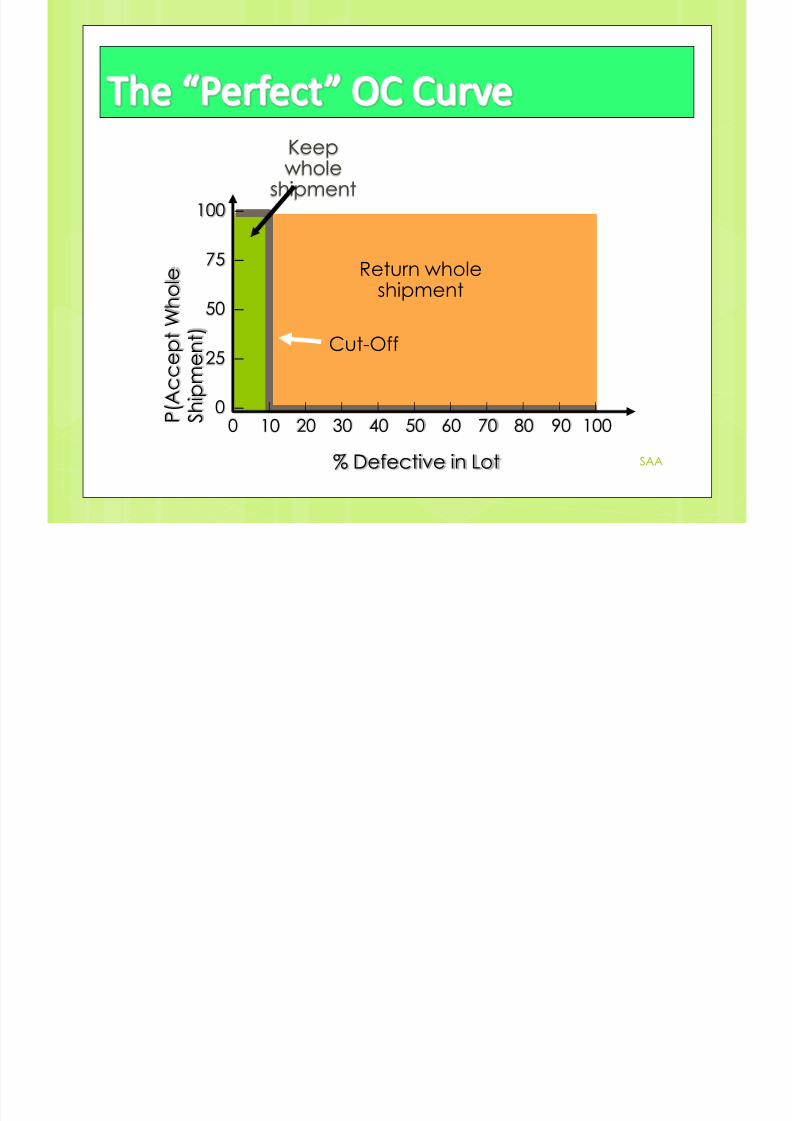
n = 50, c = 1
n = 100, c = 2
SAA

8/2/2019 SAA Report
http://slidepdf.com/reader/full/saa-report 44/54
A shipment of 2,000 portable battery units for microcomputers isabout to be inspected by a Malaysian importer. The Koreanmanufacturer and the importer have set up a sampling plan inwhich the risk is limited to 5% at an acceptable quality level (AQL)of 2% defective, and the ß risk is set to 10% at Lot Tolerance Percent
Defective (LTPD) = 7% defective. We want to construct the OCcurve for the plan of n = 120 sample size and an acceptance levelof c ≤ 3 defectives. Both firms want to know if this plan will satisfytheir quality and risk requirements. Use range values of 1 to 8percent as defectives.
SAA

8/2/2019 SAA Report
http://slidepdf.com/reader/full/saa-report 45/54

8/2/2019 SAA Report
http://slidepdf.com/reader/full/saa-report 46/54
SAA
Selected Values
of % Defective
Mean of
Poisson
ʎ=np
Probability of
Acceptance
P(A)
0.01 1.2 0.966
0.02 2.4 0.779
0.03 3.6 0.515
0.04 4.8 0.294
0.05 6.0 0.151
0.06 7.2 0.072
0.07 8.4 0.032
0.08 9.6 0.014
1- at AQL = .221>.05
ß level at LTPD < .10
New calculation isnecessary with larger
sample size if the is to belowered

8/2/2019 SAA Report
http://slidepdf.com/reader/full/saa-report 47/54
SAA
8.4%
Defective
B a d L
ot s
AQL = .221
GoodLots
-
0.200
0.400
0.600
0.800
1.000
1.200
0 2 4 6 8 10 12

8/2/2019 SAA Report
http://slidepdf.com/reader/full/saa-report 48/54
0.00
0.20
0.40
0.60
0.80
1.00
1.20
0 2 4 6 8 10 12
GOOD
LOTS ≤
2.4% D
= 0.22 PR for
AQL
ß = .03 CR
for LTPD
B
A
D
L
O
T
S
>
8.4%D
INDIFFERENCE
Percent Defective
P
r
o
b
a
b
i
l
i
t
y
o
f
A
c
c
e
p
t
a
n
c
e
8/2/2019 SAA Report
http://slidepdf.com/reader/full/saa-report 49/54
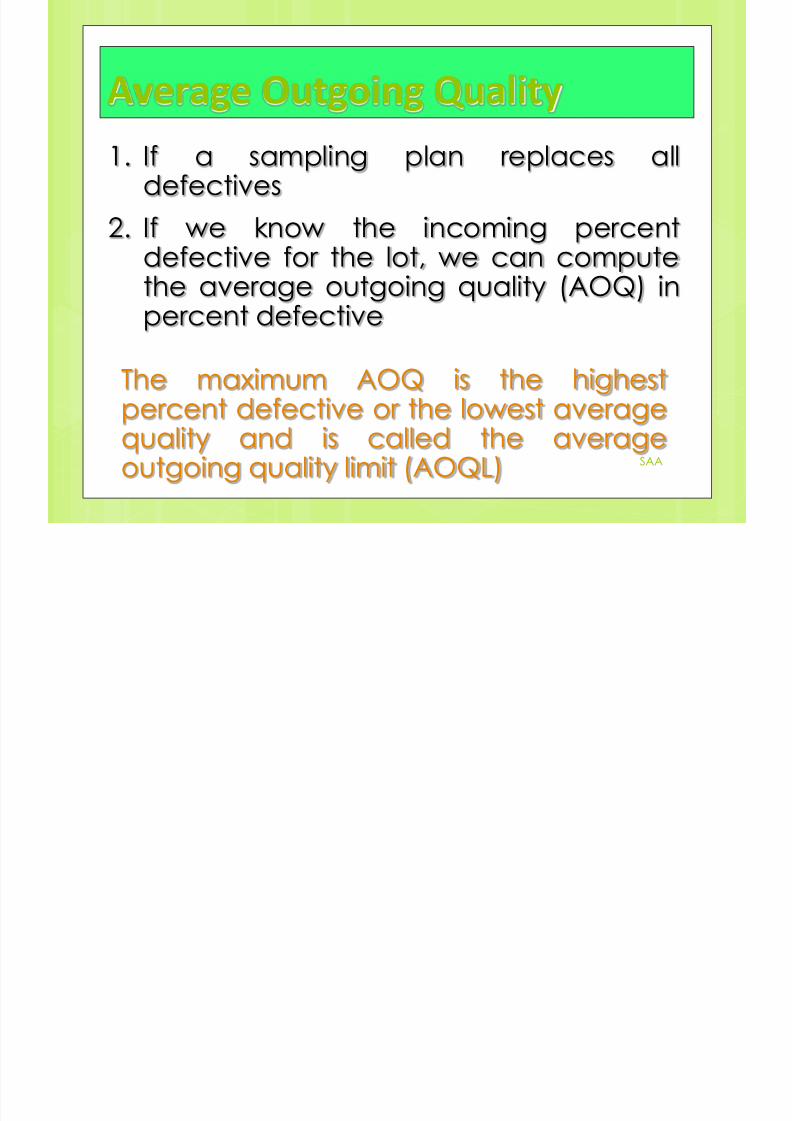
Average Outgoing Quality
1. If a sampling plan replaces alldefectives
2. If we know the incoming percent
defective for the lot, we can computethe average outgoing quality (AOQ) inpercent defective
The maximum AOQ is the highestpercent defective or the lowest averagequality and is called the averageoutgoing quality limit (AOQL) SAA

8/2/2019 SAA Report
http://slidepdf.com/reader/full/saa-report 50/54
Average Outgoing Quality
where
Pd = true percent defective of the lot
Pa = probability of accepting the lot
N = number of items in the lot
n = number of items in the sample
AOQ =(Pd)(Pa)(N - n)
N
SAA

8/2/2019 SAA Report
http://slidepdf.com/reader/full/saa-report 51/54

8/2/2019 SAA Report
http://slidepdf.com/reader/full/saa-report 52/54
Table of Illustration 2
SAA
p pac AOQ
0 0 (P x Pac)
0.05 0.914 0.046
0.10 0.736 0.074
0.15 0.544 0.082
0.20 0.376 0.075
0.25 0.244 0.0610.30 0.149 0.045
0.35 0.086 0.030
0.40 0.046 0.019

8/2/2019 SAA Report
http://slidepdf.com/reader/full/saa-report 53/54
SAA
0
0.01
0.02
0.03
0.04
0.05
0.06
0.07
0.08
0.09
0 0.1 0.2 0.3 0.4
The deliveries is 92.8%,(100-8.2)% good at 8.2AOQL.
A
O Q

8/2/2019 SAA Report
http://slidepdf.com/reader/full/saa-report 54/54
SAA