S emi -A u tom atic D etect ion of th e L eft V en tricu ... · Algoritmo de segmentação de eco...
4
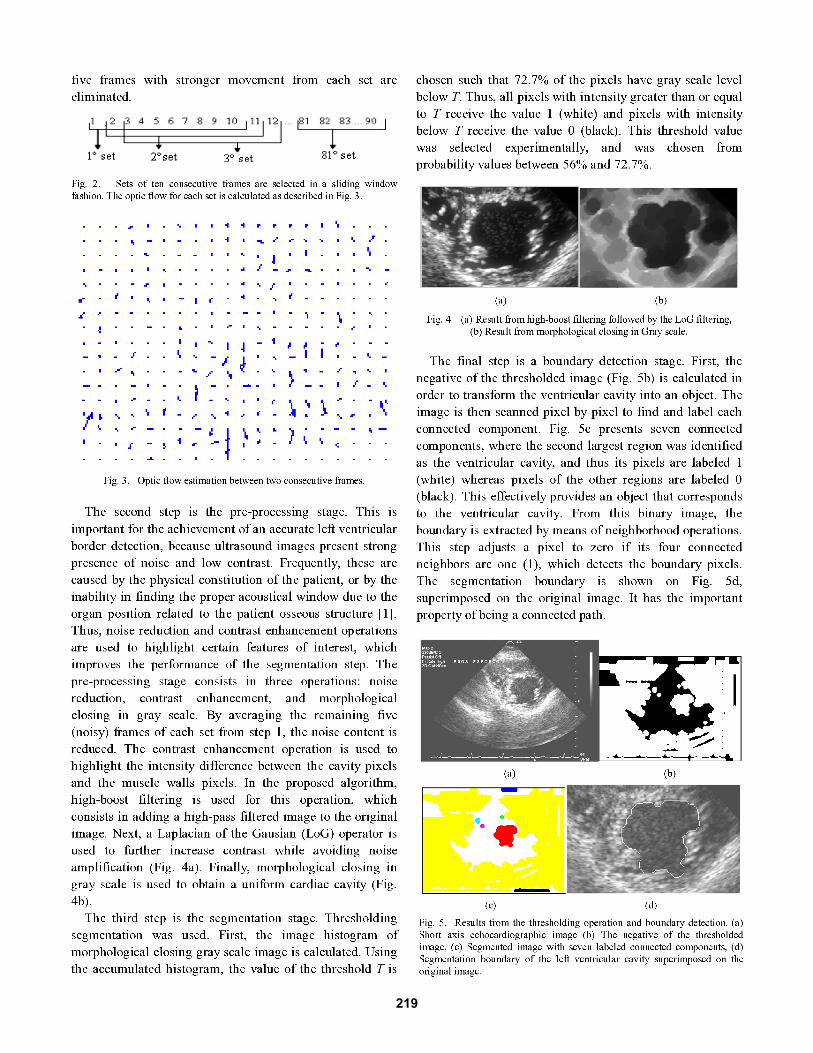
Abstract— Two semi-automatic methods for the detection of the left ventricular border in two-dimensional short axis echocardiographic images are presented and compared. In these methods, the left ventricular area variation curve is calculated during a complete cardiac cycle after the segmentation of several frames. This allows the evaluation of the cardiovascular dynamics and the identification of important clinical parameters. The algorithms are proposed as several independent modules. The results are validated through the comparison between the semi-automatic continuous boundaries and manuals boundaries sketched by a medical specialist. Keywords: segmentation, echocardiographic images, motion estimation, area variation, boundary detection. I. INTRODUCTION HE analysis of two-dimensional echocardiographic images for the assessment of myocardial function requires the identification of the left ventricle walls. Some clinical parameters can be calculated after the segmentation and detection of the left ventricle border during the end- diastole and end-systole in order to assist the specialist in the diagnosis of cardiac diseases. Several methods have been proposed with the aim of left ventricle boundary detection [1-9]. However, there is still room for innovation and improvement of these methods and algorithms. Some of these works use short axis images [3,7,9] and others focus on long axis images [4,5]. There are semi-automatic algorithms [6,7] and also those that provide fully automated detection [1,5,8]. In the method discussed above, many techniques are used in the image pre-processing stage, such as morphological filtering to reduce noise and improve image contrast [6]. Andrade et al. [1] applied the discrete wavelet transform (DWT) to reduce the speckle noise and a second order derivative operator called LoG (Laplacian of the Gaussian) to increase the contrast. Espinoza et al. [2] used a pro- mediation filter, which implements temporal averaging of Manuscript received April 7, 2008. M. do C. dos Reis, J. F. Camapum, A. F. da Rocha, F. A. de O. Nascimento, B. L. M. Espinoza and S. Salomoni are with the Electrical Engineering Department, University of Brasília, Brasília, DF 70910-900 Brazil (e-mail: [email protected], [email protected], [email protected], [email protected]). D. F. Vasconcelos is with the Medical School and the Electrical Engineering Department, University of Brasília, Brasília, DF 70910-900 Brazil. J. L. A. Carvalho is with the Department of Electrical Engineering, University of Southern California, Los Angeles, CA 90007, USA. successive frames of the same cardiac cycle. In this work, two methods for cardiac image segmentation are presented. In the first method, a motion detection procedure is used for rejecting frames with movement. In the second method, the frame rejection step was eliminated, and border extraction was achieved using motion estimation. In both methods, pre-processing filters are applied to reduce noise and increase contrast. The segmentation of the cardiac cavity is carried through thresholding operation and border extraction by means of neighborhood operations. From the segmented region, the left ventricular area is calculated and the area variation curve of a complete cardiac cycle is determined. II. DEVELOPMENT A. First Segmentation Method Fig. 1 shows a diagram of the described algorithm. The first step consists of the detection and rejection of frames with movement. Sets of ten consecutive frames are selected in a sliding window fashion (Fig. 2), and the optic flow (OF) for each set is calculated. The OF is calculated by looking for the most likely position where each object from the current frame was located in a previous frame (reference frame). The video frame is partitioned into non-overlapping macro-blocks (MB) of 16x16 pixels and a diamond search scheme is applied. The output of the OF is a motion vector for each MB which represents the object displacement that occurred between current and reference frames (Fig. 3). After movement detection, frames with strong movement are eliminated in order to prevent the degradation of the mean image which is obtained in the following step. The Semi-Automatic Detection of the Left Ventricular Border Maria do Carmo dos Reis, Adson F. da Rocha, Daniel F. Vasconcelos, Bruno L. M. Espinoza, Francisco A. de O. Nascimento, João L. A. de Carvalho, Sauro Salomoni and Juliana F. Camapum T Fig. 1. Diagram of the algorithm of the first method implemented for left ventricular segmentation. 30th Annual International IEEE EMBS Conference Vancouver, British Columbia, Canada, August 20-24, 2008 978-1-4244-1815-2/08/$25.00 ©2008 IEEE. 218
-
Upload
nguyendien -
Category
Documents
-
view
212 -
download
0
Transcript of S emi -A u tom atic D etect ion of th e L eft V en tricu ... · Algoritmo de segmentação de eco...

�
Abstract— Two semi-automatic methods for the detection of
the left ventricular border in two-dimensional short axis
echocardiographic images are presented and compared. In
these methods, the left ventricular area variation curve is
calculated during a complete cardiac cycle after the
segmentation of several frames. This allows the evaluation of
the cardiovascular dynamics and the identification of
important clinical parameters. The algorithms are proposed as
several independent modules. The results are validated
through the comparison between the semi-automatic
continuous boundaries and manuals boundaries sketched by a
medical specialist.
Keywords: segmentation, echocardiographic images, motion
estimation, area variation, boundary detection.
I. INTRODUCTION
HE analysis of two-dimensional echocardiographic
images for the assessment of myocardial function
requires the identification of the left ventricle walls. Some
clinical parameters can be calculated after the segmentation
and detection of the left ventricle border during the end-
diastole and end-systole in order to assist the specialist in
the diagnosis of cardiac diseases. Several methods have
been proposed with the aim of left ventricle boundary
detection [1-9]. However, there is still room for innovation
and improvement of these methods and algorithms. Some of
these works use short axis images [3,7,9] and others focus
on long axis images [4,5]. There are semi-automatic
algorithms [6,7] and also those that provide fully automated
detection [1,5,8].
In the method discussed above, many techniques are used
in the image pre-processing stage, such as morphological
filtering to reduce noise and improve image contrast [6].
Andrade et al. [1] applied the discrete wavelet transform
(DWT) to reduce the speckle noise and a second order
derivative operator called LoG (Laplacian of the Gaussian)
to increase the contrast. Espinoza et al. [2] used a pro-
mediation filter, which implements temporal averaging of
Manuscript received April 7, 2008.
M. do C. dos Reis, J. F. Camapum, A. F. da Rocha, F. A. de O.
Nascimento, B. L. M. Espinoza and S. Salomoni are with the Electrical
Engineering Department, University of Brasília, Brasília, DF 70910-900
Brazil (e-mail: [email protected], [email protected],
[email protected], [email protected]).
D. F. Vasconcelos is with the Medical School and the Electrical
Engineering Department, University of Brasília, Brasília, DF 70910-900
Brazil.
J. L. A. Carvalho is with the Department of Electrical Engineering,
University of Southern California, Los Angeles, CA 90007, USA.
successive frames of the same cardiac cycle.
In this work, two methods for cardiac image
segmentation are presented. In the first method, a motion
detection procedure is used for rejecting frames with
movement. In the second method, the frame rejection step
was eliminated, and border extraction was achieved using
motion estimation.
In both methods, pre-processing filters are applied to
reduce noise and increase contrast. The segmentation of the
cardiac cavity is carried through thresholding operation and
border extraction by means of neighborhood operations.
From the segmented region, the left ventricular area is
calculated and the area variation curve of a complete
cardiac cycle is determined.
II. DEVELOPMENT
A. First Segmentation Method
Fig. 1 shows a diagram of the described algorithm.
The first step consists of the detection and rejection of
frames with movement. Sets of ten consecutive frames are
selected in a sliding window fashion (Fig. 2), and the optic
flow (OF) for each set is calculated. The OF is calculated by
looking for the most likely position where each object from
the current frame was located in a previous frame (reference
frame). The video frame is partitioned into non-overlapping
macro-blocks (MB) of 16x16 pixels and a diamond search
scheme is applied. The output of the OF is a motion vector
for each MB which represents the object displacement that
occurred between current and reference frames (Fig. 3).
After movement detection, frames with strong movement
are eliminated in order to prevent the degradation of the
mean image which is obtained in the following step. The
Semi-Automatic Detection of the Left Ventricular Border
Maria do Carmo dos Reis, Adson F. da Rocha, Daniel F. Vasconcelos, Bruno L. M. Espinoza,
Francisco A. de O. Nascimento, João L. A. de Carvalho, Sauro Salomoni and Juliana F. Camapum
T
Fig. 1. Diagram of the algorithm of the first method implemented for left
ventricular segmentation.
30th Annual International IEEE EMBS ConferenceVancouver, British Columbia, Canada, August 20-24, 2008
978-1-4244-1815-2/08/$25.00 ©2008 IEEE. 218
219

220
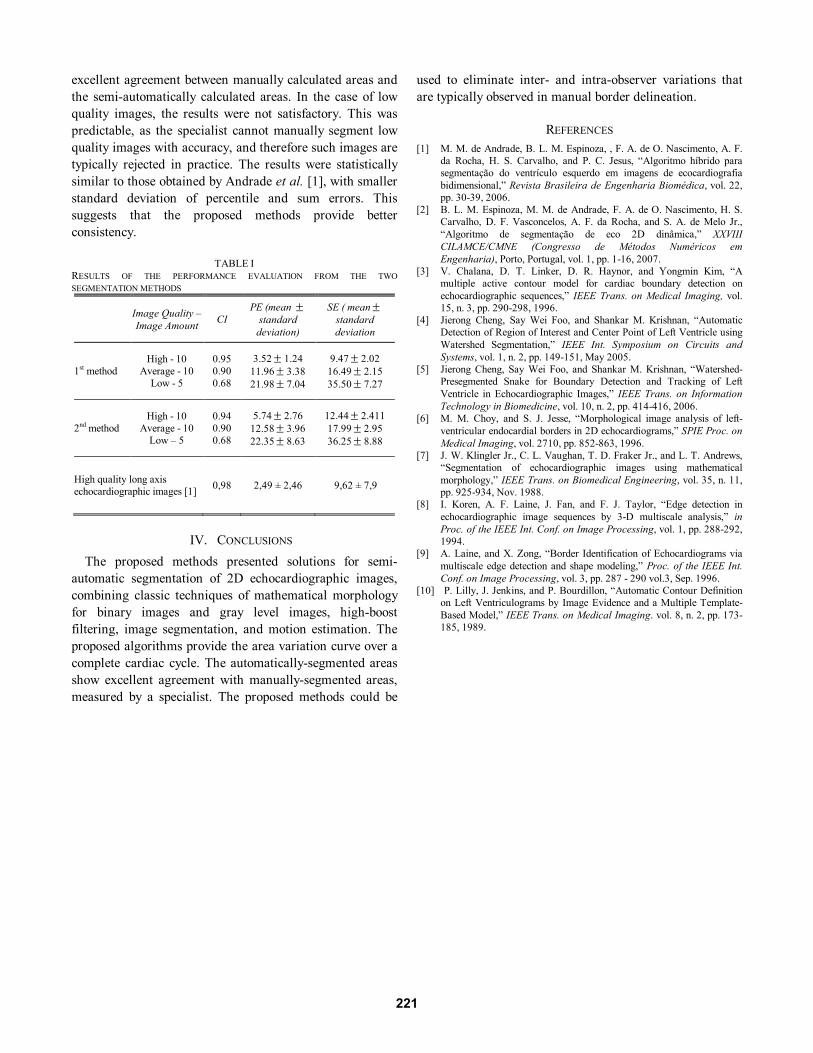
excellent agreement between manually calculated areas and
the semi-automatically calculated areas. In the case of low
quality images, the results were not satisfactory. This was
predictable, as the specialist cannot manually segment low
quality images with accuracy, and therefore such images are
typically rejected in practice. The results were statistically
similar to those obtained by Andrade et al. [1], with smaller
standard deviation of percentile and sum errors. This
suggests that the proposed methods provide better
consistency.
TABLE I
RESULTS OF THE PERFORMANCE EVALUATION FROM THE TWO
SEGMENTATION METHODS
Image Quality –
Image Amount CI
PE (mean r
standard
deviation)
SE ( mean r
standard
deviation
1st method
High - 10
Average - 10
Low - 5
0.95
0.90
0.68
3.52 r 1.24
11.96 r 3.38
21.98 r 7.04
9.47 r 2.02
16.49 r 2.15
35.50 r 7.27
2nd
method
High - 10
Average - 10
Low – 5
0.94
0.90
0.68
5.74 r 2.76
12.58 r 3.96
22.35 r 8.63
12.44 r 2.411
17.99 r 2.95
36.25 r 8.88
High quality long axis
echocardiographic images [1] 0,98 2,49 ± 2,46 9,62 ± 7,9
IV. CONCLUSIONS
The proposed methods presented solutions for semi-
automatic segmentation of 2D echocardiographic images,
combining classic techniques of mathematical morphology
for binary images and gray level images, high-boost
filtering, image segmentation, and motion estimation. The
proposed algorithms provide the area variation curve over a
complete cardiac cycle. The automatically-segmented areas
show excellent agreement with manually-segmented areas,
measured by a specialist. The proposed methods could be
used to eliminate inter- and intra-observer variations that
are typically observed in manual border delineation.
REFERENCES
[1] M. M. de Andrade, B. L. M. Espinoza, , F. A. de O. Nascimento, A. F.
da Rocha, H. S. Carvalho, and P. C. Jesus, “Algoritmo híbrido para
segmentação do ventrículo esquerdo em imagens de ecocardiografia
bidimensional,” Revista Brasileira de Engenharia Biomédica, vol. 22,
pp. 30-39, 2006.
[2] B. L. M. Espinoza, M. M. de Andrade, F. A. de O. Nascimento, H. S.
Carvalho, D. F. Vasconcelos, A. F. da Rocha, and S. A. de Melo Jr.,
“Algoritmo de segmentação de eco 2D dinâmica,” XXVIII
CILAMCE/CMNE (Congresso de Métodos Numéricos em
Engenharia), Porto, Portugal, vol. 1, pp. 1-16, 2007.
[3] V. Chalana, D. T. Linker, D. R. Haynor, and Yongmin Kim, “A
multiple active contour model for cardiac boundary detection on
echocardiographic sequences,” IEEE Trans. on Medical Imaging, vol.
15, n. 3, pp. 290-298, 1996.
[4] Jierong Cheng, Say Wei Foo, and Shankar M. Krishnan, “Automatic
Detection of Region of Interest and Center Point of Left Ventricle using
Watershed Segmentation,” IEEE Int. Symposium on Circuits and
Systems, vol. 1, n. 2, pp. 149-151, May 2005.
[5] Jierong Cheng, Say Wei Foo, and Shankar M. Krishnan, “Watershed-
Presegmented Snake for Boundary Detection and Tracking of Left
Ventricle in Echocardiographic Images,” IEEE Trans. on Information
Technology in Biomedicine, vol. 10, n. 2, pp. 414-416, 2006.
[6] M. M. Choy, and S. J. Jesse, “Morphological image analysis of left-
ventricular endocardial borders in 2D echocardiograms,” SPIE Proc. on
Medical Imaging, vol. 2710, pp. 852-863, 1996.
[7] J. W. Klingler Jr., C. L. Vaughan, T. D. Fraker Jr., and L. T. Andrews,
“Segmentation of echocardiographic images using mathematical
morphology,” IEEE Trans. on Biomedical Engineering, vol. 35, n. 11,
pp. 925-934, Nov. 1988.
[8] I. Koren, A. F. Laine, J. Fan, and F. J. Taylor, “Edge detection in
echocardiographic image sequences by 3-D multiscale analysis,” in
Proc. of the IEEE Int. Conf. on Image Processing, vol. 1, pp. 288-292,
1994.
[9] A. Laine, and X. Zong, “Border Identification of Echocardiograms via
multiscale edge detection and shape modeling,” Proc. of the IEEE Int.
Conf. on Image Processing, vol. 3, pp. 287 - 290 vol.3, Sep. 1996.
[10] P. Lilly, J. Jenkins, and P. Bourdillon, “Automatic Contour Definition
on Left Ventriculograms by Image Evidence and a Multiple Template-
Based Model,” IEEE Trans. on Medical Imaging. vol. 8, n. 2, pp. 173-
185, 1989.
221