Russian Oil and Gas Tickling Giants · almost four times its current market valuation. Lukoil has...
43
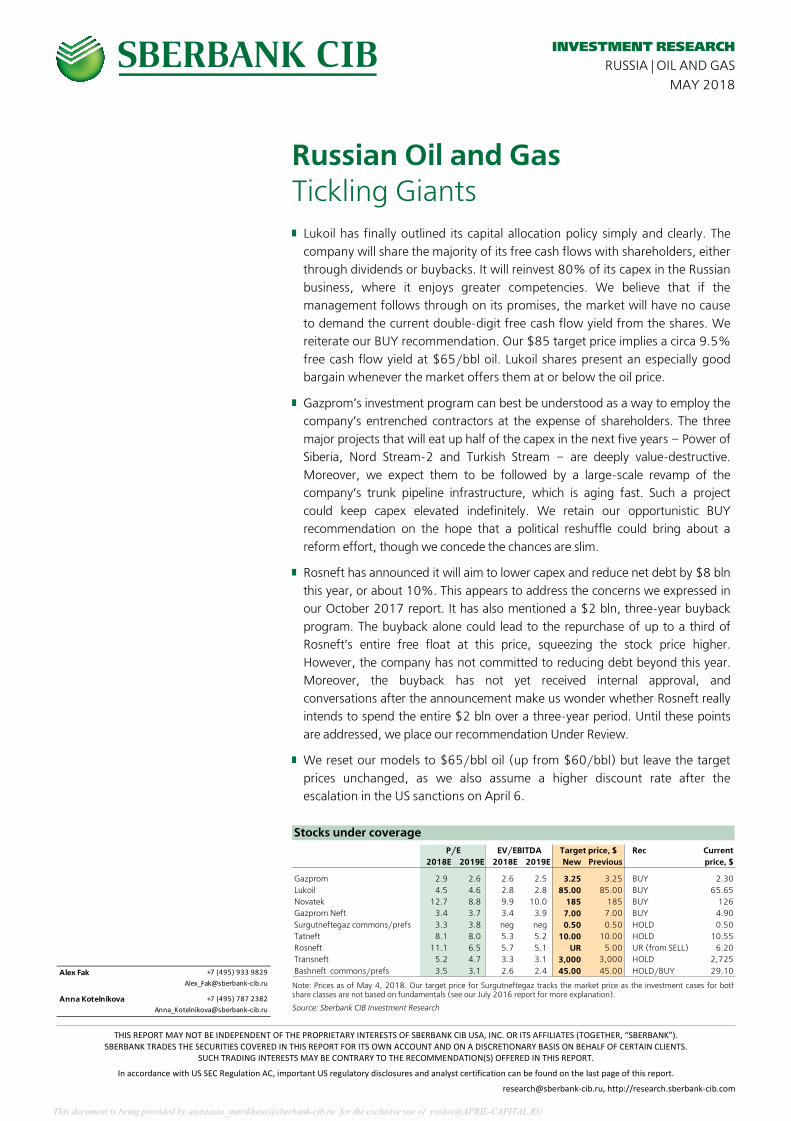
THIS REPORT MAY NOT BE INDEPENDENT OF THE PROPRIETARY INTERESTS OF SBERBANK CIB USA, INC. OR ITS AFFILIATES (TOGETHER, “SBERBANK”). SBERBANK TRADES THE SECURITIES COVERED IN THIS REPORT FOR ITS OWN ACCOUNT AND ON A DISCRETIONARY BASIS ON BEHALF OF CERTAIN CLIENTS. SUCH TRADING INTERESTS MAY BE CONTRARY TO THE RECOMMENDATION(S) OFFERED IN THIS REPORT. In accordance with US SEC Regulation AC, important US regulatory disclosures and analyst certification can be found on the last page of this report. [email protected], http://research.sberbank-cib.com INVESTMENT RESEARCH RUSSIA | OIL AND GAS MAY 2018 Russian Oil and Gas Tickling Giants █ Lukoil has finally outlined its capital allocation policy simply and clearly. The company will share the majority of its free cash flows with shareholders, either through dividends or buybacks. It will reinvest 80% of its capex in the Russian business, where it enjoys greater competencies. We believe that if the management follows through on its promises, the market will have no cause to demand the current doubledigit free cash flow yield from the shares. We reiterate our BUY recommendation. Our $85 target price implies a circa 9.5% free cash flow yield at $65/bbl oil. Lukoil shares present an especially good bargain whenever the market offers them at or below the oil price. █ Gazprom’s investment program can best be understood as a way to employ the company’s entrenched contractors at the expense of shareholders. The three major projects that will eat up half of the capex in the next five years – Power of Siberia, Nord Stream2 and Turkish Stream – are deeply valuedestructive. Moreover, we expect them to be followed by a largescale revamp of the company’s trunk pipeline infrastructure, which is aging fast. Such a project could keep capex elevated indefinitely. We retain our opportunistic BUY recommendation on the hope that a political reshuffle could bring about a reform effort, though we concede the chances are slim. █ Rosneft has announced it will aim to lower capex and reduce net debt by $8 bln this year, or about 10%. This appears to address the concerns we expressed in our October 2017 report. It has also mentioned a $2 bln, threeyear buyback program. The buyback alone could lead to the repurchase of up to a third of Rosneft’s entire free float at this price, squeezing the stock price higher. However, the company has not committed to reducing debt beyond this year. Moreover, the buyback has not yet received internal approval, and conversations after the announcement make us wonder whether Rosneft really intends to spend the entire $2 bln over a threeyear period. Until these points are addressed, we place our recommendation Under Review. █ We reset our models to $65/bbl oil (up from $60/bbl) but leave the target prices unchanged, as we also assume a higher discount rate after the escalation in the US sanctions on April 6. Stocks under coverage Rec Current 2018E 2019E 2018E 2019E New Previous price, $ Gazprom 2.9 2.6 2.6 2.5 3.25 3.25 BUY 2.30 Lukoil 4.5 4.6 2.8 2.8 85.00 85.00 BUY 65.65 Novatek 12.7 8.8 9.9 10.0 185 185 BUY 126 Gazprom Neft 3.4 3.7 3.4 3.9 7.00 7.00 BUY 4.90 Surgutneftegaz commons/prefs 3.3 3.8 neg neg 0.50 0.50 HOLD 0.50 Tatneft 8.1 8.0 5.3 5.2 10.00 10.00 HOLD 10.55 Rosneft 11.1 6.5 5.7 5.1 UR 5.00 UR (from SELL) 6.20 Transneft 5.2 4.7 3.3 3.1 3,000 3,000 HOLD 2,725 Bashneft commons/prefs 3.5 3.1 2.6 2.4 45.00 45.00 HOLD/BUY 29.10 P/E EV/EBITDA Target price, $ Note: Prices as of May 4, 2018. Our target price for Surgutneftegaz tracks the market price as the investment cases for both share classes are not based on fundamentals (see our July 2016 report for more explanation). Source: Sberbank CIB Investment Research Alex Fak +7 (495) 933 9829 [email protected] Anna Kotelnikova +7 (495) 787 2382 [email protected] This document is being provided by [email protected] for the exclusive use of yvolo This document is being provided by [email protected] for the exclusive use of [email protected]
Transcript of Russian Oil and Gas Tickling Giants · almost four times its current market valuation. Lukoil has...
THIS REPORT MAY NOT BE INDEPENDENT OF THE PROPRIETARY INTERESTS OF SBERBANK CIB USA, INC. OR ITS AFFILIATES (TOGETHER, “SBERBANK”). SBERBANK TRADES THE SECURITIES COVERED IN THIS REPORT FOR ITS OWN ACCOUNT AND ON A DISCRETIONARY BASIS ON BEHALF OF CERTAIN CLIENTS.
SUCH TRADING INTERESTS MAY BE CONTRARY TO THE RECOMMENDATION(S) OFFERED IN THIS REPORT.
In accordance with US SEC Regulation AC, important US regulatory disclosures and analyst certification can be found on the last page of this report.
[email protected], http://research.sberbank-cib.com
INVESTMENT RESEARCHRUSSIA | OIL AND GAS
MAY 2018
Russian Oil and Gas Tickling Giants █ Lukoil has finally outlined its capital allocation policy simply and clearly. The
company will share the majority of its free cash flows with shareholders, either through dividends or buybacks. It will reinvest 80% of its capex in the Russian business, where it enjoys greater competencies. We believe that if the management follows through on its promises, the market will have no cause to demand the current double�digit free cash flow yield from the shares. We reiterate our BUY recommendation. Our $85 target price implies a circa 9.5% free cash flow yield at $65/bbl oil. Lukoil shares present an especially good bargain whenever the market offers them at or below the oil price.
█ Gazprom’s investment program can best be understood as a way to employ the company’s entrenched contractors at the expense of shareholders. The three major projects that will eat up half of the capex in the next five years – Power of Siberia, Nord Stream�2 and Turkish Stream – are deeply value�destructive. Moreover, we expect them to be followed by a large�scale revamp of the company’s trunk pipeline infrastructure, which is aging fast. Such a project could keep capex elevated indefinitely. We retain our opportunistic BUY recommendation on the hope that a political reshuffle could bring about a reform effort, though we concede the chances are slim.
█ Rosneft has announced it will aim to lower capex and reduce net debt by $8 bln this year, or about 10%. This appears to address the concerns we expressed in our October 2017 report. It has also mentioned a $2 bln, three�year buyback program. The buyback alone could lead to the repurchase of up to a third of Rosneft’s entire free float at this price, squeezing the stock price higher. However, the company has not committed to reducing debt beyond this year. Moreover, the buyback has not yet received internal approval, and conversations after the announcement make us wonder whether Rosneft really intends to spend the entire $2 bln over a three�year period. Until these points are addressed, we place our recommendation Under Review.
█ We reset our models to $65/bbl oil (up from $60/bbl) but leave the target prices unchanged, as we also assume a higher discount rate after the escalation in the US sanctions on April 6.
Stocks under coverage
Rec Current2018E 2019E 2018E 2019E New Previous price, $
Gazprom 2.9 2.6 2.6 2.5 3.25 3.25 BUY 2.30Lukoil 4.5 4.6 2.8 2.8 85.00 85.00 BUY 65.65Novatek 12.7 8.8 9.9 10.0 185 185 BUY 126Gazprom Neft 3.4 3.7 3.4 3.9 7.00 7.00 BUY 4.90Surgutneftegaz commons/prefs 3.3 3.8 neg neg 0.50 0.50 HOLD 0.50Tatneft 8.1 8.0 5.3 5.2 10.00 10.00 HOLD 10.55Rosneft 11.1 6.5 5.7 5.1 UR 5.00 UR (from SELL) 6.20Transneft 5.2 4.7 3.3 3.1 3,000 3,000 HOLD 2,725Bashneft commons/prefs 3.5 3.1 2.6 2.4 45.00 45.00 HOLD/BUY 29.10
P/E EV/EBITDA Target price, $
Note: Prices as of May 4, 2018. Our target price for Surgutneftegaz tracks the market price as the investment cases for bothshare classes are not based on fundamentals (see our July 2016 report for more explanation).
Source: Sberbank CIB Investment Research
Alex Fak +7 (495) 933 [email protected]
Anna Kotelnikova +7 (495) 787 [email protected]
This document is being provided by [email protected] for the exclusive use of [email protected] document is being provided by [email protected] for the exclusive use of [email protected]
MAY 2018 RUSSIAN OIL AND GAS – TICKLING GIANTS
2 SBERBANK CIB INVESTMENT RESEARCH
Contents
Report Summary .............................................................................................................................. 3
Gazprom: Performing As Designed .................................................................................................. 4
And the villages dirty and charging high prices ........................................................................... 5
The Ukraine pincer ...................................................................................................................... 9
Soon to come: A $250 bln investment program ....................................................................... 12
Quantifying a dream ................................................................................................................. 16
Lukoil: Will They Walk the Walk? .................................................................................................... 19
Putting its cards on the table ..................................................................................................... 21
The market might not believe the management ........................................................................ 26
The market might fear a change in control ................................................................................ 27
The market might be starved of the marginal investor ............................................................... 29
Valuations ...................................................................................................................................... 31
Financial Profiles ............................................................................................................................ 32
This document is being provided by [email protected] for the exclusive use of [email protected] document is being provided by [email protected] for the exclusive use of [email protected]
RUSSIAN OIL AND GAS – TICKLING GIANTS MAY 2018
SBERBANK CIB INVESTMENT RESEARCH 3
Report Summary
We invert the common criticism of Gazprom and ask what needs to be assumed about the company to
conclude that it actually serves its function well. We discover that Gazprom’s decisions make perfect
sense if the company is assumed to be run for the benefit of its contractors, not for commercial profit.
The Power of Siberia, Nord Stream�2 and Turkish Stream are all deeply value�destructive projects that
will eat up almost half of Gazprom’s investments over the next five years. They are commonly
perceived as being foisted on the company by the government pursuing a geopolitical agenda. A more
important characteristic that they share, however, is the ability to employ a closely knit group of
suppliers in Russia, with little outside supervision. On the other hand, forgone or delayed projects –
Shtokman, Baltic LNG and Vladivostok LNG – would have been almost wholly constructed without the
help of Gazprom’s main current builders and with external oversight. This made them less attractive
from the standpoint of the interests that really set the company’s agenda.
Taking the contractors’ perspective will help gauge Gazprom’s future investment path. The rapid aging
of trunk infrastructure presents an excuse to undertake an indefinite investment drive to revamp the
network. This would play perfectly to the construction experience of Gazprom’s current slew of
suppliers. We see the emergence of Zagorsk Pipe Plant at the trough of the pipe market as a signal that
Russian large�diameter pipe makers could soon get a major boost from an accelerated pipeline
replacement program. Unfortunately, such a project would bring no new revenues to Gazprom.
A possible reshuffling of the government later this month may present a rare chance to break this
pattern. We show that Gazprom, as a profit�oriented entity, would be worth almost $200 bln, or
almost four times its current market valuation.
Lukoil has finally stated its capital allocation policy simply and clearly. The company will share the
vast majority of its free cash flow with shareholders, either through dividends or buybacks. It will
reinvest 80% of its capex in the Russian business, where it enjoys competencies (not the least of
which is extracting tax concessions). We believe that if the company follows through on its
promises, the market will have no cause to demand the current double�digit free cash flow yields
from the shares. The stock price should catch up with the Brent price and surpass it.
In the report, however, we also examine what may prevent this from happening. First and foremost,
the market may simply take a wait�and�see attitude. The current management has failed to win
investors’ trust in the past, and has delivered a performance that ranks in the bottom half of the
sector. Investors may also fear a change in control, especially since Vagit Alekperov’s contingent
legacy may rob his heirs of the flexibility needed to deal with a potential pursuer. Finally, the
problem may simply lie in attracting the new class of investor. In particular, Lukoil is barely owned
by global energy�oriented funds, which we ascribe to an unwillingness to deal with all the external
risk factors that come with owning Russian stocks. This is something the company could partially
address by simply showing up to meet with these investors.
This document is being provided by [email protected] for the exclusive use of [email protected] document is being provided by [email protected] for the exclusive use of [email protected]
MAY 2018 RUSSIAN OIL AND GAS – TICKLING GIANTS
4 SBERBANK CIB INVESTMENT RESEARCH
Gazprom: Performing As Designed
“What if Gazprom were better run?” our predecessors at Troika Dialog, the progenitor of Sberbank
CIB, asked in the title of a report back in 2002. That report came out less than a year after
Gazprom’s current CEO, Alexei Miller, took the reins.
Since then, investors have continued posing this same question, with increasing resignation. The
potential government reshuffle, expected later this month, has again given scope for some
optimism. Some investors see Gazprom as the proverbial “low�hanging fruit” for any domestic
reform effort. The eventual completion of the current slate of major pipeline projects appears to
open a window for a reform effort to succeed. The ultimate desire of investors, of course, is the
breakup of the company (which we will touch upon later), although they would gladly settle for
something much more modest, such as a cap on annual capital expenditures.
In this report, we propose an alternative point of view. What if we were to presume that Gazprom is
well�run – that is, that it perfectly serves its function, from the standpoint of the parties who really
call the shots? And what if by these parties we meant not the government (the controlling
shareholder), and, of course, not the minority shareholders, who own almost 40% of the company,
but Gazprom’s main contractors?
Why them? Because power tends to be exercised by those who can coalesce their energies around a
unifying objective. What is often generalized as “the government” is actually a collection of diverse and
often contradictory interests. For instance, the Economics Ministry might prefer Gazprom to invest in
Russia’s neglected Far East regions, the Finance Ministry could like it to direct available funds toward the
dividend, while the Federal Antimonopoly Service may rather open up the export market to competing
Russian gas – and thus cause Gazprom to earn less money down the line. The Kremlin, meanwhile,
might prefer the company to focus on geopolitical projects, like expanding export infrastructure.
The contractors, however, face no such confusion of purpose. They are united in their desire to promote
any and all boondoggles, at least within the boundaries of Russia, where their activities will face less
scrutiny. Moreover, they are thought to be better connected to the ultimate node of power in Russia than
anyone who might possibly be interested in running Gazprom for shareholders. They therefore probably
exercise much more sway in Gazprom’s decision�making than does “the government.”
Once you take this contractor�oriented view, Gazprom’s choice of focus over the past 15 years –
including projects the company ultimately rejected – starts to make perfect sense. More
importantly, this viewpoint will help better inform a future outlook on the stock. In this section, we
will disclose what Gazprom might embark on after its current three major projects are concluded.
We believe this will include a major undertaking that the company has never aired in public, but
which could tie up its cash flows indefinitely.
This document is being provided by [email protected] for the exclusive use of [email protected] document is being provided by [email protected] for the exclusive use of [email protected]
RUSSIAN OIL AND GAS – TICKLING GIANTS MAY 2018
SBERBANK CIB INVESTMENT RESEARCH 5
And the villages dirty and charging high prices
“Referring to your question about any particular protection mechanism [in the gas contract with CNPC] in association with an extremely low oil price environment, I would like to say that we have registered a high risk appetite for this particular contract and we do not envisage such an event.”
Gazprom Export official, August 2015 conference call (Gazprom had signed the contract in May 2014, when the Brent price was $110/bbl)
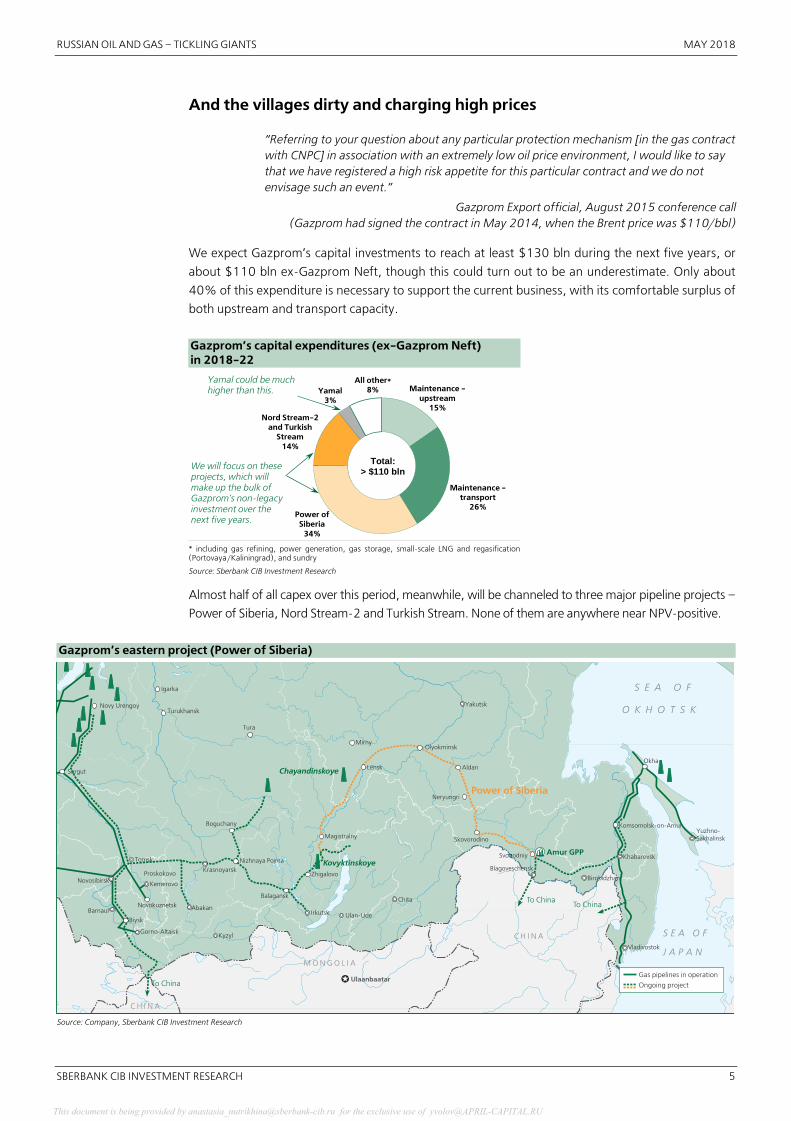
We expect Gazprom’s capital investments to reach at least $130 bln during the next five years, or
about $110 bln ex�Gazprom Neft, though this could turn out to be an underestimate. Only about
40% of this expenditure is necessary to support the current business, with its comfortable surplus of
both upstream and transport capacity.
Gazprom’s capital expenditures (ex�Gazprom Neft) in 2018�22
Maintenance �upstream
15%
Maintenance �transport
26%Power of
Siberia34%
Nord Stream�2 and Turkish
Stream14%
Yamal3%
All other*8%
We will focus on these projects, which will make up the bulk of Gazprom's non�legacy investment over the next five years.
Total: > $110 bln
Yamal could be much higher than this.
* including gas refining, power generation, gas storage, small�scale LNG and regasification (Portovaya/Kaliningrad), and sundry
Source: Sberbank CIB Investment Research
Almost half of all capex over this period, meanwhile, will be channeled to three major pipeline projects –
Power of Siberia, Nord Stream�2 and Turkish Stream. None of them are anywhere near NPV�positive.
Gazprom’s eastern project (Power of Siberia)
M O N G O L I A
C H I N A
C H I N A
S E A O F
J A P A N
S E A O F
O K H O T S K
Ulaanbaatar
Kovyktinskoye
Chayandinskoye
Power of Siberia
Amur GPP
To ChinaTo China
To ChinaGas pipelines in operation
Ongoing project
Tomsk
Krasnoyarsk
Kyzyl
Irkutsk Ulan�Ude
Chita
Blagoveschensk
Birobidzhan
Khabarovsk
Yakutsk
Tura
Yuzhno�Sakhalinsk
Proskokovo
Kemerovo
Gorno�Altaisk
Biysk
Vladivostok
Abakan
Nizhnaya Poima
Boguchany
Balagansk
Turukhansk
Igarka
Mirny
Okha
Komsomolsk�on�Amur
Skovorodino
Aldan
Neryungri
Lensk
Olyokminsk
Magistralny
Zhigalovo
Svobodniy
Novokuznetsk
Surgut
Novy Urengoy
Novosibirsk
Barnaul
Source: Company, Sberbank CIB Investment Research
This document is being provided by [email protected] for the exclusive use of [email protected] document is being provided by [email protected] for the exclusive use of [email protected]
MAY 2018 RUSSIAN OIL AND GAS – TICKLING GIANTS
6 SBERBANK CIB INVESTMENT RESEARCH
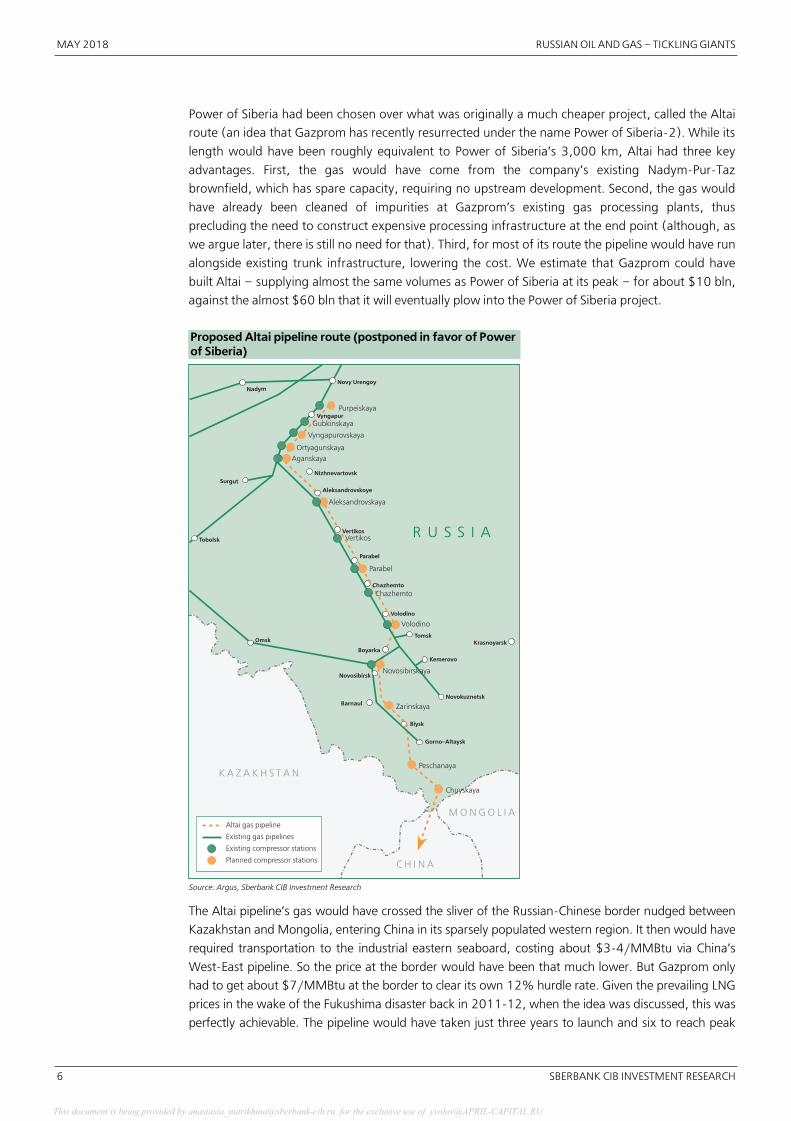
Power of Siberia had been chosen over what was originally a much cheaper project, called the Altai
route (an idea that Gazprom has recently resurrected under the name Power of Siberia�2). While its
length would have been roughly equivalent to Power of Siberia’s 3,000 km, Altai had three key
advantages. First, the gas would have come from the company’s existing Nadym�Pur�Taz
brownfield, which has spare capacity, requiring no upstream development. Second, the gas would
have already been cleaned of impurities at Gazprom’s existing gas processing plants, thus
precluding the need to construct expensive processing infrastructure at the end point (although, as
we argue later, there is still no need for that). Third, for most of its route the pipeline would have run
alongside existing trunk infrastructure, lowering the cost. We estimate that Gazprom could have
built Altai – supplying almost the same volumes as Power of Siberia at its peak – for about $10 bln,
against the almost $60 bln that it will eventually plow into the Power of Siberia project.
Proposed Altai pipeline route (postponed in favor of Power of Siberia)
Novy Urengoy
Nizhnevartovsk
Kemerovo
Novokuznetsk
Krasnoyarsk
Tobolsk
Surgut
Tomsk
Boyarka
Novosibirsk
Vertikos
Chazhemto
Volodino
Parabel
Aleksandrovskoye
Omsk
Nadym
VyngapurPurpeiskaya
Vyngapurovskaya
Ortyagunskaya
Aganskaya
Aleksandrovskaya
Vertikos
Zarinskaya
Peschanaya
Chuyskaya
Parabel
Chazhemto
Volodino
Novosibirskaya
Gubkinskaya
Barnaul
Biysk
Gorno�Altaysk
R U S S I A
M O N G O L I A
K A Z A K H S T A N
C H I N A
Altai gas pipeline
Existing gas pipelines
Existing compressor stations
Planned compressor stations
Source: Argus, Sberbank CIB Investment Research
The Altai pipeline’s gas would have crossed the sliver of the Russian�Chinese border nudged between
Kazakhstan and Mongolia, entering China in its sparsely populated western region. It then would have
required transportation to the industrial eastern seaboard, costing about $3�4/MMBtu via China’s
West�East pipeline. So the price at the border would have been that much lower. But Gazprom only
had to get about $7/MMBtu at the border to clear its own 12% hurdle rate. Given the prevailing LNG
prices in the wake of the Fukushima disaster back in 2011�12, when the idea was discussed, this was
perfectly achievable. The pipeline would have taken just three years to launch and six to reach peak
This document is being provided by [email protected] for the exclusive use of [email protected] document is being provided by [email protected] for the exclusive use of [email protected]
RUSSIAN OIL AND GAS – TICKLING GIANTS MAY 2018
SBERBANK CIB INVESTMENT RESEARCH 7
capacity (against the 12�year lead time between the start of construction of Power of Siberia and its
reaching full capacity), and it would have paid back the invested capex by 2023�24, we calculate.
Gazprom has chosen Power of Siberia over the more lucrative Altai option
Power of Siberia Altai
Length, km 2,962 2,700 Sales volumes, bcm 38 30 First pipe to launch, years 6 3 Start to peak output, years 12 6 Cost, $ bln 55.4 10.1 Break�even gas price, $/MMBtu* 12.0 7.0 Likely gas price, $/MMBtu** 7.1 7.3 Years to break�even (from launch) 16 7 NPV, $ bln (10.8) 1.0 IRR 5% 13%
* to generate Gazprom’s 12% hurdle rate of return on transportation projects
** assuming a $65/bbl oil price
Source: Sberbank CIB Investment Research
Why did Gazprom end up rejecting the route in favor of what we will see is the value�destructive Power
of Siberia? The reason offered by Gazprom is that the Chinese partners were wary of being supplied from
the same brownfields that sourced European deliveries and insisted on a dedicated source of gas for
themselves. But the Chinese were willing to sign a deal for Altai gas as early as 2010 and, we are told, all
but clamored for it after the Fukushima disaster in March 2011 drove up Japan’s demand for LNG,
causing gas prices to soar. (They would come to drive a harder bargain by 2014, when their
consumption of gas began slowing down and other sources of gas imports appeared).
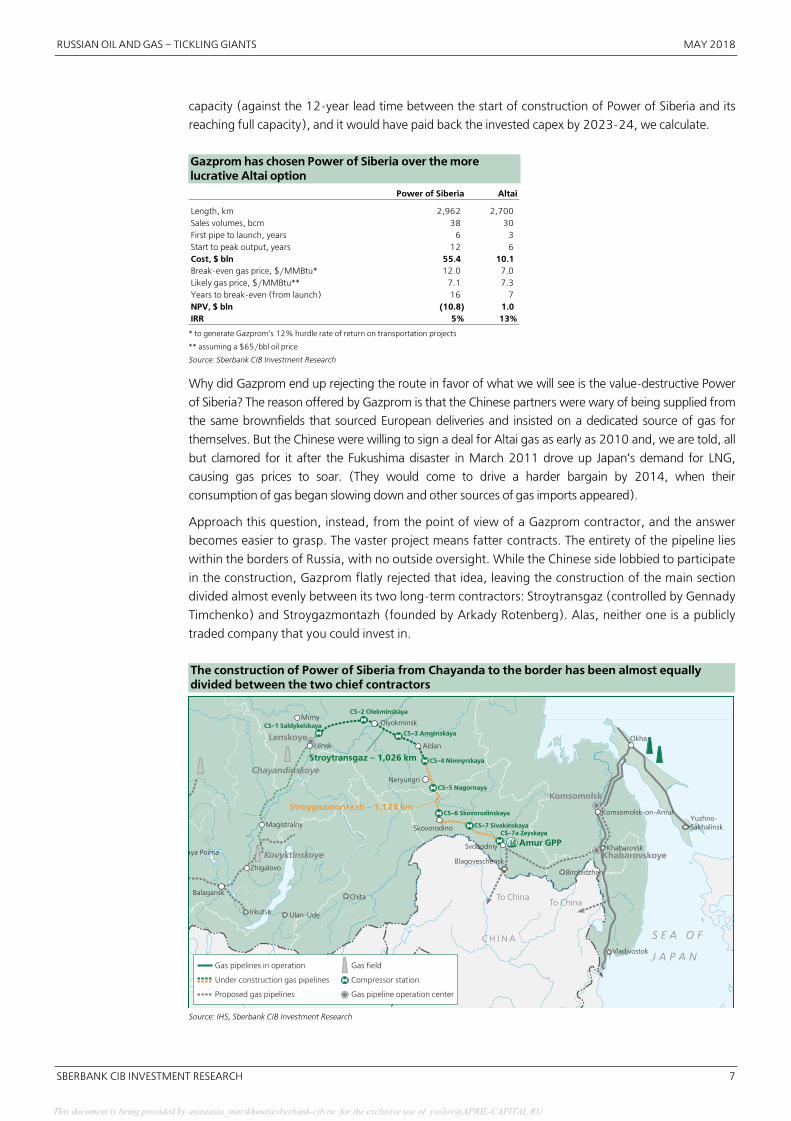
Approach this question, instead, from the point of view of a Gazprom contractor, and the answer
becomes easier to grasp. The vaster project means fatter contracts. The entirety of the pipeline lies
within the borders of Russia, with no outside oversight. While the Chinese side lobbied to participate
in the construction, Gazprom flatly rejected that idea, leaving the construction of the main section
divided almost evenly between its two long�term contractors: Stroytransgaz (controlled by Gennady
Timchenko) and Stroygazmontazh (founded by Arkady Rotenberg). Alas, neither one is a publicly
traded company that you could invest in.
The construction of Power of Siberia from Chayanda to the border has been almost equally divided between the two chief contractors
M O N G O L I A
C H I N A S E A O F
J A P A N
Ulaanbaatar
Kovyktinskoye
Chayandinskoye
Amur GPP
To ChinaTo China
Gas pipelines in operation
Proposed gas pipelines
Under construction gas pipelines
Gas field
Gas pipeline operation center
Compressor station
LenskoyeCS�1 Saldykelskaya
Stroytransgaz – 1,026 km
Stroygazmontazh – 1,124 km
CS�2 Olekminskaya
CS�3 Amginskaya
CS�4 Nimnyrskaya
CS�5 Nagornaya
CS�6 Skovorodinskaya
CS�7 SivakinskayaCS�7a Zeyskaya
Komsomolsk
Khabarovskoye
Irkutsk Ulan�Ude
Chita
Blagoveschensk
Birobidzhan
Khabarovsk
Yuzhno�Sakhalinsk
Vladivostok
aya Poima
Balagansk
Mirny
Okha
Komsomolsk�on�Amur
Skovorodino
Aldan
Neryungri
Lensk
Olyokminsk
Magistralny
Zhigalovo
Svobodniy
Source: IHS, Sberbank CIB Investment Research
This document is being provided by [email protected] for the exclusive use of [email protected] document is being provided by [email protected] for the exclusive use of [email protected]
MAY 2018 RUSSIAN OIL AND GAS – TICKLING GIANTS
8 SBERBANK CIB INVESTMENT RESEARCH
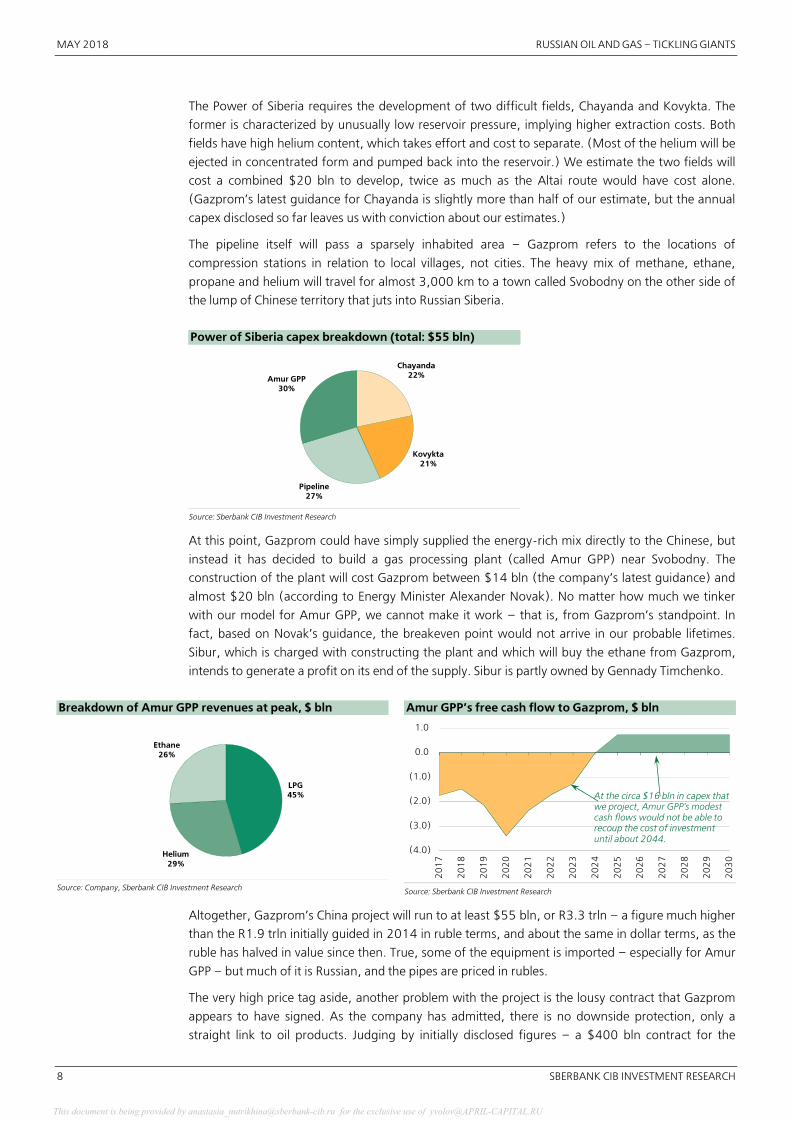
The Power of Siberia requires the development of two difficult fields, Chayanda and Kovykta. The
former is characterized by unusually low reservoir pressure, implying higher extraction costs. Both
fields have high helium content, which takes effort and cost to separate. (Most of the helium will be
ejected in concentrated form and pumped back into the reservoir.) We estimate the two fields will
cost a combined $20 bln to develop, twice as much as the Altai route would have cost alone.
(Gazprom’s latest guidance for Chayanda is slightly more than half of our estimate, but the annual
capex disclosed so far leaves us with conviction about our estimates.)
The pipeline itself will pass a sparsely inhabited area – Gazprom refers to the locations of
compression stations in relation to local villages, not cities. The heavy mix of methane, ethane,
propane and helium will travel for almost 3,000 km to a town called Svobodny on the other side of
the lump of Chinese territory that juts into Russian Siberia.
Power of Siberia capex breakdown (total: $55 bln)
Chayanda22%
Kovykta21%
Pipeline27%
Amur GPP30%
Source: Sberbank CIB Investment Research
At this point, Gazprom could have simply supplied the energy�rich mix directly to the Chinese, but
instead it has decided to build a gas processing plant (called Amur GPP) near Svobodny. The
construction of the plant will cost Gazprom between $14 bln (the company’s latest guidance) and
almost $20 bln (according to Energy Minister Alexander Novak). No matter how much we tinker
with our model for Amur GPP, we cannot make it work – that is, from Gazprom’s standpoint. In
fact, based on Novak’s guidance, the breakeven point would not arrive in our probable lifetimes.
Sibur, which is charged with constructing the plant and which will buy the ethane from Gazprom,
intends to generate a profit on its end of the supply. Sibur is partly owned by Gennady Timchenko.
Breakdown of Amur GPP revenues at peak, $ bln
LPG45%
Helium29%
Ethane26%
Source: Company, Sberbank CIB Investment Research
Amur GPP’s free cash flow to Gazprom, $ bln
(4.0)
(3.0)
(2.0)
(1.0)
0.0
1.0
20
17
20
18
20
19
20
20
20
21
20
22
20
23
20
24
20
25
20
26
20
27
20
28
20
29
20
30
At the circa $16 bln in capex that we project, Amur GPP's modest cash flows would not be able to recoup the cost of investment until about 2044.
Source: Sberbank CIB Investment Research
Altogether, Gazprom’s China project will run to at least $55 bln, or R3.3 trln – a figure much higher
than the R1.9 trln initially guided in 2014 in ruble terms, and about the same in dollar terms, as the
ruble has halved in value since then. True, some of the equipment is imported – especially for Amur
GPP – but much of it is Russian, and the pipes are priced in rubles.
The very high price tag aside, another problem with the project is the lousy contract that Gazprom
appears to have signed. As the company has admitted, there is no downside protection, only a
straight link to oil products. Judging by initially disclosed figures – a $400 bln contract for the
This document is being provided by [email protected] for the exclusive use of [email protected] document is being provided by [email protected] for the exclusive use of [email protected]
RUSSIAN OIL AND GAS – TICKLING GIANTS MAY 2018
SBERBANK CIB INVESTMENT RESEARCH 9
supply of 1,032 bcm over 30 years, signed at the $100�110/bbl prevailing oil price – we calculate
that Gazprom will be selling gas to China at a simple slope of between 10% and 11% to the oil price
(for instance, $6.0�6.6/MMBtu at a $60/bbl oil price).
And the deal is much worse than it appears at first glance, because in reality, it can only benefit the buyer.
As we have written before, China now faces a surplus of offers – from Gazprom, from Central Asia and
via LNG (including from Novatek) – and can afford to pick and choose which gas it accepts. This is the
opposite of the situation after the Fukushima disaster, when Chinese consumption was growing faster
and the country was eager for guaranteed sources of gas. A dedicated project that aims at a single buyer
puts the buyer in the driver’s seat. China will accept Gazprom’s gas when it is competitive with LNG. At
higher oil prices, Gazprom would have to offer discounts or risk losing sales (this should be familiar to
those who have followed Gazprom’s European export business). If it refuses to sell at a discount, it
should remember that China has been seen as ignoring contractual obligations when they prove
inconvenient (as we suspect it did with Qatar in 2013�14). By signing a contract with China to sell gas
from dedicated fields with no downside protection for itself, Gazprom has in effect given up all the upside
but assumed all the risk.
Power of Siberia gas deliveries, bcm
0
5
10
16
21
25
38 38 38 38 38 38
0
5
10
15
20
25
30
35
40
20
19
20
20
20
21
20
22
20
23
20
24
20
25
20
26
20
27
20
28
20
29
20
30
Source: Company
Power of Siberia FCF to Gazprom, $ bln
(0.1)(0.3)(1.9)
(6.5)(7.2)
(9.8)
(6.1)(4.9)
(3.5)
(1.6)(1.3)
3.7 4.7 4.6 4.5 4.4 4.3
(12)
(9)
(6)
(3)
0
3
62
01
4
20
15
20
16
20
17
20
18
E
20
19
E
20
20
E
20
21
E
20
22
E
20
23
E
20
24
E
20
25
E
20
26
E
20
27
E
20
28
E
20
29
E
20
30
E
Source: Company, Sberbank CIB Investment Research
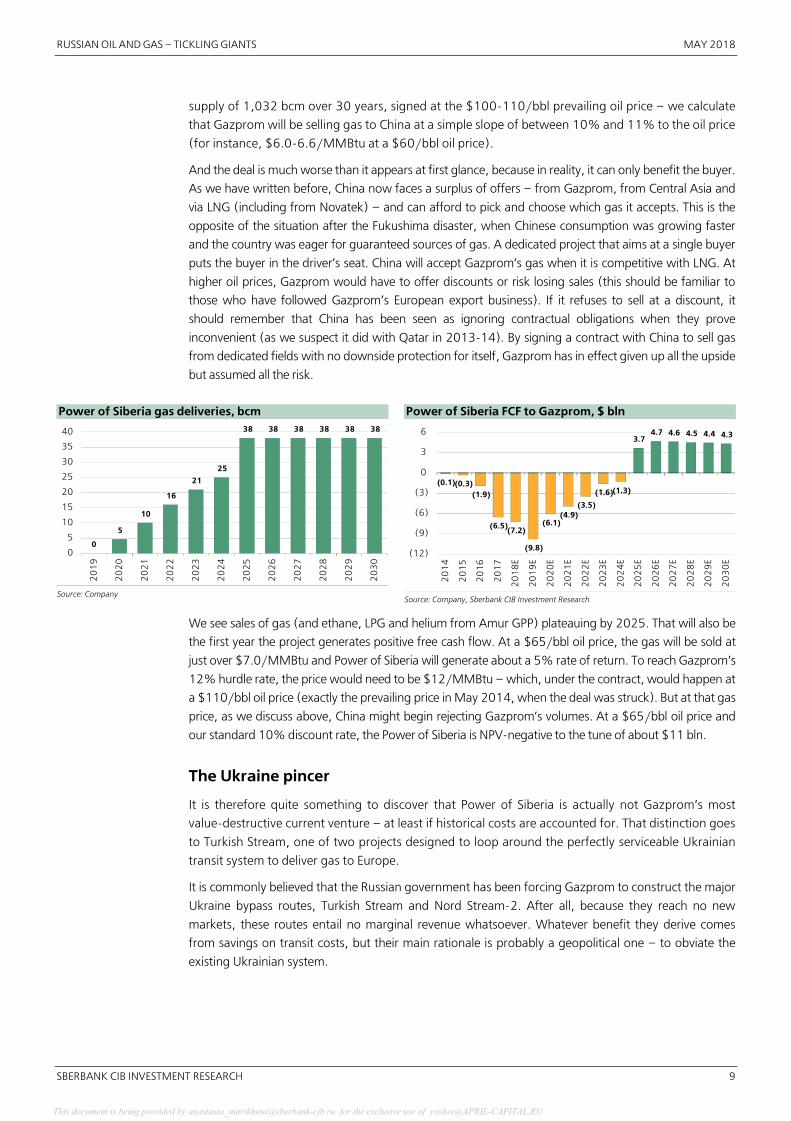
We see sales of gas (and ethane, LPG and helium from Amur GPP) plateauing by 2025. That will also be
the first year the project generates positive free cash flow. At a $65/bbl oil price, the gas will be sold at
just over $7.0/MMBtu and Power of Siberia will generate about a 5% rate of return. To reach Gazprom’s
12% hurdle rate, the price would need to be $12/MMBtu – which, under the contract, would happen at
a $110/bbl oil price (exactly the prevailing price in May 2014, when the deal was struck). But at that gas
price, as we discuss above, China might begin rejecting Gazprom’s volumes. At a $65/bbl oil price and
our standard 10% discount rate, the Power of Siberia is NPV�negative to the tune of about $11 bln.
The Ukraine pincer
It is therefore quite something to discover that Power of Siberia is actually not Gazprom’s most
value�destructive current venture – at least if historical costs are accounted for. That distinction goes
to Turkish Stream, one of two projects designed to loop around the perfectly serviceable Ukrainian
transit system to deliver gas to Europe.
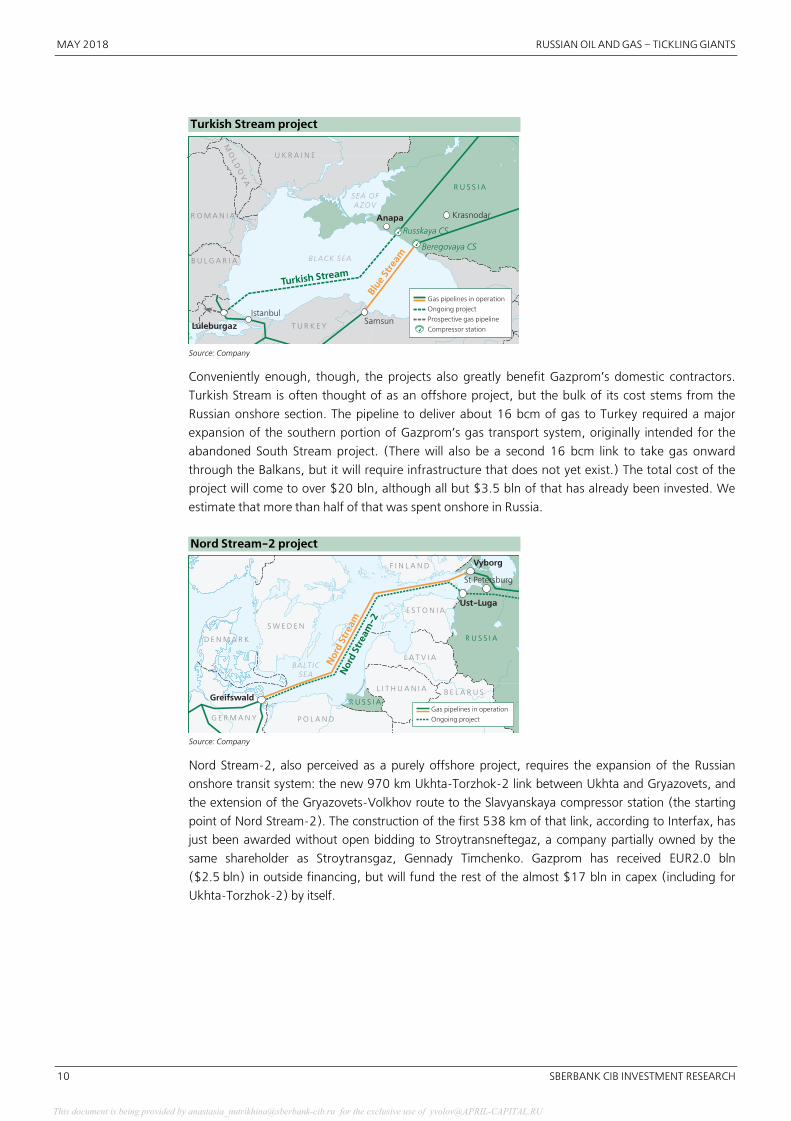
It is commonly believed that the Russian government has been forcing Gazprom to construct the major
Ukraine bypass routes, Turkish Stream and Nord Stream�2. After all, because they reach no new
markets, these routes entail no marginal revenue whatsoever. Whatever benefit they derive comes
from savings on transit costs, but their main rationale is probably a geopolitical one – to obviate the
existing Ukrainian system.
This document is being provided by [email protected] for the exclusive use of [email protected] document is being provided by [email protected] for the exclusive use of [email protected]
MAY 2018 RUSSIAN OIL AND GAS – TICKLING GIANTS
10 SBERBANK CIB INVESTMENT RESEARCH
Turkish Stream project
SEA OFAZOV
BLACK SEA
U K R A I N E
R O M A N I A
B U L G A R I A
MO
LD
OV
A
R U S S I A
T U R K E Y
Anapa
SamsunIstanbul
Luleburgaz
Krasnodar
Turkish Stream
Blue
Stre
am
Russkaya CS
Beregovaya CS
Gas pipelines in operation
Ongoing project
Prospective gas pipeline
Compressor station
Source: Company
Conveniently enough, though, the projects also greatly benefit Gazprom’s domestic contractors.
Turkish Stream is often thought of as an offshore project, but the bulk of its cost stems from the
Russian onshore section. The pipeline to deliver about 16 bcm of gas to Turkey required a major
expansion of the southern portion of Gazprom’s gas transport system, originally intended for the
abandoned South Stream project. (There will also be a second 16 bcm link to take gas onward
through the Balkans, but it will require infrastructure that does not yet exist.) The total cost of the
project will come to over $20 bln, although all but $3.5 bln of that has already been invested. We
estimate that more than half of that was spent onshore in Russia.
Nord Stream�2 project
BALTICSEA
F I N L A N D
S W E D E N
E S T O N I A
D E N M A R K
L A T V I A
L I T H U A N I A B E L A R U S
P O L A N DG E R M A N Y
R U S S I A
R U S S I A
Vyborg
Ust�Luga
Greifswald
St Petersburg
Nor
d St
ream
Nor
d St
ream
�2
Gas pipelines in operation
Ongoing project
Source: Company
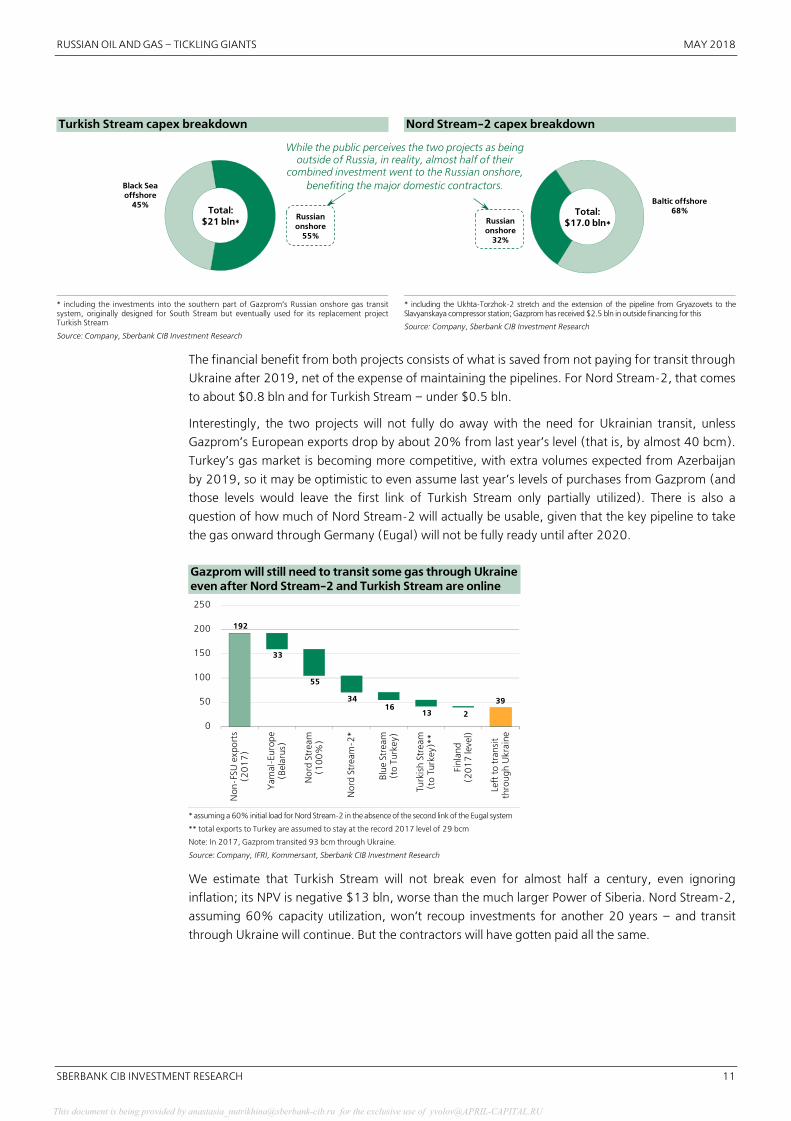
Nord Stream�2, also perceived as a purely offshore project, requires the expansion of the Russian
onshore transit system: the new 970 km Ukhta�Torzhok�2 link between Ukhta and Gryazovets, and
the extension of the Gryazovets�Volkhov route to the Slavyanskaya compressor station (the starting
point of Nord Stream�2). The construction of the first 538 km of that link, according to Interfax, has
just been awarded without open bidding to Stroytransneftegaz, a company partially owned by the
same shareholder as Stroytransgaz, Gennady Timchenko. Gazprom has received EUR2.0 bln
($2.5 bln) in outside financing, but will fund the rest of the almost $17 bln in capex (including for
Ukhta�Torzhok�2) by itself.
This document is being provided by [email protected] for the exclusive use of [email protected] document is being provided by [email protected] for the exclusive use of [email protected]
RUSSIAN OIL AND GAS – TICKLING GIANTS MAY 2018
SBERBANK CIB INVESTMENT RESEARCH 11
Turkish Stream capex breakdown
Russian onshore
55%
Black Sea offshore
45%Total:
$21 bln*
* including the investments into the southern part of Gazprom’s Russian onshore gas transitsystem, originally designed for South Stream but eventually used for its replacement projectTurkish Stream
Source: Company, Sberbank CIB Investment Research
Nord Stream�2 capex breakdown
Russian onshore
32%
Baltic offshore68%Total:
$17.0 bln*
* including the Ukhta�Torzhok�2 stretch and the extension of the pipeline from Gryazovets to theSlavyanskaya compressor station; Gazprom has received $2.5 bln in outside financing for this
Source: Company, Sberbank CIB Investment Research
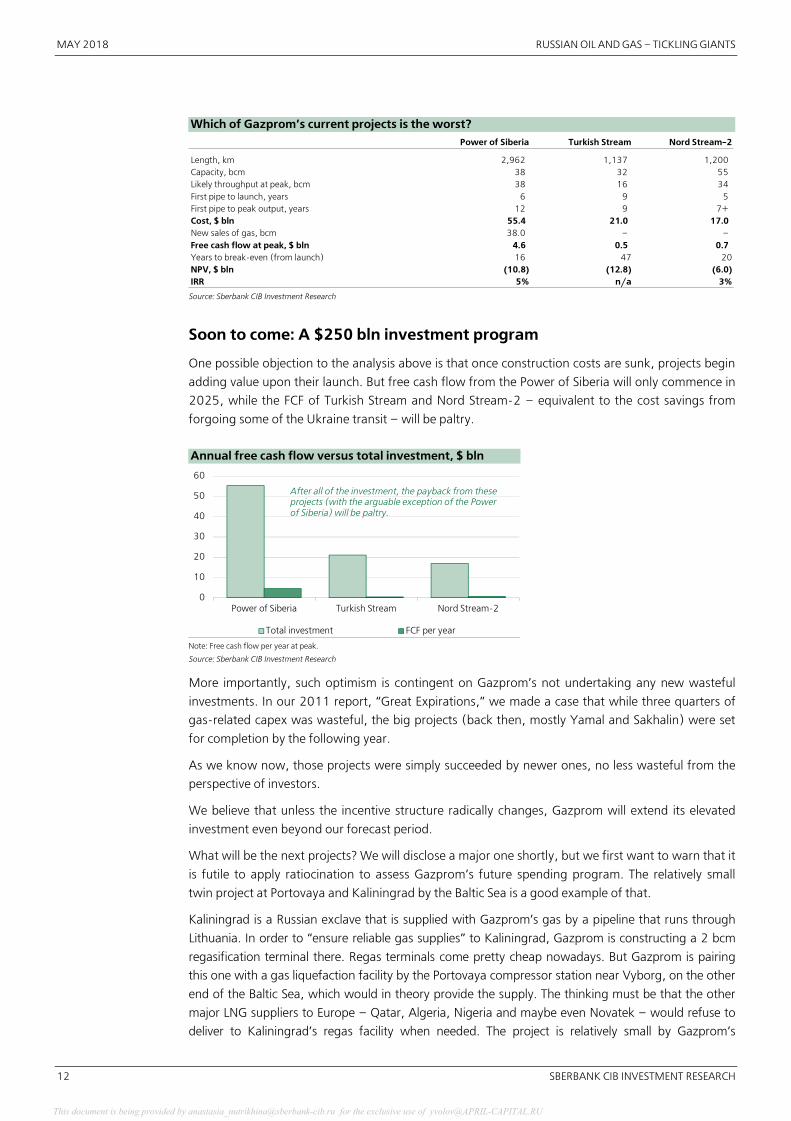
The financial benefit from both projects consists of what is saved from not paying for transit through
Ukraine after 2019, net of the expense of maintaining the pipelines. For Nord Stream�2, that comes
to about $0.8 bln and for Turkish Stream – under $0.5 bln.
Interestingly, the two projects will not fully do away with the need for Ukrainian transit, unless
Gazprom’s European exports drop by about 20% from last year’s level (that is, by almost 40 bcm).
Turkey’s gas market is becoming more competitive, with extra volumes expected from Azerbaijan
by 2019, so it may be optimistic to even assume last year’s levels of purchases from Gazprom (and
those levels would leave the first link of Turkish Stream only partially utilized). There is also a
question of how much of Nord Stream�2 will actually be usable, given that the key pipeline to take
the gas onward through Germany (Eugal) will not be fully ready until after 2020.
Gazprom will still need to transit some gas through Ukraine even after Nord Stream�2 and Turkish Stream are online
192
39
33
55
34 16
13 2
0
50
100
150
200
250
Non
�FSU
exp
orts
(20
17
)
Yam
al�E
urop
e(B
elar
us)
Nor
d St
ream
(10
0%
)
Nor
d St
ream
�2*
Blu
e St
ream
(to
Turk
ey)
Turk
ish
Stre
am(t
o Tu
rkey
)**
Finl
and
(20
17
leve
l)
Left
to tr
ansi
tth
roug
h U
krai
ne
* assuming a 60% initial load for Nord Stream�2 in the absence of the second link of the Eugal system
** total exports to Turkey are assumed to stay at the record 2017 level of 29 bcm
Note: In 2017, Gazprom transited 93 bcm through Ukraine.
Source: Company, IFRI, Kommersant, Sberbank CIB Investment Research
We estimate that Turkish Stream will not break even for almost half a century, even ignoring
inflation; its NPV is negative $13 bln, worse than the much larger Power of Siberia. Nord Stream�2,
assuming 60% capacity utilization, won’t recoup investments for another 20 years – and transit
through Ukraine will continue. But the contractors will have gotten paid all the same.
While the public perceives the two projects as being outside of Russia, in reality, almost half of their
combined investment went to the Russian onshore, benefiting the major domestic contractors.
This document is being provided by [email protected] for the exclusive use of [email protected] document is being provided by [email protected] for the exclusive use of [email protected]
MAY 2018 RUSSIAN OIL AND GAS – TICKLING GIANTS
12 SBERBANK CIB INVESTMENT RESEARCH
Which of Gazprom’s current projects is the worst?
Power of Siberia Turkish Stream Nord Stream�2
Length, km 2,962 1,137 1,200 Capacity, bcm 38 32 55 Likely throughput at peak, bcm 38 16 34 First pipe to launch, years 6 9 5 First pipe to peak output, years 12 9 7+Cost, $ bln 55.4 21.0 17.0 New sales of gas, bcm 38.0 – –Free cash flow at peak, $ bln 4.6 0.5 0.7 Years to break�even (from launch) 16 47 20NPV, $ bln (10.8) (12.8) (6.0) IRR 5% n/a 3%
Source: Sberbank CIB Investment Research
Soon to come: A $250 bln investment program
One possible objection to the analysis above is that once construction costs are sunk, projects begin
adding value upon their launch. But free cash flow from the Power of Siberia will only commence in
2025, while the FCF of Turkish Stream and Nord Stream�2 – equivalent to the cost savings from
forgoing some of the Ukraine transit – will be paltry.
Annual free cash flow versus total investment, $ bln
0
10
20
30
40
50
60
Power of Siberia Turkish Stream Nord Stream�2
Total investment FCF per year
After all of the investment, the payback from these projects (with the arguable exception of the Power of Siberia) will be paltry.
Note: Free cash flow per year at peak.
Source: Sberbank CIB Investment Research
More importantly, such optimism is contingent on Gazprom’s not undertaking any new wasteful
investments. In our 2011 report, “Great Expirations,” we made a case that while three quarters of
gas�related capex was wasteful, the big projects (back then, mostly Yamal and Sakhalin) were set
for completion by the following year.
As we know now, those projects were simply succeeded by newer ones, no less wasteful from the
perspective of investors.
We believe that unless the incentive structure radically changes, Gazprom will extend its elevated
investment even beyond our forecast period.
What will be the next projects? We will disclose a major one shortly, but we first want to warn that it
is futile to apply ratiocination to assess Gazprom’s future spending program. The relatively small
twin project at Portovaya and Kaliningrad by the Baltic Sea is a good example of that.
Kaliningrad is a Russian exclave that is supplied with Gazprom’s gas by a pipeline that runs through
Lithuania. In order to “ensure reliable gas supplies” to Kaliningrad, Gazprom is constructing a 2 bcm
regasification terminal there. Regas terminals come pretty cheap nowadays. But Gazprom is pairing
this one with a gas liquefaction facility by the Portovaya compressor station near Vyborg, on the other
end of the Baltic Sea, which would in theory provide the supply. The thinking must be that the other
major LNG suppliers to Europe – Qatar, Algeria, Nigeria and maybe even Novatek – would refuse to
deliver to Kaliningrad’s regas facility when needed. The project is relatively small by Gazprom’s
This document is being provided by [email protected] for the exclusive use of [email protected] document is being provided by [email protected] for the exclusive use of [email protected]

RUSSIAN OIL AND GAS – TICKLING GIANTS MAY 2018
SBERBANK CIB INVESTMENT RESEARCH 13
standards – it will cost $2�3 bln – but it is even more devoid of commercial logic than Nord Stream�2
or Turkish Stream. Its main contractor on the Kaliningrad side is Timchenko’s Stroytransneftegaz.
Portovaya LNG facility and Kaliningrad regasification terminal
BALTIC SEA
F I N L A N D
S W E D E N
E S T O N I A
N M A R K
L A T V I A
L I T H U A N I A
B E L A R U S
P O L A N D
G E R M A N Y
R U S S I A
Gas pipelines in operation
Ongoing project
Vilnius
Minsk
RigaCopenhagen
Stockholm
Oslo
Berlin
Warsawa
Helsinki
Tallinn
Nor
d St
ream
St PetersburgVyborg
Kaliningrad
Kaunas
Source: Company, Sberbank CIB Investment Research
More recently, Vedomosti reported that Gazprom and Rusgazdobycha, a company previously connected
to another Gazprom contractor, Arkady Rotenberg, were mulling a 45 bcm gas processing plant, Baltic
GPP, near Ust�Luga on the shores of the Baltic Sea – in effect, another Amur GPP. We have already
discussed the poor economics of Amur GPP. The new idea appears to be even worse, because it would
require the supply of ethane�rich gas (11% ethane content) from the Nadym�Pur�Taz fields. That is
something that the current gas pipelines to Ust�Luga, designed to supply relatively low�ethane (3%) gas
from the Bovanenkovo field on the Yamal Peninsula for the Nord Stream project, cannot handle without
a major upgrade. Moreover, the project would require the expansion of the entire 3,000 km trunk
network from Nadym�Pur�Taz toward northwest Russia.
Where would about 40 bcm of the extracted methane (natural gas) go? Gazprom is thinking of
using 10�15 bcm for the future Baltic LNG project (to which we’ll return briefly). The rest is
probably going to supplant Bovanenkovo gas in the Nord Stream pipeline, depreciating much of the
$80 bln invested in that field’s development over the years.
How much Baltic GPP could ultimately cost Gazprom, $ bln
0
20
40
60
80
Bal
tic G
PPpl
ant
(45
bcm
)
Upg
rade
of p
ipel
ine
netw
ork
Expa
nsio
n of
net
wor
kfr
om N
adym
�Pur
�Taz
Con
stru
ctio
nof
Bal
tic L
NG
Writ
e�of
fof
par
t of
Bova
nenk
ovo
Incr
emen
tal
FCF
from
Bal
tic L
NG
+ G
PP(f
or c
ompa
rison
)
It could take 35 yearsfor the project to pay back Gazprom's investments.
Note: These figures are estimates that have not been officially confirmed by the company.
Source: Vedomosti, Sberbank CIB Investment Research
So the $20 bln preliminary price tag for the standalone Baltic GPP, cited by the newspaper, would
swell massively if the project is undertaken. Gazprom has officially guided that the plant would cost
This document is being provided by [email protected] for the exclusive use of [email protected] document is being provided by [email protected] for the exclusive use of [email protected]

MAY 2018 RUSSIAN OIL AND GAS – TICKLING GIANTS
14 SBERBANK CIB INVESTMENT RESEARCH
just $5 bln, but given that the smaller Amur GPP will cost three to four times as much, this much
lower guidance strains credulity.
If Gazprom were ever to “run out” of investment ideas as its current trio of projects expires, then we
would expect it to launch a major pipeline upgrade program. Well over half of Gazprom’s 172,000
km trunk infrastructure is over 30 years old – up from just 15% at the turn of the century – while
almost a quarter is older than 40 years.
Breakdown of Gazprom's trunk gas pipelines by age
10%
10%
24%
32%
14%
10%
10 years or less
11 to 20 years
21 to 30 years
31 to 40 years
41 to 50 years
Over 50 years
Source: Company
The aging into the 30+ cohort has accelerated recently, indicating that the last major trunk
replacement program happened at the tail end of the Soviet period. A well�informed source at
Gazprom tells us that there is no hard�and�fast rule for how old trunk pipelines have to get before
they need to be replaced. Some are judged to need capital repairs after just 20 years, while others
are left in operation 50 years or more (which is the case for 10% of the current system). So
Gazprom’s management has full discretion over the size of the annual trunk replacement program
and its expansion, which is limited only by the capacity of Russian companies to produce and lay
down pipes and erect compressor stations.
Breakdown of Gazprom’s trunk pipelines by age
15% 11% 13% 10%
41%
26%12%
9%
29%
40%
37%
24%
15%23%
38%57%
0%
20%
40%
60%
80%
100%
2002 2007 2012 2017
Up to 10 years From 11 to 20 yearsFrom 21 to 30 years From 31 years
150,000 km 158,000 km 168,000 km 172,000 km
Source: Company
A large ramp�up in trunk pipeline replacement would perfectly suit the current major contractors,
and this, if you follow us thus far, would be the key determination for receiving the green light. How
much would it cost? We estimate that Gazprom spent an average of about $4.5 bln per year over
the past five years to replace or repair about 3,000 km of trunk pipeline per annum. Gradually
quadruple that pace and you would get a 15�year, $250 bln investment project, or $15�20 bln per
year of upgrades. That would help keep investment, which is elevated in 2018�19, from
subsequently sagging as the Power of Siberia, Turkish Stream and Nord Stream�2 projects expire.
Gazprom could claim it as necessary “maintenance” capex. Unfortunately for shareholders, this
would generate not a dime of incremental revenues.
Well over half of Gazprom's trunk infrastructure is now over 30 years old, and less than a fifth is less than 20 years old. The company has been spending like mad over the past two decades on new projects, but has allowed its core transport infrastructure to age considerably.
This document is being provided by [email protected] for the exclusive use of [email protected] document is being provided by [email protected] for the exclusive use of [email protected]
RUSSIAN OIL AND GAS – TICKLING GIANTS MAY 2018
SBERBANK CIB INVESTMENT RESEARCH 15
Gazprom’s investment into legacy pipelines could quadruple to maintain the elevated investment program, $ bln
0
5
10
15
20
25
30
35
20
15
20
16
20
17
20
18
E
20
19
E
20
20
E
20
21
E
20
22
E
20
23
E
20
24
E
20
25
E
Gazprom NeftYamal, utilities, small LNG, otherPower of Siberia, Turkish Stream, Nord Stream�2Legacy pipelinesUpstream brownfields
Source: Company, Sberbank CIB Investment Research
The Russian makers of large�diameter pipes certainly have enough capacity to satisfy Gazprom’s
needs. The domestic utilization of large�diameter pipe capacity fell to just 27% last year and is
expected to decline to little more than 20% by 2019. This has forced producers to increase their
exports, but they were still unable to utilize more than half of their capacities.
Capacity utilization for producing large�diameter pipes
0%
20%
40%
60%
80%
100%
2013 2014 2015 2016 2017 2018E 2019E
Domestic utilization Utilization including exports
Pipemakers expanded capacity by about 20% between 2015 and 2017, even as demand (foremost from Gazprom) declined, causing a fivefold increase in exports between 2015 and 2017.
So why would a new player try to muscle its way into the
market at this time?
Source: Metal Expert, Pipe Industry Development Fund, Vedomosti, Sberbank CIB Investment Research
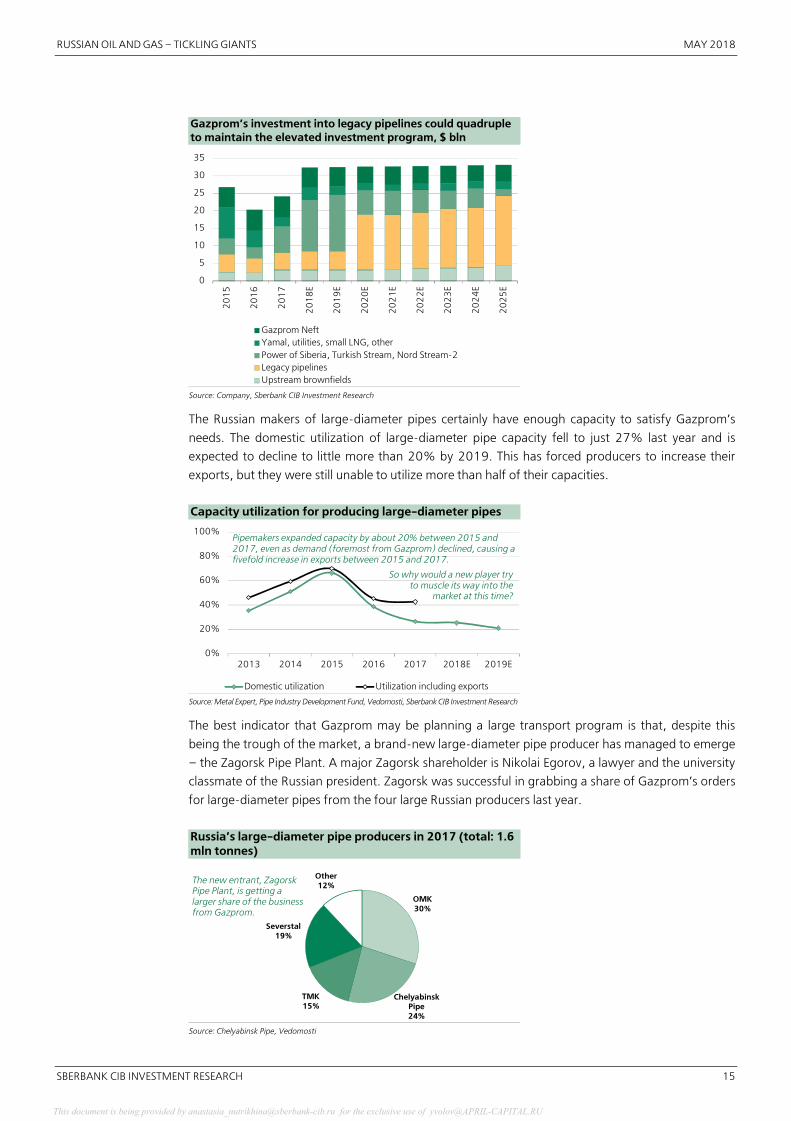
The best indicator that Gazprom may be planning a large transport program is that, despite this
being the trough of the market, a brand�new large�diameter pipe producer has managed to emerge
– the Zagorsk Pipe Plant. A major Zagorsk shareholder is Nikolai Egorov, a lawyer and the university
classmate of the Russian president. Zagorsk was successful in grabbing a share of Gazprom’s orders
for large�diameter pipes from the four large Russian producers last year.
Russia’s large�diameter pipe producers in 2017 (total: 1.6 mln tonnes)
OMK30%
Chelyabinsk Pipe24%
TMK15%
Severstal19%
Other12%
The new entrant, Zagorsk Pipe Plant, is getting a larger share of the business from Gazprom.
Source: Chelyabinsk Pipe, Vedomosti
This document is being provided by [email protected] for the exclusive use of [email protected] document is being provided by [email protected] for the exclusive use of [email protected]

MAY 2018 RUSSIAN OIL AND GAS – TICKLING GIANTS
16 SBERBANK CIB INVESTMENT RESEARCH
Experts cited in the newspaper Kommersant voiced concern about the new competitor arriving in an
already declining market. But it may be that, instead, Zagorsk’s entrance is a sign that the large�
diameter pipe market will soon get a major boost.
We have outlined so far that Gazprom’s focus seems to be heavily influenced by its domestic contractors,
more so than by pure profit�seeking on its own behalf. The projects that Gazprom has managed to forgo
also testify to this. Gazprom’s luckiest miss, cited by its top managers at one of the recent investor days,
was to have abandoned in time the Arctic offshore Shtokman project, which had aimed to deliver up to
33 mln tonnes of LNG to the US market just as the US was pivoting toward becoming a net exporter of
gas. We reckon that it was partners Total and Statoil who stayed Gazprom’s hand. But it is of note that
Gazprom’s main onshore contractors could not have profited much from the offshore project, which
would have required most of the equipment to be imported and would have been closely overseen by
foreign partners. The same logic might explain the delay in the investment decision for Baltic LNG, a
modest�sized liquefaction facility that Gazprom plans on building with Shell (but may in the end
construct anyway as part of a larger Baltic GPP program – see the discussion above).
Quantifying a dream
Let’s finish our discussion with a bit of a tease. What would Gazprom be worth in a blue�sky
scenario – if it were broken up into parts and these parts were to cease undertaking new projects?
The company basically consists of four businesses: brownfield upstream; a transportation arm;
Gazprom Neft, the crude oil producer and refiner; and, soon, the Power of Siberia, which is
physically separated from the rest of Gazprom’s network. Modeling these four parts separately gives
us a pretty close approximation of Gazprom’s reported operating earnings. There are also sundry
assets in power generation, local gas distribution, gas processing and trading, a finance arm and
even an airline – the underlying profitability of these assets is hard to derive but seems to be slightly
negative on the whole. Finally, there is a 9.9% stake in Novatek.
Gazprom’s 2016 EBITDA breakdown, $ bln
9.4
6.9
5.6
(0.4)
21.4
0
5
10
15
20
25
Legacyupstream
Legacypipeline
Gazprom Neft All other(implied)
ReportedEBITDA
Note: EBITDA presented ex�provisions (differs from the number in the financial table in the back).
Source: Company, Sberbank CIB Investment Research
Gazprom’s EBITDA split by 2025 (total: $49 bln)
Legacy upstream
47%
Legacy pipeline21%
Gazprom Neft20%
Power of Siberia
12%
Source: Sberbank CIB Investment Research
█ Upstream legacy. This business sells gas both for export and in the domestic market, and also
monetizes the associated condensate. If we look at it as a standalone entity, it would generate about
$18 bln of EBITDA this year, double that of the trough year of 2016 and representing over half of
Gazprom’s consolidated total. The business requires just $3 bln of annual capex to run (these numbers
align with Gazprom’s own disclosures). The cost of production comes to about $0.17 of capex to
generate $1 of EBITDA.
█ Pipeline business. Gazprom’s pipeline business can be modeled by assuming that as a
standalone entity it would get to charge Gazprom’s upstream business for gas transportation, just
as it currently charges the independent producers. Its main operating costs are materials (for
pipeline repairs), the technical gas it uses to power compressor stations and the cost of employing
some 120,000 staff. This business charges a ruble�based regulated tariff, and therefore its
This document is being provided by [email protected] for the exclusive use of [email protected] document is being provided by [email protected] for the exclusive use of [email protected]

RUSSIAN OIL AND GAS – TICKLING GIANTS MAY 2018
SBERBANK CIB INVESTMENT RESEARCH 17
profitability sustained a significant hit with the devaluation of the ruble in 2014�15. We estimate
that it made about $8.5 bln in EBITDA in 2017 (thanks to higher export volumes) but needs to
invest almost $5 bln per year to replace older pipelines. Thus, its derived NPV of below $25 bln is
less than a third of what we would have estimated before the ruble devaluation.
█ Gazprom Neft. This is of course a traded entity and boasts almost half of Gazprom’s entire market
cap, although we estimate it contributes less than a third to the group’s consolidated EBITDA.
Gazprom has accumulated a 96% stake in Gazprom Neft and refuses to place some of the shares in
the market to make the stock more liquid; Gazprom Neft’s free float is just $1 bln. The interesting
question is what Gazprom Neft would be worth with a proper free float of at least 15�20%, which
would make it a constituent in the leading equity indexes. We think it would be worth at least our
target price valuation, some 40% north of the current market share price (see the discussion in our
February 2018 report, “Six Easy Pieces”). The same cannot be said for Gazprom’s stake in Novatek,
the price of which should not be much affected were Gazprom to sell it to other holders.
█ Power of Siberia. This may be an NPV�negative project, but it will be worth more every year that
the development capex is sunk: we already forecast the NPV will rise to approximately zero in
2019. Still, most of the investment has yet to come, so we assign a negative value to it.
What Gazprom could be worth broken up, $ bln
160 185
52
24
31 4
(8)
(26)
133
0
50
100
150
200
250
Legacy upstreamNPV
Legacy pipelinesNPV
Gazprom Neft(target price)
Novatek stake(current MCap)
Major projectsNPV from 2018*
Net debt** Total value of thebusiness
Value that couldbe unlocked
Current marketcap
Broken up and not undertaking any new value�destructive projects, Gazprom would be worth about $8.35 per share, more than three times the current share price.
Note: We assume a 10% discount rate on the different parts of the business and a $65/bbl oil price.
* negative remaining NPV of Power of Siberia, Turkish Stream and Nord Stream�2
** net debt excluding Gazprom Neft’s net debt (already expressed in Gazprom Neft’s market equity value)
Source: Sberbank CIB Investment Research
Tying all this together with our 10% discount rate implies a break�up value of $185 bln, or $8.35 per
Gazprom share – over three times the price at which the shares trade today. In other words, the market is
discounting over $130 bln from the value of Gazprom’s future cash flows. We have already
demonstrated why it is doing that: the value�destructive investments are unlikely to abate. But if, by some
miracle, they were to stop, our estimate gives some idea of the true latent value of the company.
Today, the market values Gazprom Neft, Gazprom’s well�run liquids subsidiary, at almost as much
as it values Gazprom’s entire gas business. This is despite the fact that few institutional investors can
even buy Gazprom Neft’s stock due to its low free float. Such a situation demonstrates that the
blue�sky valuations outlined above are not unreasonable. The market will reward Gazprom if it sees
any movement in the right direction.
This document is being provided by [email protected] for the exclusive use of [email protected] document is being provided by [email protected] for the exclusive use of [email protected]

MAY 2018 RUSSIAN OIL AND GAS – TICKLING GIANTS
18 SBERBANK CIB INVESTMENT RESEARCH
Gazprom Neft is now almost more highly valued than Gazprom, despite being a much smaller company
0
20
40
60
80
100
120
Production Netrevenues
EBITDA Dividendpool
CurrentMCap
MCap atour TP
Inde
x, G
azp
rom
= 1
00
Gazprom excl. Gazprom Neft Gazprom Neft
Source: Companies, Bloomberg, Sberbank CIB Investment Research
If contractors continue to set Gazprom’s agenda, however, the company won’t be rewarded. We note,
however, that the government reshuffle, which is possible later this month, may well present the best
opportunity for the next six years to reorient Gazprom’s priorities. This is why we have retained a low�
conviction, speculative BUY on the stock – though we are not much hopeful of a change.
The well�run Gazprom Neft – despite its low free float and the fact that it is answerable to Gazprom – is valued much higher than its parent company.
This document is being provided by [email protected] for the exclusive use of [email protected] document is being provided by [email protected] for the exclusive use of [email protected]
RUSSIAN OIL AND GAS – TICKLING GIANTS MAY 2018
SBERBANK CIB INVESTMENT RESEARCH 19
Lukoil: Will They Walk the Walk?
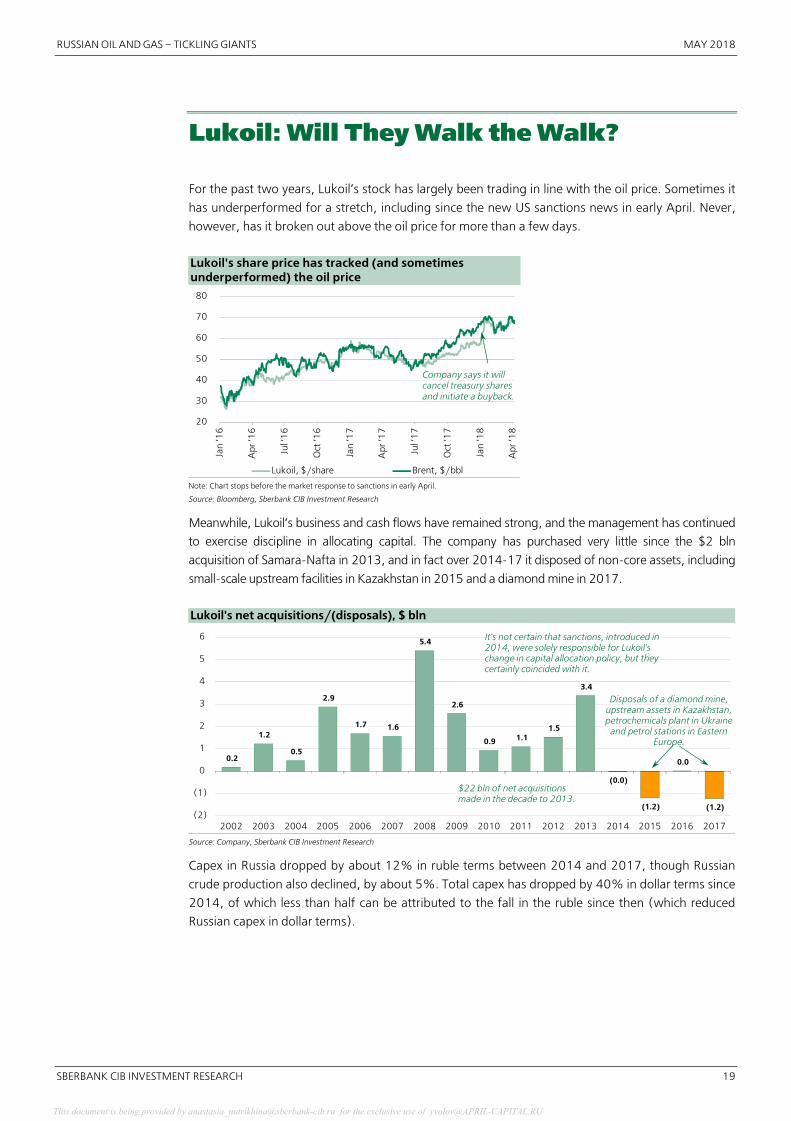
For the past two years, Lukoil’s stock has largely been trading in line with the oil price. Sometimes it
has underperformed for a stretch, including since the new US sanctions news in early April. Never,
however, has it broken out above the oil price for more than a few days.
Lukoil's share price has tracked (and sometimes underperformed) the oil price
20
30
40
50
60
70
80
Jan
’16
Apr
’16
Jul ’
16
Oct
’16
Jan
’17
Apr
’17
Jul ’
17
Oct
’17
Jan
’18
Apr
’18
Lukoil, $/share Brent, $/bbl
Company says it will cancel treasury shares and initiate a buyback.
Note: Chart stops before the market response to sanctions in early April.
Source: Bloomberg, Sberbank CIB Investment Research
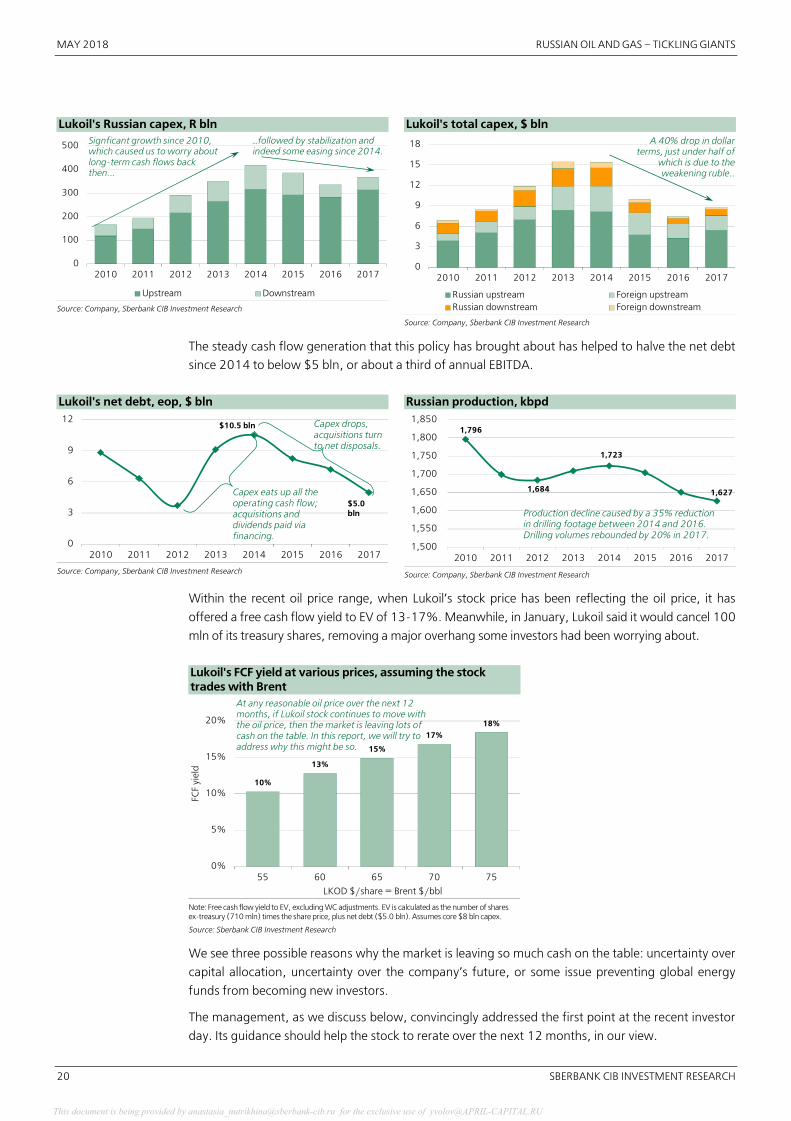
Meanwhile, Lukoil’s business and cash flows have remained strong, and the management has continued
to exercise discipline in allocating capital. The company has purchased very little since the $2 bln
acquisition of Samara�Nafta in 2013, and in fact over 2014�17 it disposed of non�core assets, including
small�scale upstream facilities in Kazakhstan in 2015 and a diamond mine in 2017.
Lukoil's net acquisitions/(disposals), $ bln
0.2
1.2
0.5
2.9
1.7 1.6
5.4
2.6
0.9 1.1 1.5
3.4
(0.0)
(1.2)
0.0
(1.2)(2)
(1)
0
1
2
3
4
5
6
2002 2003 2004 2005 2006 2007 2008 2009 2010 2011 2012 2013 2014 2015 2016 2017
Disposals of a diamond mine, upstream assets in Kazakhstan, petrochemicals plant in Ukraine
and petrol stations in Eastern Europe.
It's not certain that sanctions, introduced in 2014, were solely responsible for Lukoil's change in capital allocation policy, but they certainly coincided with it.
$22 bln of net acquisitions made in the decade to 2013.
Source: Company, Sberbank CIB Investment Research
Capex in Russia dropped by about 12% in ruble terms between 2014 and 2017, though Russian
crude production also declined, by about 5%. Total capex has dropped by 40% in dollar terms since
2014, of which less than half can be attributed to the fall in the ruble since then (which reduced
Russian capex in dollar terms).
This document is being provided by [email protected] for the exclusive use of [email protected] document is being provided by [email protected] for the exclusive use of [email protected]
MAY 2018 RUSSIAN OIL AND GAS – TICKLING GIANTS
20 SBERBANK CIB INVESTMENT RESEARCH
Lukoil's Russian capex, R bln
0
100
200
300
400
500
2010 2011 2012 2013 2014 2015 2016 2017
Upstream Downstream
Signficant growth since 2010, which caused us to worry about long�term cash flows back then...
…followed by stabilization and indeed some easing since 2014.
Source: Company, Sberbank CIB Investment Research
Lukoil's total capex, $ bln
0
3
6
9
12
15
18
2010 2011 2012 2013 2014 2015 2016 2017
Russian upstream Foreign upstreamRussian downstream Foreign downstream
A 40% drop in dollar terms, just under half of
which is due to the weakening ruble..
Source: Company, Sberbank CIB Investment Research
The steady cash flow generation that this policy has brought about has helped to halve the net debt
since 2014 to below $5 bln, or about a third of annual EBITDA.
Lukoil's net debt, eop, $ bln
0
3
6
9
12
2010 2011 2012 2013 2014 2015 2016 2017
$10.5 bln
$5.0 bln
Capex eats up all the operating cash flow; acquisitions and dividends paid via financing.
Capex drops, acquisitions turn to net disposals.
Source: Company, Sberbank CIB Investment Research
Russian production, kbpd
1,796
1,684
1,723
1,627
1,500
1,550
1,600
1,650
1,700
1,750
1,800
1,850
2010 2011 2012 2013 2014 2015 2016 2017
Production decline caused by a 35% reduction in drilling footage between 2014 and 2016. Drilling volumes rebounded by 20% in 2017.
Source: Company, Sberbank CIB Investment Research
Within the recent oil price range, when Lukoil’s stock price has been reflecting the oil price, it has
offered a free cash flow yield to EV of 13�17%. Meanwhile, in January, Lukoil said it would cancel 100
mln of its treasury shares, removing a major overhang some investors had been worrying about.
Lukoil's FCF yield at various prices, assuming the stock trades with Brent
10%
13%
15%
17%18%
0%
5%
10%
15%
20%
55 60 65 70 75
FCF
yiel
d
LKOD $/share = Brent $/bbl
At any reasonable oil price over the next 12 months, if Lukoil stock continues to move with the oil price, then the market is leaving lots of cash on the table. In this report, we will try to address why this might be so.
Note: Free cash flow yield to EV, excluding WC adjustments. EV is calculated as the number of shares ex�treasury (710 mln) times the share price, plus net debt ($5.0 bln). Assumes core $8 bln capex.
Source: Sberbank CIB Investment Research
We see three possible reasons why the market is leaving so much cash on the table: uncertainty over
capital allocation, uncertainty over the company’s future, or some issue preventing global energy
funds from becoming new investors.
The management, as we discuss below, convincingly addressed the first point at the recent investor
day. Its guidance should help the stock to rerate over the next 12 months, in our view.
This document is being provided by [email protected] for the exclusive use of [email protected] document is being provided by [email protected] for the exclusive use of [email protected]

RUSSIAN OIL AND GAS – TICKLING GIANTS MAY 2018
SBERBANK CIB INVESTMENT RESEARCH 21
If the stock doesn’t rerate, this could signal that the market does not yet fully believe the
management. Or it could mean that it is lending greater weight to some unspecified dangers lurking
for what is Russia’s largest remaining private company. We will address why that might be the case,
and to what extent it would be justified.
Finally, a problem of sentiment preventing energy funds from acquiring the name should be easier
for the company to address than concerns over who will control Lukoil in the future.
Putting its cards on the table
Lukoil has now outlined its capital allocation policy simply and clearly. Capex will be $8 bln per year
at an oil price of $50/bbl. The company will also increase the dividend in line with Russian inflation
at the very least (for 2017 the hike was 10%). It then promises to split the balance of cash flows
after capex and dividends equally between share buybacks on the open market and additional
investments. The buyback will total at least $3 bln over five years, though if the company sticks by
its promise, we expect it to be much higher.
Lukoil's new capital allocation policy in a nutshell
0
4
8
12
16
Operatingcash flow
Investmentsat $50/bbl
Freecash flow
Guaranteeddividend
Undistributedcash flow
$8 bln per year
We estimate about 10% pa growth, averaging $3 bln per
year in 2018�20.
50% share buybacks50% reinvestments –organic projects a priority
Source: Company
In 2018�20, we expect Lukoil to generate roughly $6 bln per year in free cash flow at a conservative
oil price assumption of $60/bbl and the $8 bln guided capex. Half of that will go to dividends,
which implies buybacks of up to $1.5 bln per year and additional investments of $1.5 bln.
The upshot is that three quarters of the free cash flow is planned to be distributed. Even if we
assume half of the additional $1.5 bln in annual capex is wasted, this would still imply that nearly
90% of the roughly 15% free cash flow yield generated by the company will find its way to
shareholders, most of it via distributions and some of it via investments that improve the company’s
ability to generate cash in the future. There is little here to suggest that shareholders should be
discounting this free cash flow so much as to demand a 15% yield.
This document is being provided by [email protected] for the exclusive use of [email protected] document is being provided by [email protected] for the exclusive use of [email protected]
MAY 2018 RUSSIAN OIL AND GAS – TICKLING GIANTS
22 SBERBANK CIB INVESTMENT RESEARCH
Lukoil's new capital allocation policy at $60/bbl oil price
$14 bln
$6 bln
$1.5 bln
$3 bln
$1.5 bln
0
2
4
6
8
10
12
14
16
Operatingcash flow
Baseinvestments
Freecash flow
Guaranteeddividend
Undistributedcash flow
Share buybacks
Windfall capex or select acquisitions
$8 bln
Total distributions: $4.5 bln pa (75% of FCF)
+Total investments: $9.5 bln per annum
Source: Company, Sberbank CIB Investment Research
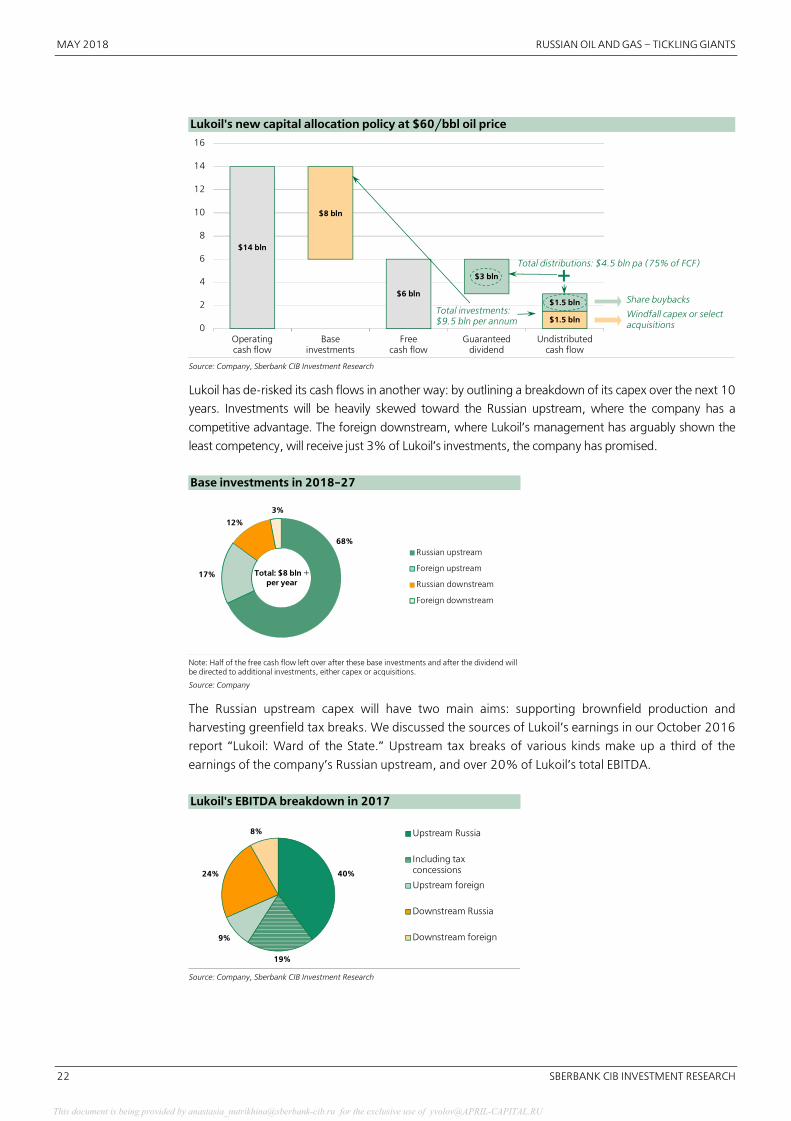
Lukoil has de�risked its cash flows in another way: by outlining a breakdown of its capex over the next 10
years. Investments will be heavily skewed toward the Russian upstream, where the company has a
competitive advantage. The foreign downstream, where Lukoil’s management has arguably shown the
least competency, will receive just 3% of Lukoil’s investments, the company has promised.
Base investments in 2018�27
68%
17%
12%
3%
Russian upstream
Foreign upstream
Russian downstream
Foreign downstream
Total: $8 bln +per year
Note: Half of the free cash flow left over after these base investments and after the dividend will be directed to additional investments, either capex or acquisitions.
Source: Company
The Russian upstream capex will have two main aims: supporting brownfield production and
harvesting greenfield tax breaks. We discussed the sources of Lukoil’s earnings in our October 2016
report “Lukoil: Ward of the State.” Upstream tax breaks of various kinds make up a third of the
earnings of the company’s Russian upstream, and over 20% of Lukoil’s total EBITDA.
Lukoil's EBITDA breakdown in 2017
40%
19%
9%
24%
8% Upstream Russia
Including taxconcessions
Upstream foreign
Downstream Russia
Downstream foreign
Source: Company, Sberbank CIB Investment Research
This document is being provided by [email protected] for the exclusive use of [email protected] document is being provided by [email protected] for the exclusive use of [email protected]
RUSSIAN OIL AND GAS – TICKLING GIANTS MAY 2018
SBERBANK CIB INVESTMENT RESEARCH 23
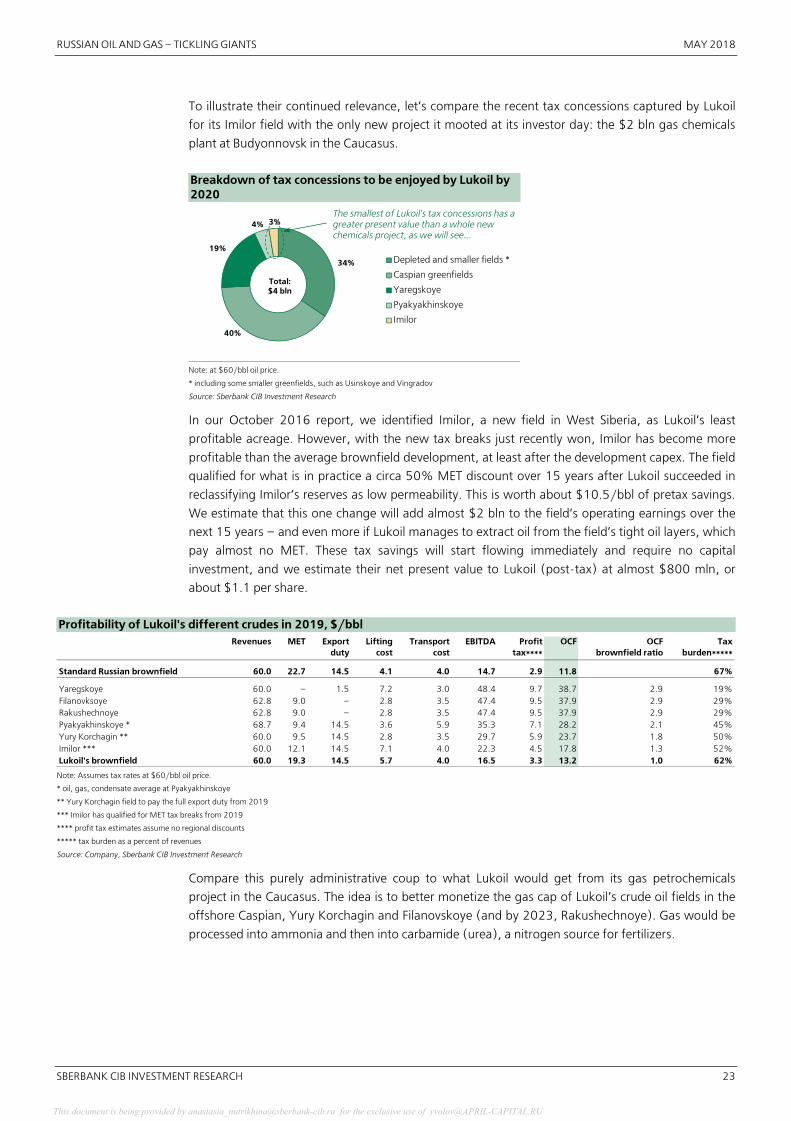
To illustrate their continued relevance, let’s compare the recent tax concessions captured by Lukoil
for its Imilor field with the only new project it mooted at its investor day: the $2 bln gas chemicals
plant at Budyonnovsk in the Caucasus.
Breakdown of tax concessions to be enjoyed by Lukoil by 2020
34%
40%
19%
4% 3%
Depleted and smaller fields *
Caspian greenfields
Yaregskoye
Pyakyakhinskoye
Imilor
Total: $4 bln
The smallest of Lukoil's tax concessions has a greater present value than a whole new chemicals project, as we will see….
Note: at $60/bbl oil price.
* including some smaller greenfields, such as Usinskoye and Vingradov
Source: Sberbank CIB Investment Research
In our October 2016 report, we identified Imilor, a new field in West Siberia, as Lukoil’s least
profitable acreage. However, with the new tax breaks just recently won, Imilor has become more
profitable than the average brownfield development, at least after the development capex. The field
qualified for what is in practice a circa 50% MET discount over 15 years after Lukoil succeeded in
reclassifying Imilor’s reserves as low permeability. This is worth about $10.5/bbl of pretax savings.
We estimate that this one change will add almost $2 bln to the field’s operating earnings over the
next 15 years – and even more if Lukoil manages to extract oil from the field’s tight oil layers, which
pay almost no MET. These tax savings will start flowing immediately and require no capital
investment, and we estimate their net present value to Lukoil (post�tax) at almost $800 mln, or
about $1.1 per share.
Profitability of Lukoil's different crudes in 2019, $/bbl
Revenues MET Export duty
Lifting cost
Transport cost
EBITDA Profit tax****
OCF OCF brownfield ratio
Tax burden*****
Standard Russian brownfield 60.0 22.7 14.5 4.1 4.0 14.7 2.9 11.8 67%
Yaregskoye 60.0 – 1.5 7.2 3.0 48.4 9.7 38.7 2.9 19%Filanovksoye 62.8 9.0 – 2.8 3.5 47.4 9.5 37.9 2.9 29%Rakushechnoye 62.8 9.0 – 2.8 3.5 47.4 9.5 37.9 2.9 29%Pyakyakhinskoye * 68.7 9.4 14.5 3.6 5.9 35.3 7.1 28.2 2.1 45%Yury Korchagin ** 60.0 9.5 14.5 2.8 3.5 29.7 5.9 23.7 1.8 50%Imilor *** 60.0 12.1 14.5 7.1 4.0 22.3 4.5 17.8 1.3 52%Lukoil's brownfield 60.0 19.3 14.5 5.7 4.0 16.5 3.3 13.2 1.0 62%
Note: Assumes tax rates at $60/bbl oil price.
* oil, gas, condensate average at Pyakyakhinskoye
** Yury Korchagin field to pay the full export duty from 2019
*** Imilor has qualified for MET tax breaks from 2019
**** profit tax estimates assume no regional discounts
***** tax burden as a percent of revenues
Source: Company, Sberbank CIB Investment Research
Compare this purely administrative coup to what Lukoil would get from its gas petrochemicals
project in the Caucasus. The idea is to better monetize the gas cap of Lukoil’s crude oil fields in the
offshore Caspian, Yury Korchagin and Filanovskoye (and by 2023, Rakushechnoye). Gas would be
processed into ammonia and then into carbamide (urea), a nitrogen source for fertilizers.
This document is being provided by [email protected] for the exclusive use of [email protected] document is being provided by [email protected] for the exclusive use of [email protected]
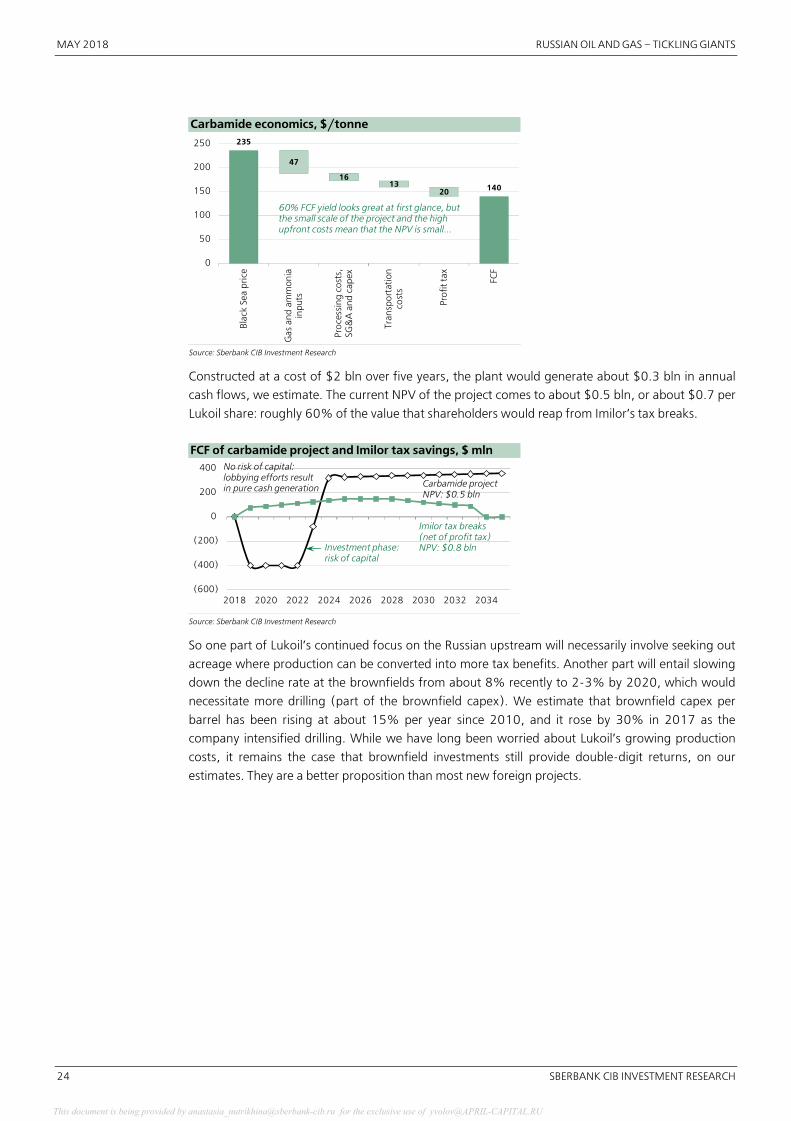
MAY 2018 RUSSIAN OIL AND GAS – TICKLING GIANTS
24 SBERBANK CIB INVESTMENT RESEARCH
Carbamide economics, $/tonne
235
140
47
1613
20
0
50
100
150
200
250
Bla
ck S
ea p
rice
Gas
and
am
mon
iain
puts
Proc
essi
ng c
osts
,SG
&A
and
cap
ex
Tran
spor
tatio
nco
sts
Prof
it ta
x
FCF
60% FCF yield looks great at first glance, but the small scale of the project and the high upfront costs mean that the NPV is small...
Source: Sberbank CIB Investment Research
Constructed at a cost of $2 bln over five years, the plant would generate about $0.3 bln in annual
cash flows, we estimate. The current NPV of the project comes to about $0.5 bln, or about $0.7 per
Lukoil share: roughly 60% of the value that shareholders would reap from Imilor’s tax breaks.
FCF of carbamide project and Imilor tax savings, $ mln
(600)
(400)
(200)
0
200
400
2018 2020 2022 2024 2026 2028 2030 2032 2034
Carbamide projectNPV: $0.5 bln
Imilor tax breaks (net of profit tax)NPV: $0.8 blnInvestment phase:
risk of capital
No risk of capital: lobbying efforts result in pure cash generation
Source: Sberbank CIB Investment Research
So one part of Lukoil’s continued focus on the Russian upstream will necessarily involve seeking out
acreage where production can be converted into more tax benefits. Another part will entail slowing
down the decline rate at the brownfields from about 8% recently to 2�3% by 2020, which would
necessitate more drilling (part of the brownfield capex). We estimate that brownfield capex per
barrel has been rising at about 15% per year since 2010, and it rose by 30% in 2017 as the
company intensified drilling. While we have long been worried about Lukoil’s growing production
costs, it remains the case that brownfield investments still provide double�digit returns, on our
estimates. They are a better proposition than most new foreign projects.
This document is being provided by [email protected] for the exclusive use of [email protected] document is being provided by [email protected] for the exclusive use of [email protected]

RUSSIAN OIL AND GAS – TICKLING GIANTS MAY 2018
SBERBANK CIB INVESTMENT RESEARCH 25
Lukoil’s development drilling, km
0
1,000
2,000
3,000
4,000
20
06
20
07
20
08
20
09
20
10
20
11
20
12
20
13
20
14
20
15
20
16
20
17
20
18
E2
01
9E
20
20
E
On the upswing again
Source: CDU TEK, Sberbank CIB Investment Research
Lukoil’s upstream brownfield cash costs, R/bbl
0
200
400
600
800
1,000
20
06
20
07
20
08
20
09
20
10
20
11
20
12
20
13
20
14
20
15
20
16
20
17
20
18
E2
01
9E
20
20
E
Brownfield capex Lifting costs
We assume growth to about $15/bbl from $13/bbl in 2017.
Note: Excluding Iraq.
Source: Company, Sberbank CIB Investment Research
Lukoil's Russian liquids output, kbpd
1,400
1,500
1,600
1,700
1,800
1,900
20
06
20
07
20
08
20
09
20
10
20
11
20
12
20
13
20
14
20
15
20
16
20
17
20
18
E2
01
9E
20
20
E
We expect a very slow recovery after this year �assuming drilling volumes increase.
Source: CDU TEK, Company, Sberbank CIB Investment Research
Lukoil plans to devote just 20% of its capex to foreign projects, and we think the bulk of that, at
least over the next three years, will continue to go to gas production in Uzbekistan. We might be
underestimating this opportunity: we calculate free cash flow to Lukoil averaging about $0.3 bln per
year from 2020, while Lukoil is guiding for about twice that much. However, our estimates are
based on the expectation that China (where most of the gas will soon be heading) will start driving
a harder bargain on Central Asian pricing in the future as it tries to bring the pipeline export netback
to the eastern seaboard roughly in line with that of the plentiful LNG. We discussed this in relation to
the Turkmenistan imports in our October 2017 report.
China gas import price by source in 2017, $/MMBtu
$5.0/MMBtuPrice at the border
8.1
$4/MMBtuTransportation within
China *
0
2
4
6
8
10
Uzbekistan LNG (average)
We believe the border price will drop to below $4/mmBtu to fall in line with our projections for an average LNG price of $7.5�8.0/mmBtu.
Premium of Uzbekistan netback to LNG import price.
* via the West�East Gas Pipeline to Shanghai.
Source: IHS CERA, Oxford Institute for Energy Studies, Sberbank CIB Investment Research
Elsewhere abroad, Lukoil has said it will seek out exploration projects but will be accompanied by
partners (for instance, by Chevron in West African exploration). We raised flags about Lukoil’s
questionable practices in its previous West African ventures in our October 2016 report. Being
chaperoned by partners should in theory prevent such practices in the future. Finally, the company
said that acquisitions would not be a priority. CFO Alexander Matytsyn said Lukoil has reduced its
appetite for risk.
Over the years, we have written several reports arguing that Lukoil’s stubbornly high FCF and
dividend yield were due to uncertainty about capital allocation. We urged the company to do
something about this – and now it has.
So if the stock fails to rerate, the answer as to why must be sought elsewhere. Below we offer
several suggestions on what might prevent it.
This document is being provided by [email protected] for the exclusive use of [email protected] document is being provided by [email protected] for the exclusive use of [email protected]
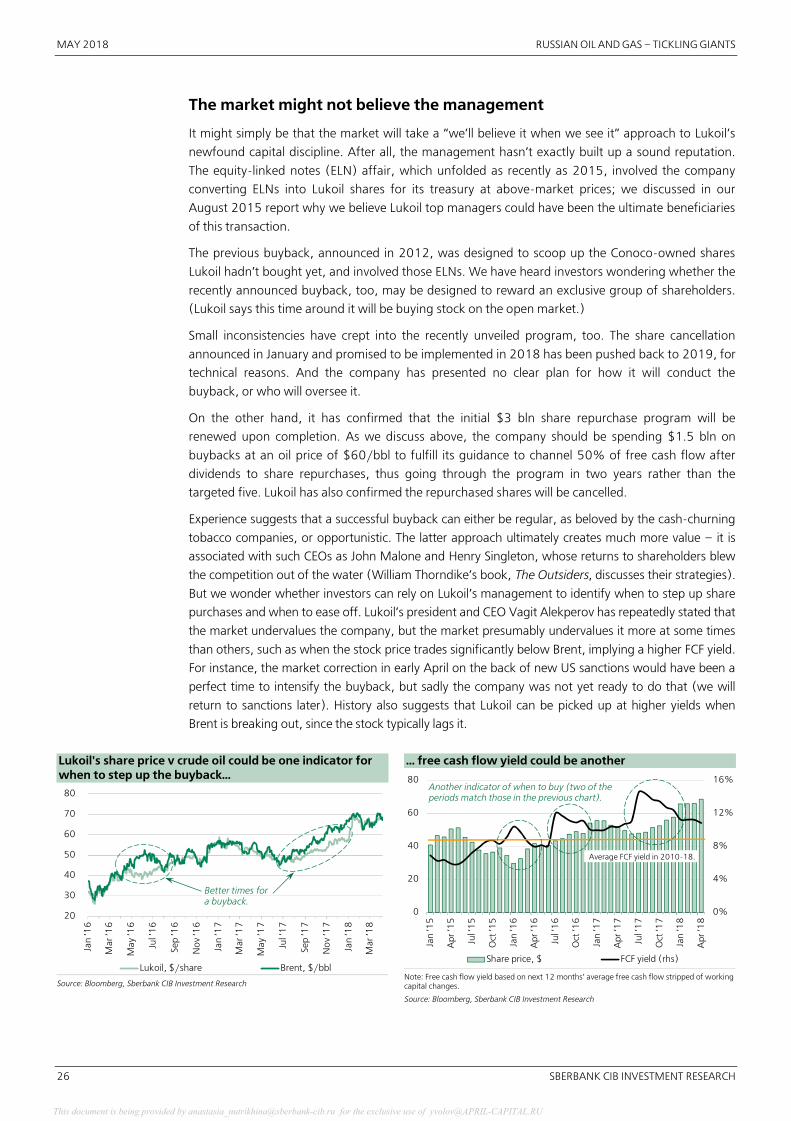
MAY 2018 RUSSIAN OIL AND GAS – TICKLING GIANTS
26 SBERBANK CIB INVESTMENT RESEARCH
The market might not believe the management
It might simply be that the market will take a “we’ll believe it when we see it” approach to Lukoil’s
newfound capital discipline. After all, the management hasn’t exactly built up a sound reputation.
The equity�linked notes (ELN) affair, which unfolded as recently as 2015, involved the company
converting ELNs into Lukoil shares for its treasury at above�market prices; we discussed in our
August 2015 report why we believe Lukoil top managers could have been the ultimate beneficiaries
of this transaction.
The previous buyback, announced in 2012, was designed to scoop up the Conoco�owned shares
Lukoil hadn’t bought yet, and involved those ELNs. We have heard investors wondering whether the
recently announced buyback, too, may be designed to reward an exclusive group of shareholders.
(Lukoil says this time around it will be buying stock on the open market.)
Small inconsistencies have crept into the recently unveiled program, too. The share cancellation
announced in January and promised to be implemented in 2018 has been pushed back to 2019, for
technical reasons. And the company has presented no clear plan for how it will conduct the
buyback, or who will oversee it.
On the other hand, it has confirmed that the initial $3 bln share repurchase program will be
renewed upon completion. As we discuss above, the company should be spending $1.5 bln on
buybacks at an oil price of $60/bbl to fulfill its guidance to channel 50% of free cash flow after
dividends to share repurchases, thus going through the program in two years rather than the
targeted five. Lukoil has also confirmed the repurchased shares will be cancelled.
Experience suggests that a successful buyback can either be regular, as beloved by the cash�churning
tobacco companies, or opportunistic. The latter approach ultimately creates much more value – it is
associated with such CEOs as John Malone and Henry Singleton, whose returns to shareholders blew
the competition out of the water (William Thorndike’s book, The Outsiders, discusses their strategies).
But we wonder whether investors can rely on Lukoil’s management to identify when to step up share
purchases and when to ease off. Lukoil’s president and CEO Vagit Alekperov has repeatedly stated that
the market undervalues the company, but the market presumably undervalues it more at some times
than others, such as when the stock price trades significantly below Brent, implying a higher FCF yield.
For instance, the market correction in early April on the back of new US sanctions would have been a
perfect time to intensify the buyback, but sadly the company was not yet ready to do that (we will
return to sanctions later). History also suggests that Lukoil can be picked up at higher yields when
Brent is breaking out, since the stock typically lags it.
Lukoil's share price v crude oil could be one indicator for when to step up the buyback…
20
30
40
50
60
70
80
Jan
’16
Mar
’16
May
’16
Jul ’
16
Sep
’16
Nov
’16
Jan
’17
Mar
’17
May
’17
Jul ’
17
Sep
’17
Nov
’17
Jan
’18
Mar
’18
Lukoil, $/share Brent, $/bbl
Better times for a buyback.
Source: Bloomberg, Sberbank CIB Investment Research
… free cash flow yield could be another
0%
4%
8%
12%
16%
0
20
40
60
80
Jan
’15
Apr
’15
Jul ’
15
Oct
’15
Jan
’16
Apr
’16
Jul ’
16
Oct
’16
Jan
’17
Apr
’17
Jul ’
17
Oct
’17
Jan
’18
Apr
’18
Share price, $ FCF yield (rhs)
Average FCF yield in 2010�18.
Another indicator of when to buy (two of the periods match those in the previous chart).
Note: Free cash flow yield based on next 12 months’ average free cash flow stripped of working capital changes.
Source: Bloomberg, Sberbank CIB Investment Research
This document is being provided by [email protected] for the exclusive use of [email protected] document is being provided by [email protected] for the exclusive use of [email protected]

RUSSIAN OIL AND GAS – TICKLING GIANTS MAY 2018
SBERBANK CIB INVESTMENT RESEARCH 27
If, as Alekperov said at the March investor day, the market has always undervalued the company,
year in and year out – and its average FCF yield of almost 9% in the past decade would seem to
confirm that – then isn’t it about time that Lukoil’s management reflect upon its role in this? The
CEO is an example of the curious phenomenon among the leaders of Russian energy companies:
they tend to perform the function of a chief operating officer (COO, or what goes under the
equivalent title of “president” in some companies), rather than the function of chief executive
officer. In other words, they spend their time actually running the company, often delving into the
minutiae of production and logistics instead of delegating that responsibility and devoting their
energy to thinking how to best allocate capital. Below we divide the top executives into broad
categories of perceived primary focus, based purely on our subjective assessment after more than a
decade following their companies. As becomes apparent, those leaders who focus on capital
allocation tend to outperform those who primarily direct their time to operations.
How have Russian energy executives performed for shareholders? Company Head Background Primary focus* Annual
TSR**RTS TR**
Relative performance
Note
Tatneft Nail Maganov Industry Capital allocation/operations
16% 1% 15% Significant dividend increase.
Novatek Leonid Mikhelson Industry (energy transportation)
Operations/capital allocation/governmentrelations
20% 8% 12% Focus on risk management in major projects.
Bashneft Alexander Korsik (former)
Foreign relations, finance
Capital allocation 7% �3% 10% Preparations for London listing.
Transneft Nikolai Tokarev Political appointee
Government relations
7% �1% 8% Much of free float captured by select investors.
Bashneft Andrey Shishkin (current)
Finance, government
Not clear 29% 22% 7% Preferred shares rallied from a low base.
Gazprom Neft Alexander Dyukov Political appointee/Sibur
Government relations
7% 1% 6% Good operating performance hampered by small free float.
Lukoil Vagit Alekperov Industry, government
Operations 18% 18% 0%
Rosneft Igor Sechin Political appointee
Operations/government relations
�1% 1% �2%
Surgutneftegaz Vladimir Bogdanov Industry Operations 16% 18% �2%
Gazprom Alexei Miller Political appointee
Not clear 11% 18% �7%
* determining the primary focus involves a subjective analysis based on press reports and our own assessment
** total annual dollar shareholder return (including dividends) during the tenure, since the company's IPO or since the start of this century if the IPO happened before 2001; RTS return based on the identical period.; current period ended March 31, 2018
Note: Returns based on the most liquid share class performance: common shares for Tatneft; simple average of common and preferred shares for Surgutneftegaz; common shares for Bashneft during Korsik's tenure; preferred shares for Bashneft during Shishkin's tenure.
Source: Companies, Bloomberg, Sberbank CIB Investment Research
It might take some time for Lukoil to generate investor confidence this time around. Specifically
outlining the rules or a schedule for share repurchases and subsequent share cancellation would
represent an important step forward, in our view.
The market might fear a change in control
Even if the company strengthens investor confidence in its new capital allocation program, the market
might continue demanding higher yield from the shares, fearing an eventual change of control.
Admittedly there is little that the management could do to address this point. However, Alekperov’s
decisions announced so far could lead to a worse outcome for minority shareholders, in our view.
Alekperov has reiterated several times now, most recently at the March investor day, that he has
bequeathed his shares in a trust to his family as part of a contingent legacy. Family members will be
unable to sell any part of the stake. Alekperov’s stake by then may well include Leonid Fedun’s 10%
share, too: Lukoil’s CEO has in the past stated that if Fedun ever decides to sell, he would be
required to sell to Alekperov.
This document is being provided by [email protected] for the exclusive use of [email protected] document is being provided by [email protected] for the exclusive use of [email protected]
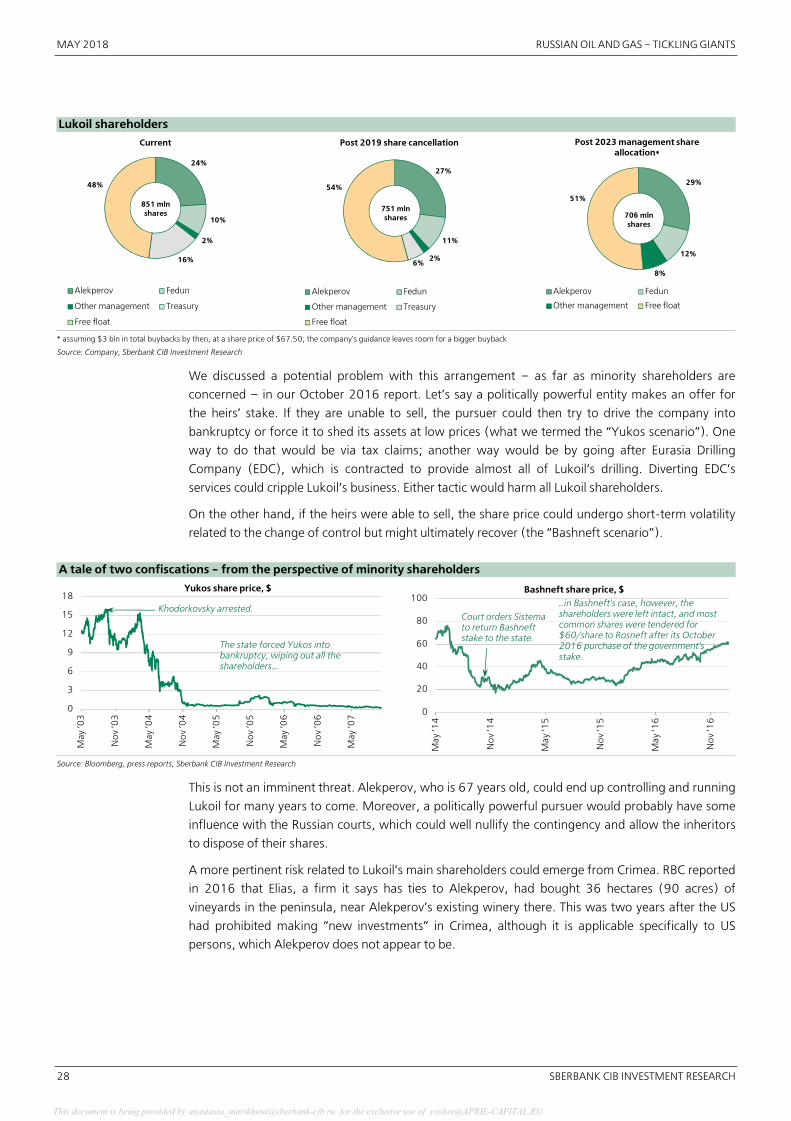
MAY 2018 RUSSIAN OIL AND GAS – TICKLING GIANTS
28 SBERBANK CIB INVESTMENT RESEARCH
Lukoil shareholders
24%
10%
2%
16%
48%
Current
Alekperov Fedun
Other management Treasury
Free float
851 mln shares
27%
11%
2%6%
54%
Post 2019 share cancellation
Alekperov Fedun
Other management Treasury
Free float
751 mln shares
29%
12%
8%
51%
Post 2023 management share allocation*
Alekperov Fedun
Other management Free float
706 mln shares
* assuming $3 bln in total buybacks by then, at a share price of $67.50; the company's guidance leaves room for a bigger buyback
Source: Company, Sberbank CIB Investment Research
We discussed a potential problem with this arrangement – as far as minority shareholders are
concerned – in our October 2016 report. Let’s say a politically powerful entity makes an offer for
the heirs’ stake. If they are unable to sell, the pursuer could then try to drive the company into
bankruptcy or force it to shed its assets at low prices (what we termed the “Yukos scenario”). One
way to do that would be via tax claims; another way would be by going after Eurasia Drilling
Company (EDC), which is contracted to provide almost all of Lukoil’s drilling. Diverting EDC’s
services could cripple Lukoil’s business. Either tactic would harm all Lukoil shareholders.
On the other hand, if the heirs were able to sell, the share price could undergo short�term volatility
related to the change of control but might ultimately recover (the “Bashneft scenario”).
A tale of two confiscations � from the perspective of minority shareholders
0
3
6
9
12
15
18
May
’03
No
v ’0
3
May
’04
No
v ’0
4
May
’05
No
v ’0
5
May
’06
No
v ’0
6
May
’07
Yukos share price, $
Khodorkovsky arrested.
The state forced Yukos into bankruptcy, wiping out all the shareholders….
0
20
40
60
80
100
May
’14
No
v ’1
4
May
’15
No
v ’1
5
May
’16
No
v ’1
6
Bashneft share price, $
Court orders Sistema to return Bashneft stake to the state.
…in Bashneft's case, however, the shareholders were left intact, and most common shares were tendered for $60/share to Rosneft after its October 2016 purchase of the government's stake.
Source: Bloomberg, press reports, Sberbank CIB Investment Research
This is not an imminent threat. Alekperov, who is 67 years old, could end up controlling and running
Lukoil for many years to come. Moreover, a politically powerful pursuer would probably have some
influence with the Russian courts, which could well nullify the contingency and allow the inheritors
to dispose of their shares.
A more pertinent risk related to Lukoil’s main shareholders could emerge from Crimea. RBC reported
in 2016 that Elias, a firm it says has ties to Alekperov, had bought 36 hectares (90 acres) of
vineyards in the peninsula, near Alekperov’s existing winery there. This was two years after the US
had prohibited making “new investments” in Crimea, although it is applicable specifically to US
persons, which Alekperov does not appear to be.
This document is being provided by [email protected] for the exclusive use of [email protected] document is being provided by [email protected] for the exclusive use of [email protected]

RUSSIAN OIL AND GAS – TICKLING GIANTS MAY 2018
SBERBANK CIB INVESTMENT RESEARCH 29
Crimean properties tied to Lukoil’s CEO
Simferopol
Feodosia
Gvardeyskoye
Судак
Алушта
Bakhchysarai
YaltaBalakleya
Sevastopol
Winery ChateauCotes de Saint Daniel
Nikita
Danilovka
vineyards
vineyards
E105
36.4 ha
Winery at which Alekperov has been developing the Chateau Cotes de Saint Daniel brand since 2005
Land bought at an auction in the beginning of 2016 by the company Elias, which is reportedly connected with Alekperov
Note: Ownership reported by RBC and not confirmed.
Source: RBC
Until recently, this transaction would have been of no concern to minority shareholders, as any
potential risk from it would have been confined to Alekperov and Elias. But on April 6, the US
Treasury Department for the first time announced that US persons must cease transacting in
securities in three companies controlled by Oleg Deripaska, a sanctioned person. If America’s
displeasure ever extends to Alekperov, it now has set a precedent for forcing its investors (which in
practice includes non�US funds catering to US investors) to dispose of Lukoil shares, because a case
could be made that Alekperov controls Lukoil in practice.
We have no way of assessing the likelihood of this. However, such a drastic step cannot be ruled out
precisely because US investors in practice own so few Lukoil shares, so the pain this would cause
them would be limited. Americans who do own Lukoil tend to hold it as emerging markets
exposure; Lukoil composes just 0.45% of the MSCI EM index.
The market might be starved of the marginal investor
Perhaps the key reason why Lukoil’s stock might find it hard to break out of parity with Brent is low
demand from big energy funds.
There are two basic mechanisms through which a stock price can go up. One involves relative
reallocations within a given space – say, the Russian energy sector. The pool of money doesn’t
change. So for Lukoil’s stock to go up, the stock price of Rosneft or another company would need to
come down (as investors holding the same amount of cash would need to sell down Rosneft to
afford paying more for Lukoil). As sector analysts, relative exposure and performance within the
sector is what we spend all of our time trying to advise and forecast.
In real life, however, a more powerful mechanism is at work: allocations to or from entire sectors,
geographies and asset classes represented through fund flows. This explains why over most time
periods, Lukoil and Rosneft shares tend to move in the same direction. Flows are the only way the
This document is being provided by [email protected] for the exclusive use of [email protected] document is being provided by [email protected] for the exclusive use of [email protected]

MAY 2018 RUSSIAN OIL AND GAS – TICKLING GIANTS
30 SBERBANK CIB INVESTMENT RESEARCH
sector as a whole can move up or down. It is then up to sector portfolio managers (or tracker funds)
to decide whether to buy or sell more of one stock or another as they receive inflows or face
outflows.
For Lukoil and other Russian energy companies, one particular problem appears to be the
unwillingness of global energy funds to buy their shares. These stocks are well represented in EM
indexes, but global energy funds have almost no exposure to them. As a result, stock prices
inordinately depend on flows to and from EM�oriented funds.
Lukoil's ownership among tracked global funds
64%
34%
2%
EM�oriented *
Global and factor�focused **
Energy�oriented ***
* focus on emerging markets, Eastern Europe or Russia
** international funds, typically non�biased, value�focused or dividend�focused
*** funds focused on energy, commodities or natural resource sectors
Note: Factset data tracks about 45% of Lukoil’s free float.
Source: FactSet, Sberbank CIB Investment Research
There are several reasons for this. The first and foremost is that most energy funds are specifically
focused on companies in developed markets, particularly in North America. Another is that some
shun Russia. Both of these restrictions will be hard for Lukoil to address. But the third reason is that
many energy PMs are not restricted from investing in Russia but don’t want to take exposure to
what has historically been a difficult market to cover. Assuming they don’t want to leave money on
the table either, the new capital allocation policy presents an opening for Lukoil to change minds.
The management could devote less time selling the company to EM funds and instead could reach
out to the folks they have never met before.
This document is being provided by [email protected] for the exclusive use of [email protected] document is being provided by [email protected] for the exclusive use of [email protected]
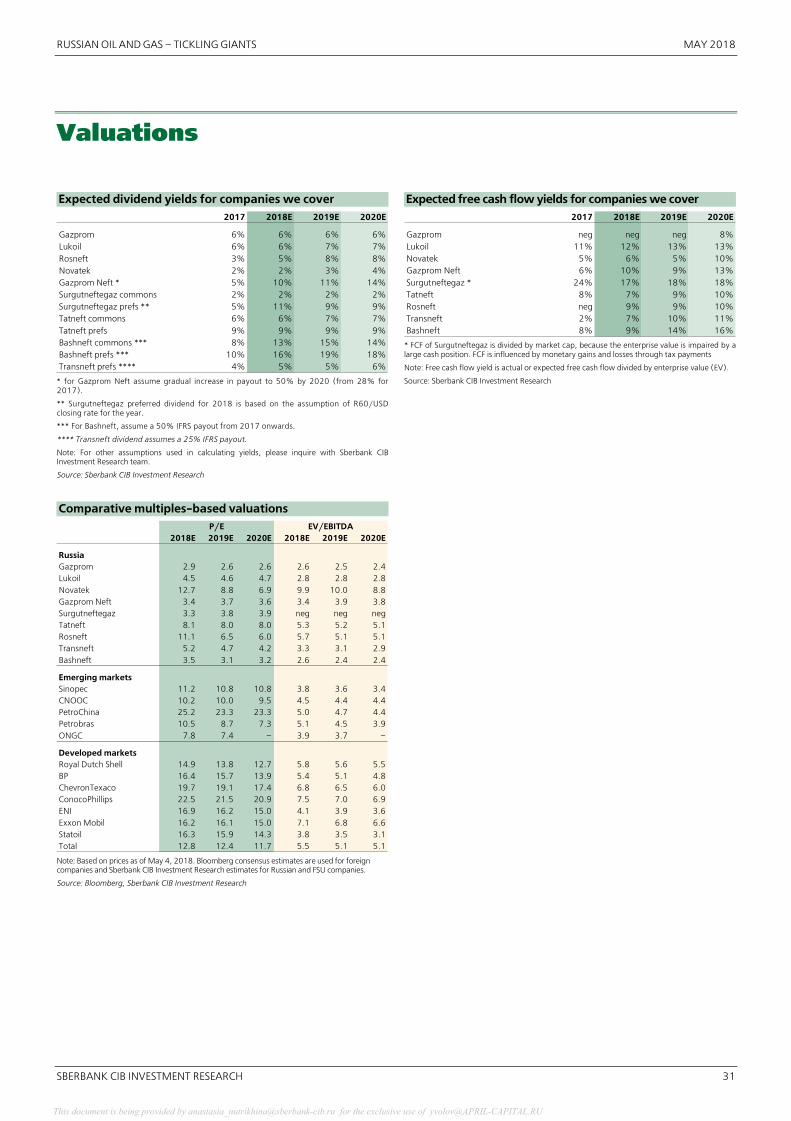
RUSSIAN OIL AND GAS – TICKLING GIANTS MAY 2018
SBERBANK CIB INVESTMENT RESEARCH 31
Valuations
Expected dividend yields for companies we cover
2017 2018E 2019E 2020E
Gazprom 6% 6% 6% 6%Lukoil 6% 6% 7% 7%Rosneft 3% 5% 8% 8%Novatek 2% 2% 3% 4%Gazprom Neft * 5% 10% 11% 14%Surgutneftegaz commons 2% 2% 2% 2%Surgutneftegaz prefs ** 5% 11% 9% 9%Tatneft commons 6% 6% 7% 7%Tatneft prefs 9% 9% 9% 9%Bashneft commons *** 8% 13% 15% 14%Bashneft prefs *** 10% 16% 19% 18%Transneft prefs **** 4% 5% 5% 6%
* for Gazprom Neft assume gradual increase in payout to 50% by 2020 (from 28% for2017).
** Surgutneftegaz preferred dividend for 2018 is based on the assumption of R60/USDclosing rate for the year.
*** For Bashneft, assume a 50% IFRS payout from 2017 onwards.
**** Transneft dividend assumes a 25% IFRS payout.
Note: For other assumptions used in calculating yields, please inquire with Sberbank CIBInvestment Research team.
Source: Sberbank CIB Investment Research
Expected free cash flow yields for companies we cover
2017 2018E 2019E 2020E
Gazprom neg neg neg 8%Lukoil 11% 12% 13% 13%Novatek 5% 6% 5% 10%Gazprom Neft 6% 10% 9% 13%Surgutneftegaz * 24% 17% 18% 18%Tatneft 8% 7% 9% 10%Rosneft neg 9% 9% 10%Transneft 2% 7% 10% 11%Bashneft 8% 9% 14% 16%
* FCF of Surgutneftegaz is divided by market cap, because the enterprise value is impaired by alarge cash position. FCF is influenced by monetary gains and losses through tax payments
Note: Free cash flow yield is actual or expected free cash flow divided by enterprise value (EV).
Source: Sberbank CIB Investment Research
Comparative multiples�based valuations
2018E 2019E 2020E 2018E 2019E 2020E
Russia Gazprom 2.9 2.6 2.6 2.6 2.5 2.4Lukoil 4.5 4.6 4.7 2.8 2.8 2.8Novatek 12.7 8.8 6.9 9.9 10.0 8.8Gazprom Neft 3.4 3.7 3.6 3.4 3.9 3.8Surgutneftegaz 3.3 3.8 3.9 neg neg negTatneft 8.1 8.0 8.0 5.3 5.2 5.1Rosneft 11.1 6.5 6.0 5.7 5.1 5.1Transneft 5.2 4.7 4.2 3.3 3.1 2.9Bashneft 3.5 3.1 3.2 2.6 2.4 2.4
Emerging marketsSinopec 11.2 10.8 10.8 3.8 3.6 3.4CNOOC 10.2 10.0 9.5 4.5 4.4 4.4PetroChina 25.2 23.3 23.3 5.0 4.7 4.4Petrobras 10.5 8.7 7.3 5.1 4.5 3.9ONGC 7.8 7.4 – 3.9 3.7 –
Developed marketsRoyal Dutch Shell 14.9 13.8 12.7 5.8 5.6 5.5BP 16.4 15.7 13.9 5.4 5.1 4.8ChevronTexaco 19.7 19.1 17.4 6.8 6.5 6.0ConocoPhillips 22.5 21.5 20.9 7.5 7.0 6.9ENI 16.9 16.2 15.0 4.1 3.9 3.6Exxon Mobil 16.2 16.1 15.0 7.1 6.8 6.6Statoil 16.3 15.9 14.3 3.8 3.5 3.1Total 12.8 12.4 11.7 5.5 5.1 5.1
P/E EV/EBITDA
Note: Based on prices as of May 4, 2018. Bloomberg consensus estimates are used for foreign companies and Sberbank CIB Investment Research estimates for Russian and FSU companies.
Source: Bloomberg, Sberbank CIB Investment Research
This document is being provided by [email protected] for the exclusive use of [email protected] document is being provided by [email protected] for the exclusive use of [email protected]
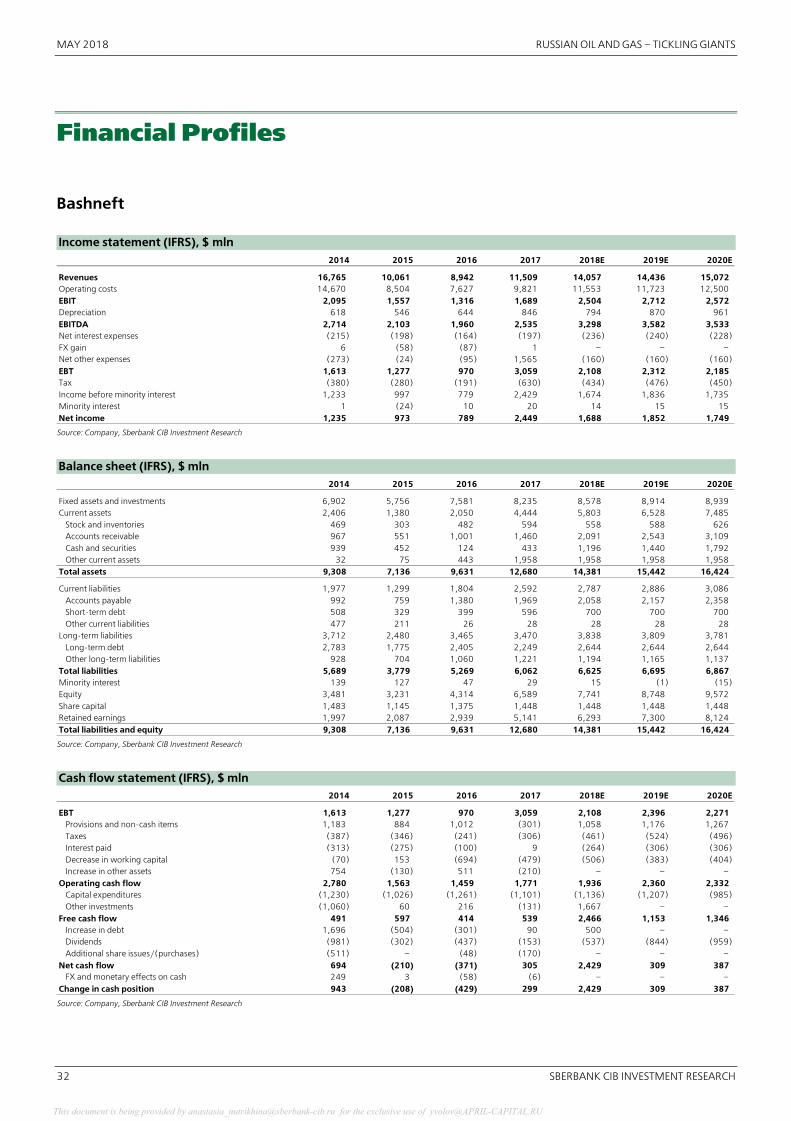
MAY 2018 RUSSIAN OIL AND GAS – TICKLING GIANTS
32 SBERBANK CIB INVESTMENT RESEARCH
Financial Profiles
Bashneft Income statement (IFRS), $ mln
2014 2015 2016 2017 2018E 2019E 2020E
Revenues 16,765 10,061 8,942 11,509 14,057 14,436 15,072Operating costs 14,670 8,504 7,627 9,821 11,553 11,723 12,500EBIT 2,095 1,557 1,316 1,689 2,504 2,712 2,572Depreciation 618 546 644 846 794 870 961EBITDA 2,714 2,103 1,960 2,535 3,298 3,582 3,533Net interest expenses (215) (198) (164) (197) (236) (240) (228)FX gain 6 (58) (87) 1 – – –Net other expenses (273) (24) (95) 1,565 (160) (160) (160)EBT 1,613 1,277 970 3,059 2,108 2,312 2,185Tax (380) (280) (191) (630) (434) (476) (450)Income before minority interest 1,233 997 779 2,429 1,674 1,836 1,735Minority interest 1 (24) 10 20 14 15 15Net income 1,235 973 789 2,449 1,688 1,852 1,749
Source: Company, Sberbank CIB Investment Research
Balance sheet (IFRS), $ mln
2014 2015 2016 2017 2018E 2019E 2020E
Fixed assets and investments 6,902 5,756 7,581 8,235 8,578 8,914 8,939Current assets 2,406 1,380 2,050 4,444 5,803 6,528 7,485
Stock and inventories 469 303 482 594 558 588 626Accounts receivable 967 551 1,001 1,460 2,091 2,543 3,109Cash and securities 939 452 124 433 1,196 1,440 1,792Other current assets 32 75 443 1,958 1,958 1,958 1,958
Total assets 9,308 7,136 9,631 12,680 14,381 15,442 16,424
Current liabilities 1,977 1,299 1,804 2,592 2,787 2,886 3,086Accounts payable 992 759 1,380 1,969 2,058 2,157 2,358Short�term debt 508 329 399 596 700 700 700Other current liabilities 477 211 26 28 28 28 28
Long�term liabilities 3,712 2,480 3,465 3,470 3,838 3,809 3,781Long�term debt 2,783 1,775 2,405 2,249 2,644 2,644 2,644Other long�term liabilities 928 704 1,060 1,221 1,194 1,165 1,137
Total liabilities 5,689 3,779 5,269 6,062 6,625 6,695 6,867Minority interest 139 127 47 29 15 (1) (15)Equity 3,481 3,231 4,314 6,589 7,741 8,748 9,572Share capital 1,483 1,145 1,375 1,448 1,448 1,448 1,448Retained earnings 1,997 2,087 2,939 5,141 6,293 7,300 8,124Total liabilities and equity 9,308 7,136 9,631 12,680 14,381 15,442 16,424
Source: Company, Sberbank CIB Investment Research
Cash flow statement (IFRS), $ mln
2014 2015 2016 2017 2018E 2019E 2020E
EBT 1,613 1,277 970 3,059 2,108 2,396 2,271Provisions and non�cash items 1,183 884 1,012 (301) 1,058 1,176 1,267Taxes (387) (346) (241) (306) (461) (524) (496)Interest paid (313) (275) (100) 9 (264) (306) (306)Decrease in working capital (70) 153 (694) (479) (506) (383) (404)Increase in other assets 754 (130) 511 (210) – – –
Operating cash flow 2,780 1,563 1,459 1,771 1,936 2,360 2,332Capital expenditures (1,230) (1,026) (1,261) (1,101) (1,136) (1,207) (985)Other investments (1,060) 60 216 (131) 1,667 – –
Free cash flow 491 597 414 539 2,466 1,153 1,346Increase in debt 1,696 (504) (301) 90 500 – –Dividends (981) (302) (437) (153) (537) (844) (959)Additional share issues/(purchases) (511) – (48) (170) – – –
Net cash flow 694 (210) (371) 305 2,429 309 387FX and monetary effects on cash 249 3 (58) (6) – – –
Change in cash position 943 (208) (429) 299 2,429 309 387 Source: Company, Sberbank CIB Investment Research
This document is being provided by [email protected] for the exclusive use of [email protected] document is being provided by [email protected] for the exclusive use of [email protected]
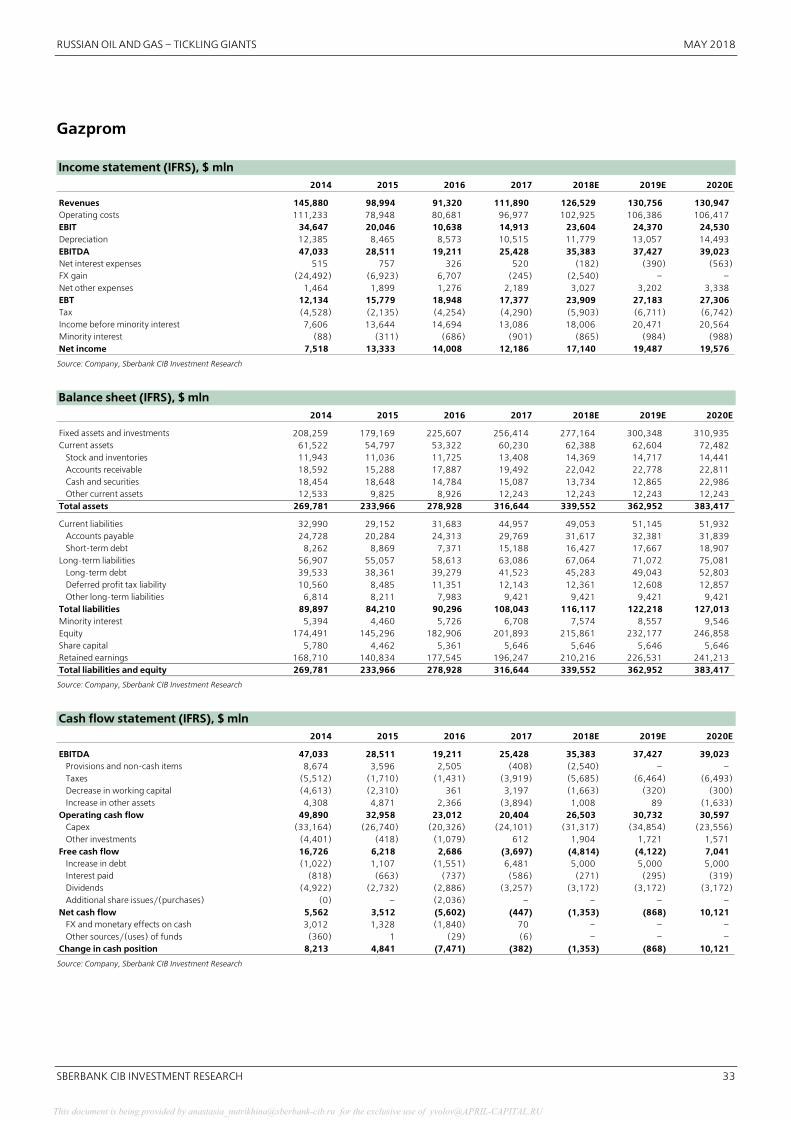
RUSSIAN OIL AND GAS – TICKLING GIANTS MAY 2018
SBERBANK CIB INVESTMENT RESEARCH 33
Gazprom Income statement (IFRS), $ mln
2014 2015 2016 2017 2018E 2019E 2020E
Revenues 145,880 98,994 91,320 111,890 126,529 130,756 130,947Operating costs 111,233 78,948 80,681 96,977 102,925 106,386 106,417EBIT 34,647 20,046 10,638 14,913 23,604 24,370 24,530Depreciation 12,385 8,465 8,573 10,515 11,779 13,057 14,493EBITDA 47,033 28,511 19,211 25,428 35,383 37,427 39,023Net interest expenses 515 757 326 520 (182) (390) (563)FX gain (24,492) (6,923) 6,707 (245) (2,540) – –Net other expenses 1,464 1,899 1,276 2,189 3,027 3,202 3,338EBT 12,134 15,779 18,948 17,377 23,909 27,183 27,306Tax (4,528) (2,135) (4,254) (4,290) (5,903) (6,711) (6,742)Income before minority interest 7,606 13,644 14,694 13,086 18,006 20,471 20,564Minority interest (88) (311) (686) (901) (865) (984) (988)Net income 7,518 13,333 14,008 12,186 17,140 19,487 19,576
Source: Company, Sberbank CIB Investment Research
Balance sheet (IFRS), $ mln
2014 2015 2016 2017 2018E 2019E 2020E
Fixed assets and investments 208,259 179,169 225,607 256,414 277,164 300,348 310,935 Current assets 61,522 54,797 53,322 60,230 62,388 62,604 72,482
Stock and inventories 11,943 11,036 11,725 13,408 14,369 14,717 14,441 Accounts receivable 18,592 15,288 17,887 19,492 22,042 22,778 22,811 Cash and securities 18,454 18,648 14,784 15,087 13,734 12,865 22,986 Other current assets 12,533 9,825 8,926 12,243 12,243 12,243 12,243
Total assets 269,781 233,966 278,928 316,644 339,552 362,952 383,417
Current liabilities 32,990 29,152 31,683 44,957 49,053 51,145 51,932 Accounts payable 24,728 20,284 24,313 29,769 31,617 32,381 31,839 Short�term debt 8,262 8,869 7,371 15,188 16,427 17,667 18,907
Long�term liabilities 56,907 55,057 58,613 63,086 67,064 71,072 75,081 Long�term debt 39,533 38,361 39,279 41,523 45,283 49,043 52,803 Deferred profit tax liability 10,560 8,485 11,351 12,143 12,361 12,608 12,857 Other long�term liabilities 6,814 8,211 7,983 9,421 9,421 9,421 9,421
Total liabilities 89,897 84,210 90,296 108,043 116,117 122,218 127,013 Minority interest 5,394 4,460 5,726 6,708 7,574 8,557 9,546 Equity 174,491 145,296 182,906 201,893 215,861 232,177 246,858 Share capital 5,780 4,462 5,361 5,646 5,646 5,646 5,646 Retained earnings 168,710 140,834 177,545 196,247 210,216 226,531 241,213 Total liabilities and equity 269,781 233,966 278,928 316,644 339,552 362,952 383,417
Source: Company, Sberbank CIB Investment Research
Cash flow statement (IFRS), $ mln
2014 2015 2016 2017 2018E 2019E 2020E
EBITDA 47,033 28,511 19,211 25,428 35,383 37,427 39,023Provisions and non�cash items 8,674 3,596 2,505 (408) (2,540) – –Taxes (5,512) (1,710) (1,431) (3,919) (5,685) (6,464) (6,493)Decrease in working capital (4,613) (2,310) 361 3,197 (1,663) (320) (300)Increase in other assets 4,308 4,871 2,366 (3,894) 1,008 89 (1,633)
Operating cash flow 49,890 32,958 23,012 20,404 26,503 30,732 30,597Capex (33,164) (26,740) (20,326) (24,101) (31,317) (34,854) (23,556)Other investments (4,401) (418) (1,079) 612 1,904 1,721 1,571
Free cash flow 16,726 6,218 2,686 (3,697) (4,814) (4,122) 7,041Increase in debt (1,022) 1,107 (1,551) 6,481 5,000 5,000 5,000Interest paid (818) (663) (737) (586) (271) (295) (319)Dividends (4,922) (2,732) (2,886) (3,257) (3,172) (3,172) (3,172)Additional share issues/(purchases) (0) – (2,036) – – – –
Net cash flow 5,562 3,512 (5,602) (447) (1,353) (868) 10,121FX and monetary effects on cash 3,012 1,328 (1,840) 70 – – –Other sources/(uses) of funds (360) 1 (29) (6) – – –
Change in cash position 8,213 4,841 (7,471) (382) (1,353) (868) 10,121
Source: Company, Sberbank CIB Investment Research
This document is being provided by [email protected] for the exclusive use of [email protected] document is being provided by [email protected] for the exclusive use of [email protected]
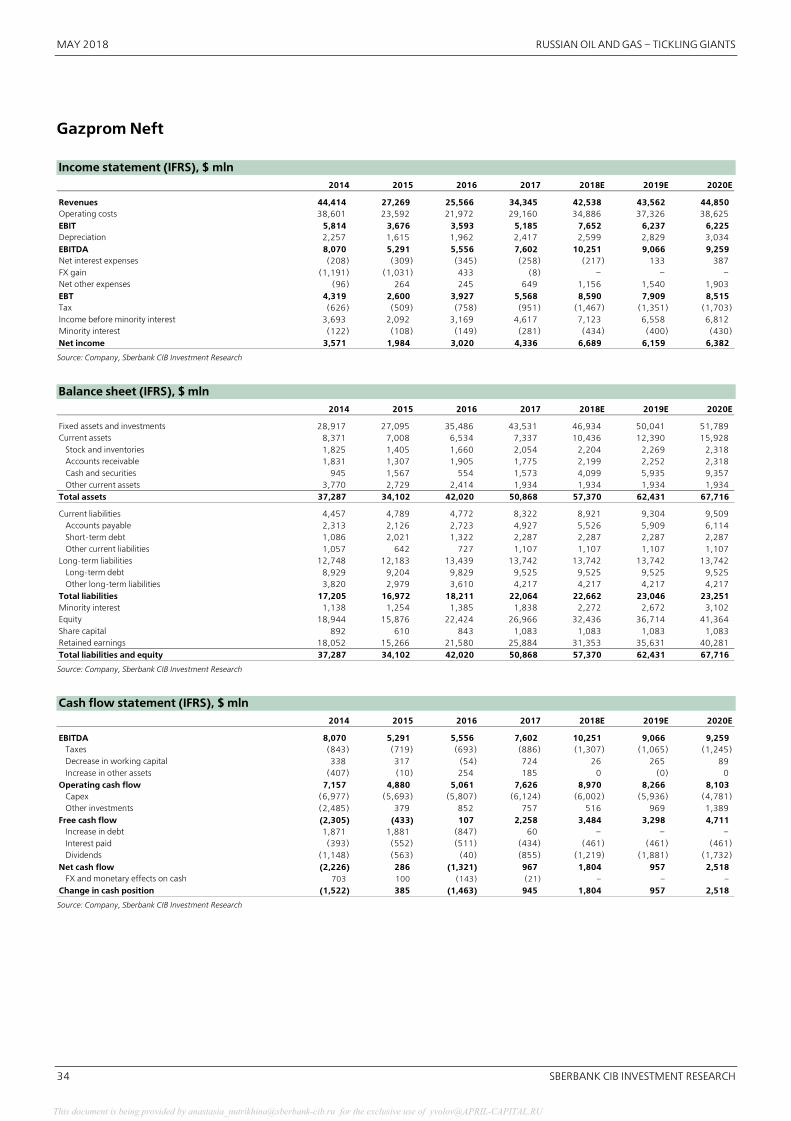
MAY 2018 RUSSIAN OIL AND GAS – TICKLING GIANTS
34 SBERBANK CIB INVESTMENT RESEARCH
Gazprom Neft Income statement (IFRS), $ mln
2014 2015 2016 2017 2018E 2019E 2020E
Revenues 44,414 27,269 25,566 34,345 42,538 43,562 44,850Operating costs 38,601 23,592 21,972 29,160 34,886 37,326 38,625EBIT 5,814 3,676 3,593 5,185 7,652 6,237 6,225Depreciation 2,257 1,615 1,962 2,417 2,599 2,829 3,034EBITDA 8,070 5,291 5,556 7,602 10,251 9,066 9,259Net interest expenses (208) (309) (345) (258) (217) 133 387FX gain (1,191) (1,031) 433 (8) – – –Net other expenses (96) 264 245 649 1,156 1,540 1,903EBT 4,319 2,600 3,927 5,568 8,590 7,909 8,515Tax (626) (509) (758) (951) (1,467) (1,351) (1,703)Income before minority interest 3,693 2,092 3,169 4,617 7,123 6,558 6,812Minority interest (122) (108) (149) (281) (434) (400) (430)Net income 3,571 1,984 3,020 4,336 6,689 6,159 6,382
Source: Company, Sberbank CIB Investment Research
Balance sheet (IFRS), $ mln
2014 2015 2016 2017 2018E 2019E 2020E
Fixed assets and investments 28,917 27,095 35,486 43,531 46,934 50,041 51,789Current assets 8,371 7,008 6,534 7,337 10,436 12,390 15,928
Stock and inventories 1,825 1,405 1,660 2,054 2,204 2,269 2,318Accounts receivable 1,831 1,307 1,905 1,775 2,199 2,252 2,318Cash and securities 945 1,567 554 1,573 4,099 5,935 9,357Other current assets 3,770 2,729 2,414 1,934 1,934 1,934 1,934
Total assets 37,287 34,102 42,020 50,868 57,370 62,431 67,716
Current liabilities 4,457 4,789 4,772 8,322 8,921 9,304 9,509Accounts payable 2,313 2,126 2,723 4,927 5,526 5,909 6,114Short�term debt 1,086 2,021 1,322 2,287 2,287 2,287 2,287Other current liabilities 1,057 642 727 1,107 1,107 1,107 1,107
Long�term liabilities 12,748 12,183 13,439 13,742 13,742 13,742 13,742Long�term debt 8,929 9,204 9,829 9,525 9,525 9,525 9,525Other long�term liabilities 3,820 2,979 3,610 4,217 4,217 4,217 4,217
Total liabilities 17,205 16,972 18,211 22,064 22,662 23,046 23,251Minority interest 1,138 1,254 1,385 1,838 2,272 2,672 3,102Equity 18,944 15,876 22,424 26,966 32,436 36,714 41,364Share capital 892 610 843 1,083 1,083 1,083 1,083Retained earnings 18,052 15,266 21,580 25,884 31,353 35,631 40,281Total liabilities and equity 37,287 34,102 42,020 50,868 57,370 62,431 67,716
Source: Company, Sberbank CIB Investment Research
Cash flow statement (IFRS), $ mln
2014 2015 2016 2017 2018E 2019E 2020E
EBITDA 8,070 5,291 5,556 7,602 10,251 9,066 9,259Taxes (843) (719) (693) (886) (1,307) (1,065) (1,245)Decrease in working capital 338 317 (54) 724 26 265 89Increase in other assets (407) (10) 254 185 0 (0) 0
Operating cash flow 7,157 4,880 5,061 7,626 8,970 8,266 8,103Capex (6,977) (5,693) (5,807) (6,124) (6,002) (5,936) (4,781)Other investments (2,485) 379 852 757 516 969 1,389
Free cash flow (2,305) (433) 107 2,258 3,484 3,298 4,711Increase in debt 1,871 1,881 (847) 60 – – –Interest paid (393) (552) (511) (434) (461) (461) (461)Dividends (1,148) (563) (40) (855) (1,219) (1,881) (1,732)
Net cash flow (2,226) 286 (1,321) 967 1,804 957 2,518FX and monetary effects on cash 703 100 (143) (21) – – –
Change in cash position (1,522) 385 (1,463) 945 1,804 957 2,518
Source: Company, Sberbank CIB Investment Research
This document is being provided by [email protected] for the exclusive use of [email protected] document is being provided by [email protected] for the exclusive use of [email protected]

RUSSIAN OIL AND GAS – TICKLING GIANTS MAY 2018
SBERBANK CIB INVESTMENT RESEARCH 35
Lukoil Income statement (IFRS), $ mln
2014 2015 2016 2017 2018E 2019E 2020E
Revenues 144,167 94,816 78,652 101,752 121,761 122,126 122,781Operating costs 137,041 87,333 72,379 93,080 108,974 109,552 110,560EBIT 7,126 7,483 6,273 8,672 12,788 12,574 12,221Depreciation 8,816 5,943 4,661 5,574 5,575 5,919 6,330Impairment 1,753 – – – – – –EBITDA 17,695 13,426 10,933 14,246 18,363 18,494 18,551Net interest expenses (362) (491) (488) (209) (280) (198) (110)FX gain (355) 1,637 (1,642) (327) 74 – –Net other expenses 363 (2,386) (36) 870 351 351 345EBT 6,772 6,243 4,107 9,006 12,933 12,727 12,456Tax (2,058) (1,550) (981) (1,781) (2,587) (2,545) (2,491)Income before minority interest 4,714 4,693 3,126 7,225 10,346 10,182 9,965Minority interest 32 (27) (13) (28) (57) (56) (55)Net income 4,746 4,667 3,113 7,197 10,289 10,125 9,909
Source: Company, Sberbank CIB Investment Research
Balance sheet (IFRS), $ mln
2014 2015 2016 2017 2018E 2019E 2020E
Fixed assets and investments 89,041 52,234 61,972 68,022 72,035 75,661 78,842Current assets 22,759 16,652 20,701 22,710 26,546 30,353 34,051
Stock and inventories 6,154 4,668 6,665 6,913 7,114 7,372 7,609Accounts receivable 11,387 6,044 5,950 7,262 7,673 7,696 7,737Cash and securities 3,004 3,530 4,309 5,736 9,029 12,555 15,975Other current assets 2,214 2,411 3,777 2,800 2,731 2,731 2,731
Total assets 111,800 68,886 82,673 90,733 98,582 106,015 112,893
Current liabilities 14,212 9,538 13,695 16,647 16,956 17,341 17,694Accounts payable 8,538 6,576 10,637 11,779 12,413 12,797 13,151Short�term debt 2,168 830 963 2,235 1,910 1,910 1,910Deferred taxes and provisions 3,506 2,132 2,095 2,633 2,633 2,633 2,633
Long�term liabilities 16,236 15,011 15,766 13,489 13,537 13,537 13,537Long�term debt 11,361 10,966 10,554 8,466 8,466 8,466 8,466Other long�term liabilities 4,875 4,046 5,212 5,023 5,071 5,071 5,071
Total liabilities 30,448 24,549 29,461 30,136 30,493 30,878 31,231Minority interest 222 122 112 129 129 129 129Equity 81,130 44,214 53,100 60,468 67,959 75,008 81,533Share capital 4,539 1,791 2,154 2,271 2,271 2,271 2,271Retained earnings 76,591 42,423 50,946 58,197 65,689 72,737 79,262Total liabilities and equity 111,800 68,886 82,673 90,733 98,582 106,015 112,893
Source: Company, Sberbank CIB Investment Research
Cash flow statement (IFRS), $ mln
2014 2015 2016 2017 2018E 2019E 2020E
EBITDA 17,695 13,426 10,933 14,246 18,363 18,494 18,551Provisions and non�cash items (1,761) 1,519 1,386 1,357 436 456 557Taxes (2,300) (1,509) (1,069) (1,514) (2,539) (2,545) (2,491)Interest paid (565) (675) (742) (666) (487) (487) (487)Decrease in working capital (370) 2,013 1,865 (745) 22 103 75Increase in other assets 2,869 (1,037) (1,044) 336 111 351 345
Operating cash flow 15,568 13,736 11,330 13,013 15,907 16,371 16,550Capex (14,545) (9,909) (7,456) (8,770) (9,817) (9,768) (9,745)Other investments (98) 1,230 (22) 1,368 – – –
Free cash flow 925 5,057 3,853 5,611 6,090 6,603 6,804Increase in debt 2,524 (1,507) (446) (1,003) – – –Dividends (1,357) (1,778) (1,876) (2,359) (2,797) (3,077) (3,385)Additional share issues/(purchases) (107) (710) (825) (880) – – –
Net cash flow 1,985 1,064 707 1,369 3,293 3,526 3,420FX and monetary effects on cash (693) (538) 72 58 – – –
Change in cash position 1,292 526 779 1,427 3,293 3,526 3,420
Source: Company, Sberbank CIB Investment Research
This document is being provided by [email protected] for the exclusive use of [email protected] document is being provided by [email protected] for the exclusive use of [email protected]

MAY 2018 RUSSIAN OIL AND GAS – TICKLING GIANTS
36 SBERBANK CIB INVESTMENT RESEARCH
Novatek Income statement (IFRS), $ mln
2014 2015 2016 2017 2018E 2019E 2020E
Revenues 9,388 7,791 8,053 9,995 10,808 10,822 11,830Operating costs 6,051 5,499 5,780 7,189 7,526 7,575 8,074EBIT 3,337 2,292 2,272 2,806 3,282 3,247 3,756Depreciation 450 327 521 592 652 652 652EBITDA 3,788 2,619 2,793 3,398 3,934 3,899 4,407Net interest expenses (21) 63 108 140 138 135 135FX gain (599) (147) (402) 238 (98) – –Net other expenses (1,071) (607) 1,532 245 393 1,660 2,339EBT 1,721 1,613 4,491 3,429 3,714 5,043 6,230Tax (460) (317) (620) (590) (615) (627) (721)Income before minority interest 1,261 1,295 3,871 2,839 3,099 4,416 5,510Minority interest 9 7 (109) (173) (188) (185) (159)Net income 1,271 1,302 3,761 2,666 2,911 4,231 5,351
Note: Novatek’s income and cash flow statements now incorporate its share in Yamal LNG.
Source: Company, Sberbank CIB Investment Research
Balance sheet (IFRS), $ mln
2014 2015 2016 2017 2018E 2019E 2020E
Fixed assets and investments 10,177 10,312 13,701 15,464 16,317 18,736 20,073Current assets 2,250 1,763 2,189 2,664 4,317 5,408 8,322
Stock and inventories 125 113 149 192 229 231 236Accounts receivable 615 515 686 773 835 837 914Cash and securities 734 400 796 1,145 2,698 3,786 6,617Other current assets 776 734 558 554 554 554 554
Total assets 12,427 12,075 15,890 18,128 20,634 24,143 28,395
Current liabilities 1,443 2,328 1,794 1,458 1,538 1,556 1,594Accounts payable 544 666 634 851 949 969 981Short�term debt 728 1,463 914 248 248 248 248Deferred taxes and provisions 172 199 245 332 341 338 364
Long�term liabilities 4,103 3,872 3,253 3,204 3,286 3,265 3,239Long�term debt 3,639 3,458 2,659 2,456 2,554 2,554 2,554Other long�term liabilities 464 413 594 748 733 711 685
Total liabilities 5,546 6,200 5,047 4,661 4,825 4,821 4,833Minority interest 42 29 154 309 497 683 841Equity 6,839 5,846 10,689 13,157 15,311 18,639 22,721Share capital 470 353 408 405 405 405 405Retained earnings 6,369 5,494 10,280 12,752 14,906 18,234 22,316Total liabilities and equity 12,427 12,075 15,890 18,128 20,634 24,143 28,395
Source: Company, Sberbank CIB Investment Research
Cash flow statement (IFRS), $ mln
2014 2015 2016 2017 2018E 2019E 2020E
EBITDA 3,788 2,619 2,793 3,398 3,934 3,899 4,407Taxes (694) (270) (423) (559) (631) (648) (747)Decrease in working capital 66 (84) 217 88 7 15 (45)
Operating cash flow 3,160 2,266 2,587 2,927 3,310 3,266 3,615Capex (1,608) (826) (514) (512) (1,065) (1,869) (911)Other investments 377 (1,748) 721 (385) 124 458 1,261
Free cash flow 1,930 (308) 2,794 2,030 2,369 1,856 3,965 Increase/(decrease) in debt 13 919 (1,533) (913) – – –Dividends (751) (582) (622) (721) (757) (903) (1,269)Additional share issues/(purchases) (72) (13) (14) (25) – – –
Net cash flow 1,120 16 625 371 1,613 953 2,696FX and monetary effects on cash 376 22 (147) (11) – – –Other sources/(uses) of funds (81) (142) (302) (72) (60) 135 135
Change in cash position 1,414 (103) 176 288 1,553 1,088 2,831 Note: Novatek’s income and cash flow statements now incorporate its share in Yamal LNG.
Source: Company, Sberbank CIB Investment Research
This document is being provided by [email protected] for the exclusive use of [email protected] document is being provided by [email protected] for the exclusive use of [email protected]
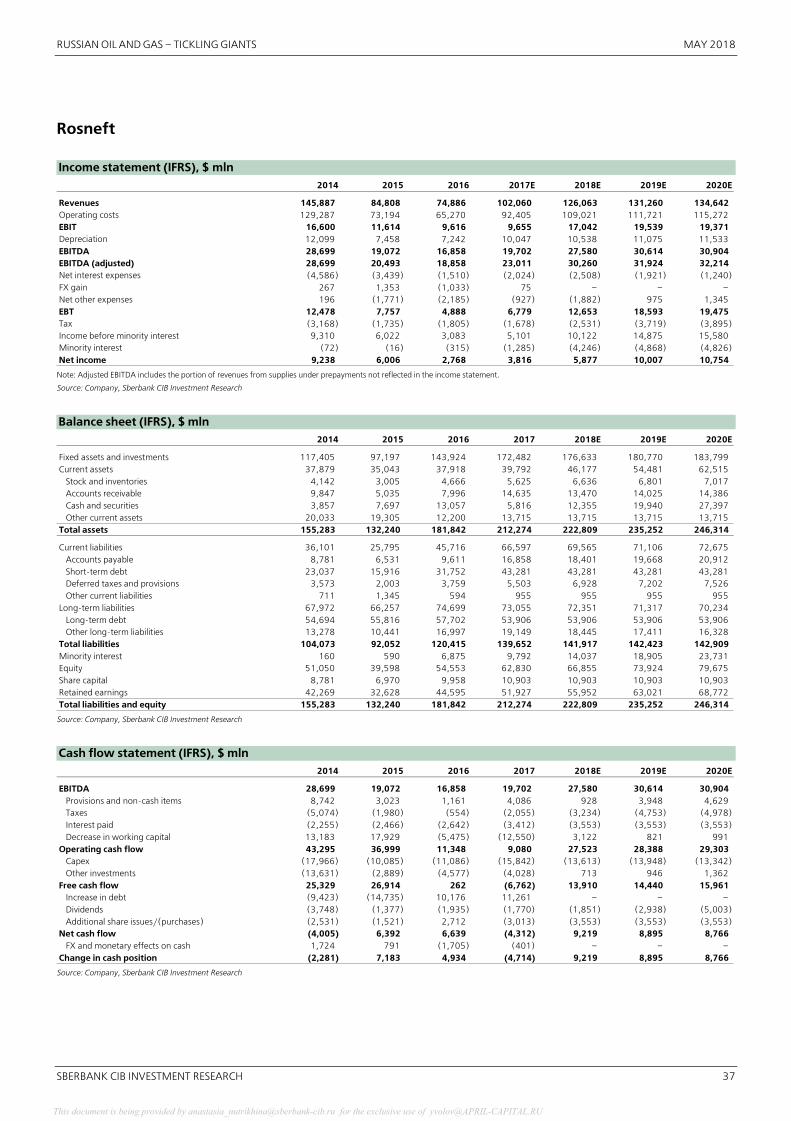
RUSSIAN OIL AND GAS – TICKLING GIANTS MAY 2018
SBERBANK CIB INVESTMENT RESEARCH 37
Rosneft Income statement (IFRS), $ mln
2014 2015 2016 2017E 2018E 2019E 2020E
Revenues 145,887 84,808 74,886 102,060 126,063 131,260 134,642Operating costs 129,287 73,194 65,270 92,405 109,021 111,721 115,272EBIT 16,600 11,614 9,616 9,655 17,042 19,539 19,371Depreciation 12,099 7,458 7,242 10,047 10,538 11,075 11,533EBITDA 28,699 19,072 16,858 19,702 27,580 30,614 30,904EBITDA (adjusted) 28,699 20,493 18,858 23,011 30,260 31,924 32,214Net interest expenses (4,586) (3,439) (1,510) (2,024) (2,508) (1,921) (1,240)FX gain 267 1,353 (1,033) 75 – – –Net other expenses 196 (1,771) (2,185) (927) (1,882) 975 1,345EBT 12,478 7,757 4,888 6,779 12,653 18,593 19,475Tax (3,168) (1,735) (1,805) (1,678) (2,531) (3,719) (3,895)Income before minority interest 9,310 6,022 3,083 5,101 10,122 14,875 15,580Minority interest (72) (16) (315) (1,285) (4,246) (4,868) (4,826)Net income 9,238 6,006 2,768 3,816 5,877 10,007 10,754
Note: Adjusted EBITDA includes the portion of revenues from supplies under prepayments not reflected in the income statement.
Source: Company, Sberbank CIB Investment Research
Balance sheet (IFRS), $ mln
2014 2015 2016 2017 2018E 2019E 2020E
Fixed assets and investments 117,405 97,197 143,924 172,482 176,633 180,770 183,799Current assets 37,879 35,043 37,918 39,792 46,177 54,481 62,515
Stock and inventories 4,142 3,005 4,666 5,625 6,636 6,801 7,017Accounts receivable 9,847 5,035 7,996 14,635 13,470 14,025 14,386Cash and securities 3,857 7,697 13,057 5,816 12,355 19,940 27,397Other current assets 20,033 19,305 12,200 13,715 13,715 13,715 13,715
Total assets 155,283 132,240 181,842 212,274 222,809 235,252 246,314
Current liabilities 36,101 25,795 45,716 66,597 69,565 71,106 72,675Accounts payable 8,781 6,531 9,611 16,858 18,401 19,668 20,912Short�term debt 23,037 15,916 31,752 43,281 43,281 43,281 43,281Deferred taxes and provisions 3,573 2,003 3,759 5,503 6,928 7,202 7,526Other current liabilities 711 1,345 594 955 955 955 955
Long�term liabilities 67,972 66,257 74,699 73,055 72,351 71,317 70,234Long�term debt 54,694 55,816 57,702 53,906 53,906 53,906 53,906Other long�term liabilities 13,278 10,441 16,997 19,149 18,445 17,411 16,328
Total liabilities 104,073 92,052 120,415 139,652 141,917 142,423 142,909Minority interest 160 590 6,875 9,792 14,037 18,905 23,731Equity 51,050 39,598 54,553 62,830 66,855 73,924 79,675Share capital 8,781 6,970 9,958 10,903 10,903 10,903 10,903Retained earnings 42,269 32,628 44,595 51,927 55,952 63,021 68,772Total liabilities and equity 155,283 132,240 181,842 212,274 222,809 235,252 246,314
Source: Company, Sberbank CIB Investment Research
Cash flow statement (IFRS), $ mln
2014 2015 2016 2017 2018E 2019E 2020E
EBITDA 28,699 19,072 16,858 19,702 27,580 30,614 30,904Provisions and non�cash items 8,742 3,023 1,161 4,086 928 3,948 4,629Taxes (5,074) (1,980) (554) (2,055) (3,234) (4,753) (4,978)Interest paid (2,255) (2,466) (2,642) (3,412) (3,553) (3,553) (3,553)Decrease in working capital 13,183 17,929 (5,475) (12,550) 3,122 821 991
Operating cash flow 43,295 36,999 11,348 9,080 27,523 28,388 29,303Capex (17,966) (10,085) (11,086) (15,842) (13,613) (13,948) (13,342)Other investments (13,631) (2,889) (4,577) (4,028) 713 946 1,362
Free cash flow 25,329 26,914 262 (6,762) 13,910 14,440 15,961Increase in debt (9,423) (14,735) 10,176 11,261 – – –Dividends (3,748) (1,377) (1,935) (1,770) (1,851) (2,938) (5,003)Additional share issues/(purchases) (2,531) (1,521) 2,712 (3,013) (3,553) (3,553) (3,553)
Net cash flow (4,005) 6,392 6,639 (4,312) 9,219 8,895 8,766FX and monetary effects on cash 1,724 791 (1,705) (401) – – –
Change in cash position (2,281) 7,183 4,934 (4,714) 9,219 8,895 8,766 Source: Company, Sberbank CIB Investment Research
This document is being provided by [email protected] for the exclusive use of [email protected] document is being provided by [email protected] for the exclusive use of [email protected]
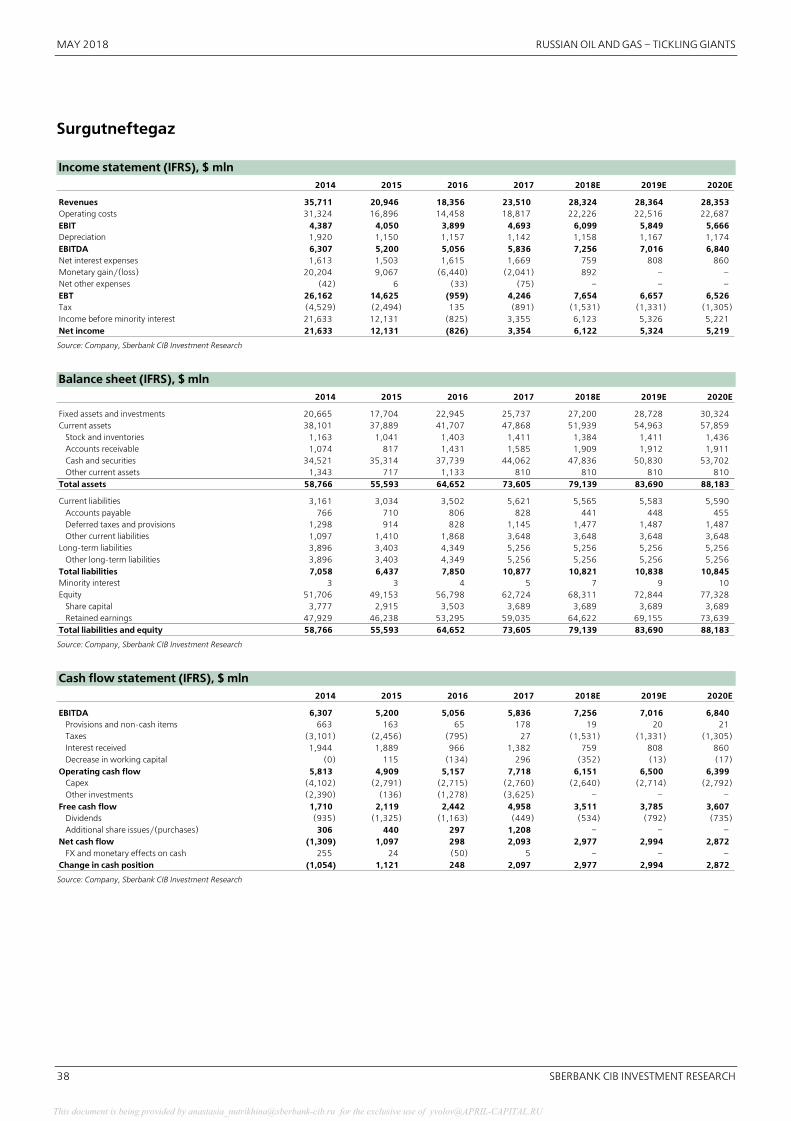
MAY 2018 RUSSIAN OIL AND GAS – TICKLING GIANTS
38 SBERBANK CIB INVESTMENT RESEARCH
Surgutneftegaz Income statement (IFRS), $ mln
2014 2015 2016 2017 2018E 2019E 2020E
Revenues 35,711 20,946 18,356 23,510 28,324 28,364 28,353Operating costs 31,324 16,896 14,458 18,817 22,226 22,516 22,687EBIT 4,387 4,050 3,899 4,693 6,099 5,849 5,666Depreciation 1,920 1,150 1,157 1,142 1,158 1,167 1,174EBITDA 6,307 5,200 5,056 5,836 7,256 7,016 6,840Net interest expenses 1,613 1,503 1,615 1,669 759 808 860Monetary gain/(loss) 20,204 9,067 (6,440) (2,041) 892 – –Net other expenses (42) 6 (33) (75) – – –EBT 26,162 14,625 (959) 4,246 7,654 6,657 6,526Tax (4,529) (2,494) 135 (891) (1,531) (1,331) (1,305)Income before minority interest 21,633 12,131 (825) 3,355 6,123 5,326 5,221Net income 21,633 12,131 (826) 3,354 6,122 5,324 5,219
Source: Company, Sberbank CIB Investment Research
Balance sheet (IFRS), $ mln
2014 2015 2016 2017 2018E 2019E 2020E
Fixed assets and investments 20,665 17,704 22,945 25,737 27,200 28,728 30,324Current assets 38,101 37,889 41,707 47,868 51,939 54,963 57,859
Stock and inventories 1,163 1,041 1,403 1,411 1,384 1,411 1,436Accounts receivable 1,074 817 1,431 1,585 1,909 1,912 1,911Cash and securities 34,521 35,314 37,739 44,062 47,836 50,830 53,702Other current assets 1,343 717 1,133 810 810 810 810
Total assets 58,766 55,593 64,652 73,605 79,139 83,690 88,183
Current liabilities 3,161 3,034 3,502 5,621 5,565 5,583 5,590Accounts payable 766 710 806 828 441 448 455Deferred taxes and provisions 1,298 914 828 1,145 1,477 1,487 1,487Other current liabilities 1,097 1,410 1,868 3,648 3,648 3,648 3,648
Long�term liabilities 3,896 3,403 4,349 5,256 5,256 5,256 5,256Other long�term liabilities 3,896 3,403 4,349 5,256 5,256 5,256 5,256
Total liabilities 7,058 6,437 7,850 10,877 10,821 10,838 10,845Minority interest 3 3 4 5 7 9 10Equity 51,706 49,153 56,798 62,724 68,311 72,844 77,328
Share capital 3,777 2,915 3,503 3,689 3,689 3,689 3,689Retained earnings 47,929 46,238 53,295 59,035 64,622 69,155 73,639
Total liabilities and equity 58,766 55,593 64,652 73,605 79,139 83,690 88,183 Source: Company, Sberbank CIB Investment Research
Cash flow statement (IFRS), $ mln
2014 2015 2016 2017 2018E 2019E 2020E
EBITDA 6,307 5,200 5,056 5,836 7,256 7,016 6,840Provisions and non�cash items 663 163 65 178 19 20 21Taxes (3,101) (2,456) (795) 27 (1,531) (1,331) (1,305)Interest received 1,944 1,889 966 1,382 759 808 860Decrease in working capital (0) 115 (134) 296 (352) (13) (17)
Operating cash flow 5,813 4,909 5,157 7,718 6,151 6,500 6,399Capex (4,102) (2,791) (2,715) (2,760) (2,640) (2,714) (2,792)Other investments (2,390) (136) (1,278) (3,625) – – –
Free cash flow 1,710 2,119 2,442 4,958 3,511 3,785 3,607Dividends (935) (1,325) (1,163) (449) (534) (792) (735)Additional share issues/(purchases) 306 440 297 1,208 – – –
Net cash flow (1,309) 1,097 298 2,093 2,977 2,994 2,872FX and monetary effects on cash 255 24 (50) 5 – – –
Change in cash position (1,054) 1,121 248 2,097 2,977 2,994 2,872 Source: Company, Sberbank CIB Investment Research
This document is being provided by [email protected] for the exclusive use of [email protected] document is being provided by [email protected] for the exclusive use of [email protected]

RUSSIAN OIL AND GAS – TICKLING GIANTS MAY 2018
SBERBANK CIB INVESTMENT RESEARCH 39
Tatneft Income statement (IFRS), $ mln
2014 2015 2016 2017 2018E 2019E 2020E
Revenues 17,155 10,830 10,041 13,242 16,123 16,698 16,738Operating costs 14,210 8,653 7,842 10,481 12,408 12,916 12,955EBIT 2,945 2,178 2,199 2,762 3,715 3,783 3,783Depreciation 553 410 324 427 470 492 510EBITDA 3,546 2,679 2,561 3,451 4,185 4,275 4,293Net interest expenses 35 59 23 59 57 59 71FX gain 313 34 (50) (27) – – –Net other expenses 21 19 (19) 23 (0) (0) (0)EBT 3,314 2,289 2,137 2,802 3,772 3,841 3,854Tax (700) (530) (527) (679) (914) (931) (934)Income before minority interest 2,614 1,760 1,610 2,123 2,857 2,910 2,920Minority interest (146) (113) 20 (13) (17) (18) (18)Net income 2,468 1,647 1,630 2,110 2,840 2,892 2,902
Source: Company, Sberbank CIB Investment Research
Balance sheet (IFRS), $ mln
2014 2015 2016 2017 2018E 2019E 2020E
Fixed assets and investments 9,818 8,499 12,564 14,272 15,449 16,374 17,327Current assets 3,210 2,459 5,482 4,955 5,363 6,160 6,881
Stock and inventories 577 440 549 683 795 849 823Accounts receivable 819 825 1,053 1,069 1,288 1,349 1,352Cash and securities 768 342 1,271 743 820 1,503 2,247Other current assets 1,047 852 2,608 2,460 2,460 2,460 2,460
Total assets 13,028 10,959 18,046 19,227 20,811 22,534 24,207
Current liabilities 1,217 946 4,721 5,318 5,515 5,621 5,694Accounts payable 932 846 1,142 1,308 1,466 1,572 1,645Short�term debt 282 72 318 693 733 733 733Other current liabilities 3 27 3,261 3,316 3,316 3,316 3,316
Long�term liabilities 1,462 990 1,638 1,431 1,509 1,636 1,763Long�term debt 229 177 574 120 74 74 74Other long�term liabilities 1,232 813 1,063 1,311 1,436 1,562 1,690
Total liabilities 2,679 1,935 6,359 6,749 7,025 7,257 7,457Minority interest 467 403 89 119 137 154 172Equity 9,882 8,621 11,598 12,359 13,650 15,122 16,578Share capital 1,764 1,330 1,599 1,670 1,670 1,670 1,670Retained earnings 8,118 7,291 9,999 10,688 11,980 13,452 14,908Total liabilities and equity 13,028 10,959 18,046 19,227 20,811 22,534 24,207
Source: Company, Sberbank CIB Investment Research
Cash flow statement (IFRS), $ mln
2014 2015 2016 2017 2018E 2019E 2020E
EBITDA 3,546 2,679 2,561 3,451 4,185 4,275 4,293Provisions and non�cash items 592 138 54 148 123 127 127Taxes (700) (530) (527) (679) (914) (931) (934)Decrease in working capital 200 (132) 46 269 (178) (9) 96Increase in other assets (200) 67 79 (1) – – –
Operating cash flow 3,439 2,222 2,212 3,189 3,215 3,462 3,582Capex (1,622) (1,517) (1,428) (1,457) (1,647) (1,417) (1,463)Other investments (241) (439) 720 (469) – – –
Free cash flow 1,577 266 784 1,732 1,569 2,044 2,119Increase in debt (875) (210) (121) (60) – – –Interest paid 35 59 23 59 57 59 71Dividends (484) (392) (369) (1,860) (1,548) (1,420) (1,446)Additional share issues/(purchases) (46) (32) (107) 0 – – –
Net cash flow 207 (309) 930 (598) 77 683 744FX and monetary effects on cash 41 18 (22) (5) – – –
Change in cash position 248 (291) 908 (603) 77 683 744 Source: Company, Sberbank CIB Investment Research
This document is being provided by [email protected] for the exclusive use of [email protected] document is being provided by [email protected] for the exclusive use of [email protected]
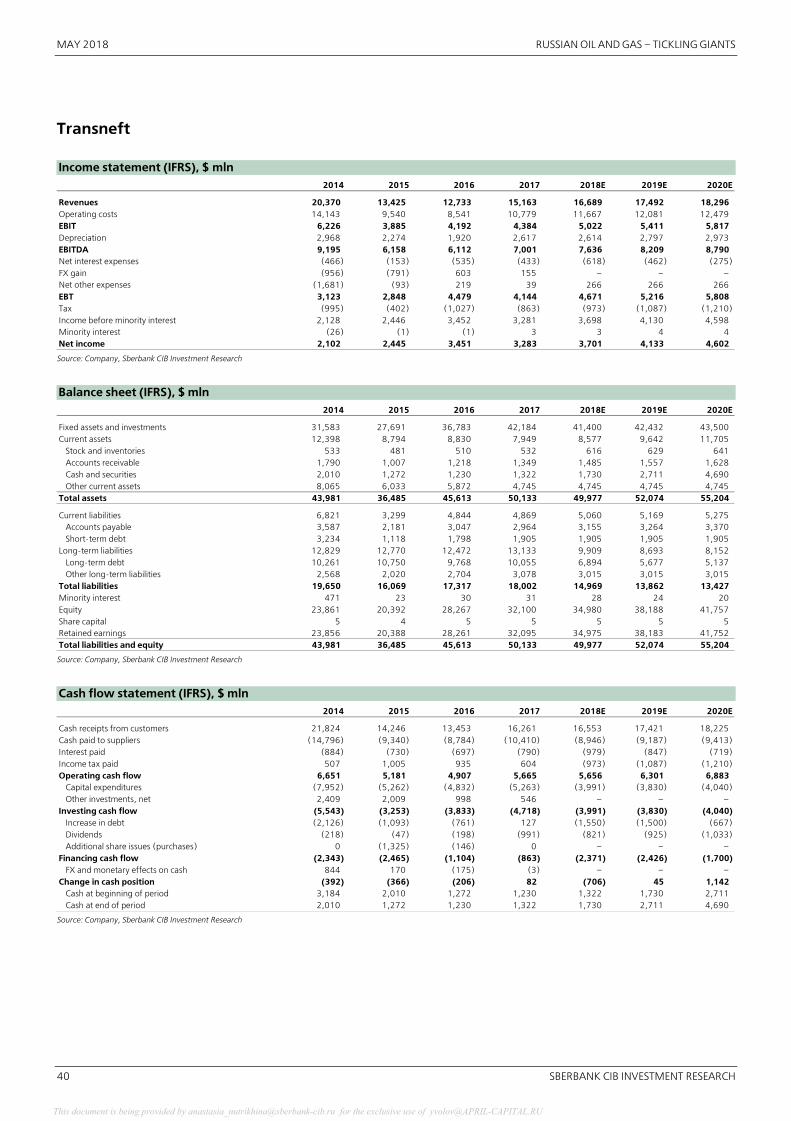
MAY 2018 RUSSIAN OIL AND GAS – TICKLING GIANTS
40 SBERBANK CIB INVESTMENT RESEARCH
Transneft Income statement (IFRS), $ mln
2014 2015 2016 2017 2018E 2019E 2020E
Revenues 20,370 13,425 12,733 15,163 16,689 17,492 18,296Operating costs 14,143 9,540 8,541 10,779 11,667 12,081 12,479EBIT 6,226 3,885 4,192 4,384 5,022 5,411 5,817Depreciation 2,968 2,274 1,920 2,617 2,614 2,797 2,973EBITDA 9,195 6,158 6,112 7,001 7,636 8,209 8,790Net interest expenses (466) (153) (535) (433) (618) (462) (275)FX gain (956) (791) 603 155 – – –Net other expenses (1,681) (93) 219 39 266 266 266EBT 3,123 2,848 4,479 4,144 4,671 5,216 5,808Tax (995) (402) (1,027) (863) (973) (1,087) (1,210)Income before minority interest 2,128 2,446 3,452 3,281 3,698 4,130 4,598Minority interest (26) (1) (1) 3 3 4 4Net income 2,102 2,445 3,451 3,283 3,701 4,133 4,602
Source: Company, Sberbank CIB Investment Research
Balance sheet (IFRS), $ mln
2014 2015 2016 2017 2018E 2019E 2020E
Fixed assets and investments 31,583 27,691 36,783 42,184 41,400 42,432 43,500Current assets 12,398 8,794 8,830 7,949 8,577 9,642 11,705
Stock and inventories 533 481 510 532 616 629 641Accounts receivable 1,790 1,007 1,218 1,349 1,485 1,557 1,628Cash and securities 2,010 1,272 1,230 1,322 1,730 2,711 4,690Other current assets 8,065 6,033 5,872 4,745 4,745 4,745 4,745
Total assets 43,981 36,485 45,613 50,133 49,977 52,074 55,204
Current liabilities 6,821 3,299 4,844 4,869 5,060 5,169 5,275Accounts payable 3,587 2,181 3,047 2,964 3,155 3,264 3,370Short�term debt 3,234 1,118 1,798 1,905 1,905 1,905 1,905
Long�term liabilities 12,829 12,770 12,472 13,133 9,909 8,693 8,152Long�term debt 10,261 10,750 9,768 10,055 6,894 5,677 5,137Other long�term liabilities 2,568 2,020 2,704 3,078 3,015 3,015 3,015
Total liabilities 19,650 16,069 17,317 18,002 14,969 13,862 13,427Minority interest 471 23 30 31 28 24 20Equity 23,861 20,392 28,267 32,100 34,980 38,188 41,757Share capital 5 4 5 5 5 5 5Retained earnings 23,856 20,388 28,261 32,095 34,975 38,183 41,752Total liabilities and equity 43,981 36,485 45,613 50,133 49,977 52,074 55,204
Source: Company, Sberbank CIB Investment Research
Cash flow statement (IFRS), $ mln
2014 2015 2016 2017 2018E 2019E 2020E
Cash receipts from customers 21,824 14,246 13,453 16,261 16,553 17,421 18,225Cash paid to suppliers (14,796) (9,340) (8,784) (10,410) (8,946) (9,187) (9,413)Interest paid (884) (730) (697) (790) (979) (847) (719)Income tax paid 507 1,005 935 604 (973) (1,087) (1,210)Operating cash flow 6,651 5,181 4,907 5,665 5,656 6,301 6,883
Capital expenditures (7,952) (5,262) (4,832) (5,263) (3,991) (3,830) (4,040)Other investments, net 2,409 2,009 998 546 – – –
Investing cash flow (5,543) (3,253) (3,833) (4,718) (3,991) (3,830) (4,040)Increase in debt (2,126) (1,093) (761) 127 (1,550) (1,500) (667)Dividends (218) (47) (198) (991) (821) (925) (1,033)Additional share issues (purchases) 0 (1,325) (146) 0 – – –
Financing cash flow (2,343) (2,465) (1,104) (863) (2,371) (2,426) (1,700)FX and monetary effects on cash 844 170 (175) (3) – – –
Change in cash position (392) (366) (206) 82 (706) 45 1,142Cash at beginning of period 3,184 2,010 1,272 1,230 1,322 1,730 2,711Cash at end of period 2,010 1,272 1,230 1,322 1,730 2,711 4,690
Source: Company, Sberbank CIB Investment Research
This document is being provided by [email protected] for the exclusive use of [email protected] document is being provided by [email protected] for the exclusive use of [email protected]

RUSSIAN OIL AND GAS – TICKLING GIANTS MAY 2018
SBERBANK CIB INVESTMENT RESEARCH 41
Disclosure appendix
IMPORTANT US REGULATORY DISCLOSURES
Within the last 12 months, an affiliate of Sberbank CIB USA managed or co�managed a public
offering of the securities of Bashneft, Gazprom, Gazprom Neft, Transneft.
Within the last 12 months, an affiliate of Sberbank CIB USA has received compensation for
investment banking services from Bashneft, Gazprom, Gazprom Neft, Transneft.
In the next three months, an affiliate of Sberbank CIB USA expects to receive or intends to seek
compensation for investment banking services from Gazprom Neft, Transneft.
An affiliate of Sberbank CIB USA makes a market in the securities of Gazprom, Gazprom Neft,
Lukoil, Novatek, Rosneft, Surgutneftegaz, Tatneft, Transneft.
This report may not be independent of Sberbank's proprietary interests. Sberbank may trade the
securities covered in this report for its own account and on a discretionary basis on behalf of certain
clients. Such trading interests may be contrary to the recommendation(s) offered in this report.
The research analysts, strategists, or research associates principally responsible for the preparation
of this research communication have received compensation based upon various factors, including
quality of research, investor client feedback, stock picking, competitive factors, firm revenues and
overall investment banking revenues.
Analyst certification
The following analyst(s) hereby certify that the views expressed in this research report accurately
reflect such research analyst's personal views about the subject securities and issuers and that no
part of his or her compensation was, is, or will be directly or indirectly related to the specific
recommendations or views contained in the research report: Alex Fak, Anna Kotelnikova.
This document is being provided by [email protected] for the exclusive use of [email protected] document is being provided by [email protected] for the exclusive use of [email protected]
Senior Management
Head of Sberbank CIB Igor Bulantsev
Co�Head of Sberbank CIB Aleksandr Bazarov
Head of Global Markets Department,
Vice�President Andrey Shemetov
Research Department +7 (495) 258 0511
Head of Research Alexander Kudrin +7 (495) 933 9847
Equity Strategy
Chief Equity Strategist Andrey Kuznetsov +7 (495) 933 9868
Equity Strategist Cole Akeson +7 (495) 933 9851
Economy
Chief Economist Anton Stroutchenevski +7 (495) 933 9843
Senior Economist Rodion Lomivorotov, CFA +7 (495) 787 2364
Economist Sergei Konygin +7 (495) 933 9848
Junior Economist Artem Vinogradov +7 (495) 258 0541
Oil and Gas
Senior Analyst Alex Fak +7 (495) 933 9829
Analyst Anna Kotelnikova +7 (495) 787 2382
Metals and Mining, Chemicals
Senior Analyst Irina Lapshina +7 (495) 933 9852
Financials
Senior Analyst Andrew Keeley +44 (20) 7936 0439
Analyst Elena Tsareva +7 (495) 258 0561
Telecoms, Media and Internet
Senior Analyst Svetlana Sukhanova +7 (495) 933 9835
Analyst Maria Sukhanova +7 (495) 933 9856
Consumer
Senior Analyst Mikhail Krasnoperov +7 (495) 933 9838
Junior Analyst Andrey Krylov +7 (495) 258 0511
Utilities
Senior Analyst Igor Vasilyev +7 (495) 933 9842
Junior Analyst Aleksey Ryabushko +7 (495) 258 0511
IT
Senior Analyst Julia Gordeyeva, CFA +7 (495) 933 9846
Senior Analyst Igor Vasilyev +7 (495) 933 9842
Junior Analyst Aleksey Ryabushko +7 (495) 258 0511
Real Estate, Construction
Senior Analyst Julia Gordeyeva, CFA +7 (495) 933 9846
Senior Analyst Igor Vasilyev +7 (495) 933 9842
Junior Analyst Aleksey Ryabushko +7 (495) 258 0511
Transport, Industrials
Senior Analyst Igor Vasilyev +7 (495) 933 9842
Senior Analyst Julia Gordeyeva, CFA +7 (495) 933 9846
J Junior Analyst Aleksey Ryabushko +7 (495) 258 0511
FICC Strategy
Chief Strategist FX/IR Tom Levinson +7 (495) 933 9858
Junior Strategist FX/IR Yuri Popov +7 (495) 787 2383
Commodity Strategist Mikhail Sheybe +7 (495) 258 0521
Strategist FI Alexander Golinsky + 7 (495) 258 0511
Fixed Income Credit Research
Senior Credit Analyst Alexey Bulgakov +7 (495) 933 9866
Senior Credit Analyst Ekaterina Sidorova, CFA +7 (495) 933 9834
Credit Analyst Alexander Sychev, CFA +7 (495) 933 9886
Analyst Nikolay Minko + 7 (495) 933 9857
Junior Analyst Alisa Zakirova + 7 (495) 258 0542
Head Office, Moscow
19, ul VavilovaMoscow 117997, Russia
Phone +7 (495) 258 0500Research +7 (495) 258 0511Equity Sales +7 (495) 258 0550Fixed Income Sales +7 (495) 258 0510Trading +7 (495) 258 0525Options Trading +7 (495) 258 0555Structured Products +7 (495) 258 0572Treasury Products +7 (495) 258 0530
Sberbank CIB USA, Inc
Carnegie Hall Tower, 152 West 57th Street44th floor, New York, NY 10019
Phone +1 (212) 300 9600
Sberbank CIB (UK) Limited
85 Fleet Street, 4th floor, London, EC4Y 1AE
Phone +44 (20) 7583 3257
Authorized and regulated by the Financial Conduct AuthorityA member of the London Stock Exchange
This document is being provided by [email protected] for the exclusive use of [email protected] document is being provided by [email protected] for the exclusive use of [email protected]

This Sberbank CIB Investment Research analytical review (hereinafter – “this analytical review”) was prepared jointly by JSC Sberbank CIB and Sberbank CIB (UK) and/or any of their affiliated persons(collectively – “Sberbank CIB”).
This analytical review accurately reflects analysts’ personal opinions about the company (companies) analyzed and its (their) securities. Analysts’ compensation is not in any way, directly or indirectly,related to the specific recommendations and opinions expressed in this analytical review. The personal views of analysts may differ from one another. Sberbank CIB may have issued or may issueSberbank CIB Investment Research analytical reviews that are inconsistent with, and/or reach different conclusions from, the information presented herein.
This analytical review may be used as general information only and is based on current public information that Sberbank CIB considers reliable, but Sberbank CIB does not represent it as accurate orcomplete, and it should not be relied on as such. Neither the information nor any opinion expressed constitutes a recommendation, an offer or an invitation to make an offer, to buy or sell any securitiesor other investment or any options, futures or any other financial instruments. This analytical review does not constitute investment advice and does not take into account any special or individualinvestment objectives, financial situations or particular needs of any particular person who may receive this analytical review. The services, securities and investments discussed in this analytical reviewmay be neither available to nor suitable for all investors. Investors should seek financial advice regarding the appropriateness of investing in any security or other investment and the investmentstrategies discussed or recommended in this analytical review and should understand that statements regarding future prospects may not be realized.
Investors should note that income from such securities or other investments, if any, may fluctuate and that the price or value of such securities and investments may rise or fall. Accordingly, investorsmay receive back less than was originally invested. Past performance is not necessarily a guide to future performance, future returns are not guaranteed, and a loss of original capital may occur.Sberbank CIB accepts no liability whatsoever for any direct and indirect losses, damage, or other consequences of any kind that may arise out of the partial or full usage of the materials from SberbankCIB Investment Research analytical reviews. Investors should conduct their own evaluation of risks and should not rely solely on the information presented in Sberbank CIB Investment Research analyticalreviews. Investors should obtain individual legal, tax, financial, accounting or other professional advice based on their particular circumstances. Any information relating to the tax status of financialinstruments discussed herein is not intended to provide tax advice or to be used by anyone to provide tax advice.
Sberbank CIB is not committed to update the information or to correct any inaccuracies contained in Sberbank CIB Investment Research analytical reviews.
From time to time, Sberbank CIB or the principals or employees and their connected persons of Sberbank CIB may have or have had positions in the securities or other instruments referred to herein ormay conduct or may have conducted market�making activities or otherwise act or have acted as principal in transactions in any of these securities or instruments or may provide or have providedinvestment banking or consulting services to or serve or have served as a director or a supervisory board member of a company referred to in this analytical review. Sberbank CIB’s sales managers,traders, and other professionals may provide oral or written market commentary or trading strategies to Sberbank CIB’s clients, as well as its proprietary trading desks, where transactions are enteredinto at the expense and in the interest of Sberbank CIB, and such commentary may reflect opinions that are contrary to the opinions expressed in analytical reviews of Sberbank CIB Investment Research.Sberbank CIB’s asset management, proprietary trading and investment banking business units may make investment decisions that are inconsistent with the recommendations or views expressed in thisanalytical review. Sberbank CIB maintains internal policies that are designed to manage any actual or potential conflicts of interest.
Other than certain industry specific analytical reviews published on a regular basis, Sberbank CIB Investment Research analytical reviews are published at irregular intervals as appropriate in the analyst’sjudgment.
Further information on the securities referred to herein may be obtained from Sberbank CIB upon request. This analytical review may not be reproduced or copied in whole or in any part without writtenconsent of Sberbank CIB.
This analytical review does not constitute or contain legal advice. Further, Sberbank CIB should not in any way be viewed as soliciting, facilitating, brokering or causing any persons within any country toinvest in or otherwise engage in transactions that may be prohibited to those persons under relevant law. Sberbank CIB Investment Research analytical reviews are provided in respect of entities orinvestments in both Russian domestic and international financial markets (as applicable in each case) and are intended for eligible investors in compliance with the legal requirements and trading rulesof the relevant markets. Sberbank CIB Investment Research analytical reviews received by such eligible investors concerning entities or investments that may be sanctioned in other jurisdictions are notdirected to, and should not be considered as investment advice in respect of, any transaction that implicates such sanctions or that involves persons within the jurisdiction of such sanctions, includingbut not limited to U.S., Canadian, Australian, Japanese, Swiss, European or EU investors. Sberbank CIB Investment Research analytical reviews are never to be used for unlawful activity, including activitythat is contrary to or that circumvents economic sanctions requirements. After having read this analytical review, investors should determine the legality of any planned transactions in consultation withtheir legal advisers in respect of their compliance with the legal requirements and trading rules applicable to their activities.
UNITED KINGDOM. For Professional and/or Eligible Counterparties (not to be used with or passed on to retail clients). The research and analysis included in this document has been produced andapproved for distribution in the United Kingdom by Sberbank CIB for its own investment management activities. Sberbank (CIB) UK Limited is registered in England and Wales under No. 4783112 at 85Fleet Street, London, EC4Y 1AE, United Kingdom and is authorised and regulated in the UK by the Financial Conduct Authority.
EUROPEAN UNION. Unless otherwise specified herein, this analytical review is intended for persons who are qualified as eligible counterparties or professional clients only and not for distribution toretail clients, as defined by the EU Markets in Financial Instruments Directive – 2004/39/EC. This document is distributed in the EU by Sberbank (CIB) UK Limited and is authorised and regulated in theUK by the Financial Conduct Authority.
For investors outside of the EU and Switzerland this analytical review is disseminated to either eligible or professional investors as regulated in the respective jurisdiction. If this analytical review isobtained by a person who is not considered to be an eligible or professional investor under applicable local laws in the respective jurisdiction, this person should not review it, should disregard and/orimmediately delete it and undertake their best effort to inform Sberbank CIB about having received this analytical review by mistake.
FOR RESIDENTS OF THE UNITED STATES. Under Rule 15a�6 under the Securities Exchange Act of 1934, this research report is available solely for distribution from JSC Sberbank CIB, to major U.S.institutional investors, and is not subject to all of the independence and disclosure standards applicable to debt research reports prepared for retail investors. All major U.S. institutional investors orpersons outside the United States that have received this analytical review shall neither distribute the original nor a copy hereof to any other person in the United States. This analytical review has beenprepared and reviewed by research analysts who are neither employed by Sberbank CIB USA, Inc., nor registered or qualified as research analysts with FINRA, and are not subject to the rules of FINRA.Sberbank CIB USA, Inc. accepts responsibility for the contents hereof.
This analytical review, however, may also be redistributed in the United States by Sberbank CIB USA, Inc., a U.S. registered broker and dealer and a member of FINRA, to both major and non majorinstitutional investors under FINRA Rules for the redistribution of research. All transactions in any security or financial instrument mentioned herein with or for any U.S. institutional investor or major U.S.institutional investor must be effected through Sberbank CIB USA, Inc. Please contact a registered representative of Sberbank CIB USA, Inc., by phone at 212.300.9600 or by mail at Carnegie HallTower 152 W 57th Street 46th Floor New York, NY 10019.
© SBERBANK CIB 2018 This document is being provided by [email protected] for the exclusive use of [email protected] document is being provided by [email protected] for the exclusive use of [email protected]