LUKOIL 2004 - RUSTOCKS.com · 2 ANALYST DATABOOK LUKOIL IN THE WORLD LUKOIL IN THE WORLD ANALYST...
64
ANALYST DATABOOK 2004 LUKOIL
Transcript of LUKOIL 2004 - RUSTOCKS.com · 2 ANALYST DATABOOK LUKOIL IN THE WORLD LUKOIL IN THE WORLD ANALYST...

ANALYST DATABOOK 2004LUKOIL

1ANALYST DATABOOK
Contents
LUKOIL in the World . . . . . . . . . . . . . . . . . . . . . . . . . . . . . . . . . . . . . . . . . . . . . . . . . . . . . . . . . . . . . . . . . . . . . . . . . . . . . . . . . 2
Oil Reserves . . . . . . . . . . . . . . . . . . . . . . . . . . . . . . . . . . . . . . . . . . . . . . . . . . . . . . . . . . . . . . . . . . . . . . . . . . . . . . . . 6
Gas Reserves . . . . . . . . . . . . . . . . . . . . . . . . . . . . . . . . . . . . . . . . . . . . . . . . . . . . . . . . . . . . . . . . . . . . . . . . . . . . . . . . 7
Oil Production . . . . . . . . . . . . . . . . . . . . . . . . . . . . . . . . . . . . . . . . . . . . . . . . . . . . . . . . . . . . . . . . . . . . . . . . . . . . . . . 8
Gas Production . . . . . . . . . . . . . . . . . . . . . . . . . . . . . . . . . . . . . . . . . . . . . . . . . . . . . . . . . . . . . . . . . . . . . . . . . . . . . . 9
Refining . . . . . . . . . . . . . . . . . . . . . . . . . . . . . . . . . . . . . . . . . . . . . . . . . . . . . . . . . . . . . . . . . . . . . . . . . . . . . . . . . . . 10
Oil Exports . . . . . . . . . . . . . . . . . . . . . . . . . . . . . . . . . . . . . . . . . . . . . . . . . . . . . . . . . . . . . . . . . . . . . . . . . . . . . . . . . 11
LUKOIL in Russia . . . . . . . . . . . . . . . . . . . . . . . . . . . . . . . . . . . . . . . . . . . . . . . . . . . . . . . . . . . . . . . . . . . . . . . . . . . . . . . . . . . . 12
Reserves & Production . . . . . . . . . . . . . . . . . . . . . . . . . . . . . . . . . . . . . . . . . . . . . . . . . . . . . . . . . . . . . . . . . . . . . . . 13
Refining . . . . . . . . . . . . . . . . . . . . . . . . . . . . . . . . . . . . . . . . . . . . . . . . . . . . . . . . . . . . . . . . . . . . . . . . . . . . . . . . . . . 15
Oil & Petroleum Product Exports . . . . . . . . . . . . . . . . . . . . . . . . . . . . . . . . . . . . . . . . . . . . . . . . . . . . . . . . . . . . . . . 17
Exploration & Production . . . . . . . . . . . . . . . . . . . . . . . . . . . . . . . . . . . . . . . . . . . . . . . . . . . . . . . . . . . . . . . . . . . . . . . . . . . . 18
Geological Exploration . . . . . . . . . . . . . . . . . . . . . . . . . . . . . . . . . . . . . . . . . . . . . . . . . . . . . . . . . . . . . . . . . . . . . . . 18
Oil Reserves . . . . . . . . . . . . . . . . . . . . . . . . . . . . . . . . . . . . . . . . . . . . . . . . . . . . . . . . . . . . . . . . . . . . . . . . . . . . . . . . 20
Gas Reserves . . . . . . . . . . . . . . . . . . . . . . . . . . . . . . . . . . . . . . . . . . . . . . . . . . . . . . . . . . . . . . . . . . . . . . . . . . . . . . . 22
Hydrocarbon Reserves . . . . . . . . . . . . . . . . . . . . . . . . . . . . . . . . . . . . . . . . . . . . . . . . . . . . . . . . . . . . . . . . . . . . . . . 24
Field Development . . . . . . . . . . . . . . . . . . . . . . . . . . . . . . . . . . . . . . . . . . . . . . . . . . . . . . . . . . . . . . . . . . . . . . . . . . 26
Oil Production . . . . . . . . . . . . . . . . . . . . . . . . . . . . . . . . . . . . . . . . . . . . . . . . . . . . . . . . . . . . . . . . . . . . . . . . . . . . . . 30
Gas Production . . . . . . . . . . . . . . . . . . . . . . . . . . . . . . . . . . . . . . . . . . . . . . . . . . . . . . . . . . . . . . . . . . . . . . . . . . . . . 34
Refining & Gas Processing . . . . . . . . . . . . . . . . . . . . . . . . . . . . . . . . . . . . . . . . . . . . . . . . . . . . . . . . . . . . . . . . . . . . . . . . . . 36
Refining . . . . . . . . . . . . . . . . . . . . . . . . . . . . . . . . . . . . . . . . . . . . . . . . . . . . . . . . . . . . . . . . . . . . . . . . . . . . . . . . . . 36
Gas Processing . . . . . . . . . . . . . . . . . . . . . . . . . . . . . . . . . . . . . . . . . . . . . . . . . . . . . . . . . . . . . . . . . . . . . . . . . . . . . 46
Petrochemicals . . . . . . . . . . . . . . . . . . . . . . . . . . . . . . . . . . . . . . . . . . . . . . . . . . . . . . . . . . . . . . . . . . . . . . . . . . . . . 47
Marketing . . . . . . . . . . . . . . . . . . . . . . . . . . . . . . . . . . . . . . . . . . . . . . . . . . . . . . . . . . . . . . . . . . . . . . . . . . . . . . . . . . . . . . . . . 50
Oil Supplies . . . . . . . . . . . . . . . . . . . . . . . . . . . . . . . . . . . . . . . . . . . . . . . . . . . . . . . . . . . . . . . . . . . . . . . . . . . . . . . .50
Petroleum Product Marketing . . . . . . . . . . . . . . . . . . . . . . . . . . . . . . . . . . . . . . . . . . . . . . . . . . . . . . . . . . . . . . . . . 52
Petrochemical Product Marketing . . . . . . . . . . . . . . . . . . . . . . . . . . . . . . . . . . . . . . . . . . . . . . . . . . . . . . . . . . . . . 53
Corporate Governance . . . . . . . . . . . . . . . . . . . . . . . . . . . . . . . . . . . . . . . . . . . . . . . . . . . . . . . . . . . . . . . . . . . . . . . . . . . . . 54
Finances . . . . . . . . . . . . . . . . . . . . . . . . . . . . . . . . . . . . . . . . . . . . . . . . . . . . . . . . . . . . . . . . . . . . . . . . . . . . . . . . . . . . . . . . . . . 56
Company Shares . . . . . . . . . . . . . . . . . . . . . . . . . . . . . . . . . . . . . . . . . . . . . . . . . . . . . . . . . . . . . . . . . . . . . . . . . . . 56
Consolidated Financial Statements . . . . . . . . . . . . . . . . . . . . . . . . . . . . . . . . . . . . . . . . . . . . . . . . . . . . . . . . . . . . . 59
Financial Ratios . . . . . . . . . . . . . . . . . . . . . . . . . . . . . . . . . . . . . . . . . . . . . . . . . . . . . . . . . . . . . . . . . . . . . . . . . . . . . 62
Reference Information . . . . . . . . . . . . . . . . . . . . . . . . . . . . . . . . . . . . . . . . . . . . . . . . . . . . . . . . . . . . . . . . . . . . . . . . . . . . . 64

3ANALYST DATABOOKLLUUKKOOIILL IINN TTHHEE WWOORRLLDD2 ANALYST DATABOOK LLUUKKOOIILL IINN TTHHEE WWOORRLLDD
RUSSIA
Azerbaijan
Kazakhstan
Uzbekistan
Iran
Iraq
Saudi Arabia
Cyprus
Ukraine
Belarus
Baltics
Poland
Czech Republic
Bulgaria
Romania
Turkey
GeorgiaColombia
USA Serbia
Egypt
Moldova
Exploration
Exploration & Production
Exploration, Production,Refining & Marketing
Refining & Marketing
Marketing
Corporate Structure (2003)
4 ANALYST DATABOOK
Oil & Gas Production Oil Refining and Gas Processing
Nizhny Novgorod Refinery Nizhnevolzhsknefteproduct
Permnefteproduct
Cheliabnefteproduct
Severnefteproduct
Centrnefteproduct
Vologdanefteproduct
Severo�Zapadnefteproduct
Yugnefteproduct
Uralnefteproduct
Perm Refinery
Volgograd Refinery
Ukhta Refinery
Lokosovsky Gas�processing Plant
Usinsky Gas�processing Plant
Korobkovsky Gas�processing Plant
Permneftegaz Gas�processing Plant
Stavrolen
Saratovorgsintez
Petroleum Product Marketing
Timan�Pechora
LUKOIL�Komi
Arkhangelskgeoldobycha
Urals
LUKOIL�Permneft
LUKOIL�Perm
LUKOIL�Western Siberia
Volga
Nizhnevolzhskneft
Other
RITEK
Kaliningradmorneft
Western Siberia
LLUUKKOOIILL IINN TTHHEE WWOORRLLDD
Kazakhstan
Karachaganak*
Bulgaria
LUKOIL�Neftokhim Burgas
LITASCO
LUKOIL�USA
LUKOIL�Bulgaria
LUKOIL�Baltics
LUKOIL�Downstream (Romania)
LUKOIL�Moldova
LUKOIL�Poland
LUKOIL�Belarus
LUKOIL�Azerbaijan
LUKOIL�Cyprus
LUKOIL�Prague
LUKOIL�Belgrade
LUKOIL�Georgia
Romania
Petrotel�LUKOIL
Ukraine
Odessa Refinery
LUKOR
Kumkol*
Tengiz
Egypt
Meleiha*
North�East Geisum and West Geisum*
Iraq
West Qurnah�2*
Iran
Anaran*
Colombia
Condor*
Azerbaijan
Zykh�Govsany
Yalama*
Shakh�Deniz*
WEEM*
RU
SS
IA
IN
TE
RN
AT
IO
NA
L
* LUKOIL Overseas Holdings.
5ANALYST DATABOOK
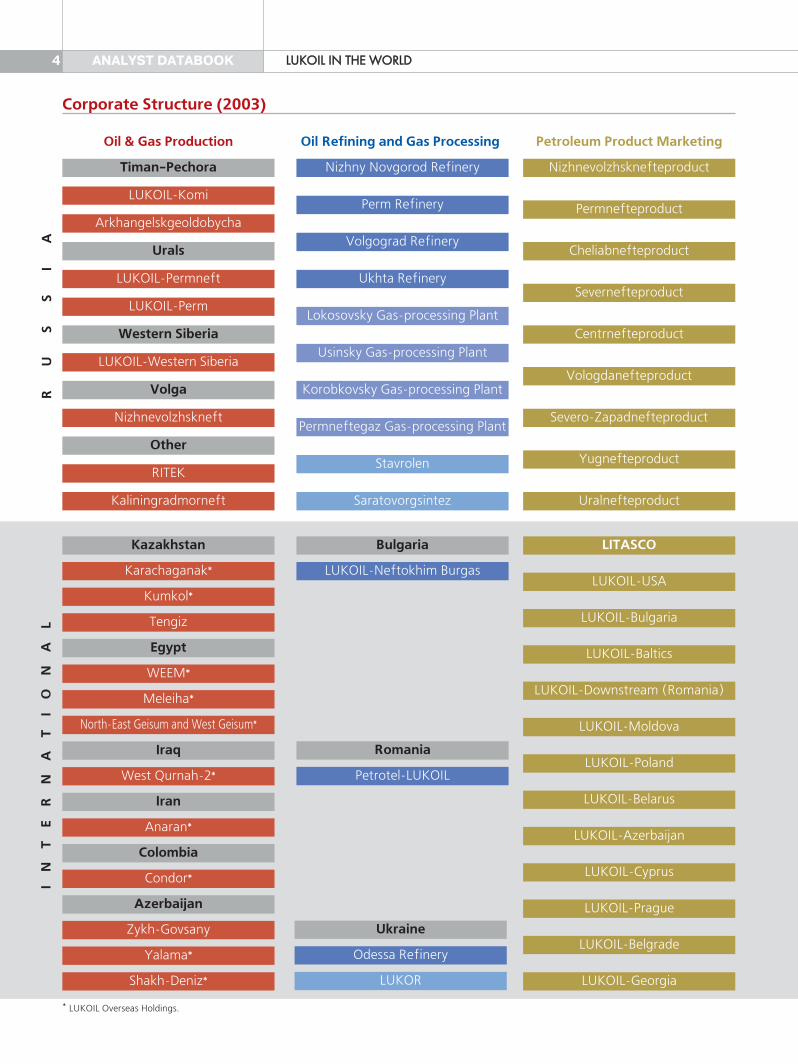
LUKOIL today is:
1.5% of global oil reserves and 2.1% of global oil production
0.4% of global gas reserves 0.2% of global gas production
The largest private oil company worldwide by proven
reserves of crude oil
The 2nd largest private oil company worldwide by proven
reserves of hydrocarbons
The 6th largest private oil company worldwide
by production of hydrocarbons
11th by net profit among the world's top�100 private and
state oil companies
24th by sales among the world's top�100 private and state
oil companies
21st by assets among the world's top�100 private and state
oil companies
The most liquid Central and Eastern European security
issuer on the London Stock Exchange
LUKOIL operates in 27 countries:
carries out geological exploration in 8 countries
has proven hydrocarbon reserves in 4 countries
produces oil & gas in 3 countries
produces petroleum products in 4 countries
produces petrochemical products in 2 countries
sells petroleum products in 17 countries
Proven hydrocarbon reserves of majorinternational private oil companies
(01.01.04), bln boe
RepsolYPF
ENI
ConocoPhillips
Total
ChevronTexaco
Shell
YUKOS
BP
LUKOIL
ExxonMobil
0 8 16 24
5.2
7.1
7.8
11.0
12.0
14.5
16.0
18.1
20.1
21.2
Hydrocarbon production by majorinternational private oil companies
(2003), mln boe per day
ExxonMobil
Shell
BP
ChevronTexaco
Total
LUKOIL
YUKOS
ConocoPhillips
ENI
RepsolYPF
0 1 2 3 4 5
4.2
3.9
3.6
2.5
2.5
1.7
1.7
1.6
1.6
1.1
LLUUKKOOIILL IINN TTHHEE WWOORRLLDD

Countries where LUKOIL has oil reserves
Russia
Egypt
KazakhstanAzerbaijan
6 ANALYST DATABOOK LLUUKKOOIILL IINN TTHHEE WWOORRLLDD
World
LUKOIL
0% 5% 10%
0.1%
4.8%
9.1%
«Big 10»*
Oil Reserves
LUKOIL carries out geological exploration in 8 countries
LUKOIL has proven oil reserves in 4 countries
Proven oil reserves of LUKOIL Group amount to 15.98 bln barrels as ofJanuary 1, 2004
LUKOIL Group represents 1.5% of global oil reserves as of 1 January,2004
Share of LUKOIL Group in global oil reserves increased by more than 1.5times from 1 January, 1999 to 1 January, 2004
LUKOIL is the largest private oil company worldwide by proven reservesof crude oil
LUKOIL is among leading companies by the average annual pace ofgrowth of proven oil reserves
Proven oil reserves of majorinternational private oil companies(01.01.04), bln barrels
OPEC countries (78%)
Russia (6%)
USA (3%)Mexico (1%)
China (2%)Other (10%)
Regional distribution of global oilreserves (01.01.2003)
1999 2000 2001 2002 20030.9%
1.0%
1.1%
1.2%
1.3%
1.4%
1.5%
1.6%
Share of LUKOIL Group in global oil reserves, %
RepsolYPF
ENI
ConocoPhillips
Shell
Total
ChevronTexaco
BP
ExxonMobil
YUKOS
LUKOIL
0 4 8 12 16
1.9
4.1
5.2
6.6
7.3
8.6
10.0
12.0
15.0
16.0
Average annual pace of growth ofproven oil reserves (1999�2003)
* 10 major international private oil companies.
7ANALYST DATABOOKLLUUKKOOIILL IINN TTHHEE WWOORRLLDD
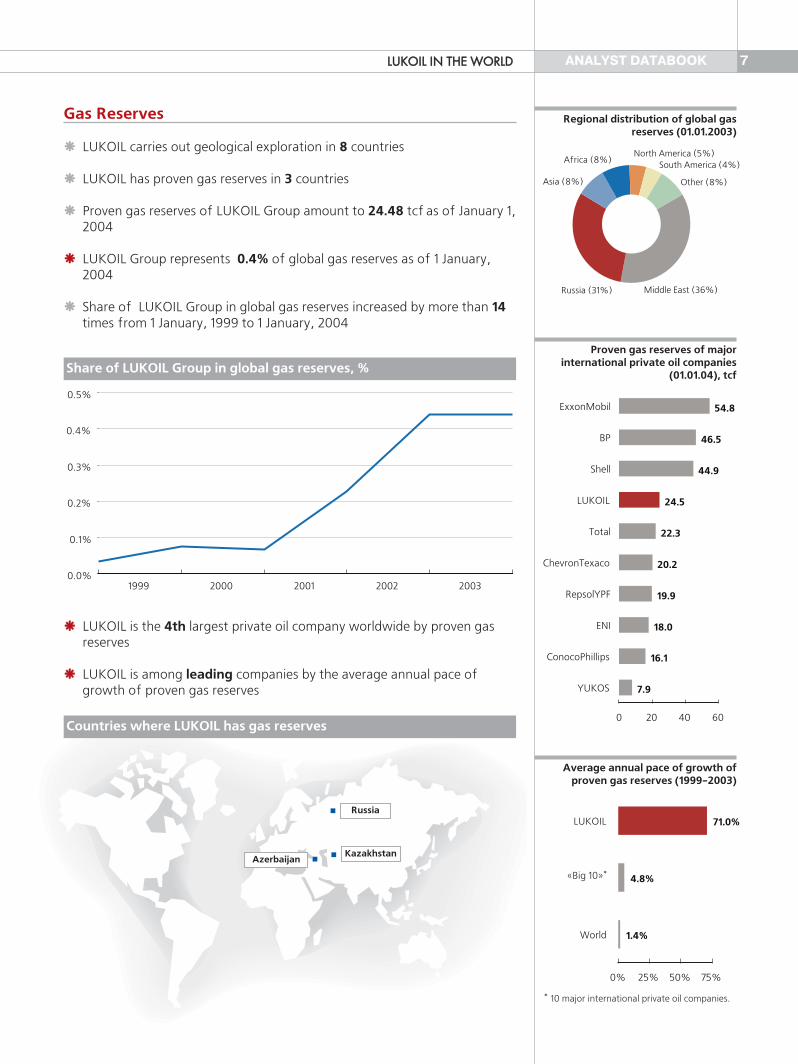
Gas Reserves
LUKOIL carries out geological exploration in 8 countries
LUKOIL has proven gas reserves in 3 countries
Proven gas reserves of LUKOIL Group amount to 24.48 tcf as of January 1,2004
LUKOIL Group represents 0.4% of global gas reserves as of 1 January,2004
Share of LUKOIL Group in global gas reserves increased by more than 14times from 1 January, 1999 to 1 January, 2004
LUKOIL is the 4th largest private oil company worldwide by proven gasreserves
LUKOIL is among leading companies by the average annual pace ofgrowth of proven gas reserves
Proven gas reserves of majorinternational private oil companies
(01.01.04), tcf
Middle East (36%)Russia (31%)
Asia (8%)
Africa (8%)North America (5%)
South America (4%)
Other (8%)
Regional distribution of global gasreserves (01.01.2003)
1999 2000 2001 2002 20030.0%
0.1%
0.2%
0.3%
0.4%
0.5%
Share of LUKOIL Group in global gas reserves, %
World
LUKOIL
0% 25% 50% 75%
1.4%
4.8%
71.0%
«Big 10»*
Average annual pace of growth ofproven gas reserves (1999�2003)
YUKOS
ConocoPhillips
ENI
RepsolYPF
ChevronTexaco
Total
LUKOIL
Shell
BP
ExxonMobil
0 20 40 60
7.9
16.1
18.0
19.9
20.2
22.3
24.5
44.9
46.5
54.8
Countries where LUKOIL has gas reserves
Russia
KazakhstanAzerbaijan
* 10 major international private oil companies.
8 ANALYST DATABOOK LLUUKKOOIILL IINN TTHHEE WWOORRLLDD
World
LUKOIL
0% 4% 8%
1.6%
3.9%
6.9%
«Big 10»*
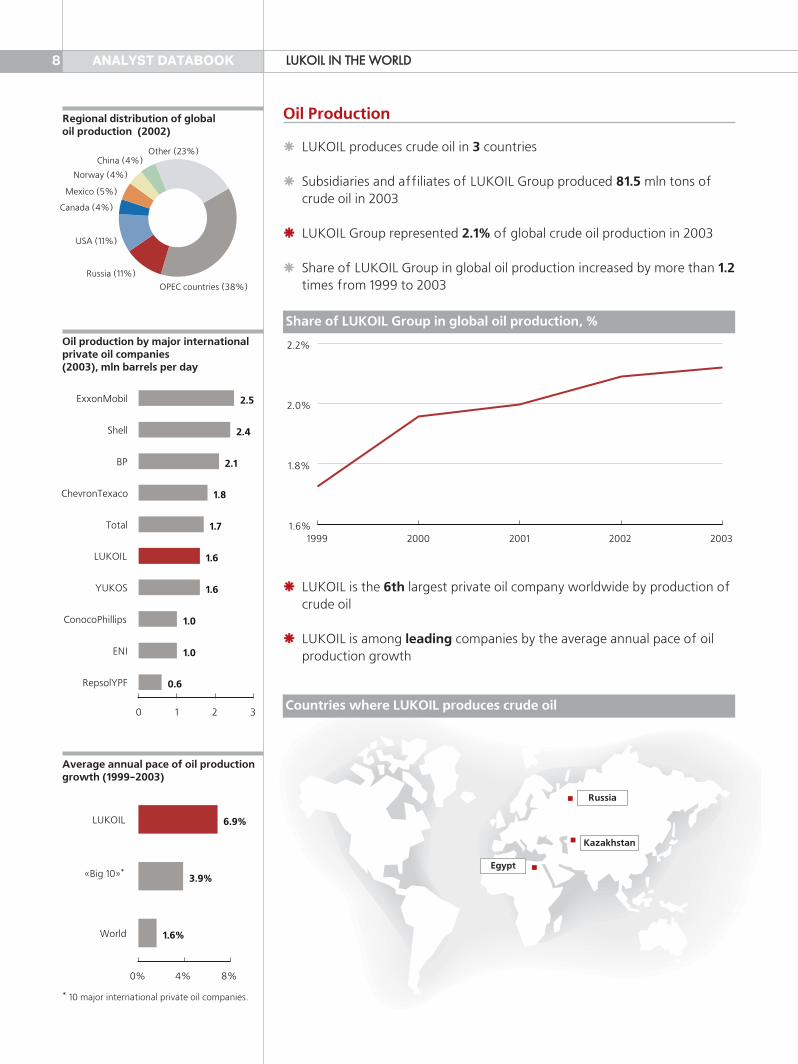
Oil Production
LUKOIL produces crude oil in 3 countries
Subsidiaries and affiliates of LUKOIL Group produced 81.5 mln tons ofcrude oil in 2003
LUKOIL Group represented 2.1% of global crude oil production in 2003
Share of LUKOIL Group in global oil production increased by more than 1.2times from 1999 to 2003
LUKOIL is the 6th largest private oil company worldwide by production ofcrude oil
LUKOIL is among leading companies by the average annual pace of oilproduction growth
Oil production by major internationalprivate oil companies(2003), mln barrels per day
OPEC countries (38%)
Russia (11%)
USA (11%)
Canada (4%)
Mexico (5%)
Norway (4%)
China (4%)Other (23%)
Regional distribution of globaloil production (2002)
1999 2000 2001 2002 20031.6%
1.8%
2.0%
2.2%
Share of LUKOIL Group in global oil production, %
RepsolYPF
ENI
ConocoPhillips
YUKOS
LUKOIL
Total
ChevronTexaco
BP
Shell
ExxonMobil
0 1 2 3
0.6
1.0
1.0
1.6
1.6
1.7
1.8
2.1
2.4
2.5
Average annual pace of oil productiongrowth (1999�2003)
Russia
Egypt
Kazakhstan
Countries where LUKOIL produces crude oil
* 10 major international private oil companies.

9ANALYST DATABOOKLLUUKKOOIILL IINN TTHHEE WWOORRLLDD
Gas Production
LUKOIL produces gas in 2 countries
Subsidiaries and affiliates of LUKOIL Group produced 5.7 bcm of gas in2003
LUKOIL Group represented 0.2% of global gas production in 2003
Share of LUKOIL Group in global gas production increased by more than1.3 times from 1999 to 2003
LUKOIL gas production currently lags that of other privately ownedinternational majors, but the Group is placing high priority on gasproduction development
LUKOIL is among leading companies by the average annual pace of gasproduction growth
Gas production by major internationalprivate oil companies (2003),
mln boe per day
Middle East (9%)
Russia (23%)
Asia (12%)
Africa (5%)South America (4%)
North America (29%)
Other (18%)
Regional distribution of globalgas production (2002)
1999 2000 2001 2002 20030.16%
0.18%
0.20%
0.22%
Share of LUKOIL Group in global gas production, %
ExxonMobil
Shell
BP
Total
ChevronTexaco
ConocoPhillips
ENI
RepsolYPF
LUKOIL
YUKOS
0 1 2
1.7
1.5
1.4
0.8
0.7
0.6
0.6
0.5
0.1
0.1
Average annual pace of gas productiongrowth (1999�2003)
World
LUKOIL
0% 5% 10%
2.5%
6.6%
9.9%
«Big 10»*
Russia
Kazakhstan
Countries where LUKOIL produces gas
* 10 major international private oil companies.
10 ANALYST DATABOOK
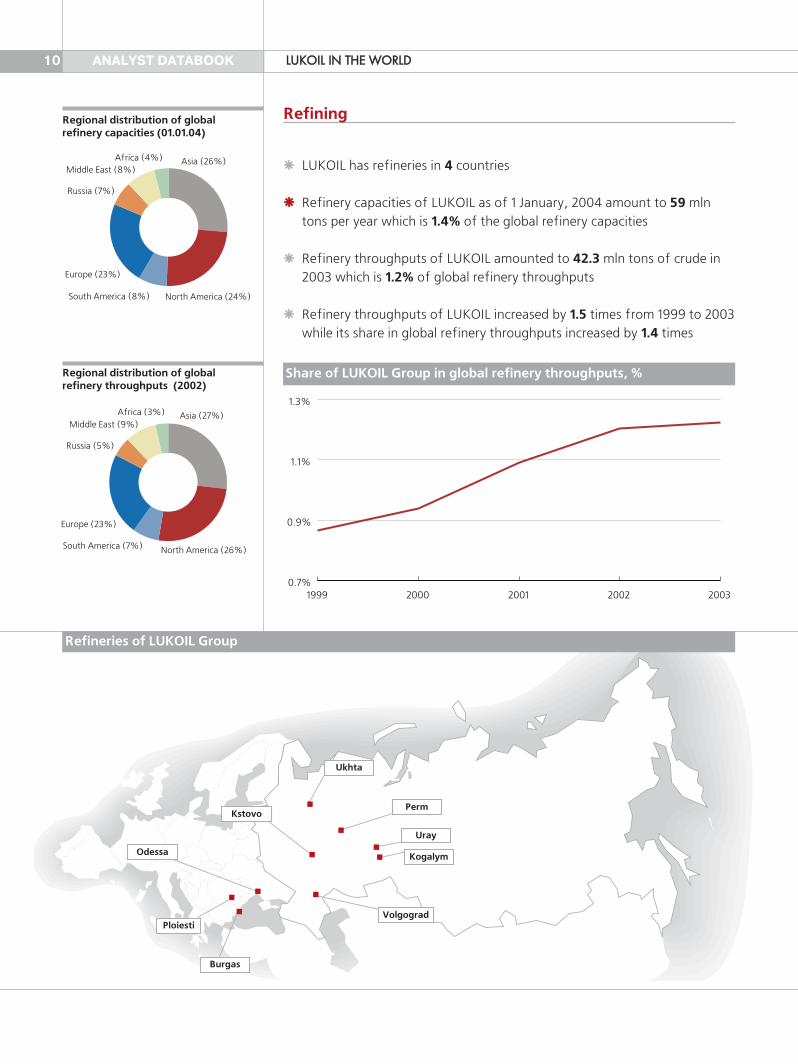
Refining
LUKOIL has refineries in 4 countries
Refinery capacities of LUKOIL as of 1 January, 2004 amount to 59 mlntons per year which is 1.4% of the global refinery capacities
Refinery throughputs of LUKOIL amounted to 42.3 mln tons of crude in2003 which is 1.2% of global refinery throughputs
Refinery throughputs of LUKOIL increased by 1.5 times from 1999 to 2003while its share in global refinery throughputs increased by 1.4 times
LLUUKKOOIILL IINN TTHHEE WWOORRLLDD
Asia (26%)
North America (24%)South America (8%)
Europe (23%)
Russia (7%)
Middle East (8%)Africa (4%)
Asia (27%)
North America (26%)South America (7%)
Europe (23%)
Russia (5%)
Middle East (9%)Africa (3%)
Regional distribution of globalrefinery capacities (01.01.04)
Regional distribution of globalrefinery throughputs (2002)
1999 2000 2001 2002 20030.7%
0.9%
1.1%
1.3%
Share of LUKOIL Group in global refinery throughputs, %
Perm
Uray
Kogalym
Ukhta
Kstovo
Volgograd
Odessa
Ploiesti
Burgas
Refineries of LUKOIL Group

Oil Exports
LUKOIL exported 37.7 mln tons of crude oil in 2003 which is 2% of globaloil exports
Share of LUKOIL Group in global oil exports increased by more than 1.2times from 1999 to 2003
11ANALYST DATABOOKLLUUKKOOIILL IINN TTHHEE WWOORRLLDD
1999 2000 2001 2002 20031.5%
1.7%
1.9%
2.1%
1999 2000 2001 2002 20037%
8%
9%
10%
11%
Share of LUKOIL Group in global oil exports, %
Share of Russia in global oil exports, %
Russia (10%)
OPEC countries (47%)
Other (43%)
Sources of global oil exports(2002)
LUKOIL (2.0%)
Other world (98.0%)
Share of LUKOIL Group in global oilexports (2003)
Germany
Poland
Slovakia
Czech Republic
Hungary
Butinge
Primorsk
Odessa
Novorossiysk
Gdansk
Tuapse
Main routes of oil exports

12 ANALYST DATABOOK LLUUKKOOIILL IINN RRUUSSSSIIAA
LUKOIL today is:
The 1st company in Russia by proven oil reserves
20% of Russian oil reserves
18.7% of Russian oil production
16.2% of Russian refinery capacities
18.9% of Russian refinery throughputs
19.5% of Russian oil exports
17.4% of Russian petroleum product exports
The major Russian oil business group with annual turnover
of over $20 bln
The most liquid oil stock and second most liquid stock
overall on the Russian Trading System
A leader among Russian oil companies for openness and
transparency. The first Russian company to receive full
listing on the London Stock Exchange
The only private Russian oil company whose share capital is
dominated by minority stakeholders
LUKOIL (20%)
Other companies (80%)
Share of LUKOIL Group in Russian oilreserves (01.01.04)
LUKOIL (18.7%)
Other companies (81.3%)
Share of LUKOIL Group in Russian oilproduction (2003)
LUKOIL (18.9%)
Other companies (81.1%)
Share of LUKOIL Group in Russianrefinery throughputs (2003)
LUKOIL (19.5%)
Other companies (80.5%)
Share of LUKOIL Group in Russian oilexports (2003)
LUKOIL (16.2%)
Other companies (83.8%)
LUKOIL (17.4%)
Other companies (82.6%)
Share of LUKOIL Group in Russianpetroleum product exports (2003)
Share of LUKOIL Group in Russianrefinery capacities (01.01.04)

13ANALYST DATABOOKLLUUKKOOIILL IINN RRUUSSSSIIAA
Proven oil reserves of LUKOIL Group in Russia as of 1 January, 2004amount to 15.5 bln barrels which is 20% of Russian oil reserves and 97.1%of overall oil reserves of the Group
Proven gas reserves of LUKOIL Group in Russia as of 1 January, 2004amount to 22.17 tcf which is 90.6% of overall gas reserves of the Group
Companies of LUKOIL Group produced 78.6 mln tons of crude oil inRussia in 2003 which is 18.7% of overall Russian oil production and 96.4%of oil production by the Company
Average Russian reserves to production ratio was 26.1 in 2002 while thatof LUKOIL Group was 27.1
Companies of LUKOIL Group produced 4.8 bcm of gas in Russia in 2003which is 0.8% of overall Russian gas production and 83.4% of gasproduction by the Company
LUKOIL holds 18% of Russian operating oil wellstock and 19% of Russianproducing oil wellstock
1999 2000 2001 2002 200318%
19%
20%
21%
22%
Share of oil production by LUKOIL Group in Russia in overall Russianproduction, %
1999 2000 2001 2002 200313%
15%
17%
19%
21%
Operating oil wellstock
Producing oil wellstock
Share of operating and producing oil wellstock of the Company inRussian operating and producing wellstock, %
International projects (2.9%)
Russia (97.1%)
Regional distribution of proven oilreserves of LUKOIL Group (01.01.04)
International projects (9.4%)
Russia (90.6%)
Regional distribution of proven gasreserves of LUKOIL Group (01.01.04)
International projects (3.6%)
Russia (96.4%)
Regional distribution of oil productionby LUKOIL Group (2003)
Reserves & Production

14 ANALYST DATABOOK
Share of idle wells in LUKOIL operating oil wellstock is below the Russianaverage
Watercut of LUKOIL oil wells is below the Russian average
Average flow rate of LUKOIL oil wells is above the Russian average
LLUUKKOOIILL IINN RRUUSSSSIIAA
1999 2000 2001 2002 200315%
19%
23%
27%
LUKOIL Russia
Share of idle wells in Russian oil wellstock and that of LUKOIL, %
1999 2000 2001 2002 200373%
75%
77%
79%
81%
83%
LUKOIL Russia
Watercut of Russian oil wells and LUKOIL oil wells, %
1999 2000 2001 2002 20037.4
7.9
8.4
8.9
9.4
9.9
LUKOIL Russia
Average flow rate of Russian oil wells and LUKOIL oil wells,tons per day
International projects (1.5%)
Russia (98.5%)
Regional distribution of operating oilwellstock of LUKOIL Group (01.01.04)
International projects (1.5%)
Russia (98.5%)
Regional distribution of producing oilwellstock of LUKOIL Group (01.01.04)
International projects (16.8%)
Russia (83.2%)
Regional distribution of gas productionby LUKOIL Group (2003)

15ANALYST DATABOOKLLUUKKOOIILL IINN RRUUSSSSIIAA
LUKOIL (16.2%)
Other companies (83.8%)
Capacity of Russian refineries ofLUKOIL Group in overall Russian
refinery capacities (01.01.04)
International projects (30.2%)
Russia (69.8%)
Regional distribution of refinerycapacities of LUKOIL Group
(01.01.04)
International projects (19.0%)
Russia (81.0%)
Regional distribution of refinerythroughputs of LUKOIL Group
(2003)
Overall capacity of Russian refineries of LUKOIL Group as of 1 January,2004 represents:
16.2% of overall Russian refinery capacities41.2 mln tons per year
Russian refineries of LUKOIL Group processed 34.3 mln tons of oil in 2003which is 18.9% of overall Russian throughputs
Share of LUKOIL Group in Russian refinery throughputs grew by 1.5 timesfrom 1999 to 2003
Capacity utilization rate of LUKOIL refineries was 83.3% in 2003 which isabove the Russian average of 71.5%
Depth of refining at LUKOIL refineries is above the Russian average
1999 2000 2001 2002 200312%
14%
16%
18%
20%
Share of Russian refineries of LUKOIL Group in overall Russian refinerythroughputs, %
1999 2000 2001 2002 200367%
69%
71%
73%
75%
77%
LUKOIL Russia
Depth of refining at LUKOIL refineries against the Russian average, %
Refining
16 ANALYST DATABOOK LLUUKKOOIILL IINN RRUUSSSSIIAA
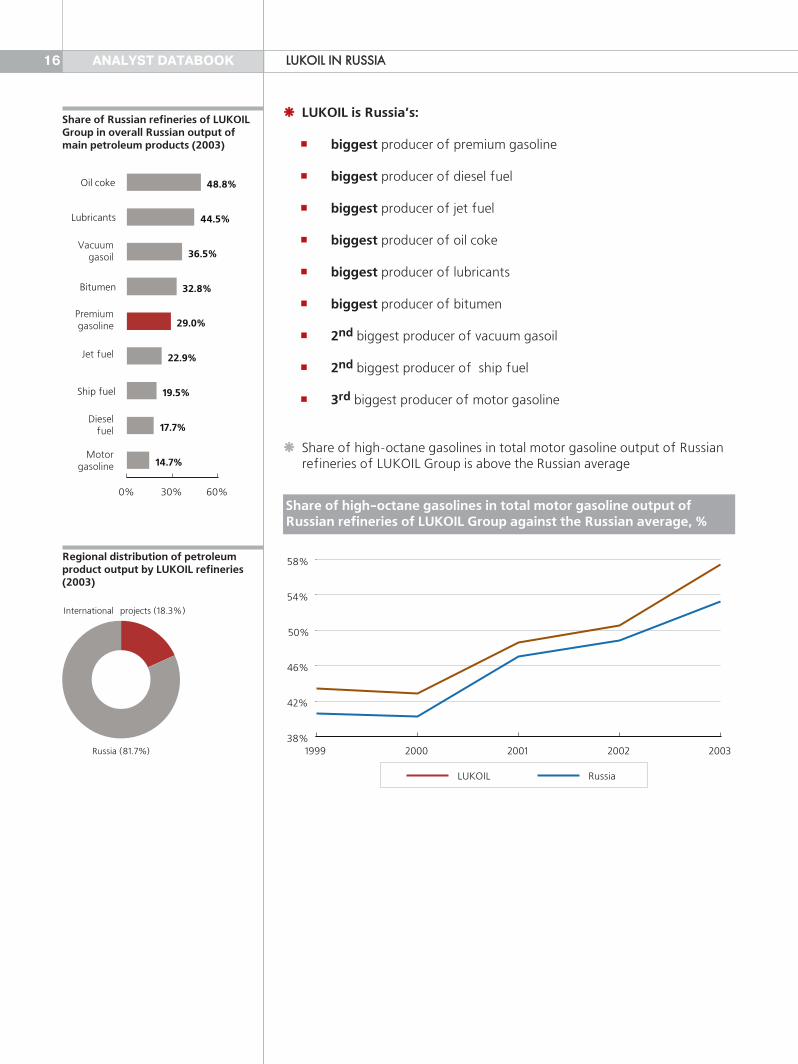
LUKOIL is Russia’s:
biggest producer of premium gasoline
biggest producer of diesel fuel
biggest producer of jet fuel
biggest producer of oil coke
biggest producer of lubricants
biggest producer of bitumen
2nd biggest producer of vacuum gasoil
2nd biggest producer of ship fuel
3rd biggest producer of motor gasoline
Share of high�octane gasolines in total motor gasoline output of Russianrefineries of LUKOIL Group is above the Russian average
1999 2000 2001 2002 200338%
42%
46%
50%
54%
58%
LUKOIL Russia
Share of high�octane gasolines in total motor gasoline output ofRussian refineries of LUKOIL Group against the Russian average, %
Ship fuel
Bitumen
Lubricants
Oil coke
0% 30% 60%
14.7%
17.7%
19.5%
22.9%
29.0%
32.8%
36.5%
44.5%
48.8%
Motorgasoline
Dieselfuel
Jet fuel
Vacuumgasoil
Premiumgasoline
Share of Russian refineries of LUKOILGroup in overall Russian output ofmain petroleum products (2003)
International projects (18.3%)
Russia (81.7%)
Regional distribution of petroleumproduct output by LUKOIL refineries(2003)

17ANALYST DATABOOKLLUUKKOOIILL IINN RRUUSSSSIIAA
LUKOIL exported 37.7 mln tons of crude oil in 2003 which is 19.5% ofRussian oil exports
LUKOIL exported 13.5 mln tons of petroleum products in 2003 which is17.4% of Russian petroleum product exports
Share of LUKOIL Group in Russian petroleum product exports grew bymore than 2 times from 1999 to 2003
1999 2000 2001 2002 200314%
18%
22%
26%
30%
Share of LUKOIL Group in Russian oil exports, %
1999 2000 2001 2002 20037%
10%
13%
16%
19%
22%
Share of LUKOIL Group in Russian petroleum product exports, %
1999 2000 2001 2002 200317%
18%
19%
20%
21%
22%
Share of LUKOIL Group in Russian exports of oil and petroleumproducts, %
LUKOIL (19.5%)
Other companies (80.5%)
Share of LUKOIL Groupin Russian oil exports
(2003)
LUKOIL (17.4%)
Other companies (82.6%)
Share of LUKOIL Group in Russianpetroleum product exports
(2003)
LUKOIL (18.9%)
Other companies (81.1%)
Share of LUKOIL Group in Russianexports of oil and petroleum products
(2003)
Oil & Petroleum Product Exports

18 ANALYST DATABOOK EEXXPPLLOORRAATTIIOONN && PPRROODDUUCCTTIIOONN
1999 2000 2001 2002 2003
2D seismic prospecting,km 11,862 14,289 16,832 10,891 14,597
3D seismic prospecting, km2 563 1,869 1,804 2,135 2,429
Vertical survey, wells 100 100 176 59 46
Geoelectrics, km 307 885 692 200 1,033
1999 2000 2001 2002 2003
Drilling, total 1,109 1,915 2,475 1,531 1,399
Exploration drilling 266 360 420 181 146
Production drilling 843 1,555 2,055 1,350 1,253
1999 2000 2001 2002 2003
Russia 248 339 413 168 141
Western Siberia 139 181 199 60 66
Timan�Pechora 13 40 73 38 29
Urals 52 54 65 10 8
Volga 31 47 56 39 21
including Caspian 4 5 7 7 2
Other 13 17 20 22 17
International projects 18 21 7 13 5
Total 266 360 420 181 146
Geological exploration
Regional distribution of exploration drilling, th. m
Drilling, th. m
1999 2000 2001 2002 20030
500
1,000
1,500
2,000
2,500
3D seismic prospecting, km2
Western Siberia (52%)Timan�Pechora (5%)
Urals (19%)
Volga (12%)
Other (5%)International projects (7%)
Regional distribution of explorationdrilling (1999)
1999 2000 2001 2002 20030
6
12
18
2D seismic prospecting, th. km
1999 2000 2001 2002 20030
300
600
900
1,200
Geoelectrics, km
Western Siberia (50%)Timan�Pechora (11%)
Urals (15%)
Volga (13%)
Other (5%)International projects (6%)
Regional distribution of explorationdrilling (2000)
Geological Exploration

19ANALYST DATABOOKEEXXPPLLOORRAATTIIOONN && PPRROODDUUCCTTIIOONN
1999 2000 2001 2002 2003
Oil 187 320 614 308 420
Gas 0 8 176 900 10
Total 187 328 790 1,208 430
1999 2000 2001 2002 2003
Exploration expenses 61 133 150 92 140
Exploration expenses, mln USD
1999 2000 2001 2002 2003
New fields put intooperation 9 5 17 10 14
New fields put into operation
Extensions and discoveries of proven hydrocarbon reserves, mln boe
1999 2000 2001 2002 20030
100
200
300
400
500
600
700
Extensions and discoveries of proven oil reserves, mln barrels
Western Siberia (47%)Timan�Pechora (17%)
Urals (16%)
Volga (13%)
Other (5%)International projects (2%)
Regional distribution of explorationdrilling (2001)
Western Siberia (33%)
Timan�Pechora (21%)Urals (6%)
Volga (21%)
Other (12%)
International projects (7%)
Regional distribution of explorationdrilling (2002)
Western Siberia (45%)Timan�Pechora (20%)
Urals (6%)
Volga (14%)
Other (12%)
International projects (3%)
Regional distribution of explorationdrilling (2003)
1999 2000 2001 2002 2003
Oil&gas fields 12 11 17 16 15
Oil&gas bearing strata 8 23 18 15 14
Newly discovered oil&gas fields and oil&gas�bearing strataat previously discovered fields
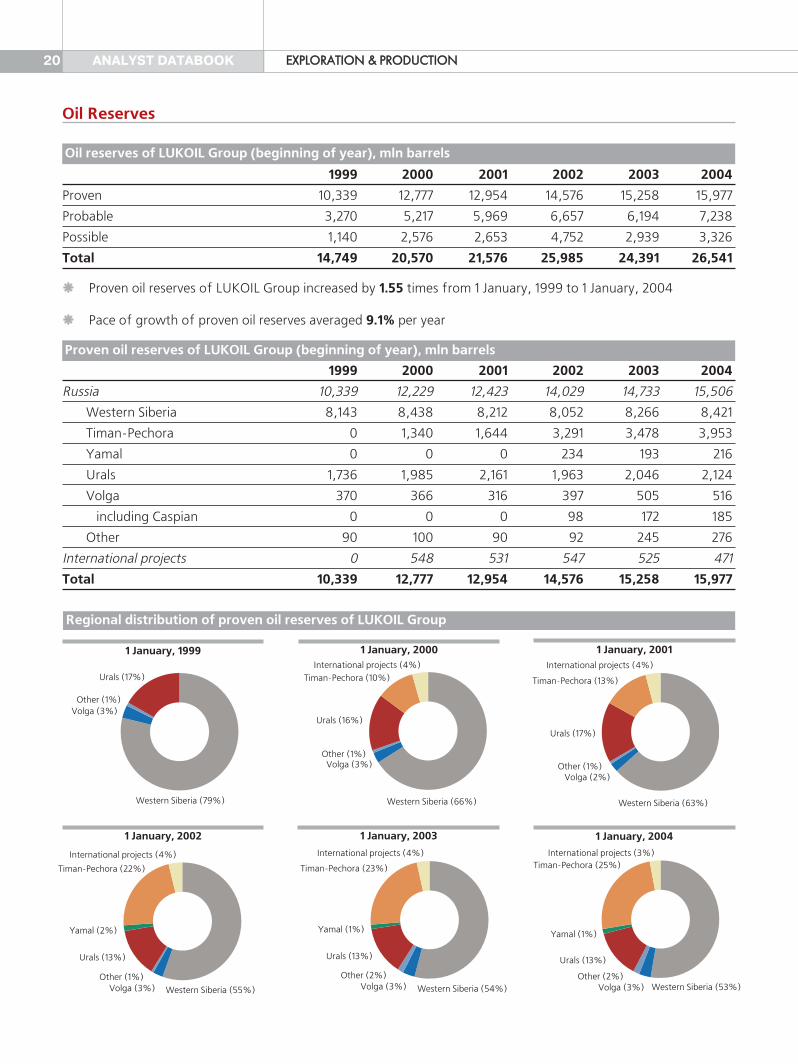
Proven oil reserves of LUKOIL Group increased by 1.55 times from 1 January, 1999 to 1 January, 2004
Pace of growth of proven oil reserves averaged 9.1% per year
Oil Reserves
20 ANALYST DATABOOK EEXXPPLLOORRAATTIIOONN && PPRROODDUUCCTTIIOONN
1999 2000 2001 2002 2003 2004
Proven 10,339 12,777 12,954 14,576 15,258 15,977
Probable 3,270 5,217 5,969 6,657 6,194 7,238
Possible 1,140 2,576 2,653 4,752 2,939 3,326
Total 14,749 20,570 21,576 25,985 24,391 26,541
1999 2000 2001 2002 2003 2004
Russia 10,339 12,229 12,423 14,029 14,733 15,506
Western Siberia 8,143 8,438 8,212 8,052 8,266 8,421
Timan�Pechora 0 1,340 1,644 3,291 3,478 3,953
Yamal 0 0 0 234 193 216
Urals 1,736 1,985 2,161 1,963 2,046 2,124
Volga 370 366 316 397 505 516
including Caspian 0 0 0 98 172 185
Other 90 100 90 92 245 276
International projects 0 548 531 547 525 471
Total 10,339 12,777 12,954 14,576 15,258 15,977
Oil reserves of LUKOIL Group (beginning of year), mln barrels
Proven oil reserves of LUKOIL Group (beginning of year), mln barrels
Regional distribution of proven oil reserves of LUKOIL Group
Western Siberia (79%)
Volga (3%)Other (1%)
Urals (17%)
1 January, 1999
Western Siberia (66%)
Volga (3%)Other (1%)
Urals (16%)
Timan�Pechora (10%)International projects (4%)
1 January, 2000
Western Siberia (54%)Volga (3%)Other (2%)
Urals (13%)
Yamal (1%)
Timan�Pechora (23%)
International projects (4%)
1 January, 2003
Western Siberia (53%)Volga (3%)Other (2%)
Urals (13%)
Yamal (1%)
Timan�Pechora (25%)International projects (3%)
1 January, 2004
Western Siberia (55%)Volga (3%)Other (1%)
Urals (13%)
Yamal (2%)
Timan�Pechora (22%)
International projects (4%)
1 January, 2002
Western Siberia (63%)
Volga (2%)Other (1%)
Urals (17%)
Timan�Pechora (13%)
International projects (4%)
1 January, 2001

21ANALYST DATABOOKEEXXPPLLOORRAATTIIOONN && PPRROODDUUCCTTIIOONN
Proven oil reserves of LUKOIL Group, bln barrels
1999 2000 2001 2002 200310
12
14
16
1999 2000 2001 2002 20030
150
300
450
600
Proven oil reserves in international projects, mln barrels
Shakh�Deniz (2%)
Kumkol (23%)
Tengiz and Korolev (22%)Karachaganak (49%)
Meleiha (1%)WEEM (3%)
1999 2000 2001 2002 200313
18
23
28
1999 2000 2001 2002 2003
Reserves on 1 January 10,339 12,777 12,954 14,576 15,258
Extensions and discoveries 187 320 614 308 420
Production (453) (533) (542) (564) (592)
Acquisition and sale of reserves, revision of previous estimates 2,704 390 1,550 938 891
Reserves on 31 December 12,777 12,954 14,576 15,258 15,977
1999 2000 2001 2002 2003 2004
Azerbaijan
Azeri Chirag Gyuneshli — 127 102 120 78 Sold
Shakh�Deniz — — — — — 7
Kazakhstan
Tengiz and Korolev — 75 73 98 95 106
Kumkol — 100 91 85 96 107
Karachaganak — 243 262 240 231 232
Egypt
Meleiha — 3 3 4 8 4
WEEM — — — — 17 15
Total 0 548 531 547 525 471
Proven oil reserves in internationalprojects (01.01.04)
* Proven, probable and possible
Total oil reserves of LUKOIL Group byall categories*, bln barrels
Factors in changes of proven oil reserves of LUKOIL Group, mln barrels
Proven oil reserves in international projects (beginning of year), mln barrels

22 ANALYST DATABOOK EEXXPPLLOORRAATTIIOONN && PPRROODDUUCCTTIIOONN
Proven gas reserves of LUKOIL Group increased by 14.6 times from 1 January, 1999 to 1 January, 2004
Pace of growth of proven gas reserves averaged 71% per year
1999 2000 2001 2002 2003 2004
Proven 1,672 3,907 3,625 13,216 24,164 24,473
Probable 549 1,264 1,099 3,524 8,960 14,616
Possible 184 1,384 453 4,093 2,493 3,548
Total 2,405 6,555 5,177 20,833 35,617 42,637
1999 2000 2001 2002 2003 2004
Russia 1,672 2,124 1,759 11,392 22,432 22,167
Western Siberia 1,328 1,268 1,191 1,236 1,082 1,284
Timan�Pechora 0 467 263 488 460 577
Yamal 0 0 0 8,223 13,822 13,806
Urals 182 200 243 420 707 568
Volga 161 188 61 1,023 6,359 5,926
including Caspian 0 0 0 957 6,331 5,763
Other 1 1 1 2 2 6
International projects 0 1,783 1,866 1,824 1,732 2,306
Total 1,672 3,907 3,625 13,216 24,164 24,473
Gas reserves of LUKOIL Group (beginning of year), bcf
Proven gas reserves of LUKOIL Group (beginning of year), bcf
Regional distribution of proven gas reserves of LUKOIL Group
Western Siberia (79%)
Volga (10%)
Urals (11%)
1 January, 1999
Volga (5%)Urals (5%)
Western Siberia (32%)Timan�Pechora (12%)
International projects (46%)
1 January, 2000
Volga (26%)
Urals (3%)
Western Siberia (5%)Timan�Pechora (2%)
International projects (7%)
Yamal (57%)
1 January, 2003
Volga (24%)
Urals (2%)
Western Siberia (5%)
Timan�Pechora (2%)
International projects (10%)
Yamal (57%)
1 January, 2004
Volga (8%)Urals (3%)
Western Siberia (9%)
Timan�Pechora (4%)
International projects (14%)
Yamal (62%)
1 January, 2002
Volga (2%)Urals (7%)
Western Siberia (33%)Timan�Pechora (7%)
International projects (51%)
1 January, 2001
Gas Reserves
23ANALYST DATABOOKEEXXPPLLOORRAATTIIOONN && PPRROODDUUCCTTIIOONN
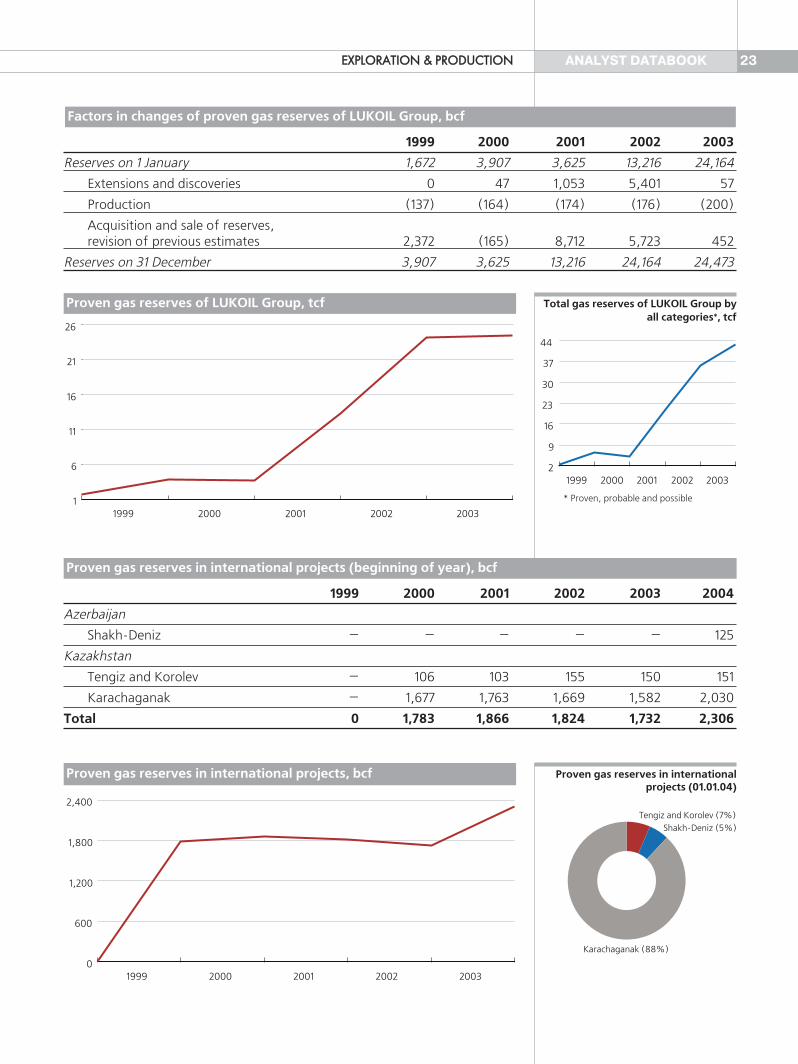
Proven gas reserves of LUKOIL Group, tcf
Proven gas reserves in international projects, bcf
Tengiz and Korolev (7%)Shakh�Deniz (5%)
Karachaganak (88%)
1999 2000 2001 2002 20032
9
16
23
30
37
44
1999 2000 2001 2002 20031
6
11
16
21
26
1999 2000 2001 2002 20030
600
1,200
1,800
2,400
1999 2000 2001 2002 2003
Reserves on 1 January 1,672 3,907 3,625 13,216 24,164
Extensions and discoveries 0 47 1,053 5,401 57
Production (137) (164) (174) (176) (200)
Acquisition and sale of reserves, revision of previous estimates 2,372 (165) 8,712 5,723 452
Reserves on 31 December 3,907 3,625 13,216 24,164 24,473
1999 2000 2001 2002 2003 2004
Azerbaijan
Shakh�Deniz — — — — — 125
Kazakhstan
Tengiz and Korolev — 106 103 155 150 151
Karachaganak — 1,677 1,763 1,669 1,582 2,030
Total 0 1,783 1,866 1,824 1,732 2,306
Total gas reserves of LUKOIL Group byall categories*, tcf
Proven gas reserves in internationalprojects (01.01.04)
* Proven, probable and possible
Factors in changes of proven gas reserves of LUKOIL Group, bcf
Proven gas reserves in international projects (beginning of year), bcf
24 ANALYST DATABOOK EEXXPPLLOORRAATTIIOONN && PPRROODDUUCCTTIIOONN
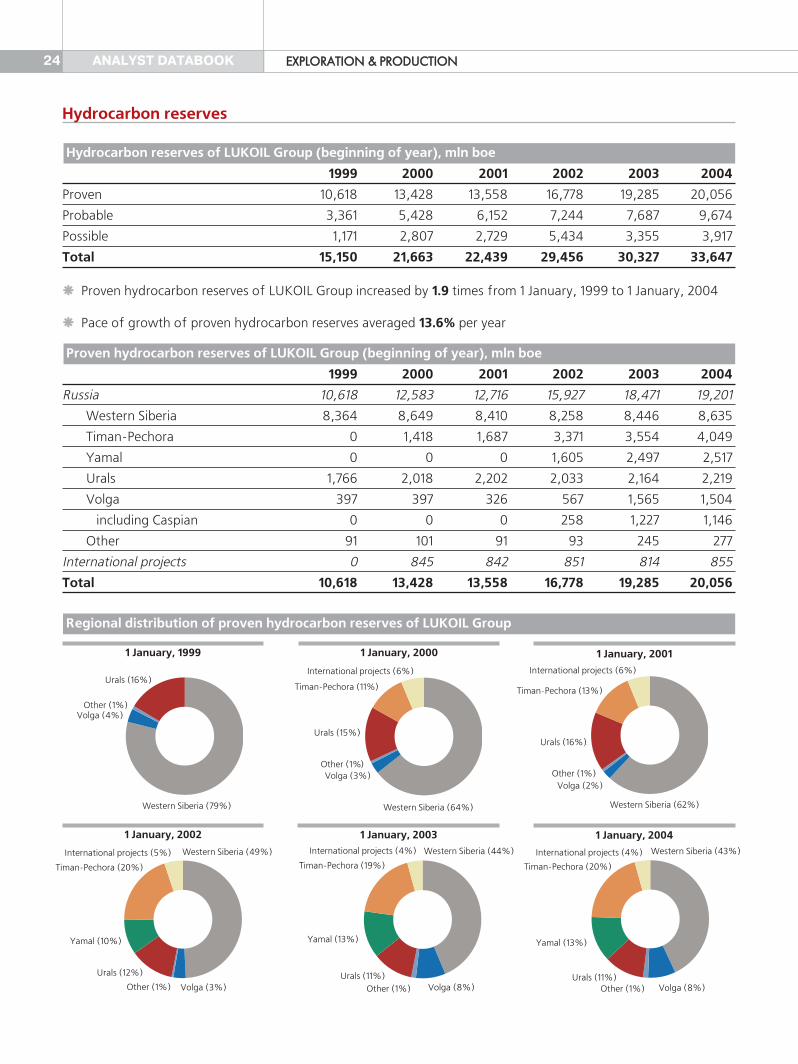
Proven hydrocarbon reserves of LUKOIL Group increased by 1.9 times from 1 January, 1999 to 1 January, 2004
Pace of growth of proven hydrocarbon reserves averaged 13.6% per year
1999 2000 2001 2002 2003 2004
Proven 10,618 13,428 13,558 16,778 19,285 20,056
Probable 3,361 5,428 6,152 7,244 7,687 9,674
Possible 1,171 2,807 2,729 5,434 3,355 3,917
Total 15,150 21,663 22,439 29,456 30,327 33,647
1999 2000 2001 2002 2003 2004
Russia 10,618 12,583 12,716 15,927 18,471 19,201
Western Siberia 8,364 8,649 8,410 8,258 8,446 8,635
Timan�Pechora 0 1,418 1,687 3,371 3,554 4,049
Yamal 0 0 0 1,605 2,497 2,517
Urals 1,766 2,018 2,202 2,033 2,164 2,219
Volga 397 397 326 567 1,565 1,504
including Caspian 0 0 0 258 1,227 1,146
Other 91 101 91 93 245 277
International projects 0 845 842 851 814 855
Total 10,618 13,428 13,558 16,778 19,285 20,056
Hydrocarbon reserves of LUKOIL Group (beginning of year), mln boe
Proven hydrocarbon reserves of LUKOIL Group (beginning of year), mln boe
Regional distribution of proven hydrocarbon reserves of LUKOIL Group
Western Siberia (79%)
Volga (4%)Other (1%)
Urals (16%)
1 January, 1999
Western Siberia (64%)
Volga (3%)Other (1%)
Urals (15%)
Timan�Pechora (11%)
International projects (6%)
1 January, 2000
Western Siberia (44%)
Volga (8%)Other (1%)Urals (11%)
Yamal (13%)
Timan�Pechora (19%)
International projects (4%)
1 January, 2003Western Siberia (43%)
Volga (8%)Other (1%)Urals (11%)
Yamal (13%)
Timan�Pechora (20%)
International projects (4%)
1 January, 2004
Western Siberia (49%)
Volga (3%)Other (1%)
Urals (12%)
Yamal (10%)
Timan�Pechora (20%)
International projects (5%)
1 January, 2002
Western Siberia (62%)
Volga (2%)Other (1%)
Urals (16%)
Timan�Pechora (13%)
International projects (6%)
1 January, 2001
Hydrocarbon reserves

1999 2000 2001 2002 20030
300
600
900
ANALYST DATABOOK
1999 2000 2001 2002 2003
Reserves on 1 January 10,618 13,428 13,558 16,778 19,285
Extensions and discoveries 187 328 790 1,208 430
Production (476) (560) (571) (593) (625)
Acquisition and sale of reserves, revision of previous estimates 3,099 362 3,001 1,892 966
Reserves on 31 December 13,428 13,558 16,778 19,285 20,056
25EEXXPPLLOORRAATTIIOONN && PPRROODDUUCCTTIIOONN
Proven hydrocarbon reserves of LUKOIL Group, bln boe
Proven hydrocarbon reserves in international projects, mln boe
Tengiz and Korolev (15%)
Kumkol (12%)
WEEM (2%)Meleiha (1%)
Shakh�Deniz (3%)
Karachaganak (67%)
1999 2000 2001 2002 200314
19
24
29
34
1999 2000 2001 2002 200310
13
16
19
22
1999 2000 2001 2002 2003 2004
Azerbaijan
Azeri Chirag Gyuneshli — 126 102 119 79 Sold
Shakh�Deniz — — — — — 27
Kazakhstan
Tengiz and Korolev — 93 90 124 120 131
Kumkol — 100 91 85 96 107
Karachaganak — 523 556 519 494 571
Egypt
Meleiha — 3 3 4 8 4
WEEM — — — — 17 15
Total 0 845 842 851 814 855
Total hydrocarbon reserves of LUKOILGroup by all categories*, bln boe
Proven hydrocarbon reservesin international projects (01.01.04)
* Proven, probable and possible
Factors in changes of proven hydrocarbon reserves of LUKOIL Group, mln boe
Proven hydrocarbon reserves in international projects (beginning of year), mln boe

ANALYST DATABOOK26 EEXXPPLLOORRAATTIIOONN && PPRROODDUUCCTTIIOONN
1998 1999 2000 2001 2002 20030%
20%
40%
60%
80%
100%
Oil wells
Injection wells
Temporarily closed wells
Liquidated wells
Test and pressureobservation wells
Gas wells
Steam injection wells
Water wells
Other
Drilled wellstock of LUKOIL
1999 2000 2001 2002 2003 2004
Russia 22,376 25,715 26,938 28,142 28,138 26,812
Western Siberia 14,776 15,163 15,721 16,473 16,686 15,436
Timan�Pechora — 2,957 3,242 3,389 3,388 3,395
Volga — 1,063 979 1,238 1,166 1,114
Urals — 6,071 6,475 6,555 6,398 6,343
Other — 461 521 487 500 524
International projects 214 250 276 323 388 409
Total 22,590 25,965 27,214 28,465 28,526 27,221
199
8
199
9
200
0
200
1
200
2
200
340
45
50
55
60
Drilled wellstock of LUKOIL, th. wells
199
8
199
9
200
0
200
1
200
2
200
3
0
20
40
60
80
Steam injection wellstock, wells
International projects (8%)
Timan�Pechora (8%)
Urals (9%)
Other (3%)
Western Siberia (72%)
Regional distribution of productiondrilling (2003)
Regional distribution of production drilling, th. m
Field Development
Operating oil wellstock (beginning of year), wells
1999 2000 2001 2002 2003
Russia 801 1,495 1,975 1,191 1,149
Western Siberia 604 1,063 1,438 913 899
Timan�Pechora 52 203 244 114 97
Urals 108 157 203 113 109
Volga 1 3 3 1 4
Other 36 69 88 50 39
International projects 42 60 80 159 104
Total 843 1,555 2,055 1,350 1,253

27ANALYST DATABOOKEEXXPPLLOORRAATTIIOONN && PPRROODDUUCCTTIIOONN
1999 2000 2001 2002 200321
23
25
27
29
Operating oil wellstock, th. wells
1999 2000 2001 2002 2003 2004
Russia 18,526 20,963 22,629 23,860 22,735 21,844
Western Siberia 11,631 12,348 13,210 13,970 13,350 12,721
Timan�Pechora — 1,655 1,992 2,133 2,080 1,990
Volga — 1,006 925 1,182 1,064 1,045
Urals — 5,525 6,003 6,104 5,776 5,582
Other — 429 499 471 465 506
International projects 185 205 237 266 315 328
Total 18,711 21,168 22,866 24,126 23,050 22,172
International projects (2%)Timan�Pechora (12%)
Urals (23%)
Volga (4%)Other (2%)
Western Siberia (57%)
International projects (2%)Timan�Pechora (9%)
Urals (25%)
Volga (5%)Other (2%)
Western Siberia (57%)
Regional distribution of operating oilwellstock (01.01.04)
1999 2000 2001 2002 200317
19
21
23
25
Producing oil wellstock, th. wells Regional distribution of producing oilwellstock (01.01.04)
1999 2000 2001 2002 2003 2004
Russia 17.2 18.5 16.0 15.2 19.2 18.5
International projects 13.6 18.0 14.1 17.7 18.1 19.8
Total 17.2 18.5 16.0 15.2 19.2 18.6
Share of idle wells in operating oil wellstock (beginning of year), %
Producing oil wellstock (beginning of year), wells
ANALYST DATABOOK28
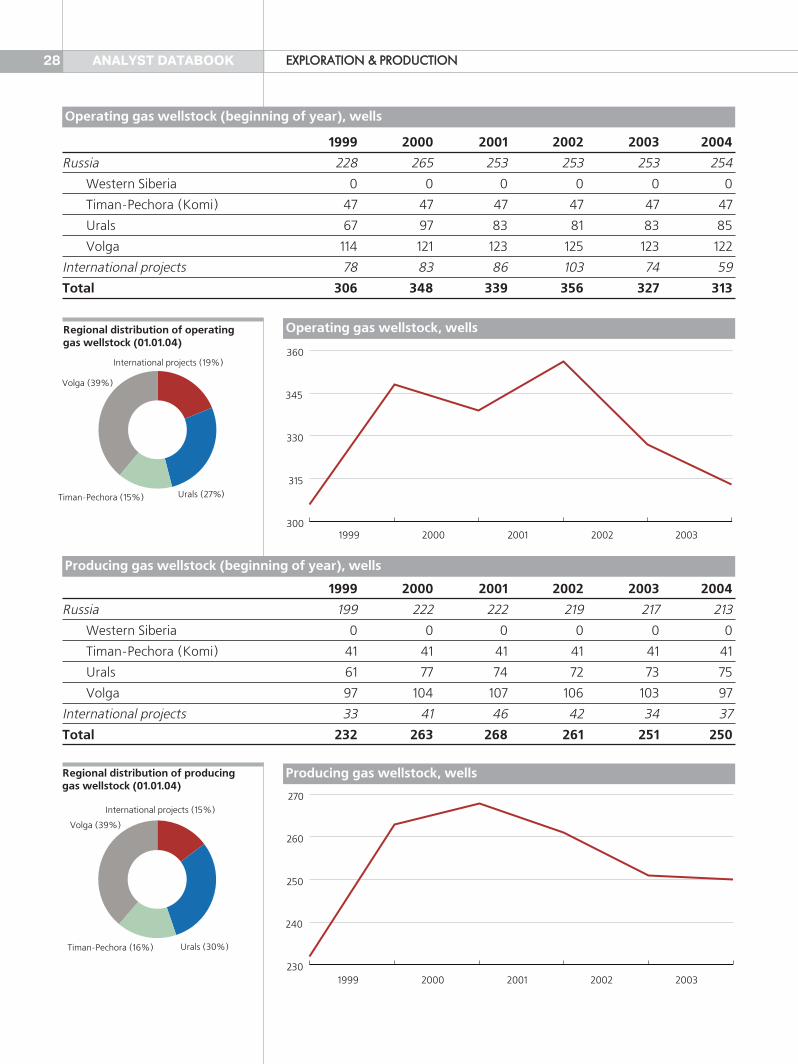
1999 2000 2001 2002 2003 2004
Russia 228 265 253 253 253 254
Western Siberia 0 0 0 0 0 0
Timan�Pechora (Komi) 47 47 47 47 47 47
Urals 67 97 83 81 83 85
Volga 114 121 123 125 123 122
International projects 78 83 86 103 74 59
Total 306 348 339 356 327 313
1999 2000 2001 2002 2003 2004
Russia 199 222 222 219 217 213
Western Siberia 0 0 0 0 0 0
Timan�Pechora (Komi) 41 41 41 41 41 41
Urals 61 77 74 72 73 75
Volga 97 104 107 106 103 97
International projects 33 41 46 42 34 37
Total 232 263 268 261 251 250
1999 2000 2001 2002 2003300
315
330
345
360
Operating gas wellstock, wells
International projects (19%)
Urals (27%)Timan�Pechora (15%)
Volga (39%)
Regional distribution of operatinggas wellstock (01.01.04)
1999 2000 2001 2002 2003230
240
250
260
270
Producing gas wellstock, wells
International projects (15%)
Urals (30%)Timan�Pechora (16%)
Volga (39%)
Regional distribution of producinggas wellstock (01.01.04)
EEXXPPLLOORRAATTIIOONN && PPRROODDUUCCTTIIOONN
Operating gas wellstock (beginning of year), wells
Producing gas wellstock (beginning of year), wells

ANALYST DATABOOK 29
1999 2000 2001 2002 2003 2004
Russia 12.7 16.2 12.3 13.4 14.2 16.1
International projects 57.7 50.6 46.5 59.2 54.1 37.3
Total 24.2 24.4 20.9 26.7 23.2 20.1
1999 2000 2001 2002 2003 2004
Operating wellstock 6,982 7,143 7,332 7,505 7,701 7,848
Wells under pressure 3,948 4,389 4,641 4,847 5,116 5,196
Share of idle wells, % 43.5 38.6 36.7 35.4 33.6 33.8
1999 2000 2001 2002 2003
New oil wells 351 704 930 710 590
New oil wells put into operation, wells
1999 2000 2001 2002 20030
200
400
600
800
1,000
New oil wells put into operation, wells
1999 2000 2001 2002 20033.8
4.3
4.8
5.3
EEXXPPLLOORRAATTIIOONN && PPRROODDUUCCTTIIOONN
1999 2000 2001 2002 20036.5
7.0
7.5
8.0
Operating injection wellstock, th. wells
Share of idle wells in operating gas wellstock (beginning of year), %
Injection wellstock (beginning of year), wells
Injection wells under pressure,th. wells

ANALYST DATABOOK
“Kogalymneftegas”
“Nizhnevolzhskneft”
“Kalinigradmorneft”
“LUKOIL�Perm”“LUKOIL�Permneft”
“Urayneftegas”
“Arkhangelskgeoldobycha”
“LUKOIL�Komi”
“Langepasneftegas”“Pokachevneftegas”
30
Oil production by LUKOIL Group*
1999 2000 2001 2002 2003
Th. tons 61,864 72,366 73,884 76,976 80,226
Mln barrels 453 533 542 564 592
Th. tons per day 169 198 202 211 220
Th. barrels per day 1,242 1,456 1,485 1,545 1,623
Oil production by LUKOIL Group*, mln barrels
1999 2000 2001 2002 2003
Subsidiaries 396 510 515 522 560
Russia 389 502 507 512 552
International projects 7 8 8 10 8
LUKOIL’s share in affiliated companies 57 23 27 42 32
Total Group production 453 533 542 564 592
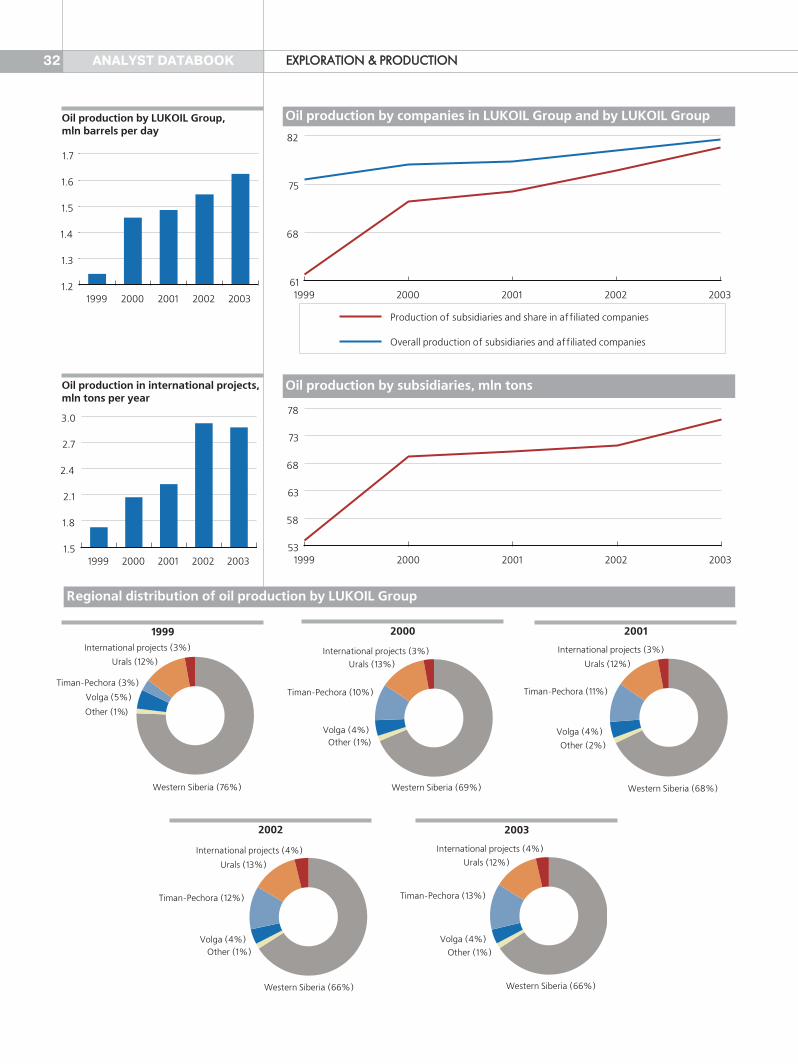
Overall oil production by companies in LUKOIL Group, th. tons
1999 2000 2001 2002 2003
Total production 75,589 77,741 78,236 79,850 81,501
Including:
subsidiaries 54,055 69,227 70,196 71,275 76,072
affiliated companies 21,534 8,514 8,040 8,575 5,429
LUKOIL’s share in affiliated companies 7,809 3,139 3,688 5,701 4,154
EEXXPPLLOORRAATTIIOONN && PPRROODDUUCCTTIIOONN
* Subsidiaries and share in affiliated companies.
Main oil producing regions of LUKOIL in Russia
Oil Production
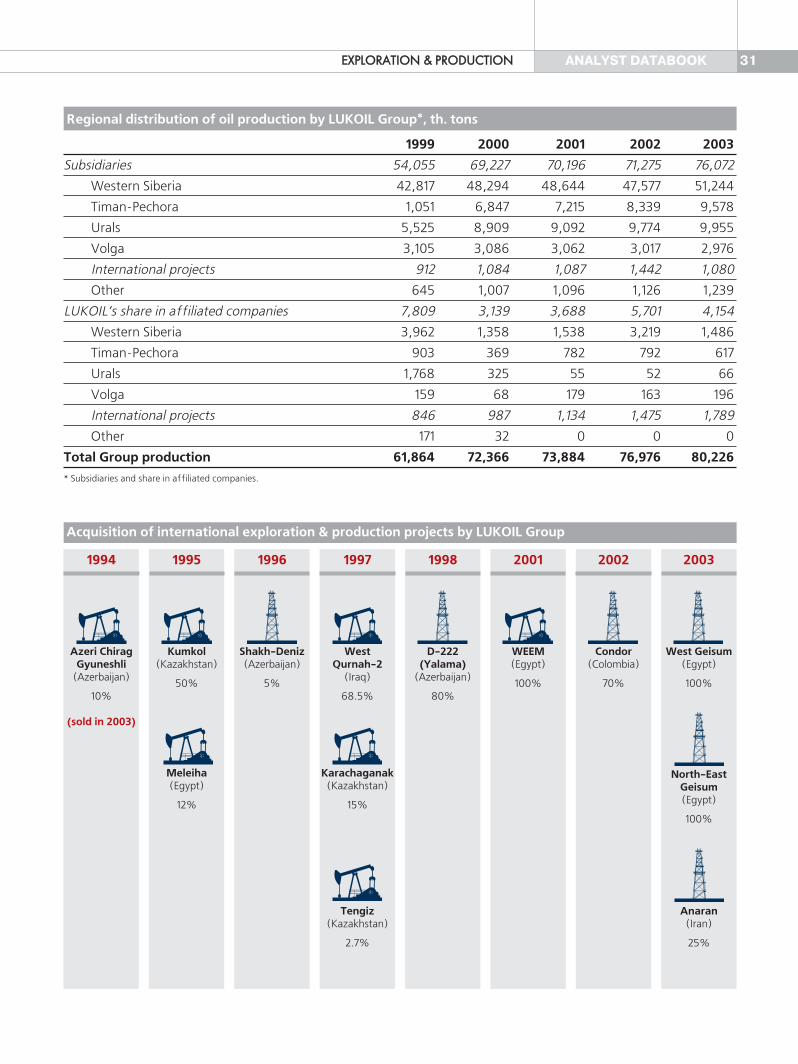
1999 2000 2001 2002 2003
Subsidiaries 54,055 69,227 70,196 71,275 76,072
Western Siberia 42,817 48,294 48,644 47,577 51,244
Timan�Pechora 1,051 6,847 7,215 8,339 9,578
Urals 5,525 8,909 9,092 9,774 9,955
Volga 3,105 3,086 3,062 3,017 2,976
International projects 912 1,084 1,087 1,442 1,080
Other 645 1,007 1,096 1,126 1,239
LUKOIL’s share in affiliated companies 7,809 3,139 3,688 5,701 4,154
Western Siberia 3,962 1,358 1,538 3,219 1,486
Timan�Pechora 903 369 782 792 617
Urals 1,768 325 55 52 66
Volga 159 68 179 163 196
International projects 846 987 1,134 1,475 1,789
Other 171 32 0 0 0
Total Group production 61,864 72,366 73,884 76,976 80,226
Azeri ChiragGyuneshli
(Azerbaijan)
10%
(sold in 2003)
1994
Kumkol(Kazakhstan)
50%
1995
Shakh�Deniz(Azerbaijan)
5%
1996
WestQurnah�2
(Iraq)
68.5%
1997
D�222(Yalama)
(Azerbaijan)
80%
1998
WEEM(Egypt)
100%
2001
Condor(Colombia)
70%
2002
West Geisum(Egypt)
100%
Meleiha(Egypt)
12%
Karachaganak(Kazakhstan)
15%
North�EastGeisum(Egypt)
100%
Tengiz(Kazakhstan)
2.7%
Anaran(Iran)
25%
2003
Acquisition of international exploration & production projects by LUKOIL Group
* Subsidiaries and share in affiliated companies.
31ANALYST DATABOOK
Regional distribution of oil production by LUKOIL Group*, th. tons
EEXXPPLLOORRAATTIIOONN && PPRROODDUUCCTTIIOONN
ANALYST DATABOOK32
1999 2000 2001 2002 200361
68
75
82
Production of subsidiaries and share in affiliated companies
Overall production of subsidiaries and affiliated companies
Oil production by companies in LUKOIL Group and by LUKOIL Group
1999 2000 2001 2002 200353
58
63
68
73
78
Oil production by subsidiaries, mln tons
2000
2003
Western Siberia (69%)
Other (1%)Volga (4%)
Timan�Pechora (10%)
Urals (13%)
International projects (3%)
Western Siberia (68%)
Other (2%)
Volga (4%)
Timan�Pechora (11%)
Urals (12%)
International projects (3%)
Western Siberia (66%)
Other (1%)
Volga (4%)
Timan�Pechora (13%)
Urals (12%)
International projects (4%)
2001
1999 2000 2001 2002 20031.2
1.3
1.4
1.5
1.6
1.7
Oil production by LUKOIL Group,mln barrels per day
1999 2000 2001 2002 20031.5
1.8
2.1
2.4
2.7
3.0
Oil production in international projects,mln tons per year
EEXXPPLLOORRAATTIIOONN && PPRROODDUUCCTTIIOONN
Regional distribution of oil production by LUKOIL Group
2002
Western Siberia (66%)
Other (1%)Volga (4%)
Timan�Pechora (12%)
Urals (13%)
International projects (4%)
1999
Western Siberia (76%)
Other (1%)
Volga (5%)
Timan�Pechora (3%)
Urals (12%)
International projects (3%)

33ANALYST DATABOOKEEXXPPLLOORRAATTIIOONN && PPRROODDUUCCTTIIOONN
1999 2000 2001 2002 2003
Mln USD 677 1,229 1,411 1,355 1,458
USD per barrel 1.71 2.41 2.74 2.60 2.61
Oil production costs
1999 2000 2001 2002 2003
New wells 29.9 25.9 24.4 27.7 35.7
Old wells 9.3 9.2 8.4 8.8 9.4
Whole wellstock 9.5 9.4 8.6 9.0 9.7
Western Siberia 11.4 10.8 10.2 10.2 11.2
Timan�Pechora – 39.1 13.4 34.9 14.5
Volga 24.3 23.8 21.0 20.9 21.0
Urals 5.4 5.5 5.7 5.4 8.0
Internationalprojects 38.5 35.8 – – –
Other 7.6 7.7 6.9 7.2 7.2
Average flow rate of oil wells, tons per day
1999 2000 2001 2002 2003
New wells 22.3 20.3 22.3 19.7 18.4
Old wells 73.7 75.6 77.5 77.7 77.2
Whole wellstock 73.3 75.2 76.9 77.1 76.6
Western Siberia 75.1 77.4 78.6 79.1 78.7
Timan�Pechora — 69.2 75.3 74.7 72.1
Volga 58.4 56.0 62.8 62.7 62.4
Urals 68.0 68.8 70.1 69.8 70.8
Internationalprojects 2.0 3.1 — — —
Other 72.6 72.3 74.8 67.6 67.2
Watercut of oil wells, %
Average flow rate of oil wells, tons per day
1999 2000 2001 2002 20030
1
2
3
Oil production costs, USD per barrel
1999 2000 2001 2002 200320
24
28
32
36
Average flow rate of new oil wells,tons per day
1999 2000 2001 2002 200372%
74%
76%
78%
Watercut of oil wells, %
1999 2000 2001 2002 20038.5
9.0
9.5
10.0

34 ANALYST DATABOOK EEXXPPLLOORRAATTIIOONN && PPRROODDUUCCTTIIOONN
Reserves to production ratio of LUKOIL Group (end of year)
1999 2000 2001 2002 2003
Western Siberia 24.6 21.9 22.0 22.2 21.6
Timan�Pechora 93.6 36.1 55.7 52.0 52.5
Yamal — — — — —
Volga 37.1 33.6 29.0 28.4 28.7
Urals 15.3 12.7 16.7 21.7 22.1
International projects 43.3 35.0 29.9 24.6 22.2
Other 16.8 10.9 10.0 29.7 30.1
Total 28.2 24.3 26.8 27.1 27.0
Overall gas production by companies in LUKOIL Group, mcm
1999 2000 2001 2002 2003
Total production 4,724 5,013 5,233 5,135 5,716
Including:
subsidiaries 3,464 4,284 4,639 4,678 5,411
affiliated companies 1,260 729 594 457 305
LUKOIL’s share in affiliated companies 411 371 292 298 253
Gas production by LUKOIL Group*
1999 2000 2001 2002 2003
Mcm 3,875 4,655 4,931 4,976 5,664
Bcf 137 164 174 176 200
Mln boe 22.8 27.3 29.0 29.3 33.3
Mcm per day 10.6 12.8 13.5 13.6 15.5
Mcf per day 375 449 477 481 548
Th. boe per day 62.5 74.9 79.5 80.2 91.3
Regional distribution of gas production by LUKOIL Group*, mcm
1999 2000 2001 2002 2003
Subsidiaries 3,464 4,284 4,639 4,678 5,411
Russia 2,964 3,637 4,108 4,002 4,630
International projects 500 647 531 676 781
LUKOIL’s share in affiliated companies 411 371 292 298 253
Russia 330 272 153 135 83
International projects 81 99 139 163 170
Total Group production 3,875 4,655 4,931 4,976 5,664
* Subsidiaries and share in affiliated companies.
Gas Production

35ANALYST DATABOOKEEXXPPLLOORRAATTIIOONN && PPRROODDUUCCTTIIOONN
1999 2000 2001 2002 2003
Subsidiaries 123 151 164 165 192
Russia 105 128 145 141 164
International projects 18 23 19 24 28
LUKOIL’s share in affiliated companies 14 13 10 11 8
Total Group production 137 164 174 176 200
Gas production by companies in LUKOIL Group and by LUKOIL Group
1999 2000 2001 2002 20033.8
4.2
4.6
5.0
5.4
5.8
Production of subsidiaries and share in affiliated companies
Overall production of subsidiaries and affiliated companies
Gas production by subsidiaries, bcm
1999 2000 2001 2002 20033.2
4.0
4.8
5.6
Gas production by LUKOIL Group(2002)
International projects (16.9%)
Russia (83.1%)
Gas production by LUKOIL Group(1999)
International projects (15.0%)
Russia (85.0%)
Gas production by LUKOIL Group(2000)
International projects (16.0%)
Russia (84.0%)
Gas production by LUKOIL Group(2001)
International projects (13.6%)
Russia (86.4%)
Gas production by LUKOIL Group(2003)
International projects (16.8%)
Russia (83.2%)
* Subsidiaries and share in affiliated companies.
Regional distribution of gas production by LUKOIL Group*, bcf
36 ANALYST DATABOOK RREEFFIINNIINNGG && GGAASS PPRROOCCEESSSSIINNGG
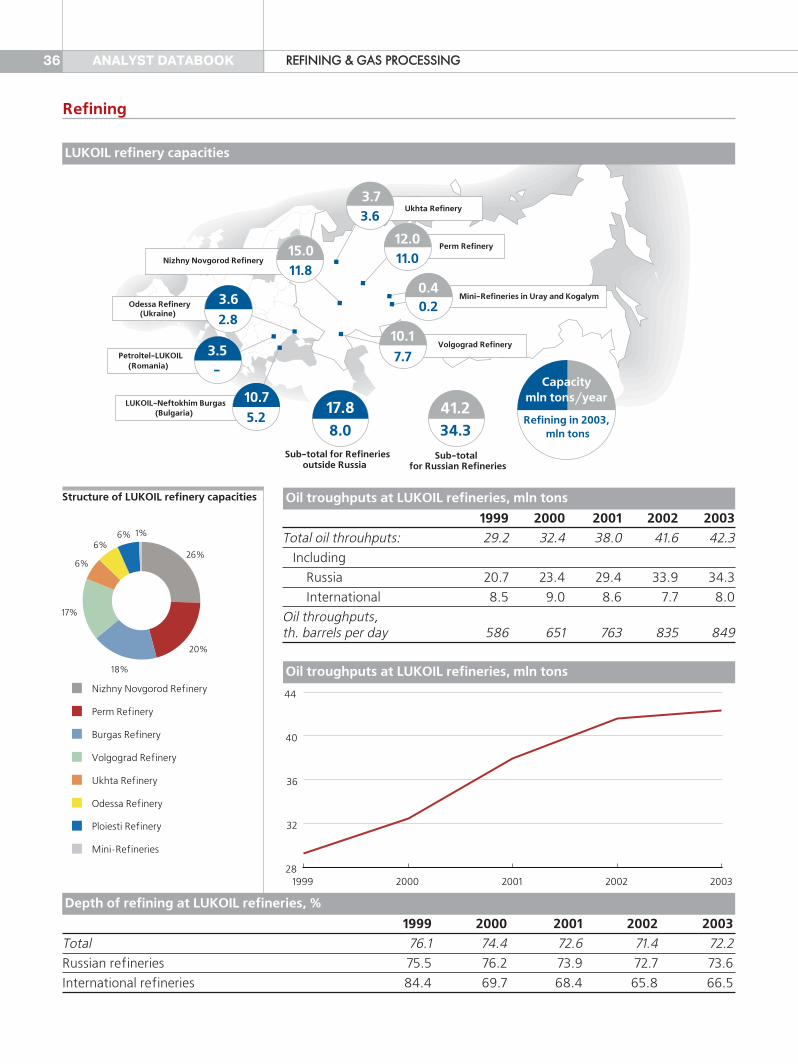
Nizhny Novgorod Refinery
Odessa Refinery
8.0 34.3
11.811.0
3.6
0.2
7.7�
LUKOIL�Neftokhim Burgas
5.2
2.8
Ukhta Refinery
15.0
(Ukraine)
3.6
Petroltel�LUKOIL(Romania)
3.5
(Bulgaria)
10.7
Sub�total for Refineriesoutside Russia
17.8
Capacitymln tons/year
Refining in 2003,mln tons
Sub�totalfor Russian Refineries
41.2
10.1Volgograd Refinery
Mini�Refineries in Uray and Kogalym0.4
Perm Refinery12.0
3.7
1999 2000 2001 2002 2003Total oil throuhputs: 29.2 32.4 38.0 41.6 42.3
Including
Russia 20.7 23.4 29.4 33.9 34.3
International 8.5 9.0 8.6 7.7 8.0
Oil throughputs, th. barrels per day 586 651 763 835 849
1999 2000 2001 2002 2003Total 76.1 74.4 72.6 71.4 72.2
Russian refineries 75.5 76.2 73.9 72.7 73.6
International refineries 84.4 69.7 68.4 65.8 66.5
Oil troughputs at LUKOIL refineries, mln tons
Depth of refining at LUKOIL refineries, %
Structure of LUKOIL refinery capacities
26%
20%
18%
17%
6%
6%6% 1%
Nizhny Novgorod Refinery
Perm Refinery
Burgas Refinery
Volgograd Refinery
Ukhta Refinery
Odessa Refinery
Ploiesti Refinery
Mini�Refineries
Oil troughputs at LUKOIL refineries, mln tons
1999 2000 2001 2002 200328
32
36
40
44
LUKOIL refinery capacities
Refining
37ANALYST DATABOOKRREEFFIINNIINNGG && GGAASS PPRROOCCEESSSSIINNGG
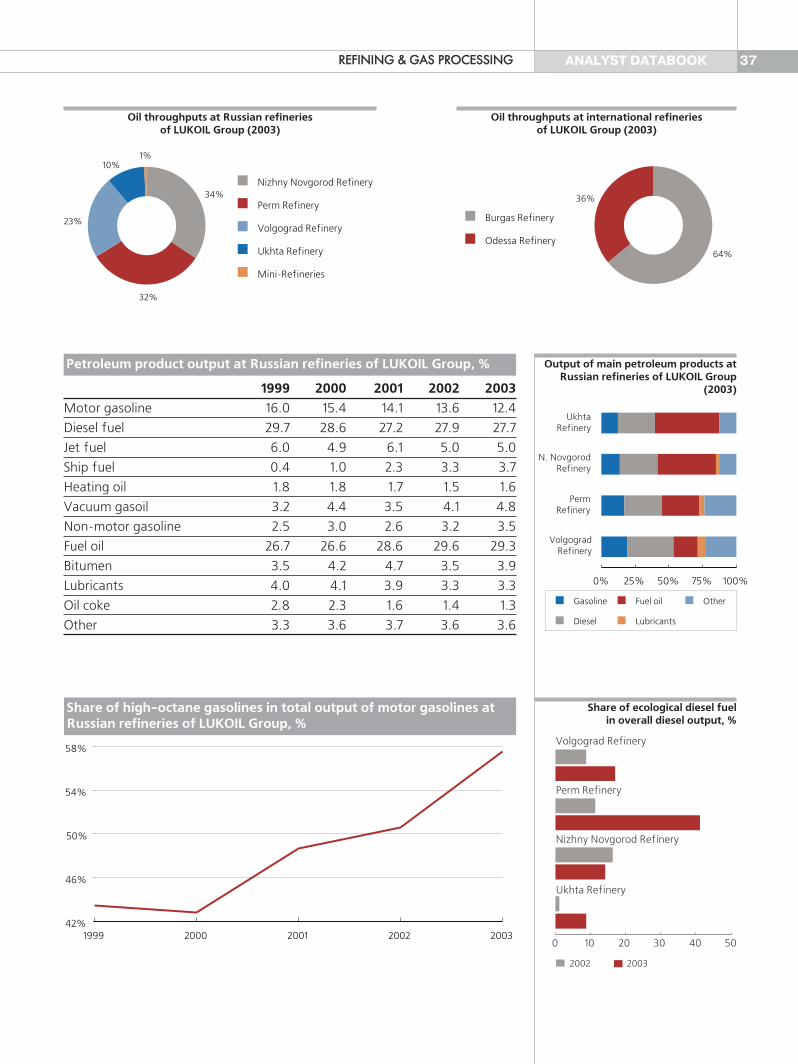
1999 2000 2001 2002 2003Motor gasoline 16.0 15.4 14.1 13.6 12.4
Diesel fuel 29.7 28.6 27.2 27.9 27.7
Jet fuel 6.0 4.9 6.1 5.0 5.0
Ship fuel 0.4 1.0 2.3 3.3 3.7
Heating oil 1.8 1.8 1.7 1.5 1.6
Vacuum gasoil 3.2 4.4 3.5 4.1 4.8
Non�motor gasoline 2.5 3.0 2.6 3.2 3.5
Fuel oil 26.7 26.6 28.6 29.6 29.3
Bitumen 3.5 4.2 4.7 3.5 3.9
Lubricants 4.0 4.1 3.9 3.3 3.3
Oil coke 2.8 2.3 1.6 1.4 1.3
Other 3.3 3.6 3.7 3.6 3.6
Petroleum product output at Russian refineries of LUKOIL Group, %
Share of high�octane gasolines in total output of motor gasolines atRussian refineries of LUKOIL Group, %
1999 2000 2001 2002 200342%
46%
50%
54%
58%
Oil throughputs at Russian refineriesof LUKOIL Group (2003)
34%
32%
23%
10%1%
Nizhny Novgorod Refinery
Perm Refinery
Volgograd Refinery
Ukhta Refinery
Mini�Refineries
Output of main petroleum products atRussian refineries of LUKOIL Group
(2003)
Share of ecological diesel fuelin overall diesel output, %
Volgograd Refinery
Perm Refinery
Nizhny Novgorod Refinery
Ukhta Refinery
0 10 20 30 40 50
2002 2003
0% 25% 50% 75% 100%
Gasoline
Diesel
Fuel oil
Lubricants
Other
UkhtaRefinery
N. NovgorodRefinery
PermRefinery
VolgogradRefinery
Oil throughputs at international refineriesof LUKOIL Group (2003)
64%
36%
Burgas Refinery
Odessa Refinery

38 ANALYST DATABOOK RREEFFIINNIINNGG && GGAASS PPRROOCCEESSSSIINNGG
"LUKOIL�Volgogradneftepererabotka"
The refinery produces fuels andlubricants
Put into operation in 1957
Belongs to LUKOIL Group since 1992
Crude oil is delivered to the refineryby pipeline Samara�Tikhoretsk
Petroleum products are shipped byrail, river and motor transport
Capacity — 10.1 mln tons per year
1999 2000 2001 2002 2003Motor gasoline 14.0 14.4 13.2 13.7 11.9
Diesel fuel 30.9 31.4 30.8 29.2 28.7
Jet fuel 8.0 7.8 8.5 8.3 8.2
Ship fuel 0.0 0.0 0.0 0.6 0.8
Heating oil 3.3 3.5 3.5 5.1 5.4
Vacuum gasoil 4.8 5.6 6.2 5.9 5.3
Non�motor gasoline 5.6 5.6 6.2 5.8 7.5
Fuel oil 20.0 18.8 19.0 18.1 17.1
Bitumen 1.6 1.9 1.6 1.5 2.1
Lubricants 5.2 5.7 5.5 5.2 5.5
Oil coke 3.0 3.1 2.9 3.1 3.0
Other 3.6 2.2 2.6 3.5 4.5
Petroleum product output, %
1999
2000
2001
2002
2003
0% 20% 40% 60%
37.9%
35.2%
42.9%
42.6%
45.2%
Share of high�octane gasolines in totaloutput of motor gasolines, %
1999
2000
2001
2002
2003
0 3 6 9
7.9
8.5
8.3
8.4
7.7
Refinery throughput, mln tons
Depth of refining, %
1999 2000 2001 2002 200379%
80%
81%
82%
83%
Catalytic Reforming
Hydrotreatment
Bitumen Blowing
Thermal Cracking
Delayed Coking
Production of Lubricating Oils
diesel fuel
gasoline
fuel oil
vacuumresidue
bitumen
vacuumgasoil
lubricating oils
coke
gasoline
benzene, toluenePlatforming Process
for Aromatics Production
Productionof Additives
Productionof Solid
Paraffins
solvent
diesel fuel
jet fuel
feedstock for carbonproduction
gasoline
solidparaffins
Atm
osp
her
ic a
nd
vac
uu
md
isti
lati
on
gas
GasFractionating
LPG
gasoline
Volgograd Refinery
39ANALYST DATABOOKRREEFFIINNIINNGG && GGAASS PPRROOCCEESSSSIINNGG
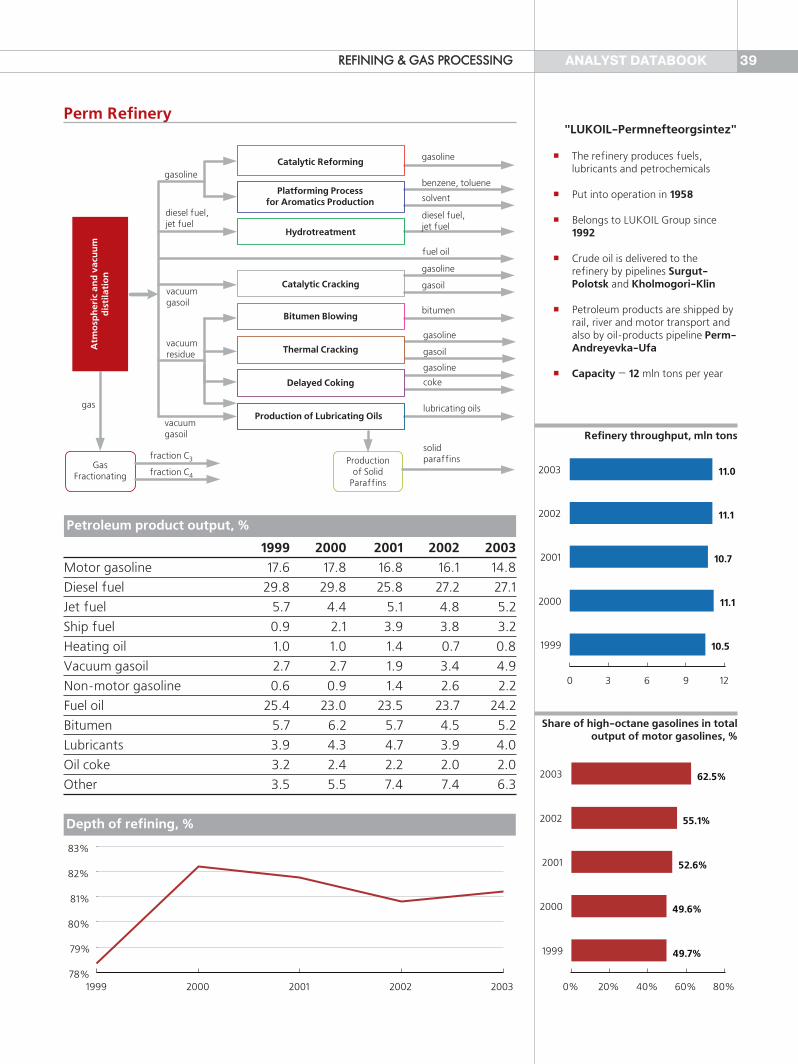
"LUKOIL�Permnefteorgsintez"
The refinery produces fuels,lubricants and petrochemicals
Put into operation in 1958
Belongs to LUKOIL Group since1992
Crude oil is delivered to therefinery by pipelines Surgut�Polotsk and Kholmogori�Klin
Petroleum products are shipped byrail, river and motor transport andalso by oil�products pipeline Perm�Andreyevka�Ufa
Capacity — 12 mln tons per year
1999 2000 2001 2002 2003Motor gasoline 17.6 17.8 16.8 16.1 14.8
Diesel fuel 29.8 29.8 25.8 27.2 27.1
Jet fuel 5.7 4.4 5.1 4.8 5.2
Ship fuel 0.9 2.1 3.9 3.8 3.2
Heating oil 1.0 1.0 1.4 0.7 0.8
Vacuum gasoil 2.7 2.7 1.9 3.4 4.9
Non�motor gasoline 0.6 0.9 1.4 2.6 2.2
Fuel oil 25.4 23.0 23.5 23.7 24.2
Bitumen 5.7 6.2 5.7 4.5 5.2
Lubricants 3.9 4.3 4.7 3.9 4.0
Oil coke 3.2 2.4 2.2 2.0 2.0
Other 3.5 5.5 7.4 7.4 6.3
Petroleum product output, %
1999
2000
2001
2002
2003
0% 20% 40% 60% 80%
49.7%
49.6%
52.6%
55.1%
62.5%
Share of high�octane gasolines in totaloutput of motor gasolines, %
1999
2000
2001
2002
2003
0 3 6 9 12
10.5
11.1
10.7
11.1
11.0
Refinery throughput, mln tons
Depth of refining, %
1999 2000 2001 2002 200378%
79%
80%
81%
82%
83%
Catalytic Reforming
Hydrotreatment
Bitumen Blowing
Catalytic Cracking
Delayed Coking
Production of Lubricating Oils
Thermal Cracking
gasoline
gas
diesel fuel,jet fuel
gasoline
fuel oil
vacuumresidue
vacuumgasoil
bitumen
vacuumgasoil
lubricating oils
gasoline
benzene, toluenePlatforming Process
for Aromatics Production
GasFractionating
Productionof Solid
Paraffins
solvent
fraction С3
fraction С4
diesel fuel,jet fuel
gasoil
gasoline
gasoil
coke
gasoline
solidparaffins
Atm
osp
her
ic a
nd
vac
uu
md
isti
lati
on
Perm Refinery

40 ANALYST DATABOOK RREEFFIINNIINNGG && GGAASS PPRROOCCEESSSSIINNGG
Hydrotreatment
Bitumen Blowing
gasoline
sulphur
vacuumresidue bitumen
vacuum gasoil
straight�run gasoline
gasolineCatalytic Reforming
diesel fueldiesel fuel
fuel oil
Productionof sulphur
Atm
osp
her
ic a
nd
vac
uu
md
isti
lati
on
"LUKOIL�Ukhtanetepererabotka"
The refinery produces fuels
Put into operation in 1934
Belongs to LUKOIL Group sinceoctober 1999
Crude oil is delivered to the refineryby pipeline Usa�Ukhta
Petroleum products are shipped byrail and motor transport
Capacity — 3.7 mln tons per year
1999 2000 2001 2002 2003Motor gasoline 15.5 10.3 9.6 9.7 9.6
Diesel fuel 24.8 18.4 25.0 26.2 26.7
Jet fuel 0.0 0.0 0.0 0.1 0.5
Ship fuel 0.0 0.0 7.0 14.8 13.4
Heating oil 0.1 0.5 1.0 0.3 0.7
Vacuum gasoil 0.0 6.7 6.3 6.9 9.1
Non�motor gasoline 0.0 3.6 2.6 2.1 2.7
Fuel oil 58.7 56.2 43.9 36.1 34.2
Bitumen 0.0 3.4 4.0 3.2 2.5
Lubricants 0.0 0.0 0.0 0.0 0.0
Oil coke 0.0 0.0 0.0 0.0 0.0
Other 1.0 1.0 0.6 0.5 0.6
Petroleum product output, %
1999
2000
2001
2002
2003
0% 20% 40% 60%
25.1%
31.5%
39.2%
44.1%
45.6%
Share of high�octane gasolines in totaloutput of motor gasolines, %
1999
2000
2001
2002
2003
0 1 2 3 4
2.1
3.6
3.5
3.6
3.6
Refinery throughput, mln tons
Depth of refining, %
1999 2000 2001 2002 200342%
48%
54%
60%
66%
72%
Ukhta Refinery

41ANALYST DATABOOKRREEFFIINNIINNGG && GGAASS PPRROOCCEESSSSIINNGG
Hydrotreatment
Bitumen Blowing
Production of Lubricating Oils
gasoline
diesel fuel,jet fuel
sulphuric acid
vacuumresidue
bitumen
vacuum gasoil
lubricating oils
straight�run gasoline
gasoline
Catalytic Reforming
Productionof Solid
Paraffins
raffinate
diesel fuel,jet fuel
fuel oil
white spirit
solidparaffins
Sulphuricacid unit
Atm
osp
her
ic a
nd
vac
uu
md
isti
lati
on
Productionof Additives
"LUKOIL�Nizhegorodnefteorgsintez"
The refinery produces fuels,lubricants and petrochemicals
Put into operation in 1958
Belongs to LUKOIL Group sincethe end of 2001
Crude oil is delivered to therefinery by pipelines Almetyevsk�Nizhny Novgorod and Surgut�Polotsk
Petroleum products are shipped byrail, river and motor transport andalso by oil�products pipeline
Capacity – 15 mln tons per year
1999 2000 2001 2002 2003Motor gasoline — — 13.3 12.2 11.3
Diesel fuel — — 25.9 28.1 27.9
Jet fuel — — 8.0 4.2 4.1
Ship fuel — — 0.0 1.1 3.0
Heating oil — — 0.3 0.1 0.1
Vacuum gasoil — — 1.3 2.4 2.9
Non�motor gasoline — — 0.0 2.2 2.4
Fuel oil — — 40.1 42.4 40.3
Bitumen — — 7.4 4.2 4.1
Lubricants — — 2.7 2.4 2.4
Oil coke — — 0.0 0.0 0.0
Other — — 0.9 0.8 1.5
Petroleum product output, %
2001
2002
2003
0% 20% 40% 60% 80%
51.4%
53.4%
62.8%
Share of high�octane gasolines in totaloutput of motor gasolines, %
2001
2002
2003
0 3 6 9 12
6.7
10.6
11.8
Refinery throughput, mln tons
Depth of refining, %
2001 2002 200358%
59%
60%
61%
62%
Nizhny Novgorod Refinery

1999 2000 2001 2002 2003Motor gasoline 4.5 3.5 9.9 6.1 6.7
Diesel fuel 18.7 20.8 20.6 20.7 23.1
Jet fuel 5.4 6.7 6.7 6.9 7.4
Non�motor gasoline 9.6 10.6 5.2 9.2 10.1
Bitumen 5.7 6.7 6.5 2.3 3.0
Other 0.0 0.0 0.0 0.0 0.0
42 ANALYST DATABOOK RREEFFIINNIINNGG && GGAASS PPRROOCCEESSSSIINNGG
"Urayneftegas"
The refinery produces fuels
Put into operation in 1995
Belongs to LUKOIL Group since1995
Capacity — 0.1 mln tons per year
"Kogalymneftegas"
The refinery produces fuels
Put into operation in 1997
Belongs to LUKOIL Group since1997
Capacity – 0.3 mln tons per year
1999 2000 2001 2002 2003Motor gasoline 14.4 14.1 10.0 15.6 13.1
Diesel fuel 23.1 23.6 22.0 22.7 22.0
Non�motor gasoline 0.0 2.0 2.4 0.9 4.8
Other 0.0 0.0 0.0 0.0 0.0
Petroleum product output**, %
Petroleum product output**, %
Bitumen Blowing
vacuumresidue bitumen
straight�run gasoline
diesel fuel
jet fuel
fuel oil
Atm
osp
her
ic a
nd
vac
uu
md
isti
lati
on
gasoline gasolineCatalytic reforming
straight�run gasoline
gasoline
diesel fuel
fuel oil
Atm
osp
her
ic a
nd
vac
uu
md
isti
lati
on
1999
2000
2001
2002
2003
0 25 50
41
42
37
41
41
1999
2000
2001
2002
2003
0 50 100 150 200
139
160
165
160
170
Refinery throughput*, mln tons
Refinery throughput*, mln tons
Mini�Refinery in Uray
Mini�Refinery in Kogalym
** Petroleum tailings are returned to oil.
** Petroleum tailings are returned to oil.
* Excluding petroleum tailings returned to oil.
* Excluding petroleum tailings returned to oil.
43ANALYST DATABOOKRREEFFIINNIINNGG && GGAASS PPRROOCCEESSSSIINNGG
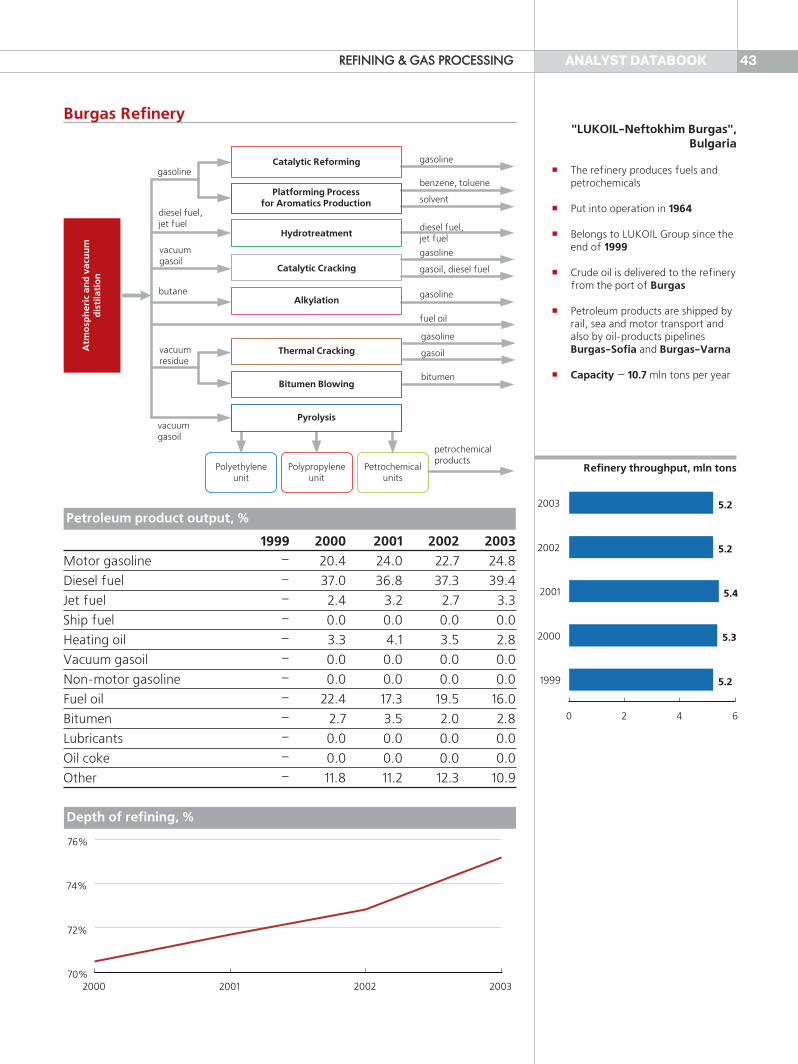
"LUKOIL�Neftokhim Burgas",Bulgaria
The refinery produces fuels andpetrochemicals
Put into operation in 1964
Belongs to LUKOIL Group since theend of 1999
Crude oil is delivered to the refineryfrom the port of Burgas
Petroleum products are shipped byrail, sea and motor transport andalso by oil�products pipelinesBurgas�Sofia and Burgas�Varna
Capacity — 10.7 mln tons per year
1999 2000 2001 2002 2003Motor gasoline – 20.4 24.0 22.7 24.8
Diesel fuel – 37.0 36.8 37.3 39.4
Jet fuel – 2.4 3.2 2.7 3.3
Ship fuel – 0.0 0.0 0.0 0.0
Heating oil – 3.3 4.1 3.5 2.8
Vacuum gasoil – 0.0 0.0 0.0 0.0
Non�motor gasoline – 0.0 0.0 0.0 0.0
Fuel oil – 22.4 17.3 19.5 16.0
Bitumen – 2.7 3.5 2.0 2.8
Lubricants – 0.0 0.0 0.0 0.0
Oil coke – 0.0 0.0 0.0 0.0
Other – 11.8 11.2 12.3 10.9
Petroleum product output, %
1999
2000
2001
2002
2003
0 2 4 6
5.2
5.3
5.4
5.2
5.2
Refinery throughput, mln tons
Depth of refining, %
2000 2001 2002 200370%
72%
74%
76%
Catalytic Reforming
Hydrotreatment
Alkylation
Catalytic Cracking
Bitumen Blowing
Pyrolysis
Thermal Cracking
gasoline
diesel fuel,jet fuel
gasoline
vacuumresidue
butane
vacuumgasoil
gasoline
vacuumgasoil
gasoline
benzene, toluenePlatforming Process
for Aromatics Production
Polyethyleneunit
Polypropyleneunit
Petrochemicalunits
solvent
diesel fuel,jet fuel
gasoil, diesel fuel
gasoline
gasoil
bitumen
petrochemicalproducts
Atm
osp
her
ic a
nd
vac
uu
md
isti
lati
on
fuel oil
Burgas Refinery

44 ANALYST DATABOOK RREEFFIINNIINNGG && GGAASS PPRROOCCEESSSSIINNGG
Hydrotreatment
Bitumen unit
gasoline
diesel fuel
vacuumresidue bitumen
vacuum galoil
straight�run gasoline
gasolineCatalytic reforming
diesel fuel
jet fuel
fuel oil
Atm
osp
her
ic a
nd
vac
uu
md
isti
lati
on
"LUKOIL�Odessky NPZ", Ukraine
The refinery produces fuels
Put into operation in 1937
Belongs to LUKOIL Group sincemid�2000
Crude oil is delivered to therefinery by pipeline from Russia
Petroleum products are shipped byrail and motor transport and alsoby oil�products pipeline
Capacity— 3.6 mln tons per year
1999 2000 2001 2002 2003Motor gasoline — 16.4 14.1 11.1 11.1
Diesel fuel — 28.8 29.0 29.6 28.4
Jet fuel — 1.8 1.7 1.5 2.5
Ship fuel — 0.0 0.0 0.0 0.0
Heating oil — 0.0 0.0 0.0 0.0
Vacuum gasoil — 0.0 2.2 2.5 1.9
Non�motor gasoline — 0.0 0.0 2.8 2.6
Fuel oil — 51.0 49.3 48.8 49.6
Bitumen — 1.1 1.8 3.0 3.2
Lubricants — 0.0 0.0 0.0 0.0
Oil coke — 0.0 0.0 0.0 0.0
Other — 0.9 1.9 0.8 0.7
Petroleum product output, %
2000
2001
2002
2003
0% 20% 40% 60% 80%
31.6%
45.3%
71.0%
76.9%
Share of high�octane gasolines in totaloutput of motor gasolines, %
1999
2000
2001
2002
2003
0 1 2 3
1.7
1.4
2.2
2.5
2.8
Refinery throughput, mln tons
Depth of refining, %
2000 2001 2002 200348%
49%
50%
51%
52%
Odessa Refinery

45ANALYST DATABOOKRREEFFIINNIINNGG && GGAASS PPRROOCCEESSSSIINNGG
Catalytic Reforming
Hydrotreatment
Catalytic Cracking
Delayed Coking
gasoline
diesel fuel,jet fuel
gasoline
vacuumresidue
vacuumgasoil
gasoline
diesel fuel,jet fuel
diesel fuel,jet fuel
gasoline
coke
Atm
osp
her
ic a
nd
vac
uu
md
isti
lati
on
"Petrotel�LUKOIL", Romania
The refinery produces fuels andpetrochemicals
Put into operation in 1927
Belongs to LUKOIL Group since1999
Crude oil is delivered to the refineryby pipeline from the Black Sea portof Constantsa and by rail
Petroleum products are shipped byrail and motor transport and also byoil�products pipeline
Capacity — 3.5 mln tons per year
The refinery was closed in 2001 forreconstruction
1999 2000 2001 2002 2003 Motor gasoline 38.0 37.7 34.9 — —
Diesel fuel 40.9 42.6 42.6 — —
Jet fuel 0.0 0.0 0.0 — —
Ship fuel 0.0 0.0 0.0 — —
Heating oil 0.0 0.0 0.0 — —
Vacuum gasoil 0.0 0.0 0.0 — —
Non�motor gasoline 0.0 0.0 0.0 — —
Fuel oil 7.0 2.7 5.7 — —
Bitumen 0.0 0.0 0.0 — —
Lubricants 0.0 0.0 1.1 — —
Oil coke 5.1 7.6 8.2 — —
Other 9.0 9.4 7.5 — —
Petroleum product output, %
2000
2001
2002
2003
0% 25% 50% 75% 100%
76.8%
84.2%
0.0%
0.0%
Share of high�octane gasolines in totaloutput of motor gasolines, %
1999
2000
2001
2002
2003
0 1 2 3
1.6
2.3
0.9
0.0
0.0
Refinery throughput, mln tons
Depth of refining, %
1999 2000 200184%
86%
88%
90%
92%
Ploiesti Refinery

46 ANALYST DATABOOK RREEFFIINNIINNGG && GGAASS PPRROOCCEESSSSIINNGG
480
–
–
160
Lokosovsky Gas�processingPlant (Langepas)
Permneftegaz Gas�processingPlant (Perm)
Korobkovsky Gas�processingPlant (Kstovo)
Gas processingcapacity
(mcm/year)
Liquids processingcapacity
(th. tons/year)
Usinsky Gas�processingPlant (Usinsk)
400
1,070
500
700
Gas processing capacities of LUKOIL Group
Gas processing and product output at Korobkovsky Gas�processing Plant
1999 2000 2001 2002 2003
Processing, th. tons 346 424 422 408 418
Product output
Liquefied hydrocarbon gases, th. tons 65 69 75 73 73
Stable gas gasoline, th. tons 46 52 48 44 46
Stripped gas, mcm 263 343 310 299 293
Gas processing and product output at Permneftegaz Gas�processing Plant
1999 2000 2001 2002 2003
Processing, th. tons — 621 630 736 807
Product output
Liquefied hydrocarbon gases, th. tons — 259 250 327 376
Stable gas gasoline, th. tons — 45 51 83 88
Stripped gas, mcm — 315 321 290 329
Gas processing and product output at Usinsky Gas�processing Plant
1999 2000 2001 2002 2003
Processing, mcm — 414 526 464 419
Product output
Stripped gas, mcm — 203 299 446 402
Gas processing and product output at Lokosovsky Gas�processing Plant
1999 2000 2001 2002 2003
Processing, mcm — — — 896 1,017
Product output
Stripped gas, mcm — — — 704 816
Gas Processing
ANALYST DATABOOK 47RREEFFIINNIINNGG && GGAASS PPRROOCCEESSSSIINNGG
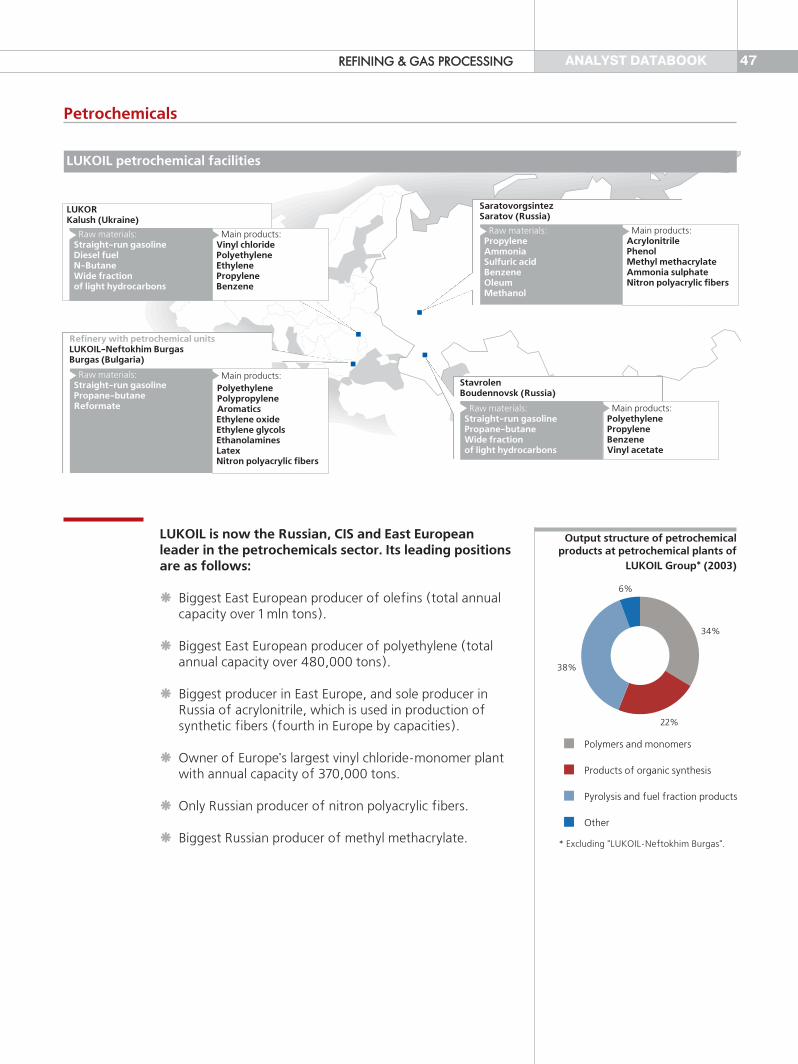
StavrolenBoudennovsk (Russia)
Main products:PolyethylenePropyleneBenzeneVinyl acetate
Raw materials:Straight�run gasolinePropane�butaneWide fractionof light hydrocarbons
SaratovorgsintezSaratov (Russia)
Main products:AcrylonitrilePhenolMethyl methacrylateAmmonia sulphateNitron polyacrylic fibers
Raw materials:PropyleneAmmoniaSulfuric acidBenzeneOleumMethanol
Refinery with petrochemical unitsLUKOIL�Neftokhim BurgasBurgas (Bulgaria)
Main products:PolyethylenePolypropyleneAromaticsEthylene oxideEthylene glycolsEthanolaminesLatexNitron polyacrylic fibers
Raw materials:Straight�run gasolinePropane�butane Reformate
LUKORKalush (Ukraine)
Main products:Vinyl chloridePolyethyleneEthylenePropyleneBenzene
Raw materials:Straight�run gasolineDiesel fuelN�ButaneWide fractionof light hydrocarbons
LUKOIL is now the Russian, CIS and East Europeanleader in the petrochemicals sector. Its leading positionsare as follows:
Biggest East European producer of olefins (total annualcapacity over 1 mln tons).
Biggest East European producer of polyethylene (totalannual capacity over 480,000 tons).
Biggest producer in East Europe, and sole producer inRussia of acrylonitrile, which is used in production ofsynthetic fibers (fourth in Europe by capacities).
Owner of Europe's largest vinyl chloride�monomer plantwith annual capacity of 370,000 tons.
Only Russian producer of nitron polyacrylic fibers.
Biggest Russian producer of methyl methacrylate.
Output structure of petrochemicalproducts at petrochemical plants of
LUKOIL Group* (2003)
* Excluding "LUKOIL�Neftokhim Burgas".
34%
22%
38%
6%
Polymers and monomers
Products of organic synthesis
Pyrolysis and fuel fraction products
Other
LUKOIL petrochemical facilities
Petrochemicals

ANALYST DATABOOK48 RREEFFIINNIINNGG && GGAASS PPRROOCCEESSSSIINNGG
The petrochemicalcomplex was put intooperation in 1968
Belongs to LUKOIL Groupsince the end of 1999
Petrochemical capacities —500,000 tons per year
1999 2000 2001 2002 2003Petrochemical products 183.5 407.9 333.3 328.5 375.3
Polyethylene 76.4 70.2 68.9 64.4 71.6
Polypropylene 55.5 53.4 61.6 56.3 64.3
Acrylonitrile 0.0 18.8 16.6 17.3 18.0
Synthetic fibre 0.0 9.8 11.7 9.6 11.3
Styrene 0.0 13.0 13.2 12.8 13.8
Polystyrene 6.0 9.5 9.8 8.3 9.3
Latex 14.2 0.0 0.0 12.8 12.2
Industrial rubber 20.3 18.4 0.0 17.2 32.1
Ethylene glycol 0.0 59.8 73.4 63.1 69.1
Ethanolamine 7.3 11.0 12.9 10.7 12.8
Benzene 0.0 28.9 9.7 6.2 10.8
Toluene 0.0 26.6 28.6 26.0 25.3
Xylene 0.0 16.8 17.8 14.6 14.9
Other 3.8 71.7 9.1 9.2 9.8
Petrochemical product output at "LUKOIL Neftohim Burgas" plant,th. tons
"LUKOIL�Neftokhim Burgas",Bulgaria
1999 2000 2001 2002 2003
Processing 805.4 1,141.3 1,605.2 2,138.0 2,262.4
Petrochemical product output 614.2 864.2 1,194.9 1,632.2 1,763.8
Polymers and monomers:
polyethylene 210.1 252.9 298.1 366.5 356.3
synthetic fibre 1.4 9.3 11.6 13.5 21.2
vinyl acetate 20.5 0.0 0.0 30.7 42.5
vinyl chloride 0.0 9.5 70.7 120.7 173.2
Products of organic synthesis:
benzene 0.0 20.3 118.7 151.1 156.7
phenol, acetone 15.3 43.2 39.6 31.1 36.8
methyl methacrylate 2.4 19.8 20.6 20.7 23.8
acrylonitrile 12.1 72.7 83.5 122.2 117.7
ammonia sulphate 5.7 48.9 56.5 50.3 60.7
Pyrolysis and fuel fraction products:
propylene 93.1 118.2 162.0 220.7 233.1
saleable ethylene 0.0 1.6 32.4 47.5 52.6
butadiene butylene fraction 68.8 82.2 106.6 143.7 147.6
fraction С5+С9 41.5 45.4 71.2 101.6 108.4
heavy oil tar 37.5 46.4 86.2 127.2 133.7
Other 105.8 93.8 37.2 84.7 99.5* Excluding "LUKOIL�Neftokhim Burgas".
Processing and petrochemical product output at petrochemical plants of LUKOIL Group*, th. tons

49ANALYST DATABOOKRREEFFIINNIINNGG && GGAASS PPRROOCCEESSSSIINNGG
Put into operation in 1981
Belongs to LUKOIL Groupsince 1998
Capacity — 1,050,000 tonsper year
Put into operation in 1957
Belongs to LUKOIL Groupsince july 1999
Capacity — 490,000 tonsper year
Put into operation in early1970s
Joint venture of LUKOIL and"Oriana" since 2000
Capacity — 1,330,000 tonsper year
1999 2000 2001 2002 2003Processing 747.8 826.4 788.5 889.8 914.4
Petrochemical products: 573.1 634.5 581.0 671.2 686.6
Propylene 93.1 115.2 109.8 128.7 129.0
Polyethylene 208.1 252.6 245.8 267.8 263.9
Benzene 0.0 19.0 70.4 75.9 78.2
Vinyl acetate 20.5 0.0 0.0 30.7 42.5
Heavy fuel 37.5 38.3 35.5 32.7 33.9
Liquid pyrolysis fractions 213.9 209.4 119.5 135.4 139.1
Petrochemical product output at "Stavrolen" plant, th. tons
1999 2000 2001 2002 2003Processing 57.5 278.8 305.2 373.2 401.6
Petrochemical products: 41.1 201.7 218.0 244.0 269.5
Phenol 13.4 35.6 33.3 28.4 33.3
Acetone 8.4 7.5 6.3 2.7 3.5
Acrylonitrile 10.4 72.7 83.4 122.2 117.7
Fiber 1.0 9.3 11.6 13.5 21.2
Acetone cyanogen hydride 0.2 3.2 2.6 0.5 2.8
Methyl methacrylate 1.8 19.8 20.6 20.7 23.8
Ammonia sulphate 4.2 48.9 56.5 50.3 60.7
Other 1.7 4.7 3.7 5.7 6.5
Petrochemical product output at "Saratovorgsintez" plant, th. tons
1999 2000 2001 2002 2003Processing — 36.1 511.5 875.0 946.4
Petrochemical products: — 28.0 395.9 717.0 807.7
Saleable ethylene — 1.6 32.4 47.5 52.6
Propylene — 3.0 52.1 92.0 104.1
Benzene — 1.2 48.3 75.7 79.8
Polyethylene — 0.2 52.3 98.7 92.3
Vinyl chloride — 9.5 70.7 120.7 173.2
Liquid pyrolysis fractions — 4.3 65.1 117.5 124.2
Pyrolysis tar — 8.2 50.7 94.6 99.9
Other — 0.0 24.3 70.3 81.6
Petrochemical product output at "LUKOR" plant, th. tons
"Stavrolen"
"Saratovorgsintez"
"LUKOR", Ukraine

50 ANALYST DATABOOK
Oil Supplies
Oil production
RUSSIA
INTERNATIONAL
Oil resource
Oil purchasesOil exports
Sales
Oil production
Oil purchases
Oil resourceSales
Refiningat own refineries
Refining at refineriesof other companies
Refiningat own refineries
Refining at refineriesof other companies
78.3 mln tons*
0.9 mln tons79.2 mln tons
37.7 mln tons
7.0 mln tons
44.4 mln tons34.9 mln tons
2.9 mln tons
3.8 mln tons
34.3 mln tons
0.2 mln tons
8.0 mln tons
1.5 mln tons
Astrakhan(Ilyinka)
Kaliningrad(Izhevskoye)
3.34.5
Vysotsk(Leningrad region)
2.512.0
Currentcapacity,
mln tons/yearProspective
capacity,mln tons/year
Varandey(Nenetsky region)
251.5
1.08.0
Export terminals of LUKOIL Group
Oil supplies in 2003
* Oil production excluding transportation losses.
MMAARRKKEETTIINNGG
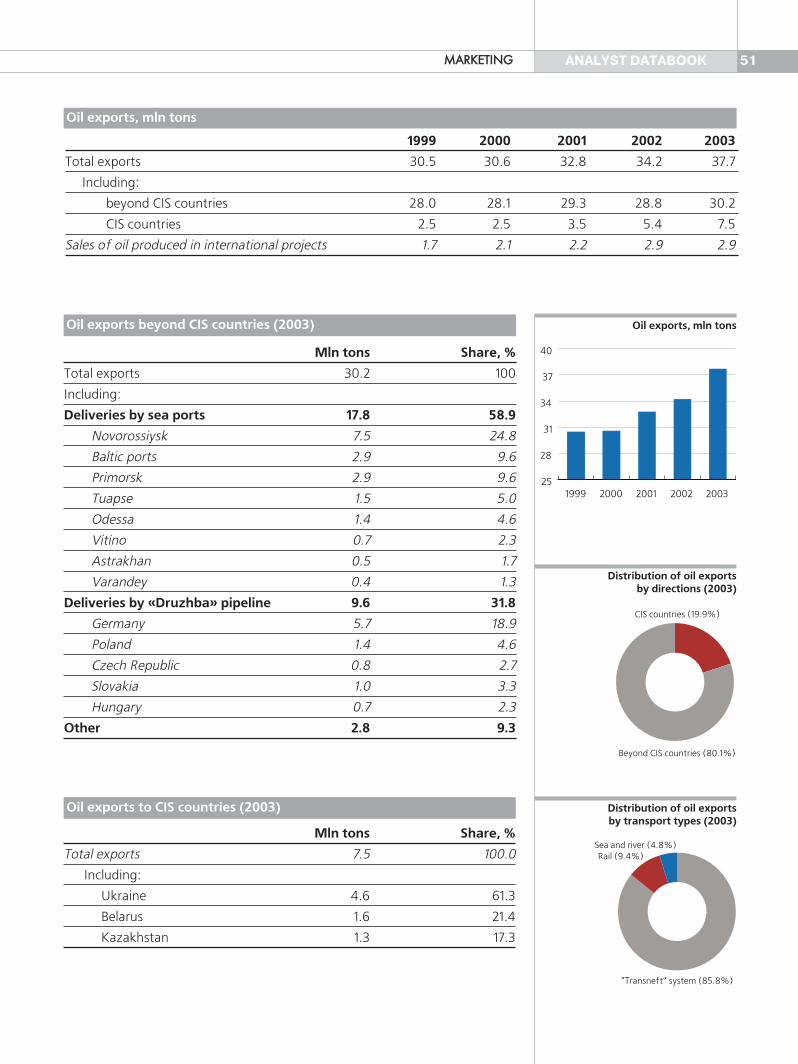
51ANALYST DATABOOKMMAARRKKEETTIINNGG
1999 2000 2001 2002 2003
Total exports 30.5 30.6 32.8 34.2 37.7
Including:
beyond CIS countries 28.0 28.1 29.3 28.8 30.2
CIS countries 2.5 2.5 3.5 5.4 7.5
Sales of oil produced in international projects 1.7 2.1 2.2 2.9 2.9
1999 2000 2001 2002 200325
28
31
34
37
40
Oil exports, mln tons
“Transneft” system (85.8%)
Rail (9.4%)Sea and river (4.8%)
Distribution of oil exportsby transport types (2003)
CIS countries (19.9%)
Beyond CIS countries (80.1%)
Distribution of oil exportsby directions (2003)
Mln tons Share, %
Total exports 30.2 100
Including:
Deliveries by sea ports 17.8 58.9
Novorossiysk 7.5 24.8
Baltic ports 2.9 9.6
Primorsk 2.9 9.6
Tuapse 1.5 5.0
Odessa 1.4 4.6
Vitino 0.7 2.3
Astrakhan 0.5 1.7
Varandey 0.4 1.3
Deliveries by «Druzhba» pipeline 9.6 31.8
Germany 5.7 18.9
Poland 1.4 4.6
Czech Republic 0.8 2.7
Slovakia 1.0 3.3
Hungary 0.7 2.3
Other 2.8 9.3
Oil exports beyond CIS countries (2003)
Mln tons Share, %
Total exports 7.5 100.0
Including:
Ukraine 4.6 61.3
Belarus 1.6 21.4
Kazakhstan 1.3 17.3
Oil exports to CIS countries (2003)
Oil exports, mln tons

Petroleum Product Marketing
ANALYST DATABOOK
Russia
CIS
Baltics
Europe
USA Total
4,599201
1,732166
30416
1753
1,063*
16
1,325�
* Including Petrol (Bulgaria).
Tankfarms
Fillingstations
1999 2000 2001 2002 2003Total 811 1,305 5,544 5,757 6,652
Russia 811 805 2,019 2,433 2,779
International 0 500 3,526 3,325 3,873
Retail sales of petroleum products*, th. tons
1999 2000 2001 2002 2003Total 868 2,647 3,745 4,076 4,599
Including:
Russia: 868 1,217 1,585 1,691 1,732
own 621 924 1,384 1,428 1,456
franchised 247 293 201 263 276
Europe — 34 553 679 1,063
Baltics — 73 146 154 175
CIS — 63 184 266 304
USA — 1,260 1,277 1,286 1,325
Retail network of LUKOIL Group* (end of year), filling stations
*Own and franchised.
*Own and franchised.
Bulgaria
Ukraine
Moldova
Belarus
Turkey
Serbia
Romania
Baltic countries
Poland
Azerbaijan
Georgia
4%
4%3%
3% 2% 1% 1%
38%
12%12%
20%
Petroleum product sales by LUKOILcompanies outside Russia in 2003(wholesale and retail)
52 MMAARRKKEETTIINNGG
Retail network of the Company (end of 2003)

53ANALYST DATABOOKMMAARRKKEETTIINNGG
LUKOIL share in petroleum product marketsof Russian federal districts, %
2001 2002 2003 2001 2002 2003
Central n.a. 3.6 5.2 n.a. 1.3 3.0
North�West 14.1 17.5 17.4 6.8 9.6 12.2
Urals 24.0 28.4 27.2 12.5 15.0 20.0
South 13.4 16.3 17.8 10.4 11.5 12.9
Volga 2.0 12.8 13.4 2.1 11.5 14.6
Share in wholesale market Share in retail market
Motor gasoline
Diesel fuel
Fuel oil
Lubricants
Other
Wholesale
Retail
81%
18%1%
19%
28%
20%
3%
30%
Structure of petroleum product salesby Company marketing units in 2003
(wholesale and retail)
1999 2000 2001 2002 2003Petroleum product exports 4.1 7.8 10.8 14.2 13.5
Petroleum product exports, mln tons
Distribution of petroleum product exports by transport types, %
1999 2000 2001 2002 20030
4
8
12
16
Petroleum product exports, mln tons
1999 2000 2001 2002 20030
250
500
750
1,000
Petrochemical product exports,th. tons
1999 2000 2001 2002 2003Rail 71.7 75.2 68.4 70.5 62.5
River 28.3 20.0 20.2 17.5 18.4
Pipeline 0.0 4.8 11.4 12.0 19.1
1999 2000 2001 2002 2003Petrochemical product sales in Russia and CIS countries 394 531 639 640 776
Petrochemical product exports beyond CIS countries 220 333 556 992 988
Petrochemical product sales*, th.
*Exluding "LUKOIL�Neftokhim Burgas"
Petrochemical Product Marketing

54 ANALYST DATABOOK
Economy & Finance
First Vice�presidentS. P. Kukura
Refining & Marketing
First Vice�presidentD. N. Tarasov
Main Divisionof Refining
and Petrochemicals
HeadV. M. Rakitsky
Main Treasury andCorporate Finance
Department
Vice�presidentA. K. Matytsyn
Main Division ofCorporate Economic
Planning andInvestment
Vice�presidentA. G. Kozyrev
Main Division of Salesand Supplies
Vice�presidentYu. F. Storozhev
Main Division ofMarketing
HeadV. V. Zhuravleva
Main Divisionof Oil & GasProduction
Vice�presidentJ. K. Cheloyants
Main Division ofGeology andDevelopment
Vice�presidentA. A. Novikov
Main Division ofConstruction, Project
Planning andCorporate Agencies
Vice�presidentS. M. Rakhmetov
Main Division ofEconomy and Planning
of Exploration andOil & Gas Production
HeadP. V. Kaufman
Board of Directors
ChairmanV. I. Grayfer
ManagementCommittee
PresidentV. Yu. Alekperov
Main Division ofEconomy and Planning
of Production andCommerce
HeadI. A. Nafiev
Accounts
Senior Accountant,Vice�president
L. N. Khoba
Main Division ofStrategic Planning and
Investment Analysis
Vice�presidentL. A. Fedun
Main Division of SocialIssues, Corporate
Security andCommunications
Vice�presidentA. A. Barkov
Main Division of LegalAffairs
HeadI. A. Masliaev
Main Division ofHuman Resourses
HeadA. A. Moskalenko
Main Division ofControl and Internal
Audit
Vice�presidentV. S. Sharifov
Oil & Gas Production
First Vice�presidentR. U. Maganov
CCOORRPPOORRAATTEE GGOOVVEERRNNAANNCCEE
Corporate Management Structure
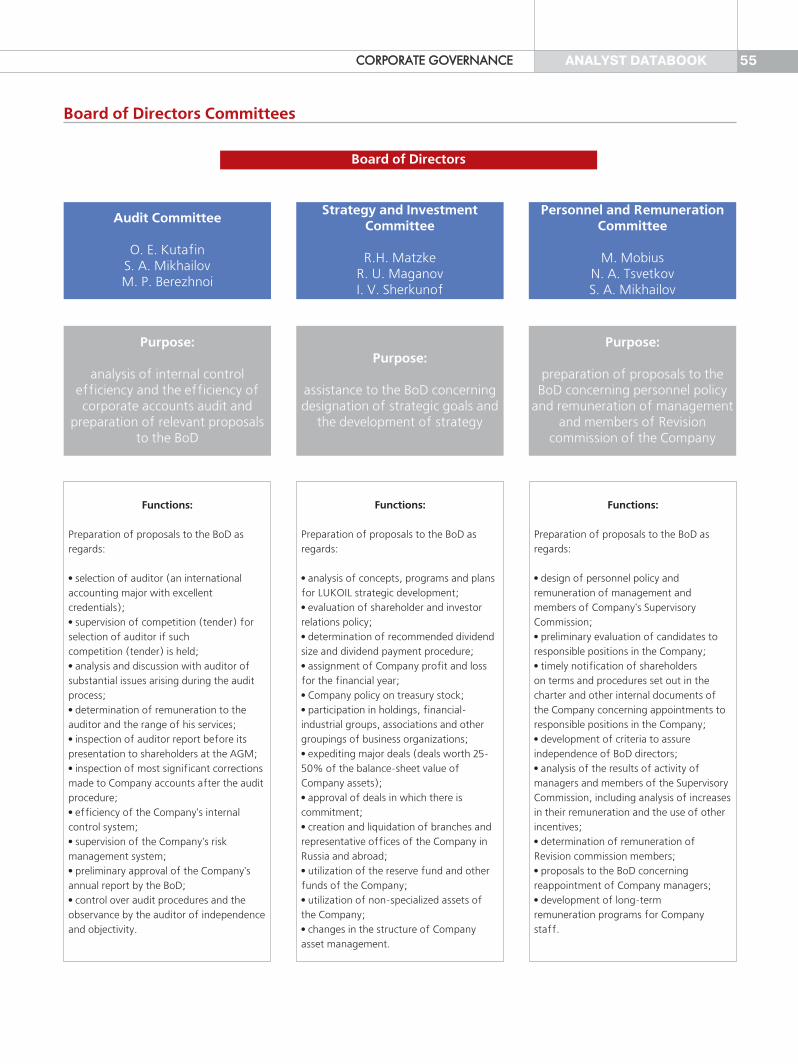
Board of Directors Committees
55ANALYST DATABOOK
Audit Committee
O. E. Kutafin S. A. Mikhailov M. P. Berezhnoi
Strategy and InvestmentCommittee
R.H. Matzke R. U. Maganov I. V. Sherkunof
Personnel and RemunerationCommittee
M. Mobius N. A. Tsvetkov S. A. Mikhailov
Purpose:
analysis of internal controlefficiency and the efficiency of
corporate accounts audit andpreparation of relevant proposals
to the BoD
Functions:
Preparation of proposals to the BoD asregards:
• selection of auditor (an internationalaccounting major with excellentcredentials);• supervision of competition (tender) forselection of auditor if suchcompetition (tender) is held;• analysis and discussion with auditor ofsubstantial issues arising during the auditprocess;• determination of remuneration to theauditor and the range of his services;• inspection of auditor report before itspresentation to shareholders at the AGM;• inspection of most significant correctionsmade to Company accounts after the auditprocedure;• efficiency of the Company's internalcontrol system;• supervision of the Company's riskmanagement system;• preliminary approval of the Company'sannual report by the BoD;• control over audit procedures and theobservance by the auditor of independenceand objectivity.
Functions:
Preparation of proposals to the BoD asregards:
• analysis of concepts, programs and plansfor LUKOIL strategic development;• evaluation of shareholder and investorrelations policy;• determination of recommended dividendsize and dividend payment procedure;• assignment of Company profit and lossfor the financial year;• Company policy on treasury stock;• participation in holdings, financial�industrial groups, associations and othergroupings of business organizations;• expediting major deals (deals worth 25�50% of the balance�sheet value ofCompany assets);• approval of deals in which there iscommitment;• creation and liquidation of branches andrepresentative offices of the Company inRussia and abroad;• utilization of the reserve fund and otherfunds of the Company;• utilization of non�specialized assets ofthe Company;• changes in the structure of Companyasset management.
Functions:
Preparation of proposals to the BoD asregards:
• design of personnel policy andremuneration of management andmembers of Company's SupervisoryCommission;• preliminary evaluation of candidates toresponsible positions in the Company;• timely notification of shareholderson terms and procedures set out in thecharter and other internal documents ofthe Company concerning appointments toresponsible positions in the Company;• development of criteria to assureindependence of BoD directors;• analysis of the results of activity of managers and members of the SupervisoryCommission, including analysis of increasesin their remuneration and the use of otherincentives;• determination of remuneration ofRevision commission members;• proposals to the BoD concerningreappointment of Company managers;• development of long�termremuneration programs for Companystaff.
Purpose:
assistance to the BoD concerningdesignation of strategic goals and
the development of strategy
Purpose:
preparation of proposals to theBoD concerning personnel policy
and remuneration of managementand members of Revision
commission of the Company
Board of Directors
CCOORRPPOORRAATTEE GGOOVVEERRNNAANNCCEE
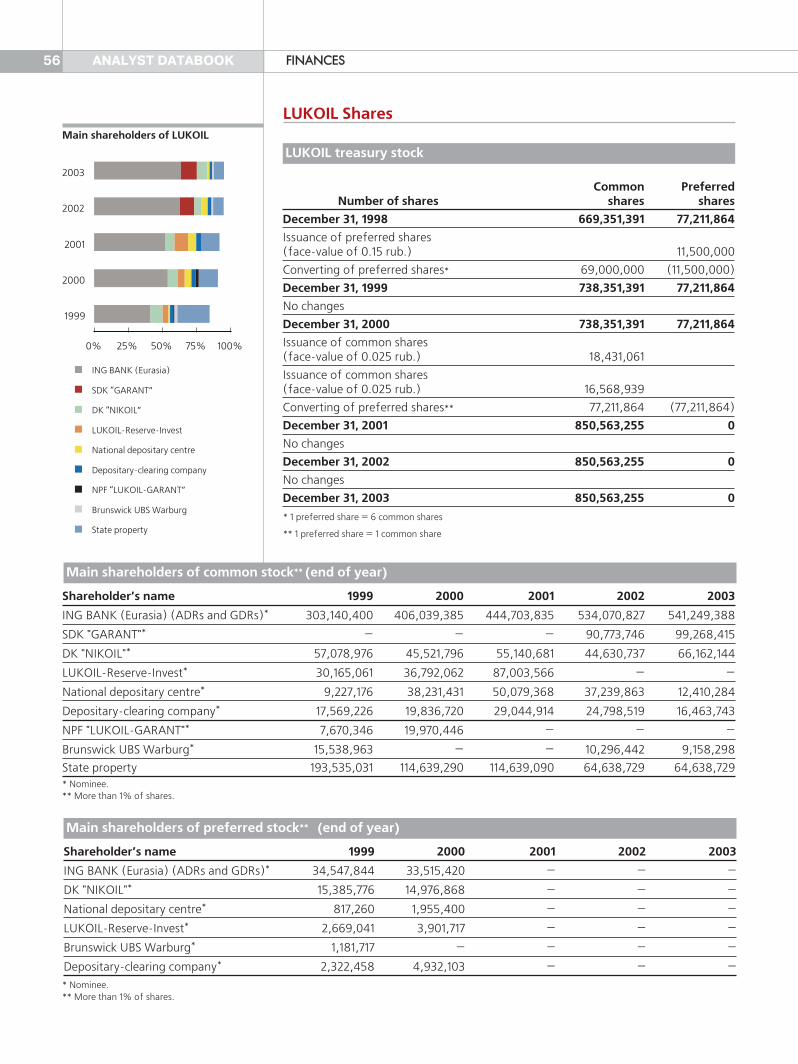
56 ANALYST DATABOOK
1999
2000
2001
2002
2003
0% 25% 50% 75% 100%
ING BANK (Eurasia)
SDK “GARANT”
DK “NIKOIL”
LUKOIL�Reserve�Invest
National depositary centre
Depositary�clearing company
NPF “LUKOIL�GARANT”
Brunswick UBS Warburg
State property
FFIINNAANNCCEESS
LUKOIL treasury stockMain shareholders of LUKOIL
Common PreferredNumber of shares shares shares
December 31, 1998 669,351,391 77,211,864
Issuance of preferred shares (face�value of 0.15 rub.) 11,500,000
Converting of preferred shares* 69,000,000 (11,500,000)
December 31, 1999 738,351,391 77,211,864
No changes
December 31, 2000 738,351,391 77,211,864
Issuance of common shares(face�value of 0.025 rub.) 18,431,061
Issuance of common shares(face�value of 0.025 rub.) 16,568,939
Converting of preferred shares** 77,211,864 (77,211,864)
December 31, 2001 850,563,255 0
No changes
December 31, 2002 850,563,255 0
No changes
December 31, 2003 850,563,255 0
Shareholder’s name 1999 2000 2001 2002 2003
ING BANK (Eurasia) (ADRs and GDRs)* 303,140,400 406,039,385 444,703,835 534,070,827 541,249,388
SDK "GARANT"* — — — 90,773,746 99,268,415
DK "NIKOIL"* 57,078,976 45,521,796 55,140,681 44,630,737 66,162,144
LUKOIL�Reserve�Invest* 30,165,061 36,792,062 87,003,566 — —
National depositary centre* 9,227,176 38,231,431 50,079,368 37,239,863 12,410,284
Depositary�clearing company* 17,569,226 19,836,720 29,044,914 24,798,519 16,463,743
NPF "LUKOIL�GARANT"* 7,670,346 19,970,446 — — —
Brunswick UBS Warburg* 15,538,963 — — 10,296,442 9,158,298
State property 193,535,031 114,639,290 114,639,090 64,638,729 64,638,729
Shareholder’s name 1999 2000 2001 2002 2003
ING BANK (Eurasia) (ADRs and GDRs)* 34,547,844 33,515,420 — — —
DK "NIKOIL"* 15,385,776 14,976,868 — — —
National depositary centre* 817,260 1,955,400 — — —
LUKOIL�Reserve�Invest* 2,669,041 3,901,717 — — —
Brunswick UBS Warburg* 1,181,717 — — — —
Depositary�clearing company* 2,322,458 4,932,103 — — —
* Nominee.
* Nominee.
* 1 preferred share = 6 common shares
** 1 preferred share = 1 common share
LUKOIL Shares
Main shareholders of common stock** (end of year)
Main shareholders of preferred stock** (end of year)
** More than 1% of shares.
** More than 1% of shares.
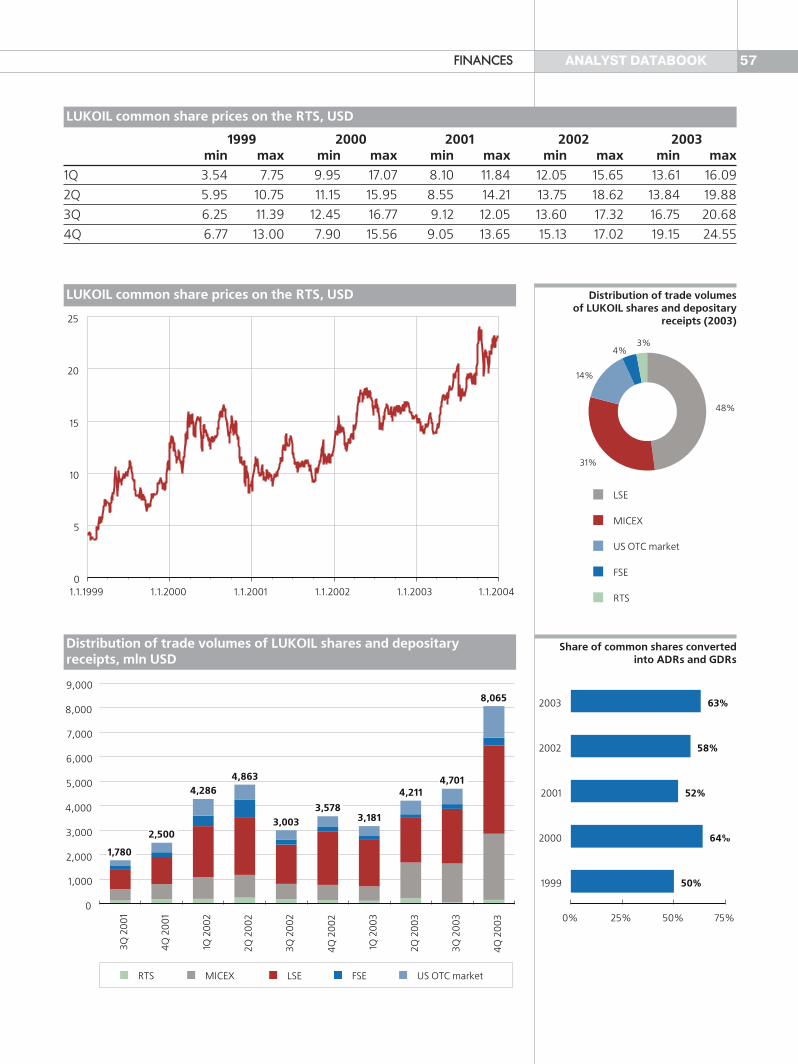
57ANALYST DATABOOKFFIINNAANNCCEESS
1999 2000 2001 2002 2003min max min max min max min max min max
1Q 3.54 7.75 9.95 17.07 8.10 11.84 12.05 15.65 13.61 16.09
2Q 5.95 10.75 11.15 15.95 8.55 14.21 13.75 18.62 13.84 19.88
3Q 6.25 11.39 12.45 16.77 9.12 12.05 13.60 17.32 16.75 20.68
4Q 6.77 13.00 7.90 15.56 9.05 13.65 15.13 17.02 19.15 24.55
LUKOIL common share prices on the RTS, USD
0
5
10
15
20
25
1.1.1999 1.1.2000 1.1.2001 1.1.2002 1.1.2003 1.1.2004
Distribution of trade volumes of LUKOIL shares and depositaryreceipts, mln USD
3Q 2
00
1
4Q
20
01
1Q 2
00
2
2Q 2
00
2
3Q 2
00
2
4Q
20
02
1Q 2
00
3
2Q 2
00
3
3Q 2
00
3
4Q
20
03
0
1,000
2,000
3,000
4,000
5,000
6,000
7,000
8,000
9,000
1,780
2,500
4,2864,863
3,0033,578
3,181
4,2114,701
8,065
RTS MICEX LSE FSE US OTC market
1999
2000
2001
2002
2003
0% 25% 50% 75%
63%
58%
52%
64%
50%
48%
31%
14%
4%3%
LSE
MICEX
US OTC market
FSE
RTS
Share of common shares converted into ADRs and GDRs
Distribution of trade volumesof LUKOIL shares and depositary
receipts (2003)
LUKOIL common share prices on the RTS, USD
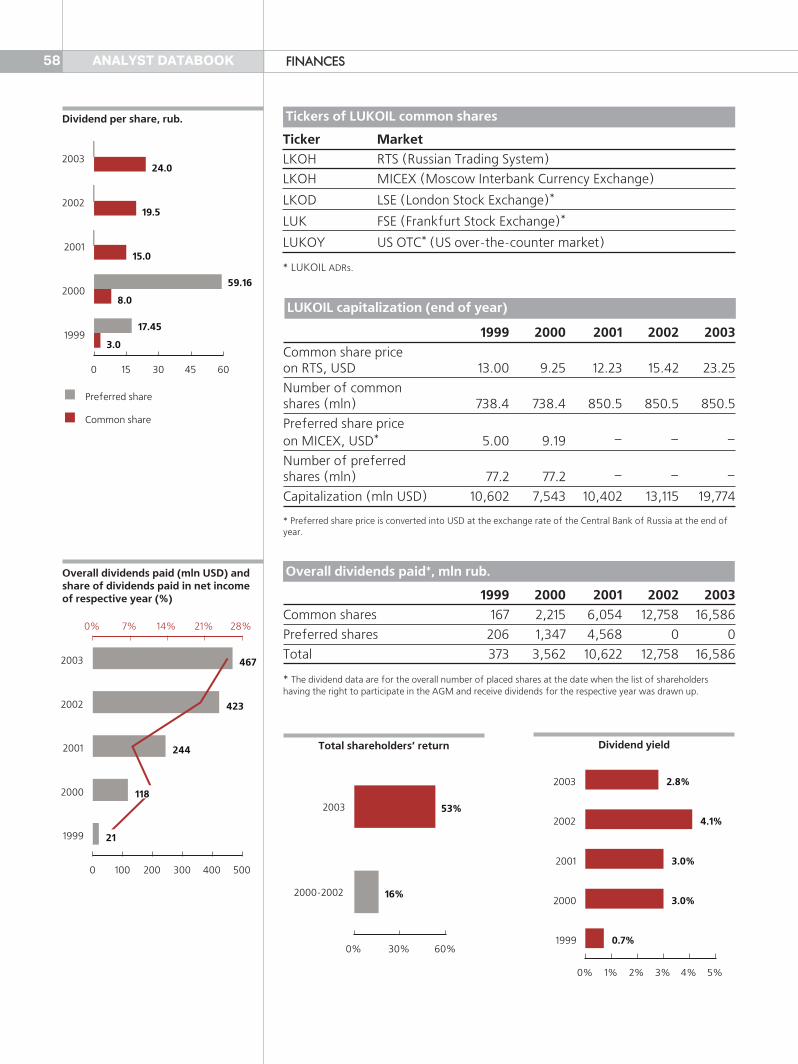
1999 2000 2001 2002 2003Common shares 167 2,215 6,054 12,758 16,586
Preferred shares 206 1,347 4,568 0 0
Total 373 3,562 10,622 12,758 16,586
* The dividend data are for the overall number of placed shares at the date when the list of shareholdershaving the right to participate in the AGM and receive dividends for the respective year was drawn up.
58 ANALYST DATABOOK
2000�2002
2003
0% 30% 60%
16%
53%
Total shareholders’ return
1999
2000
2001
2002
2003
0 15 30 45 60
3.0
17.45
8.0
59.16
15.0
0
19.5
0
24.0
0
Common share
Preferred share
Dividend per share, rub.
1999
2000
2001
2002
2003
0 100 200 300 400 500
0% 7% 14% 21% 28%
21
118
244
423
467
Overall dividends paid (mln USD) andshare of dividends paid in net incomeof respective year (%)
Overall dividends paid*, mln rub.
1999 2000 2001 2002 2003Common share priceon RTS, USD 13.00 9.25 12.23 15.42 23.25
Number of commonshares (mln) 738.4 738.4 850.5 850.5 850.5
Preferred share priceon MICEX, USD* 5.00 9.19 – – –
Number of preferredshares (mln) 77.2 77.2 – – –
Capitalization (mln USD) 10,602 7,543 10,402 13,115 19,774
* Preferred share price is converted into USD at the exchange rate of the Central Bank of Russia at the end ofyear.
LUKOIL capitalization (end of year)
Ticker MarketLKOH RTS (Russian Trading System)
LKOH MICEX (Moscow Interbank Currency Exchange)
LKOD LSE (London Stock Exchange)*
LUK FSE (Frankfurt Stock Exchange)*
LUKOY US OTC* (US over�the�counter market)
* LUKOIL ADRs.
Tickers of LUKOIL common shares
FFIINNAANNCCEESS
1999
2000
2001
2002
2003
0% 1% 2% 3% 4% 5%
0.7%
3.0%
3.0%
4.1%
2.8%
Dividend yield

59ANALYST DATABOOK
1999 2000 2001 2002 2003
REVENUES
Sales(including excise and export tariffs) 7,544 13,210 13,426 15,334 22,118
Equity share in income of affiliates 88 230 136 115 181
Total revenues 7,632 13,440 13,562 15,449 22,299
COSTS AND OTHER DEDUCTIONS
Operating expenses (2,622) (1,628) (2,584) (2,403) (2,546)
Cost of purchased crude oil and petroleum products — (2,597) (2,087) (2,693) (5,909)
Transportation expenses — (735) (919) (1,414) (2,052)
Selling, general and administrative expenses (1,623) (1,221) (1,375) (1,313) (1,800)
Depreciation, depletion and amortization (598) (838) (886) (824) (920)
Taxes other than income taxes (527) (1,050) (1,010) (1,972) (2,456)
Excise and export tariffs (460) (932) (1,456) (1,996) (2,954)
Exploration expense (61) (130) (144) (89) (136)
Gain from sale of interest inAzeri Chirag Gyuneshli — — — — 1 130
Loss on disposal and impairment of assets (49) (247) (153) (83) (69)
Income from operating activities 1,692 4,062 2,948 2,662 4,587
Interest expense (192) (198) (257) (222) (273)
Interest and dividend income 73 209 146 160 139
Currency translation gain (loss) (34) 1 (33) 40 148
Other non�operating income (168) 71 31 11 11
Minority interest (34) (61) (52) (69) (36)
Income before income taxes 1,337 4,084 2,783 2,582 4,576
Current income taxes (390) (790) (861) (834) (939)
Deferred income taxes 115 18 187 95 (68)
Total income tax expense (275) (772) (674) (739) (1,007)
Cumulative effect of change in accounting principle,net of tax — — — — 132
Net income 1,062 3,312 2,109 1,843 3,701
Dividends declared on preferred stock (8) (47) (157) — —
Net income available for common shareholders 1,054 3,265 1,952 1,843 3,701
Net income per share of common stock (US dollars)
Basic 1.69 4.83 2.68 2.26 4.52
Diluted 1.69 4.73 2.66 2.26 4.45
Consolidated income statements, mln USD
FFIINNAANNCCEESS
Consolidated Financial Statements

60 ANALYST DATABOOK
1998 1999 2000 2001 2002 2003
A S S E T S
Current assets
Cash and cash equivalents 93 537 1,137 1,170 1,252 1,435
Short�term investments 65 137 253 218 278 251
Accounts and notes receivable, net 1,209 1,598 2,948 2,230 2,511 3,790
Inventories 341 530 719 829 1,063 1,243
Prepaid taxes and other expenses 195 133 675 889 736 818
Other current assets 25 147 362 340 356 334
Assets held for sale – – – – 279 52
Total current assets 1,928 3,082 6,094 5,676 6,475 7,923
Investments 603 750 423 770 934 594
Property, plant and equipment 6,756 8,129 9,906 12,296 13,499 16,639
Deferred income tax assets 150 79 201 291 206 117
Goodwill and other intangible assets 90 251 278 485 399 523
Other non�current assets 116 212 207 424 488 778
Total assets 9,643 12,503 17,109 19,942 22,001 26,574
L I A B I L I T I E S A N D S T O C K H O L D E R S ’ E Q U I T Y
Current liabilities
Accounts payable 948 1,479 2,221 1,402 1,293 1,564
Short�term borrowings and current portionof long�term debt 591 728 829 1,031 1,772 1,412
Customer deposits and other borrowingsof banking subsidiaries — — — 449 755 1,007
Taxes payable 443 569 404 522 640 943
Other current liabilities 202 110 238 421 337 345
Total current liabilities 2,184 2,886 3,692 3,825 4,797 5,271
Long�term debt 1,483 1,769 1,483 1,948 1,666 2,392
Deferred income tax liabilities 219 146 284 390 261 497
Asset retirement obligations — — — — — 210
Other long�term liabilities 100 145 147 463 397 249
Minority interest in subsidiary companies 72 484 984 931 880 483
Total liabilities 4,058 5,430 6,590 7,557 8,001 9,102
Stockholders’ equity
Common stock 14 14 14 15 15 15
Preferred stock 1 1 1 — — —
Treasury stock, at cost (426) (549) (376) (403) (428) (435)
Additional paid�in capital 2,245 2,816 2,895 3,044 3,229 3,522
Retained earnings 3,756 4,803 7,994 9,738 11,186 14,371
Accumulated other comprehensive loss (5) (12) (9) (9) (2) (1)
Total stockholders’ equity 5,585 7,073 10,519 12,385 14,000 17,472
Total liabilities and stockholders’ equity 9,643 12,503 17,109 19,942 22,001 26,574
Consolidated balance sheets (as of December 31), mln USD
FFIINNAANNCCEESS
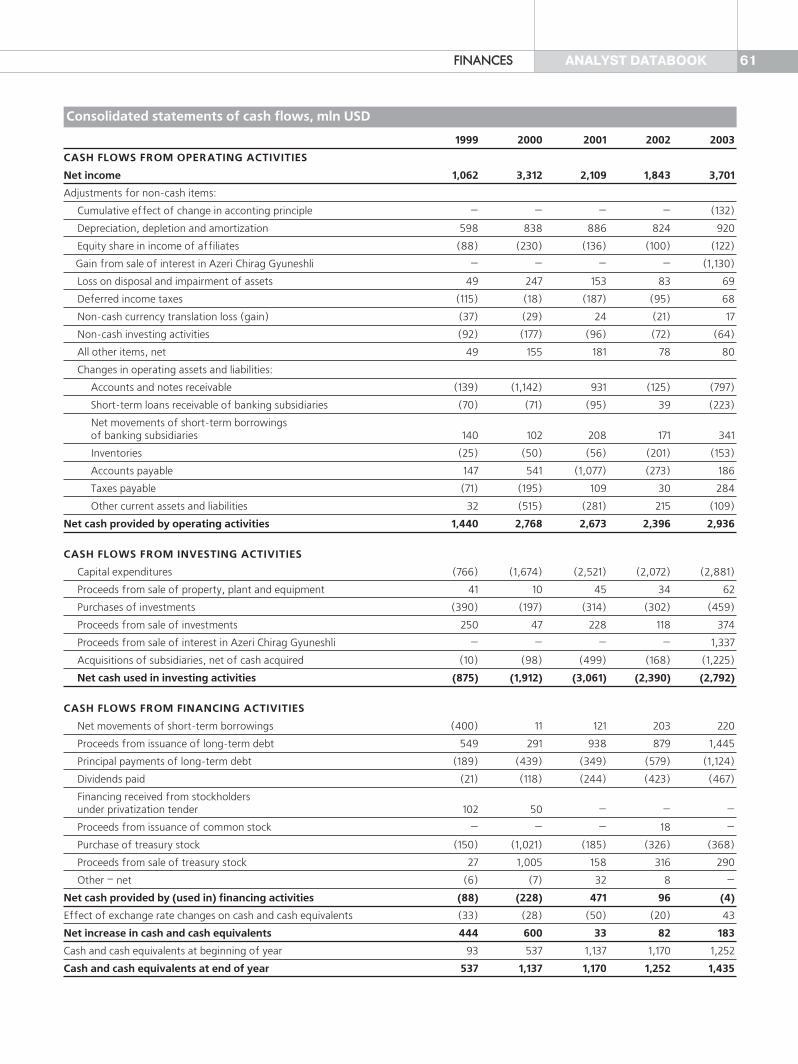
61ANALYST DATABOOK
1999 2000 2001 2002 2003
CASH FLOWS FROM OPERATING ACTIVITIES
Net income 1,062 3,312 2,109 1,843 3,701
Adjustments for non�cash items:
Cumulative effect of change in acconting principle — — — — (132)
Depreciation, depletion and amortization 598 838 886 824 920
Equity share in income of affiliates (88) (230) (136) (100) (122)
Gain from sale of interest in Azeri Chirag Gyuneshli — — — — (1,130)
Loss on disposal and impairment of assets 49 247 153 83 69
Deferred income taxes (115) (18) (187) (95) 68
Non�cash currency translation loss (gain) (37) (29) 24 (21) 17
Non�cash investing activities (92) (177) (96) (72) (64)
All other items, net 49 155 181 78 80
Changes in operating assets and liabilities:
Accounts and notes receivable (139) (1,142) 931 (125) (797)
Short�term loans receivable of banking subsidiaries (70) (71) (95) 39 (223)
Net movements of short�term borrowingsof banking subsidiaries 140 102 208 171 341
Inventories (25) (50) (56) (201) (153)
Accounts payable 147 541 (1,077) (273) 186
Taxes payable (71) (195) 109 30 284
Other current assets and liabilities 32 (515) (281) 215 (109)
Net cash provided by operating activities 1,440 2,768 2,673 2,396 2,936
CASH FLOWS FROM INVESTING ACTIVITIES
Capital expenditures (766) (1,674) (2,521) (2,072) (2,881)
Proceeds from sale of property, plant and equipment 41 10 45 34 62
Purchases of investments (390) (197) (314) (302) (459)
Proceeds from sale of investments 250 47 228 118 374
Proceeds from sale of interest in Azeri Chirag Gyuneshli — — — — 1,337
Acquisitions of subsidiaries, net of cash acquired (10) (98) (499) (168) (1,225)
Net cash used in investing activities (875) (1,912) (3,061) (2,390) (2,792)
CASH FLOWS FROM FINANCING ACTIVITIES
Net movements of short�term borrowings (400) 11 121 203 220
Proceeds from issuance of long�term debt 549 291 938 879 1,445
Principal payments of long�term debt (189) (439) (349) (579) (1,124)
Dividends paid (21) (118) (244) (423) (467)
Financing received from stockholders under privatization tender 102 50 — — —
Proceeds from issuance of common stock — — — 18 —
Purchase of treasury stock (150) (1,021) (185) (326) (368)
Proceeds from sale of treasury stock 27 1,005 158 316 290
Other – net (6) (7) 32 8 —
Net cash provided by (used in) financing activities (88) (228) 471 96 (4)
Effect of exchange rate changes on cash and cash equivalents (33) (28) (50) (20) 43
Net increase in cash and cash equivalents 444 600 33 82 183
Cash and cash equivalents at beginning of year 93 537 1,137 1,170 1,252
Cash and cash equivalents at end of year 537 1,137 1,170 1,252 1,435
Consolidated statements of cash flows, mln USD
FFIINNAANNCCEESS

ANALYST DATABOOK62
1999 2000 2001 2002 2003
CAPITAL EXPENDITURES
Exploration and production 388 945 1,789 1,411 1,324
Russia 332 648 1,543 1,078 1,106
International 56 297 246 333 218
Refining, marketing and distribution 470 922 828 793 855
Russia 385 738 645 683 673
International 85 184 183 110 182
Total 858 1,867 2,617 2,204 2,179
Acquisitions of subsidiaries
Exploration and production 3 45 467 67 876
Russia 3 45 467 67 876
International 0 0 0 0 0
Refining, marketing and distribution 81 118 94 110 172
Russia 0 0 35 53 24
International 81 118 59 57 148
Less cash acquired (74) (65) (62) (4) (40)
Total 10 98 499 173 1,008
1999 2000 2001 2002 2003
Net income, mln USD 1,062 3,312 2,109 1,843 3,701
EBIT, mln USD 1,456 4,073 2,894 2,644 4,710
EBITDA, mln USD 2,054 4,911 3,780 3,468 5,630
Operating margin, % 22.4 30.7 22.0 17.4 20.7
Pretax margin, % 17.7 30.9 20.7 16.8 20.7
Net margin, % 14.1 25.1 15.7 12.0 16.7
Return on equity, % 16.8 37.7 18.4 14.0 23.5
Return on total assets, % 9.6 22.4 11.4 8.8 15.2
Return on non�current assets, % 12.4 32.4 16.7 12.4 21.7
ROACE, % 14.6 31.3 16.8 12.6 20.5
FFIINNAANNCCEESS
1999 2000 2001 2002 20030
500
1,000
1,500
2,000
2,500
3,000
Exploration and productionRefining, marketing and distribution
Capital expenditures, mln USD
1999 2000 2001 2002 20030
300
600
900
1,200
Acquisitions of subsidiaries, mln USD
Capital expenditures, mln USD
Profitability ratios

63ANALYST DATABOOKFFIINNAANNCCEESS
Total assets to equity
1999 2000 2001 2002 2003
Net debt, mln USD 1,960 1,175 2,258 2,941 3,376
Total debt to equity, % 35.3 22.0 27.7 30.0 27.5
Long�term debt to equity, % 25.0 14.1 15.7 11.9 13.7
Total net debt to net cash flow providedby operating activities, % 136.1 42.4 84.5 122.7 115.0
Total liabilities to total assets, % 43.4 38.5 37.9 36.4 34.3
Total liabilities to equity,% 76.8 62.6 61.0 57.2 52.1
EV/DACF 7.9 3.0 4.3 6.0 7.0
Gearing ratios (as of December 31 )
1999 2000 2001 2002 2003
Quick ratio 0.88 1.46 1.27 1.13 1.27
Current ratio 1.07 1.65 1.48 1.35 1.50
Total assets to equity 1.77 1.63 1.61 1.57 1.52
Liquidity ratios (as of December 31)
Total liabilities to total assets
ROACEReturn on equityNet margin
1999 2000 2001 2002 200320%
24%
28%
32%
36%
1999 2000 2001 2002 200310%
14%
18%
22%
26%
1999 2000 2001 2002 20031.0
1.2
1.4
1.6
1.8
1999 2000 2001 2002 20031.5
1.6
1.7
1.8
1999 2000 2001 2002 20030.8
1.0
1.2
1.4
1.6
1999 2000 2001 2002 200334%
37%
39%
42%
44%
1999 2000 2001 2002 200312%
17%
22%
27%
32%
1999 2000 2001 2002 200310%
20%
30%
40%
1999 2000 2001 2002 200310%
14%
18%
22%
26%
Total debt to equity Long�term debt to equity
Quick ratio Current ratio
64 ANALYST DATABOOK RREEFFEERREENNCCEE IINNFFOORRMMAATTIIOONN
All data in the Document are at 1 January, 2004. Any changes which have occurred after this date are notcovered by the Document.
Concepts and Terms Used in the DocumentThe references to LUKOIL, LUKOIL Group, 'the company', 'we' and 'our' in this document all refer to LUKOIL and/orits subsidiary enterprises, depending upon the context, in which the terms are used.
Sources of informationData from the following sources are used in this document:
AbbreviationsUSD — United States Dollarsboe — barrel of oil equivalent (1 boe = 6,000 cft of gas)
Reference Information
More information about the company is available at LUKOIL's website at www.lukoil.ru (Russian version) orwww.lukoil.com (English version).By visiting out site you can find out more about LUKOIL's main businesses and company results, as well as stayinginformed of current company news across the spectrum of LUKOIL activities. The site also provides informationabout company policy and involvement in social and environmental affairs. A section of the site for investors and shareholders provides the company's financial results, history of dividendpayments, share prices and accounts. A number of presentations for the investment community are also availablethrough this section of the site.
Legal Address and Central Office11, Sretensky Bulvar, Moscow, Russia 101 000
Central Information ServiceTel: +7 (095) 927�44�44, 928�98�41 Fax: +7 (095) 916�00�20Telex: 612 553 LUK SU
Shareholder Relations DepartmentTel: +7 (095) 927�48�84, 933�98�55Fax: +7 (095) 927�48�11Email: [email protected]
Investor Relations DepartmentTel: + 7 (095) 927�16�96Fax: + 7 (095) 933�92�88Email: [email protected]
Press ServiceTel: +7 (095) 927�16�77Fax: 7 (095) 927�16�53Email: [email protected]
LUKOIL Stock & Consulting Center 24, Ulitsa Petrovka, Moscow, Russia 127 051Tel: + 7 (095) 927�43�80, 933�99�18
NIKOIL Registrar Company28, 3rd Ulitsa Yamskovo Polya,Moscow, Russia 125 124Tel/fax: + 7 (095) 755�90�77
LUKOIL PublicationsAn electronic version of the followingfinancial reports for 2003 are availablein the Investor Center of the companyweb site (www.lukoil.com/ir)1. Annual Report.2. Consolidated Financial Accounts.3. Quarterly Consolidated FinancialAccounts.4. Management Discussion ofCompany Performance.
Information provided by the Ministry of Industry andEnergy of Russia
Information provided by the State Committee of theRussian Federation of Statistics
Annual reports of major international private oilcompanies
Statistical Review of World Energy 2003 (BritishPetroleum)
Annual Statistical Bulletin (OPEC)
Wordwide Refineries�Capacities as of January 1,2004 (Oil&Gas Journal)