Rotorcraft Operations and Statistics-+FAASTeam+Conference+Mar... · Rotorcraft Operations and...
65
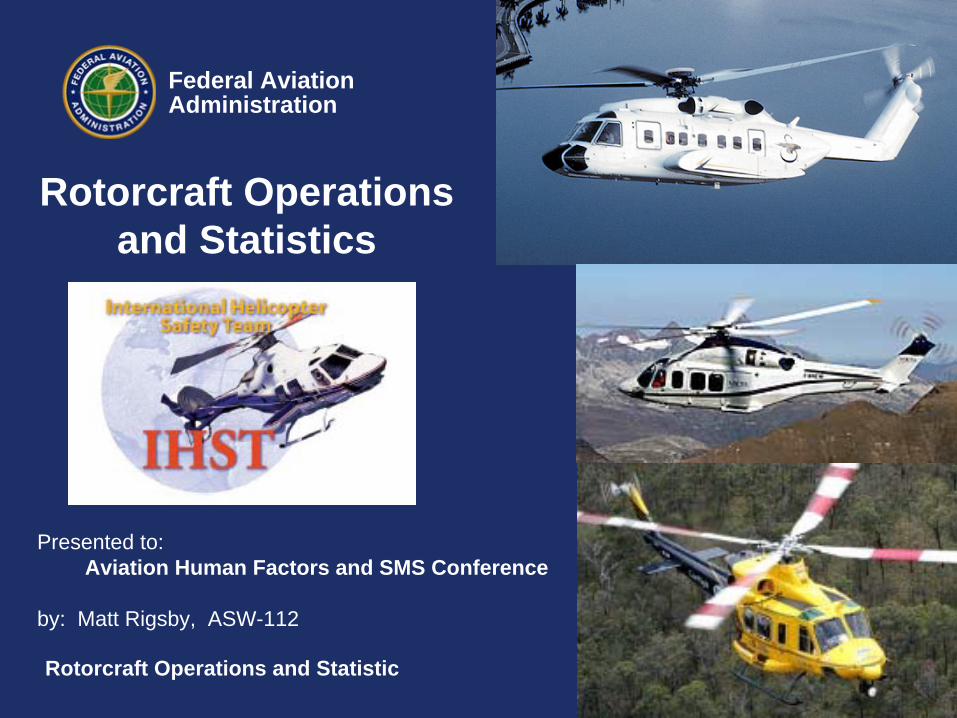
Federal Aviation Administration 0 Rotorcraft Operations and Statistic 0 Rotorcraft Operations and Statistics Presented to: Aviation Human Factors and SMS Conference by: Matt Rigsby, ASW-112 Federal Aviation Administration
Transcript of Rotorcraft Operations and Statistics-+FAASTeam+Conference+Mar... · Rotorcraft Operations and...
Federal AviationAdministration 0Rotorcraft Operations and Statistic 0
Rotorcraft Operations and Statistics
Presented to:Aviation Human Factors and SMS Conference
by: Matt Rigsby, ASW-112
Federal AviationAdministration

1Federal AviationAdministration 1Rotorcraft Operations and Statistic
Helicopters: They Just Aren’t “Normal”!!The use and range of operations in helicopters is so diverse. More often than not they are operated independently and at the sole discretion and supervision of a single pilot. This is an awesome responsibility and the KEY to preventing accidents/incidents!!
Helicopters are used for:Electronic News Gathering (ENG)TrafficFish spottingLaw EnforcementFire FightingAir MedicalForest ServiceAgriculturalOff-ShoreSeismicAir CarrierAir touretc……….

2Federal AviationAdministration 2Rotorcraft Operations and Statistic

3Federal AviationAdministration 3Rotorcraft Operations and Statistic
Worldwide participation is key to success
Worldwide Civil Helicopter Fleet Distribution34395 rotorcraft
New Zealand 750 2%Mexico 343 1%
Others 2719 8%
South Africa 577 2% GCC 250 1%
India 247 0.6%
Japan 815 2%
Europe 6860 20%
Russia 1860 5%
Canada 2350 7%
Brazil 1255 4%Australia 2100 6%
United States 14269 41%
IHST Partner
Source : IHST– Dec 2009

4Federal AviationAdministration 4Rotorcraft Operations and Statistic
2011 U.S. Civil Helicopter Fleet (11,755 Total Aircraft)
Approximately 3.4 million flight hours annually.
50% 50%RecipTurbine

5Federal AviationAdministration 5Rotorcraft Operations and Statistic
http://www.faa.gov/library/manuals/aircraft/media/faa-h-8083-21.pdf
Where to go to find out more!!

6Federal AviationAdministration 6Rotorcraft Operations and Statistic
Rotorcraft Directorate ASW-100
Kim Smith, Directorate Manager ASW-100817-222-5100
Lance Gant, Asst. Dire. Mgr. ASW-101817-222-5101
Scott Horn, Technical Advisor, Rotorcraft Directorate 817-222-5101; [email protected]
Larry Kelly, Rotorcraft Standards Staff Manager, ASW-110817-222-5110; [email protected]
Jorge Castillo, Regulations and Policy Group Manager, ASW-111;817-222-5111; [email protected]
TBD, Safety Management Group Manager, ASW-112817-222-5112
http://www.faa.gov/aircraft/air_cert/
7Federal AviationAdministration 7Rotorcraft Operations and Statistic
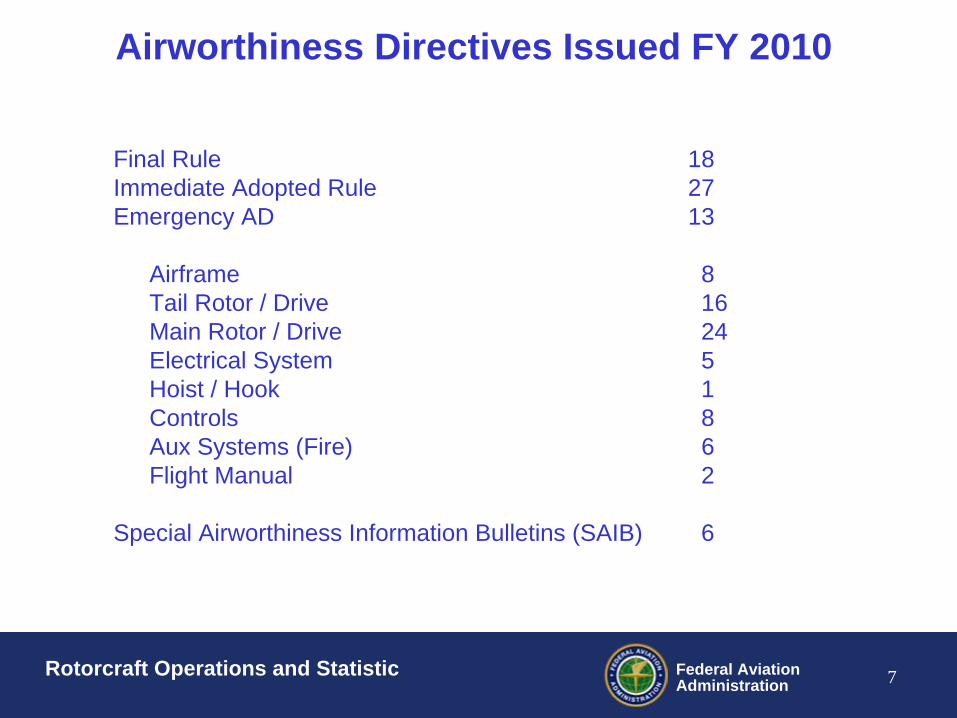
Airworthiness Directives Issued FY 2010
Final Rule 18Immediate Adopted Rule 27Emergency AD 13
Airframe 8Tail Rotor / Drive 16Main Rotor / Drive 24Electrical System 5Hoist / Hook 1Controls 8Aux Systems (Fire) 6Flight Manual 2
Special Airworthiness Information Bulletins (SAIB) 6

8Federal AviationAdministration 8Rotorcraft Operations and Statistic
The Bottom Line
We need to reduce the rate/number of rotorcraft accidents and incidents.
The size, age, and diverse missions of the rotorcraft fleet necessitates the need to do business differently. Avg age for a helicopter in the US 24 yrs
FAA is Committed to International Helicopter Safety Team goal of 80% reduction in accidents by 2016.

9Federal AviationAdministration 9Rotorcraft Operations and Statistic
IHST Metrics - Flight Hours 10 August 2010 9
IHST US Registered Progress Toward 80% Goal (Through December 2010)

10Federal AviationAdministration 10Rotorcraft Operations and Statistic
Current IHST Toolkits (Answers 8 of the Top 10 NTSB Recommendations or Helicopters)
www.IHTS.org
Helicopter Flight Data Monitoring Toolkit• Install Cockpit Recording Devices
Training Toolkit• Training Emphasis for Maintaining Awareness of Cues Critical to Safe Flight• Autorotation Training Program• In-flight Power/Energy Management Training• ADM Training
SMS Toolkit• Mission Specific Risk Management Program• Establish mission Specific SOP and Flight OPS Oversight Program
Maintenance Toolkit• Follow ICA Procedures with Confirmation of Compliance

11Federal AviationAdministration 11Rotorcraft Operations and Statistic
Statistics They don’t cause accidents,
but they may be used to prevent them!

12Federal AviationAdministration 12Rotorcraft Operations and Statistic
FY 11 – U.S. Registered Rotorcraft Accidents
* The NTSB may have classified some Public Use accidents as Part 91, 133, or 137. Data published here may not match the NTSB classification.
Cumulative Rotorcraft Accidents – 39 (6 Fatal Accidents)Same period previous FY: 49 Total Helicopter Accidents (8 Fatal Accidents)
Accident Operations Summary (Cumulative)EMS
91/135
GOM 91/ 135
Part133
Part 135 Other
Air Tour135/136
Part 137
Part 141
ENG 91/135
GA91
Public Use
N Reg Outside
U.S.N Reg
Military
4 4 1 5 1 17 3 3 1
0 1 0 0 0 2 2 1 0
0 1 0 0 0 2 2 3 0
Oct Nov Dec Jan Feb Mar Apr May Jun Jul Aug Sep Total
10 8 8 6 7 39
3 2 0 1 0 6
5 2 0 1 0 8
Accidents:
Fatal:
Fatalities:
Accidents:
Fatal:
Fatalities:
Data Source: FAA, NTSB Databases. Includes only events classified as accidents and does not include incidents. The accident numbers for each month of the Fiscal Year may vary from the previous monthly briefing based on analysis between FAA and NTSB databases for the specified month. The NTSB database may include accidents that were not reported to this office resulting in slightly different numbers.
Acronyms: EMS = Emergency Medical Services, ENG = Electronic News Gathering, GA = General Aviation, GOM = Gulf of Mexico
13Federal AviationAdministration 13Rotorcraft Operations and Statistic
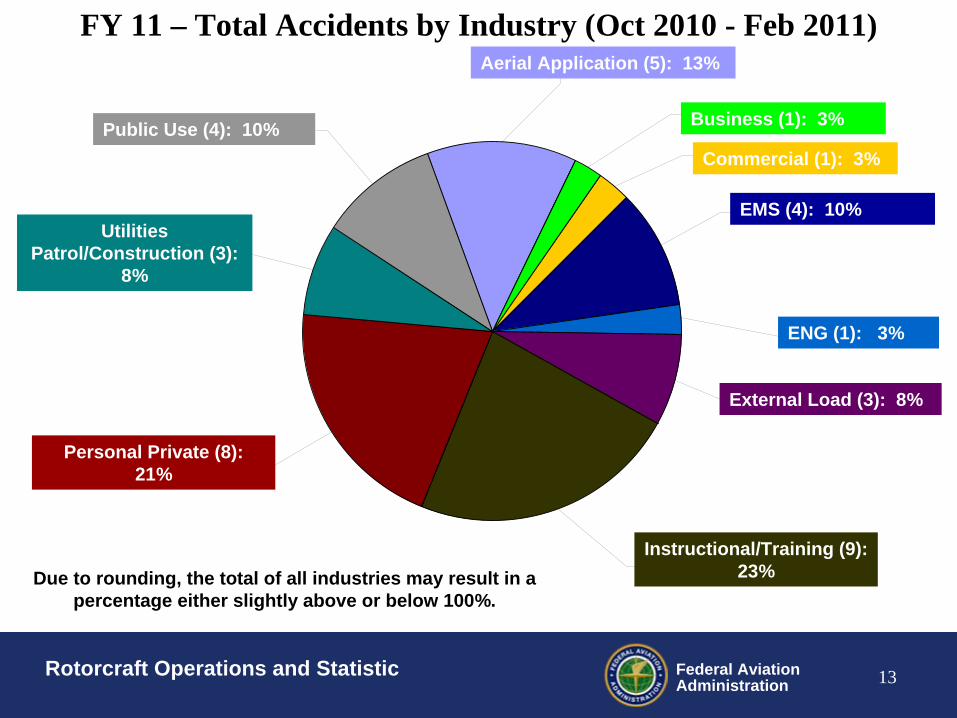
External Load, 7.7%
ENG, 2.6%
EMS, 10.3%
Commercial, 2.6%
Business, 2.6%
Utilities Patrol/Construction 7.7%
Public Use 10.3%
Aerial Application 12.8%
Instructional/Training 23.1%
Personal/Private 20.5%
FY 11 – Total Accidents by Industry (Oct 2010 - Feb 2011)
Public Use (4): 10%
Utilities Patrol/Construction (3):
8%
Personal Private (8): 21%
Aerial Application (5): 13%
Instructional/Training (9): 23%
ENG (1): 3%
External Load (3): 8%
EMS (4): 10%
Business (1): 3%
Commercial (1): 3%
Due to rounding, the total of all industries may result in a percentage either slightly above or below 100%.

14Federal AviationAdministration 14Rotorcraft Operations and Statistic
Utilities Patrol/Construction 16.7%
Public Use 33.3%Personal/Private
33.3%
External Load, 16.7%
FY 11 – Total FATAL Accidents by Industry (Oct 2010 -Feb 2011)Utilities
Patrol/Construction (1): 17%
Personal Private (2): 33%
Public Use (2): 33%
External Load (1): 17%
Due to rounding, the total of all industries may result in a percentage either slightly
above or below 100%.

15Federal AviationAdministration 15Rotorcraft Operations and Statistic
U.S. Registered Rotorcraft Accidents FY83 - Feb FY11
239252
232218
182172
193
231
191185
166
211
174
147158
164
179
197
182190 192
180188
161152
140 142
393730
43 4236
15
31 34 3341
34 3828 24
31 29 30 3526
32 3037
23 2822
3125 27
6
159
0
50
100
150
200
250
300
FY83 FY84 FY85 FY86 FY87 FY88 FY89 FY90 FY91 FY92 FY93 FY94 FY95 FY96 FY97 FY98 FY99 FY00 FY01 FY02 FY03 FY04 FY05 FY06 FY07 FY08 FY09 FY10 FY11
Fiscal Year
Acc
iden
ts
Accidents Per Year Fatal Accidents Per Year
Source: NTSB data as of 3/1/2011

16Federal AviationAdministration 16Rotorcraft Operations and Statistic
NTSB MOST WANTED LIST – Aviation
• The FAA should:• Improve Oversight of Pilot Proficiency• Require Image Recorders• Improve the Safety of Emergency Medical Services (EMS)
Flights• Conduct all flights with medical personnel on board in
accordance with stricter commuter aircraft regulations.• Develop and implement flight risk evaluation programs for
EMS operators.• Require formalized dispatch and flight-following procedures
including up-to-date weather information.• Install terrain awareness and warning systems (TAWS) on
aircraft used for EMS operations.• Improve Crew Resource Management• Reduce Accidents and Incidents Caused by Human Fatigue in
the Aviation Industry
17Federal AviationAdministration 17Rotorcraft Operations and Statistic
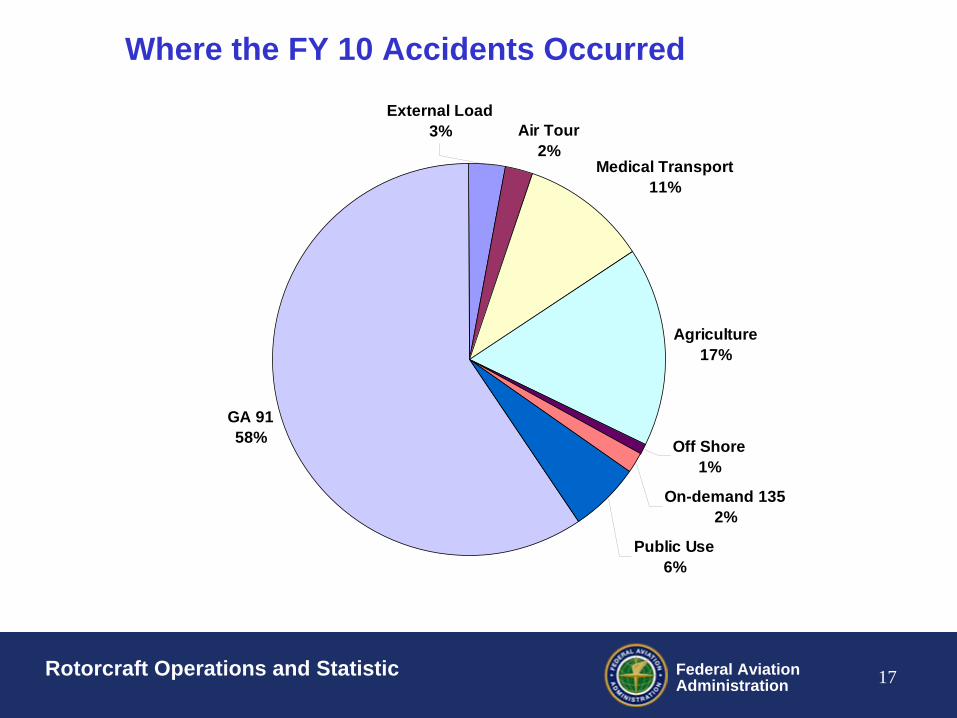
Air Tour 2%
Medical Transport11%
Agriculture17%
Off Shore1%
On-demand 1352%
Public Use6%
GA 9158%
External Load 3%
Where the FY 10 Accidents Occurred

18Federal AviationAdministration 18Rotorcraft Operations and Statistic
External Load 5%
Air Tour 0%
Medical Transport
33%
Agriculture14%
GA 9143%
Off Shore0%
Public Use5%
On-demand 1350%
Where the FY 10 Fatal Accidents Occurred

19Federal AviationAdministration 19Rotorcraft Operations and Statistic
Top Operational Causes of Fatal Rotorcraft Accidents1996 – 2007 (+Mid airs)
34 34
18
12 11
6 64
64
22 1 1
7
24 5
31 1 1 22 1 1 2
0
5
10
15
20
25
30
35
40
Wir
e/O
bjec
tSt
rike
s
CFI
TL
and/
Wat
er
Rot
or R
PMD
ecay
CFI
TW
X/IM
C
Dyn
amic
Rol
love
r
LT
E
Unk
now
n
Perf
orm
ance
CFI
TW
X/IM
C
Oth
er/M
isc
Mid
Air
91133135137
Data Source: FAA ASAP (SDR Database)

20Federal AviationAdministration 20Rotorcraft Operations and Statistic
Top Ten Mechanical Causes of Fatal Rotorcraft Accidents 1996 - 2007
Data Source: FAA ASAP (SDR Database)
71
57
3430
129 8
14
2426
0
10
20
30
40
50
60
70
80
ENG
INE
(REC
IP)
ENG
INE
(TU
RB
INE)
FLIG
HT
CO
NTR
OL
ENG
INE
FUEL
AN
DC
ON
TRO
L
MA
IN R
OTO
RD
RIV
ESY
STEM
TAIL
RO
TOR
DR
IVE
SYST
EM
MA
IN R
OTO
RSY
STEM
TAIL
RO
TOR
SYST
EM
AIR
CR
AFT
FUEL
SYST
EM
LAN
DIN
GG
EAR
SYST
EM
HUMS & FDR Monitoring

21Federal AviationAdministration 21Rotorcraft Operations and Statistic
Don’t forget about the
maintenance / manufacturing side
of the house!!!
AS350BA Princeville, HI NTSB# NYC07MA073 MDHI 369FF Haena, HI NTSB# CHI07MA083
Robinson R44 Ponte Verda Beach, FL NTSB# DEN07FA079
Fatigue & Distractions
Lack of training / experience/ cutting corners Part manufacturing defect

22Federal AviationAdministration 22Rotorcraft Operations and Statistic
Helicopter Operations

23Federal AviationAdministration 23Rotorcraft Operations and Statistic
Air Tour

24Federal AviationAdministration 24Rotorcraft Operations and Statistic
The Accident Numbers - Where We’ve Been
Air Tour 1982- Mar 07
53%47% Helicopter
Airplane166 190
Total 356
* FAA Accident Incident Database

25Federal AviationAdministration 25Rotorcraft Operations and Statistic
Air Tour Fatal 1982 - Mar 07
46%54%
HelicopterAirplane
48 41
Total 89
Of the 41 fatal Helicopter accidents:200 people on board129 fatalities37 Serious Injuries
Of the 48 fatal Airplane accidents:266 people on board210 fatalities42 Serious Injuries
* FAA Accident Incident Database
The Accident Numbers - Where We’ve Been

26Federal AviationAdministration 26Rotorcraft Operations and Statistic
All Air Tour 91 vs. 135
63%
37%
Part 91 Part 135
132
224
1982 – Mar 2007
&
53 Total Fatal Part 91 ops
36 Total Fatal Part 135 ops
* FAA Accident Incident Database
The Accident Numbers - Where We’ve Been

27Federal AviationAdministration 27Rotorcraft Operations and Statistic
Air Tour Helicopters 1982 – 2007 191 Accidents
* FAA Accident Incident Database
51%
20%
8%
9%
7%5%
human factors
engine failure
mechanical failure
weather
probable cause undetermined
structural failure
96
38
16
13
18
10
The Accident Numbers - Where We’ve Been

28Federal AviationAdministration 28Rotorcraft Operations and Statistic
Electronic News Gathering (ENG)

29Federal AviationAdministration 29Rotorcraft Operations and Statistic
Helicopter Accident Numbers Electronic News Gathering 1982 - 2007
Total number of Accidents 46Incidents 10
Fatal ENG Accident 14Total Fatalities 25
Night Accidents 8Inadvertent IMC Accidents (night) 6
(% of ENG ops at Night ??)
Part 91 43 (13 fatal)Part 135 3 (1 fatal)

30Federal AviationAdministration 30Rotorcraft Operations and Statistic
Causal Factor #46 Total Accidents
23%
17%
13%
11%
9%
9%
9%
9%
Mechanical
Power Loss
VFR Into IMC
Mid Airs
Improper AC control
LTE
Fuel Exhaust/Con
Wire strike
11
8
6
5
4
4
4
4
Helicopter Accident NumbersElectronic News Gathering 1982 - 2007

31Federal AviationAdministration 31Rotorcraft Operations and Statistic
Gulf of Mexico Operations

32Federal AviationAdministration 32Rotorcraft Operations and Statistic
Helicopter Safety Advisory Council
www.hsac.org

33Federal AviationAdministration 33Rotorcraft Operations and Statistic
• 16,000 square miles
• 900 oil fields, 9 billion dollars generated
• 250,000 miles of pipeline
• 35,000 work force
• 3% of U.S. Gross National Product
• Deep water 200+ miles off shore is where the black gold is, that is where they are going.
Gulf of Mexico (GOMEX)
Data extracted from voluntary input of 13 helicopter operators Gulf of Mexico

34Federal AviationAdministration 34Rotorcraft Operations and Statistic
• 13 helicopter operators, with more than 500 helicopters
• Average 3400 - 3500 flights per day.
• 4000 “Non-Public” landing sites.
• 8 hour flying days with >100 take-offs & landings.
• Deep water exploration increasing, landing on drilling boats.
• Predominately VFR operations w/some limited IFR / night ops.
• 2008 – Fewest Total Accidents since 1984 (first year tracked).
Gulf of Mexico Operations CY 2008

35Federal AviationAdministration 35Rotorcraft Operations and Statistic
Gulf of Mexico Offshore HelicopterOperational Data CY 2008
Data extracted from voluntary input of 13 helicopter operators Gulf of Mexico
*2008 had fewest total accidents since HSAC began gathering statistics in 1984
• 2,936,772 passengers carried for hire
• 410,321 hours flown by 13 operators
• 1,245,770 flights taken
• 20 minutes average flight time
• Heavy twin helicopters are increasing in number.

36Federal AviationAdministration 36Rotorcraft Operations and Statistic
Gulf of Mexico Accident Causes 1999-2008
Power Loss MultipleCauses 18%
Tail Rotor8%
Tie Down2%
Loss of Control andImproper Procedures
14%
Loose Cargo4%CFIT/W
10%
Fuel Management5%
Obstacle Strike13%
Fuel Quality4%
Weather/Non CFIT/W2%
Unknown7%
Helideck Design / Size9%Pax/HLO Procedures
4%
Data Source: HSAC Safety Statistics

37Federal AviationAdministration 37Rotorcraft Operations and Statistic
Expected Benefits from ADS-B
• Provide domestic-type Air Traffic Control Services in the Gulf of Mexico
• Increased airspace capacity by using traditional separation standards as compared to current “grid system”
• Enhanced safety through better air-to-ground communication, surveillance, and weather reporting capabilities• Shared situational awareness with air traffic control and pilots• Mitigate effects of weather on operational decisions
• Improved efficiency under instrument flight rules• Direct routing will cut en-route flight times

38Federal AviationAdministration 38Rotorcraft Operations and Statistic
Gulf of Mexico: Low Altitude
• Low Altitude- Increased ability to fly IFR operations
- Fewer encounters with hazardous weather
- Improved search and rescue

39Federal AviationAdministration 39Rotorcraft Operations and Statistic
Gulf of Mexico Memorandum of Agreement
99% of helicopters
97% of platforms
ADS-B49 Total Partners
Signed May 2006

Federal AviationAdministration 40Rotorcraft Operations and Statistic
Helicopter Emergency Medical Services (HEMS)

41Federal AviationAdministration 41Rotorcraft Operations and Statistic
HEMS Growth
• From the mid 1990’s to present, HEMS increased +300%
• Currently, there are approximately 840 RW aircraft flying HEMS,that number is increasing daily.
• Estimates of +400,000/hrs annually.
• Approximately 500,000 patients transported annually.
• An EMS aircraft takes off every 90 seconds in the United States.
• No formal method of tracking, hours, missions, usage.
• HEMS medical is changing to the “Independent Provider” model.

42Federal AviationAdministration 42Rotorcraft Operations and Statistic

43Federal AviationAdministration 43Rotorcraft Operations and Statistic
840
050
100150200250300350400450500550600650700
80 81 82 83 84 85 86 87 88 89 90 91 92 93 94 95 96 97 98 99 '00 '01 '02 '03 '04 '05 '06 '07
Programs Helicopters 663
230275
* AMPA Dr. Blumen
HEMS Programs and Helicopters

44Federal AviationAdministration 44Rotorcraft Operations and Statistic
Industry Operations
• 2007 - 312 Air Medical Services• 2010 - 309 Air Medical Services (-3)
• 2007 - 664 Bases with Rotor Wing • 2010 - 731 Bases with Rotor Wing (+67)
• 2007 - 810 Helicopters • 2010 - 900 Helicopters (+90)
• 2007- 11 Accidents • 2009 - 9 Accidents
~ 50% night
• 2007 - 16 Off Shore OP/GOM• 2009 - 12 Off Shore GOM (-4)
• 2007 - 128 Rotor Bases• 2009 - 96 Rotor Bases (-32)
• 2007 - 606 Helicopters • 2009 - 495 Helicopters (-111)
• 2007 - 7 Accidents• 2009 - 8 Accidents
~ 8% night
HEMS Off Shore
•Both HEMS and Off Shore ~ 400,0000 Flt hrs annually
•Estimate approx. 400,000 rotor wing medical transports annually

45Federal AviationAdministration 45Rotorcraft Operations and Statistic
HEMS Business Models
Traditional/Hospital based Program-
The hospital contracts with HEMS operators for aviation services, Pilots and MX work for operator, medical works for hospital. The aircraft may be owned or leased by the operator, hospital, or 3rd party.
Community Based -
The helicopter is subsidized by local or state funds to provide the community with HEMS service. The respond to scenes or hospitals, the community can contract or own the service.
Independent Provider program –
The helicopter is based either at the airport, or other location and responds to scene or hospital. No ties/contract with any one hospital. The crews work for the operator (air and med). Operator bill patient for transport and medical.
46Federal AviationAdministration 46Rotorcraft Operations and Statistic
HEMS Mission Categories
Scene Flight – (33% of all flights)
Helicopter is dispatched to a remote location (scene) for patient transport
Inter-Facility Transport – (54% of all flights)
Helicopter transports patients hospital to hospital
Special Needs – (13% of all flights)
Helicopter is used for organ transport, neo-natal care and possible search and rescue.

47Federal AviationAdministration 47Rotorcraft Operations and Statistic
• Aircraft Certification responsible for managing NVIS installations.
• Within the STC operational limitations are called out:• Type of goggle TSO-C164 / DO-275 goggles
• Crew requirements two people on goggles going INTO unimproved areas.
• Little policy or guidance currently out there, it is being worked…
• Cockpit mods and STC changes (NVIS Checklist)
• NVIS Contact for Directorate: Clark Davenport 817-222-5151
HEMS Night Vision Imaging Systems (NVIS)

48Federal AviationAdministration 48Rotorcraft Operations and Statistic
FY06 thru FY 10 US Fatal HEMS Accidents
FY2006 FY2007 FY2008 FY2009 FY 2010
EMS Fatal Accidents 3 1 8* 2 7Part 135 1 0 4 1 1Part 91 2 1 4 1 6
EMS Fatalities 3 3 31 7 19Part 135 1 0 19 4 3Part 91 2 3 12 3 16
*= mid-air between 2 HEMS counted as 1 accident

49Federal AviationAdministration 49Rotorcraft Operations and Statistic
0
2
4
6
8
10
12
14
16
18
20
'02 '03 '04 '05 '06 '07 '08 '09 '10
All Accidents
Fatal
8/04 FAA HEMS Task Force1/05 ADM/SAFO Issued
8/05 Risk Assessment Notice9/05 AMRM AC/ Special emphasis inspections
1/06 LOC/CFIT Notice
Rule Making initiated
Trends In HEMS Accidents/Fatal accidents2002 - present

50Federal AviationAdministration 50Rotorcraft Operations and Statistic
Helicopter Air Ambulance and Commercial Helicopter NPRM
• Notice of Proposed Rulemaking (NPRM) published on Oct 12, 2010 (75 FR 62640)
• Can be found on Federal Register website• http://www.gpoaccess.gov/fr/index.html
• Comments closed January 10, 2011.• This is a formal process• Use the docket

51Federal AviationAdministration 51Rotorcraft Operations and Statistic
Part 137
Agricultural / Restricted Category Aircraft
KA-26

52Federal AviationAdministration 52Rotorcraft Operations and Statistic
Aerial Application Accidents by Calendar Year
23
11
14
8
5
16
14
18
17
14 7% of 198 accidents
8% of 213 accidents
8% of 220 accidents
7% of 196 accidents
7% of 217 accidents
3% of 183 accidents
4% of 198 accidents
9% of 161 accidents
6% of 176 accidents
18% of 131 accidents
0 50 100 150 200 250
2010
2009
2008
2007
2006
2005
2004
2003
2002
2001
Year
Number of Accidents

53Federal AviationAdministration 53Rotorcraft Operations and Statistic
Summary of Calendar Years 2001-2009 vs 2010
• Aerial Application Accidents: 2001-2009• Average of 13 accidents/year• Average of 7% of all U.S. helicopter accidents
• Aerial Application Accidents: 2010• 23 accidents• 18% of all U.S. helicopter accidents

54Federal AviationAdministration 54Rotorcraft Operations and Statistic
Restricted Category OperationsExternal Load (Part 133) and Agricultural (Part 137)
• Higher risk operations
• Aircraft may experience higher loads than other type operations
• Over 60 Restricted Category Type Certificates
• Over 200 Restricted Category aircraft
• Historically higher number of accidents
• More oversight and more stringent requirements for certifying aircraft
• Order 8110.RC
• Higher number mechanical causes of accidents

55Federal AviationAdministration 55Rotorcraft Operations and Statistic
Traceability of Parts
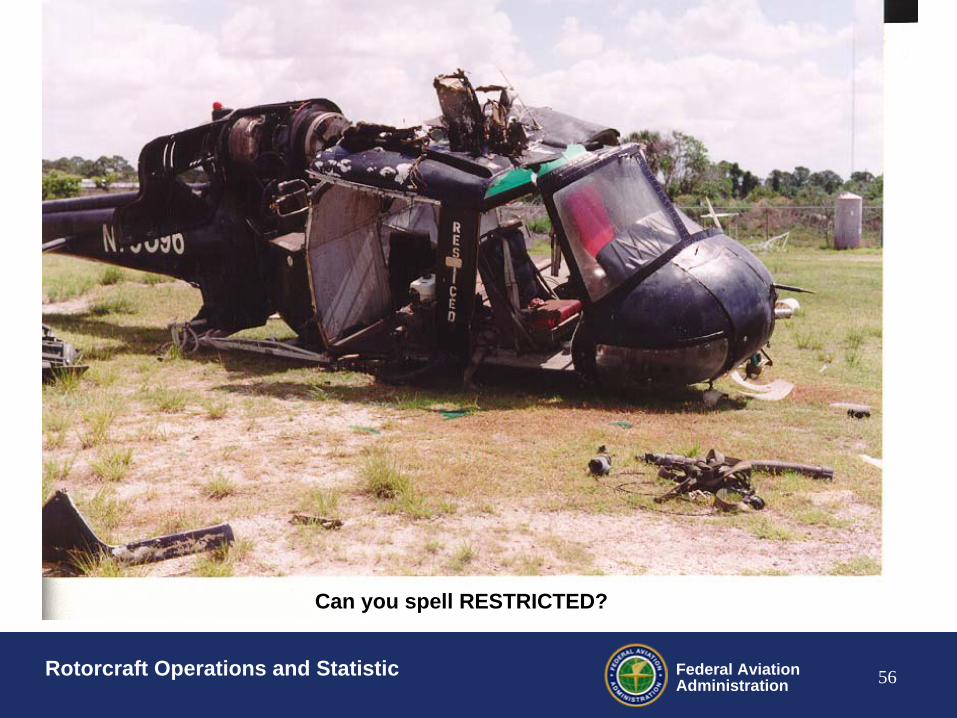
56Federal AviationAdministration 56Rotorcraft Operations and Statistic
Can you spell RESTRICTED?
57Federal AviationAdministration 57Rotorcraft Operations and Statistic
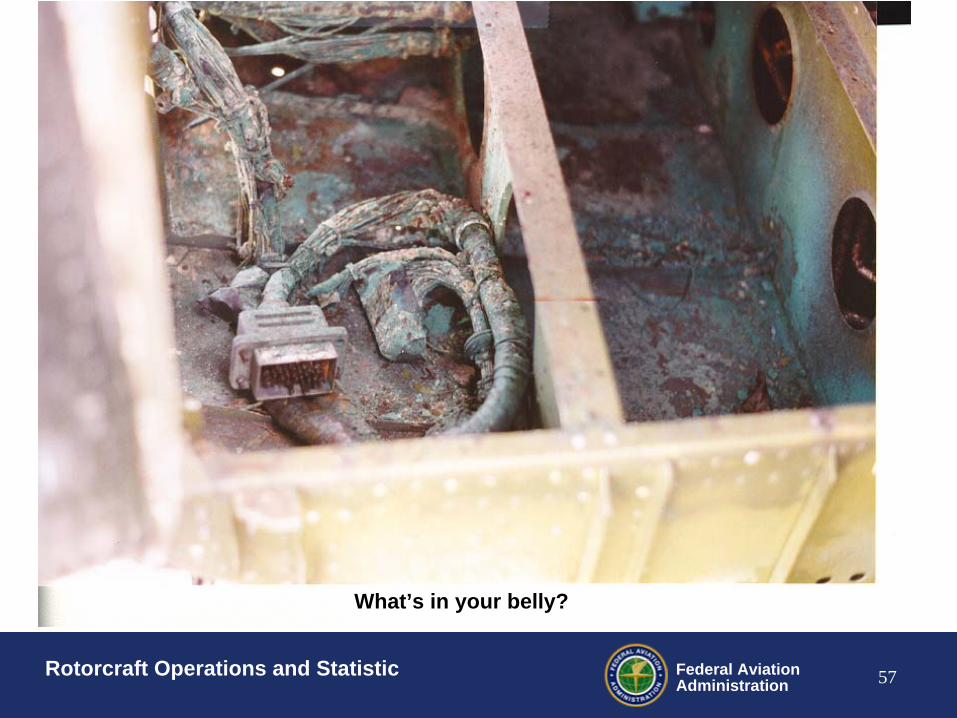
What’s in your belly?

58Federal AviationAdministration 58Rotorcraft Operations and Statistic
Corrosion?

59Federal AviationAdministration 59Rotorcraft Operations and Statistic
60Federal AviationAdministration 60Rotorcraft Operations and Statistic
NTSB
• FTW00RA093• On May 17, 1999, at 1105 eastern standard time, a Bell 206L4 helicopter,
Ecuadorian registration HC-BYQ (serial number 52207), was substantially damaged during impact with water following a loss of control while attempting to takeoff from a remote high altitude field site near Cuenca, Ecuador. The commercial pilot and one of his passengers sustained serious injuries, while two other passengers sustained minor injuries. The helicopter was owned and operated by ICARO S.A, an Ecuadorian air taxi operator based in Quito, Ecuador. Visual meteorological conditions prevailed for the air taxi flight. The flight, which was destined for Guayaquil, Ecuador, was originating at the time of the accident.
The investigation is under the jurisdiction of the Government of the Republic of Ecuador. Any further information may be obtained from:
Direccion General de Aviacion Civil (DGAC) Departamento de Seguridad de Vuelo Buenos Aires 149 y calle 10 de Agosto P.O. Box 2077 Quito, Ecuador
This report is for informational purposes only and contains only information released by or obtained for the Government of Ecuador.

61Federal AviationAdministration 61Rotorcraft Operations and Statistic
Where to go to find out more!!
http://www.hsac.org/
http://www.ihst.org/http://www.rotor.com/
Helicopter Safety Advisory Conference(HSAC)
http://www.amsac.org/
http://www.topsafety.org/

62Federal AviationAdministration 62Rotorcraft Operations and Statistic
• “ .. How long do we have to be in the clouds to be considered IFR??”
• “.. When the wx gets bad, we just go lower..”
• “ we knew if it was going to happen (the accident) it would be him..”
• “ it doesn’t look good, …. But lets give it a try!!”
• “ ..go ask the mechanic how much longer, I don’t care if it has only been ten minutes, it is almost rush hour..”
• “..We have always done it that way….”
• “.. Yes we’ve had accidents, but some are going to happen..”
Real comments that keep us up at night!!
SAFETY CULTURE!!

63Federal AviationAdministration 63Rotorcraft Operations and Statistic
Questions/Comments
Contact:
[email protected] (817-222-5125)

64Federal AviationAdministration 64Rotorcraft Operations and Statistic
Thank you!!!!