ROOTCROP INDUSTRY IN THE PHILIPPINES - map … · rootcrop industry in the philippines julieta r....
56
ROOTCROP INDUSTRY IN THE PHILIPPINES JULIETA R. ROA, Ph.D. PhilRootcrops, Visayas State University Baybay City, Leyte Management Association of the Philippines abcdf Formation Center, Missionaries of the Child Jesus Guadalupe Viejo, Makati November 25, 2014
Transcript of ROOTCROP INDUSTRY IN THE PHILIPPINES - map … · rootcrop industry in the philippines julieta r....

ROOTCROP INDUSTRY IN THE PHILIPPINES
JULIETA R. ROA, Ph.D.PhilRootcrops, Visayas State University
Baybay City, Leyte
Management Association of the Philippines abcdfFormation Center, Missionaries of the Child Jesus
Guadalupe Viejo, MakatiNovember 25, 2014

Outline of Presentation
I. Why Rootcrops for IndustryII. Industry BriefIII. SituationerIV Opportunities and ChallengesV Public-private initiativesVI Ways forward

WHY ROOTCROPS FOR INDUSTRY
► Consistent with inclusive growth goal: making markets work better for the less favoured; food security
► Harness economic potentials of diverse species with functional properties; nutrient-rich food
► Environment adaptability: grow in wide range of environment
► Address social issues: gender, ethnicity, poverty
► Help address climate change and disaster li f

30.2
89
19.7
34.5
21.5
11.5
13.5
56.7
33.1
0 25 50 75 100
Proportion of Households Meeting Recommended Energy and Nutrient Intake (RENI): Philippines, 2008
Proportion of Households MeetingRENI
IntakeNutrient
Energy (kcal)* 1867
Protein (g)** 57.1
Iron (g)** 9.7
Thiamin (mg)** 0.85
Retinol Eq. (μg)** 451.6
Calcium (g)** 0.42
Riboflavin (mg)** 0.73
Niacin (mg)** 21.3
Ascorbic Acid (mg)** 47.1
*100% RENI**80% RENI Source: 2008 National Nutrition Survey, Food and Nutrition Research Institute
Filipinos are deficient in RENI

MINERAL CONTENT OF ROOT CROPS,mg/100 g
0
1
2
3
4
5
6
7
8
9
10
Ube Gabi Tugi Potato Kamote Cassava
Iron Zinc Calcium
Source: Trinidad, TP. 2009. FNRI

PurpleRaw
Purple Boiled
WhiteRaw
WhiteBoiled
YellowRaw
YellowBoiled
RiceBoiled
Edible portion (g)
77 90 89 86 88 86 100
Water (g) 68.1 68.6 73.5 68.8 65.5 68.1 67.6Energy (Kcal) 124 122 104 126 135 128 129Protein (g) 0.6 0.6 0.7 0.4 1.1 0.5 2.1Fat (g) 0.4 0.2 0.5 0.8 0.4 0.3 0.2Carbohydrate (g)
29.8 29.5 24.3 29.3 31.8 30.7 29.7
Crude Fiber(g)
0.9 0.7 2.3 2.7 2.9 3.0 0.6
Ash (g) 1.1 1.1 1.0 0.7 1.2 0.4 0.4Calcium (mg) 21 22 152 83 55 30 11Phosphorus (mg)
40 39 50 37 51 26 36
Nutrient-rich Staple FoodNutrient Content of Sweetpotato vs. Rice

PurpleRaw
Purple Boiled
WhiteRaw
WhiteBoiled
YellowRaw
YellowBoiled
RiceBoiled
Iron 0.4 0.2 1.1 0.7 0.7 0.4 0.6
Retinol (ug) 0 0 0 0 0 0 0Betacarotene (ug)
35 20 25 5 540 280 0
Total Vit. A (RE)
6 3 4 1 90 47 0
Thiamine (mg)
0.06 0.04 0.13 0.07 0.10 0.04 0.02
Riboflavin (mg)
0.02 0.02 0.04 0.02 0.04 0.02 0.02
Niacin (mg) 1.0 1.1 0.7 0.2 0.6 0.3 0.5Ascorbic Acid (mg
41 29 48 23 35 14 0
Source: FNRI-DOST, 1997

Nutrient Unit Value per 100 grams
Energy kcal 34
Total dietary fiber g 1.9
Total Sugars
Starch
Protein g 2.32
Potassium mg 477
Vitamin C mg 1.5
Vitamin A IU 916
Nutritional Characteristics of Sweetpotato Leaves
(cooked, steamed, without salt)

Nutrient Unit Value per 100 grams
Energy kcal 24
Total dietary fiber g 2.0
Total Sugars
Starch
Protein g 2.72
Potassium mg 460
Vitamin C mg 35.5
Vitamin A IU 4238
Nutritional Characteristics of Taro Leaves
(cooked, steamed, without salt)

Nutrient Unit Value per 100 grams
Energy kcal 116
Total dietary fiber g 3.9
Total Sugars g 0.49
Starch
Protein g 1.49
Potassium mg 670
Vitamin C mg 12.1
Vitamin A IU 122
Nutritional Characteristics of Yam Tubers
(cooked, boiled, drained, or baked, without salt)

Nutrient Unit Value per 100 grams
Energy kcal 160
Total dietary fiber g 1.8
Total Sugars g 1.70
Starch
Protein g 1.36
Potassium mg 271
Vitamin C mg 20.6
Vitamin A IU 13
Nutritional Characteristics of Cassava Root (raw)

02468
101214
DIETARY FIBER COMPOSITION OF ROOT CROPSg/100 g Sample
SOLUBLE FIBER INSOLUBLE FIBER
KAMOTE GABI POTATO TUGI UBE CASSAVA
Source: Trinidad, TP. 2009. FNRI
Presenter
Presentation Notes
AMONG THE ROOTCROPS, GABI, UBE AND TUGI HAS THE HIGHEST TOTAL DIETARY FIBER CONTENT. SOLUBLE FIBER IS HIGHEST IN CAMOTE FOLLOWED BY UBE. INSOLUBLE FIBER IS HIGHEST IN GABI, FOLLOWEDE BY UBE.

* Normal vs. Diabetic is significantly different at P<0.05.; Trinidad, TP. 2009.
GLYCEMIC INDEX OF LOCAL ROOT CROPS
IN NORMAL AND DIABETIC SUBJECTS
Presenter
Presentation Notes
THE LOWEST GI FOR NORMAL SUBJECTS IS UBE AND GABI WHILE FOR DIABETIC SUBJECTS GI IS LOWEST IN UBE AND TUGI. FOR BOTH TUGI AND UBE THERE IS A SIGNIFICANT DIFFERENCE OF GLUCOSE RESPONSE FOR BOTH NORMAL AND DIABETIC SUBJECTS

INDUSTRY BRIEFROOTCROP STATUS
Cassava Starch industry (food and industrial starches) established since the late 1970s with 10 factories to currently 5: 1 Bohol, 4 in N.Mindanao.
Main challenge: supply chain: 1 plantation (Mindanao), but mainly smallholder systems
Domestic market unmet; imports ca 50% of demand.Starch new investment plans (Reg 2); potential areas in Reg 3, 8, 4B, 12Feeds industry in mid-1990s: dominated by SMFI; then CPF, Thai co.; other companiesCassava grates/flour & products: potential for MSEs; 3community pilots showed feasibilityFood processing – a growing industry in near-urban centers (e.g. cakes, other native delicacies); improving qualityStart-up exports since 2012 (frozen chunks, grates, & leaves: US, Canada, Japan)

INDUSTRY BRIEFROOTCROP STATUS
YAM Established use of purple yam in the food industry: MSMEs & big industry – in puree, powder, or fresh forms
Start-up export market: demand potential huge
Biggest challenge is SUPPLY – volume and year-round availability
White yam & other yam species high potential forhealth & pharmaceutical uses untapped due to

INDUSTRY BRIEFROOTCROP STATUS
SWEETPOTATO Mainly for food: fresh roots and processing; improvedpresentation for niche markets untapped
Central Luzon: rejects – dried chips for feeds; industrial market
Untapped Potentials:processing as health food (cereal-like nutrient-richindustrial products (paste, juices & fruit-likeproducts, naturally-fermented soy-sauce, etc.)
Starch for niche export market
Micro-processing for bio-ethanol (fuel & human alcohol) – pilot testing stage in Leyte

INDUSTRY BRIEFROOTCROP STATUS
POTATO Mainly fresh markets as vegetable
Importations for the multinationalfood/chicken chains (variety specifications)
Mainly grown in the highlands and mid-elevation areas: Benguet, Davao-Cotabato, Bukidnon
TARO, AROIDS Mainly for food and indigenous processing; chips; alternate to yam
Emerging industry: canned laing, condiment/soup thickener (powder form)
Specialty dish in Chinese restaurants

SITUATIONER:
Trends & Benchmarks

Source: BAS
Lifted from DA-HVCDP Root Crops Industry Roadmap
Trend in Cassava Production, 2003-2012
0.00
2.00
4.00
6.00
8.00
10.00
12.00
0
500,000
1,000,000
1,500,000
2,000,000
2,500,000
2002
2003
2004
2005
2006
2007
2008
2009
2010
2011
2012
t/haMT
Volume (MT) Area (ha)aq Yield (t/ha)

Volume of Cassava Production by Region, 2003-2012
Region 2003 2004 2005 2006 2007 2008 2009 2010 2011 2012
PHILIPPINES 1,622,242
1,640,520
1,677,564
1,756,856
1,871,138
1,941,575
2,043,719
2,101,454
2,209,684
2,223,144
CAR 1,804 1,726 1,730 1,896 1,749 1,865 1,839 1,813 1,671 2,194ILOCOS REGION 13,734 14,097 13,576 16,357 16,809 16,766 17,493 17,933 17,746 17,563CAGAYAN VALLEY
27,176 28,836 31,975 31,156 30,475 30,864 38,545 41,291 70,060 66,882
CENTRAL LUZON 9,601 9,548 9,395 9,235 9,187 9,199 9,294 9,449 10,032 18,428CALABARZON 67,262 67,411 71,505 65,754 63,969 60,141 54,787 50,368 47,980 49,020MIMAROPA 8,538 8,610 8,909 8,911 9,413 10,618 11,531 12,207 12,858 13,541BICOL REGION 159,453 137,068 122,197 109,822 108,706 112,900 115,112 114,625 110,020 111,236WESTERN VISAYAS 50,448 57,483 57,508 57,104 61,559 59,710 60,966 60,116 61,921 62,408CENTRAL VISAYAS 78,450 74,298 67,145 69,566 79,742 83,539 106,079 118,668 128,156 109,571EASTERN VISAYAS 66,133 66,669 70,623 71,159 72,867 72,792 73,194 73,392 78,805 81,918ZAMBOANGA PENINSULA
26,222 26,022 26,861 27,567 29,038 30,598 30,416 30,746 30,352 30,053
Northern Mindanao 104,308 138,215 150,484 228,270 310,517 348,971 417,943 471,511 551,123 558,955DAVAO REGION 14,073 14,686 15,584 17,117 15,707 15,550 14,990 14,788 14,511 14,454SOCCSKSARGEN 10,714 11,114 30,071 29,094 32,725 31,857 31,314 34,556 43,386 47,852CARAGA 44,083 43,925 49,234 48,362 50,801 52,662 47,886 41,124 23,609 20,101
ARMM 940,243 940,811 950,765 965,487 977,8741,003,54
21,012,33
01,008,86
71,007,45
41,018,96
9Source: BAS
Lifted from DA-HVCDP Root Crops Industry Roadmap
Source: BAS

Cassava Starch Imports, Philippines, 1990-2011
Lifted from DA-HVCDP Root Crops Industry Roadmap

Cassava: Trade Balance, Philippines, 2012YEAR IMPORT EXPORT X-M1997 0 328 3281998 0 473 4731999 0 644 6442000 0 418 4182001 0 263 2632002 0 818 8182003 6,200 850 -5,3502004 12,214 620 -11,5942005 0 488 4882006 3,150 591 -2,5592007 0 881 8812008 0 848 8482009 0 982 9822010 24,500 1,011 -23,4892011 12,706 1,098 -11,608
Source: BAS
Lifted from DA-HVCDP Root Crops Industry Roadmap

Source: BAS
Root Crops Industry Roadmap
Trend in Camote Production, 2003-2012
4.00
4.20
4.40
4.60
4.80
5.00
5.20
0
100000
200000
300000
400000
500000
600000
700000
2003
2004
2005
2006
2007
2008
2009
2010
2011
2012
Yiel
d, t
on/h
a
Prod
uctio
n (M
T), A
rea
(ha
)Volume Area Yield

Source: BAS
Root Crops Industry Roadmap
Volume of Camote Production by Region, 2003-2012Region 2003 2004 2005 2006 2007 2008 2009 2010 2011 2012
PHILIPPINES 546,971 545,147 574,629 566,773 573,734 572,655 560,516 541,265 516,338 516,366CAR 18,209 17,952 17,665 17,301 17,279 17,353 17,187 16,520 15,976 15,711
ILOCOS REGION 14,518 15,374 16,237 16,261 16,365 153,20 15,169 15,516 15,256 14,977
CAGAYAN VALLEY 21,818 20,982 19,291 17,037 16,575 15,886 13,574 11,068 11,063 10,359
CENTRAL LUZON 30,494 30,684 31,426 30,997 31,558 31,555 31,685 31,544 30,004 31,196
CALABARZON 38,705 38,402 42,588 40,133 40,169 37,190 33,684 32,312 31,390 32,472
MIMAROPA 11,929 12,011 12,130 12,219 12,121 12,553 12,662 12,851 13319 13,882
BICOL REGION 102,661 87,454 87,372 87,184 91,761 95,767 95,861 94,701 92,121 91,943
WESTERN VISAYAS 28,063 35,952 46,712 47,162 46,298 44,600 46,447 44,455 45,345 45,642
CENTRAL VISAYAS 54,014 56354 49,459 53,529 47,908 47,557 47,022 40,847 38,718 32,555
EASTERN VISAYAS 109,111 109,691 116,814 116,858 119,601 118,067 118,185 118,040 118,983 123,350
ZAMBOANGA PENINSULA 10,151 10354 10,701 10,837 10,782 10,205 9,854 8,774 8,952 8,547
NORTHERN MINDANAO 22,904 23,125 23,775 26,998 27,491 28,551 29,437 29,725 31530 32,474DAVAO REGION 19,808 20,030 19,947 19,397 19,435 19,620 19,814 19,901 19,014 18,417
SOCCSKSARGEN 8,377 8,716 9,301 9,124 9,599 9,735 10,155 10,457 10,783 10,782
CARAGA 51,854 51,909 65,112 55,573 60,719 62,383 53,656 48,475 27,908 27,939
ARMM4,354 6,158 6,100 6,164 6,074 6,313 6,126 6,081 5,977 6,121

Source: BAS
Root Crops Industry Roadmap
Trend in Ubi Production, 2003-2012
0.00
1.00
2.00
3.00
4.00
5.00
6.00
7.00
0
5,000
10,000
15,000
20,000
25,000
30,000
35,000
2003
2004
2005
2006
2007
2008
2009
2010
2011
2012
Yiel
d (t
on/h
a)
Prod
uctio
n (M
T), A
rea
(ha)
Volume Area Yield

Source: BAS
Root Crops Industry Roadmap
Volume of Ubi Production by Region, 2003-2012Region 2003 2004 2005 2006 2007 2008 2009 2010 2011 2012
PHILIPPINES 27,884 28,526 29,256 30,074 29,265 24,185 22,567 21,892 17,844 15,799
CAR 128 126 135 148 152 156 161 146 159 158ILOCOS REGION 75 78 108 121 153 180 180 201 205 228CAGAYAN VALLEY 2,248 2,178 2,244 2,419 2,357 2,282 2,131 1,757 1,694 1,696CENTRAL LUZON 294 378 443 468 497 558 540 553 561 561CALABARZON 366 371 410 444 463 466 518 626 648 653MIMAROPA 195 207 230 246 246 356 417 424 458 496BICOL REGION 735 693 706 664 657 683 662 657 625 600WESTERN VISAYAS 386 420 472 560 566 636 658 651 670 677CENTRAL VISAYAS 19,760 20,785 21,352 21,849 21,092 15,700 14,092 13,722 9,753 7,528
EASTERN VISAYAS 748 757 773 783 798 840 845 841 845 947ZAMBOANGA PENINSULA 216 244 264 273 260 252 258 250 253 258NORTHERN MINDANAO 1,529 1061 900 913 824 798 828 867 872 932DAVAO REGION 433 418 411 380 391 408 409 427 402 384SOCCSKSARGEN 220 264 272 282 293 321 332 316 318 313CARAGA 265 265 287 280 275 259 217 145 71 58ARMM 285 279 251 243 243 292 319 308 310 310

Food94.59%
Feeds & Waste5.00%
Processing0.00%
Exports0.00%
Seeds0.41%
Sweetpotato Utilization (2009)
Food Feeds & Waste Processing Exports Seeds
ca. 95% used for food; 5% for feeds,& other uses
Food94.07%
Feeds & Waste4.00% Processing
0.00%
Exports1.39%
Seeds0.55%
Yam Utilization (2009)
Food
Feeds & Waste
Processing
Exports
Seeds
Utilization is mainly food (94%); 0.6% of produce is used as seed setts; 1.4% was exported, while 4% were used as feeds or wasted.
UTILIZATION

Source: FAOSTAT
Top Cassava Yielding Countries, 2012
Rank Country Yield (MT/ha)1 India 36.482 Cook Islands 26.323 China, Taiwan Province of 24.174 Lao People s Democratic Republic 24.145 Suriname 23.336 Malawi 22.397 Bahamas 22.308 Cambodia 21.699 Indonesia 21.36
10 Jamaica 18.89

Source: FAOSTAT
Top Camote Producing Countries, 2011Rank Country Production (Int $1000) Production (MT)
1 China, mainland 2,821,877 75,362,0002 Nigeria 249,242 3,300,0003 United Republic of
Tanzania224,567 3,573,302
4 Uganda 192,898 2,554,0005 Indonesia 147,123 2,192,2426 Viet Nam 92,595 1,362,1947 United States of
America84,931 1,223,068
8 India 79,047 1,046,6009 Angola 78,934 1045,104
10 Burundi 72,137 955,10311 Japan 65,742 885,90012 Mozambique 64,954 860,00013 Rwanda 63,828 845,09814 Kenya 57,361 759,47115 Madagascar 49,626 1,102,95016 Papua New Guinea 42,815 566,88517 Philippines 37,048 516,33818 Ethiopia 29,466 390,13519 Argentina 29,430 389,66220 Democratic People's
Republic of Korea29,177 439,000

Source: FAOSTAT
Camote: Top Yielding Countries, 2012
Rank Country Yield (MT/ha)1 Egypt 33.91
2 Réunion 32.67
3 Israel 29.71
4 Ethiopia 28.46
5 Morocco 27.08
6 Cook Islands 26.00
7 Senegal 25.00
8 Australia 24.71
9 United States of America 23.45
10 Mali 23.33

Source: FAOSTAT
Top Ubi Producing Countries, 2011Rank Production (Int $1000) Production (MT)
1 Nigeria 7,572,870 37,115,5102 Ghana 1,605,617 6,295,4533 Côte d'Ivoire 1,072,260 5,531,8654 Benin 403,681 2,366,0005 Togo 167,442 727,7496 Cameroon 105,500 517,0697 Central African Republic 103,843 452,3978 Papua New Guinea 100,930 395,7399 Chad 96,916 400,00010 Colombia 91,038 396,61311 Haiti 82,304 322,70912 Ethiopia 77,983 339,74013 Cuba 62,662 349,69214 Japan 38,280 165,90015 Gabon 37,273 204,50716 Brazil 37,236 244,14217 Jamaica 34,334 134,62018 Burkina Faso 25,435 99,73019 Venezuela (Bolivarian Republic of) 24,818 102,14020 Mali 23,464 92,000

Sample Value ChainFarm Income Analysis
SP & Yam
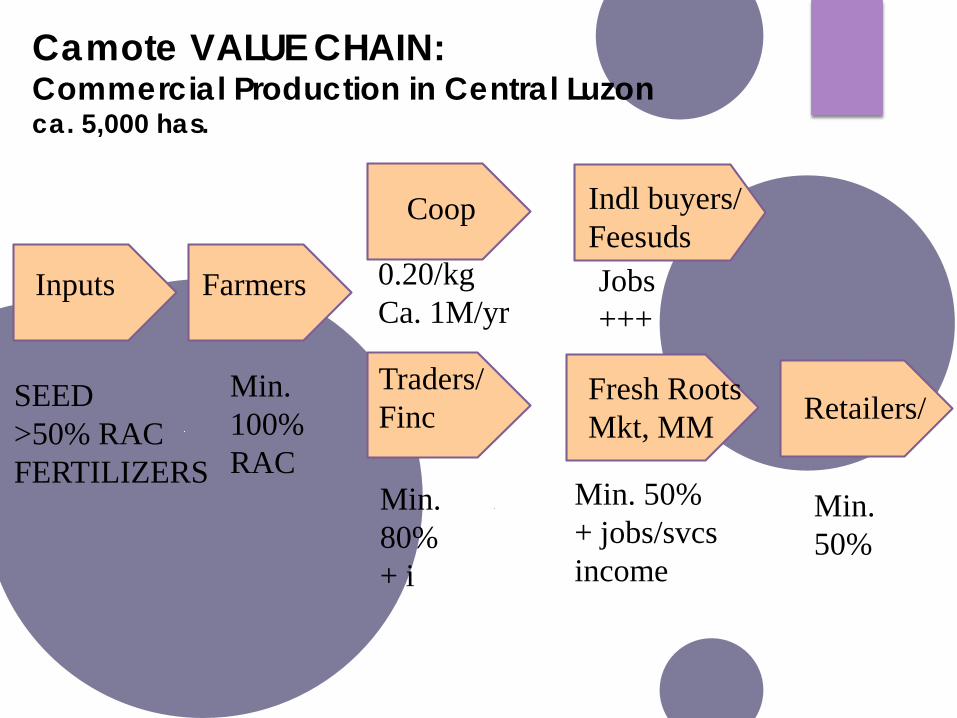
Camote VALUE CHAIN: Commercial Production in Central Luzonca. 5,000 has.
SEED>50% RACFERTILIZERS
Inputs Farmers
Min. 100%RAC
Traders/Finc
Coop Indl buyers/Feesuds
Fresh RootsMkt, MM
0.20/kgCa. 1M/yr
Min.80%+ i
Jobs+++
Min. 50%+ jobs/svcsincome
Retailers/
Min.50%

Camote Chain Map 2: Small & Semi-commercial areas linked to Local markets (small cities, towns)
Farmers’ Own SeedSystem
SI
NurseriesLGU, CB
Small & semi-commercial growers
ca. 40%%
7Local freshRoots mkt
Food processing
SeedHome useca. 20%%
ca. 40%%

Ubi Chain Map : Semi-commercial areas linked to Local markets (small cities, towns)
Farmers’ Own SeedSystem
SI
NurseriesLGU, CB
Small & semi-commercial growers
ca. 50%%
7
Food processing
Home useca. 40%%
ca. 10%%
Local fresh Roots market

2005 2006 2007 2008 2009 2010 2011 2012CASH COSTS 8597 9041 9451 11674 10906 11153 12149 12783..Seeds/Planting Materials 936 1049 1106 1222 1234 1322 1501 1564..Fertilizer 1727 1716 1820 3294 2398 2084 2391 2597..Pesticides 114 109 105 106 100 111 100 100..Hired Labor 3345 3486 3623 3951 4017 4278 4496 4700..Land Tax 142 143 144 145 146 147 148 149..Rentals 1005 1114 1172 1280 1294 1385 1557 1624..Fuel and Oil 328 357 369 432 399 452 510 543..Transport of Inputs 167 184 202 222 244 268 295 325..Interest Payment on Crop Loan 65 73 73 81 77 81 88 90..Food Expenses 599 632 653 742 786 810 843 862..Repairs 169 178 184 199 211 215 220 229NON-CASH COSTS 1730 1935 2045 2257 2278 2444 2773 2902
..Seeds/Planting Materials Paid in Kind 800 897 945 1044 1054 1129 1282 1336
..Hired Labor Paid in Kind 54 56 58 59 60 64 67 70
..Landlord's Share 614 688 725 801 809 867 985 1026
..Harvester's Share 262 294 317 353 355 384 439 470
..Lease Rental 0 0 0 0 0 0 0 0IMPUTED COSTS 7745 8141 8462 8891 9510 10066 10657 11132..Operator and Family Labor 5445 5674 5898 5971 6539 6963 7318 7650..Exchange Labor 211 220 228 231 253 270 284 296..Depreciation 811 892 981 1079 1187 1306 1437 1581..Interest on Operating Capital 621 618 578 751 664 598 563 506..Rental Value of Owned Land 657 737 777 859 867 929 1055 1099ALL COSTS 18072 19117 19958 22822 22694 23663 25579 26817GROSS RETURNS 33817 37969 40935 45581 45864 49608 56711 60668RETURNS ABOVE CASH COSTS 25220 28928 31484 33907 34958 38455 44562 47885RETURNS ABOVE CASH & NON-CASH COSTS 23490 26993 29439 31650 32680 36011 41789 44983NET RETURNS 15745 18852 20977 22759 23170 25945 31132 33851NET PROFIT-COST RATIO 0.87 0.99 1.05 1 1.02 1.1 1.22 1.26
Cost and Returns of Sweet Potato (2005-2012)
Source: Bureau of Agricultural Statistics

2005 2006 2007 2008 2009 2010 2011 2012
Cost Per Kilogram in Pesos 3.79 4.01 4.09 4.64 4.63 4.78 5.14 5.25
Average Yield Per Hectare in Kilograms 4763 4770 4879 4917 4900 4946 4979 5111
Farmgate Price in Pesos Per Kilogram 7.1 7.96 8.39 9.27 9.36 10.03 11.39 11.87
Whole Prices in Pesos Per Kilogram 9.51 11.11 11.54 12.31 13.69 14.39 14.72 15.77
Retail Prices in Pesos Per Kilogram 14.54 16.87 18.00 19.77 21.68 22.70 24.20 26.28
Average Cost Per Kilogram (pesos), Average Yield (kg/ha), Whole sale, Farm gate and Retail Prices (pesos) Per Kilogram (2005-2012): for smallholder systems
Particulars
Source: Bureau of Agricultural Statistics
NON-INTENSIVE PRACTICE

SWEETPOTATO STORAGE ROOT PRODUCTION USING CPMCONCEPCION, TARLACPARTICULARS COST (P) TOTAL (P)A. YIELD quantity (bags) price/bag (P)Storage roots good 95 1,200 114,000.00 medium 20 600 12,000.00 small 7 200 1,400.00 Total: 122 667 127,400.00
B. PRODUCTION COSTLaborLand preparation disc harrowing (passing) 2 1500 3,000.00 planting & fertilizer applcn. (mda 16 200 3,200.00 Hilling-up (man-animal day) 2 300 600.00 Harvesting - storage roots 2000 2,000.00 Hauling cost 2000 2,000.00 Material Inputs - Stem cuttings (bundles) 60 120 7,200.00 Fertilizers - triple 14 6 1,700 10,200.00 C. OVERHEAD COST - Land rent 10,000 10,000.00 Interest on capital 2000 2,000.00 Total Cost: 40,200.00 D. NET INCOME 87,200.00 E. RETURN ABOVE OPERATING EXPENSES(%) 309.2F. RETURN ABOVE TOTAL EXPENSES (%) 216.90 G. AVE. PRODUCTION COST 329.51H. BREAK EVEN YIELD (BAG) 122.00
BEST PRACTICE:Cost & ReturnCommercial SPProduction usingClean PlantingMaterials, POT:Concepcion, Tarlac; Yield: 40 t/h
Price/kg=20 (G); 10 (medium); 3.33 (small)
Source: Tarlac SP Project, 2012

COST
A. Labor
Operation Unit Qty Unit Cost (P) Cost/Ha. (P)
Land Preparation, using carabao MAD 14 300 4,200.00
Preparing and hauling setts MD 14 150 2,100.00
Planting and replanting MD 9 150 1,350.00 Mulching MD 72 150 10,800.00 Weeding
mulched, 2x MD 60 150.00 9,000.00 unmulched, 4x MD 240 150.00 36,000.00
Gathering stakes, staking & training vines MD 157 150 23,550.00
Spraying, 6x MD 6 150 900.00 Fertilizing MD 12 150. 1,800.00 Covering exposed tubers MD 2 150 300.00 Harvesting and hauling tubers MD 62 150 9,300.00
Treating damaged tubers MD 11 150 1,650.00 Removing stakes in the field, sorting & stacking MD 35 150 5,250.00
Sub-Total Cost, mulched 70,200.00 Sub-Total Cost, unmulched 86,400.00
B. Supplies & Materials
Items Unit Qty Unit Price(PhP) Supply Cost(PhP) Seed tubers* kgs. 2,900 20.00 58,000.00 Bamboo stakes** pcs. 20,000 2.00 40,000.00 Bamboo posts** pcs. 400 35.00 14,000.00 Rattan baskets pcs. 20 150.00 3,000.00 Tie wire, #16 rolls 2 3,000.00 6,000.00 Plastic twine rolls 30 50.00 1,500.00 Fertilizer, complete (14-14-14) bags 9 2,000.00 18,000.00
Fungicide kgs. 5 1,300.00 6,500.00 Insecticide L 2 1,300.00 2,600.00 Mulching materials free 0.00
Sub-Total Cost 149,600.00 Total Cost of Production, mulched/
unmulched 219,800/
236,000
UBI Cost &Returns:
RecommendedPractice usingconventionalsetts forPlanting materials

GROSS INCOME
Yield*** Yield in kgs Price(PhP)/kg Total Price(PhP) 12 tons 12,000 35.00 420,000.00
***depends upon the kind of variety planted and other factors Approximate Net Income(12 tonned-yield), mulched, PhP : 200,200.00
Approximate Net Income(12 tonned-yield), unmulched PhP : 184,000.00 ROI, mulched, %
unmulched : 91.08 77.97
Traditional Ubi Production: [hypothetical hectare) Cost
Labor (hired/Imputed) 39,450 Supplies & Materials 76,600 TOTAL 116,050 Gross Income: 6,000 kgs x Php 35 210,000 6,000 kgs x Php 20 120,000 Net Income @ Php 35/kg 93,950 @ Php 20/kg 3,950

OPPORTUNITIES&
CHALLENGES

OPPORTUNITIES
DEMAND SIDE SUPPLY SIDEHigh value adding potential as nutrient-rich functional foods (i.e. health & wellness)
Available processing & production technologies
High export potential for semi-processed and final products
Available NSIC- registered high yielding varieties of different traits for various uses. With GAP, high potential for improved, and more efficient supply chains
Increasing health-consciousness among consumers (i.e. demand for better source of energy and natural products, substitute for import); big untapped local consumption base for both fresh and processed products
Available expansion areas; production & postproduction technologies
CLIMATE CHANGE AVENUE FOR GROWTH IMPROVED POLICY ENVIRONMENT
High potential for resilient livelihoods & food security
Increasing government support, & public-private partnerships

PRODUCTS INDUSTRY SCALENaturally fermented SP-based soy sauce & by-products (feeds, sauces); other condiments [pilot / market-tested]
S, M, B
SP/yam flakes (intermediate &/or with final products (for babies, children, & geriatric foods) [industry inquiry, existing in China]
S, M, B
SP-based bio-ethanol with human alcohol [on-going pilot] Micro, S, M
SP Paste (with tomato, banana), ketchup & sauces (for the canning industry, food chains, etc.) [pilot-tested; industry forum done]
S, M, B
SP/yam flour/powder & products; coffee blend; noodles from fresh roots [product prototypes; lab pilot]
Micro, S, M
Juice (from roots/leaves) and fruity products; jams, etc. [pilot tested] Micro, S, MFrozen and minimally processed products (for local and export) S, M, BSP starch (for export) [area search by foreign investor] M, BVarious village level processed products (candies, pastries, improved native delicacies for local & export) [start-up enterprises; further dev]
Micro, S
Dried chips for feeds (using rejects: under/over sized roots) [existing] Micro, SVarious Dehydrated and fried products [pilot-tested] Micro, S, M,Premium fresh roots in boxes, paper or native bags, etc. [pilot-tested] Micro, S, M
Industry Opportunities [status]


FOR USE IN VIANDS
FROZEN CUTS

SP NOODLES:
SP puree with wheat flour using orange SP, PSBSP 30. Produced by Tabaconoodle factory linked to FFS-SP ICM cooperators.
Photo: Albay SP Project Team

Handicrafts from dried SP vines

GratesGrater Spinner
Dryer PulverizerFlour

DRIED CASSAVA GRATES & PRODUCTS

CASSAVA FLOUR-based Herbal Cookies


CHALLENGESDEMAND SIDE SUPPLY SIDE
Low consumption & utilization; consumers lack knowledge of food nutrient value
Climate change-induced pest & diseases, & abiotic stresses
inadequate consumer & market information as basis for industry development
Effectivity of AEC threat to competitiveness of local rootcrop products with inefficient systems
Aggressive expansion and improvements in competing countries
High cost of farm inputs and logistics; Inefficient supply chain
INSTITUTIONAL: Weak RDE infrastructure: physical, human, institutional;
Predominance of resource-poor, inefficientmicro-producers in fragmented lands
extremely low GOP investments; failure to quickly address
Insufficient production support facilities such as seed gardens, farm machineries and irrigation

WAYS FORWARD:
Government support to RTC ROAD MAPPING for improved RDE infrastructure and increased budget
Cassava Roadmap – DA Corn program – 300M+SP & Yam Roadmap – DA-HVCDP; pipelineDA-BARDOST (PCAARRD, PCIEERD, PCHRD)
Improve linkage with industry
Expand and strengthen networking/partnerships with GOs, NGOs, POs, LGUs, int’l agencies
Continuing capacity development partners,Beneficiaries, stakeholders
IMPROVED PUBLIC-PRIVATE PARTNERSHIPS & NETWORKING
● Strengthening of the Philippine Council for Agriculture and Fisheries (PCAF) – Rootcrop Industry Subcommittee (RIDSC)
● Revitalizing the Philippine Tapioca Producers and Processors (PhilTAPP), Inc.
● Partnership modality in community engagements and industry or enterprise development initiatives (e.g. industry-PO-NGO-LGU-RDI-GO): MSMEs; supply chain development with big industry
● Research partnerships with industry