Role of Process Integration in Process Systems Engineering · PDF fileRole of Process...
35
Role of Process Integration in Process Systems Engineering Ignacio E. Grossmann Center for Advanced Process Decision-making (CAPD) Department of Chemical Engineering Carnegie Mellon University Pittsburgh, PA 15213, U.S.A. International Process Integration Jubilee Conference Gothenburg, Sweden March 18, 2013
-
Upload
truongkiet -
Category
Documents
-
view
218 -
download
2
Transcript of Role of Process Integration in Process Systems Engineering · PDF fileRole of Process...

Role of Process Integration in Process Systems Engineering
Ignacio E. Grossmann
Center for Advanced Process Decision-making (CAPD) Department of Chemical Engineering
Carnegie Mellon University Pittsburgh, PA 15213, U.S.A.
International Process Integration Jubilee Conference
Gothenburg, Sweden March 18, 2013
What is the impact of Chemical Engineering on Process Systems Engineering?
What is the impact of Process Systems Engineering on Process Integration?

Bioengineering area : - Perceived as “hot” area: most new faculty in bio area - Many new Biomedical Engineering Depts Job market biomedical engineers?
Many U.S. departments (~50%) were renamed as: Chemical and Biomolecular Engineering (e.g. Cornell, U. Penn., Illinois, Georgia Tech) Chemical and Biological Engineering (e.g. Colorado, Northwestern, Notre Dame, Wisconsin) Nanotechnology is other “hot” area
Trends in Chemical Engineering (Last decade)

Increasing emphasis on Science in Chemical Eng.
Departments - Many professors are not chemical engineers and do not regard AIChE/IChemE as
their primary organization - Has increased multidisciplinary approach - Decreased emphasis on chemical engineering fundamentals - Process Design(Process Integration) courses
largely outsourced to retired industry people - Process Control no longer required at many U.S. universities
Trends in Chemical Engineering (Last decade)

Other examples trends in Chemical Engineering
- Netherlands has now only two chemical engineering departments: Delft, Eindhoven; no Chaired Process Systems Eng. Professors
- Houston, the capital city of Oil & Gas and Chemical Industry in US has only ONE Process Systems Engineering Professor U. Houston: Michael Nikolaou; Rice University: NONE
- Many faculty members in US do not publish anymore in chemical engineering journals

Move from Engineering to Science
Trends in Publications
Impact factors ~2.2
Impact factors ~30

AIChE J: Top Accepted Articles by Country of Origin
October 30, 2012 7
Country Total % of Submissions
United States 73 13.32% China 157 28.65% Canada 32 5.84% France 16 2.92% Spain 16 2.92% Germany 10 1.82% India 51 9.31% Netherlands 9 1.64% Japan 17 3.10% United Kingdom 17 3.10%
Australia 12 2.19% Taiwan 10 1.82% Sweden 5 0.91% Belgium 3 0.55% Korea, Republic of 6 1.09%
South Africa 3 0.55%
Articles Accepted Dec. 15, 2011 through Oct. 23, 2012
US/Canada: 20% Europe: 16% China: 30% India: 10% Japan, Taiwan, Korea: 7%

Dow concerned about big-push to Bio
Dow requires critical scientific & engineering skills75-100 PhD/year • Chemistry, Materials Science, Chemical Engineering, Mechanical Engineering • Dow Solar, Energy Storage Materials, Lightweight Materials, Electronic Materials
US Chemical Engineering & Chemistry Departments are chasing biotechnologies • 31% of the Chemical Engineering Departments in the US added “bio” to their names in 20yrs • “Bio-Tsuname”: Funding New Faculty Research Teaching Students Workforce
Number of Published Articles
0K1K2K3K
Biodiesel + Cellulosic Ethanol + Bioengineering
Reactor Design + Transp. Phenomena + Fluid Dynamics
Percentage of Faculty with “bio” Related Research Interests:
CaltechUC Santa BarbaraNorthwesternGeorgia TechBerkeleyUT AustinU Illinois58%
Top
Stra
tegi
c Uni
vers
ities

Dow Has to Influence the Scientific Funding Environment
AS THE BIGGEST US EMPLOYER IN THE CHEMICAL INDUSTRY DOW HAS TO:
• Partner with strategic universities to: • Work on problems relevant to Dow (e.g. PSE/Process Integration) • Develop talent with the skills needed • Influence the “Influencers”
FUNDI NG THE FUNDAM ENTALS
Dow Chem ica l com m it s $250 m i l l ion t o US un iv er si t ies t o r e in f or ce basic R& D
Commit to Long Term Funding $25 million/year for next 10 yr in US $10 million/year for next 10 yr outside US
“Dow will invest in fundamental research at US Universities”
9

Sheppard, Socolow (2007)
New emphasis: energy and sustainability
Growing World Energy Demand Most Energy Growth in Developing Nations
Energy and sustainability likely to swing pendulum against bio and nano areas in Chemical Engineering

Motivation 1. Balance between “commodity” industry vs. “new emerging” technologies
2. Use of fossil fuels vs. renewable energy technologies and environmental impact
Trends in Process Systems Engineering
Value preservation vs. Value creation
Research Challenges in Process Systems Engineering?
3. Global supply chains and their optimization

Expanding the Scope of Process Systems Engineering
(Grossmann & Westerberg, 2000; Marquardt et al, 1998)

What is science base for PSE?
Numerical analysis => Simulation
Mathematical Programming => Optimization
Systems and Control Theory => Process Control
Computer Science => Advanced Info./Computing
Management Science => Operations/Business
=> Performance process-product
=> Synthesis/design
=> Manufacture
=> Efficient problem solving
=> Supply chain
Process Knowledge => Conceptual design=> Process Integration

Research Challenges in PSE
I. Product and Process Design
III. Enterprise-wide Optimization
II. Energy and Sustainability

XA XB XC XD XE XF XG XH
XD XE XF XG XH
Macro-Processing: Batch or Continuous Chemical Plants
Micro-Processing: Plant-on-a-Chip
DNA RNA Protein
Metabolites
Molecular-Processing: The Cell
I. Product and Process Design: from “Bulk” to “Molecular” Processing
George Stephanopoulos (2004)

De Novo Protein Design (Chris Floudas, Princeton)
Define target template
Human b-Defensin-2 hbd-2 (PDB: 1fqq)
Full sequence design
Design folded protein
Approach In silico sequence selection => MILP Fold specificity => Global optimization
Backbone coordinates for N,Ca,C,O and possibly Ca-Cb vectors from PDB
Which amino acid sequences will stabilize this target structure ?
Combinatorial complexity -Backbone length : n -Amino acids per position : m
mn possible sequences
=> New improved inhibitors (Klapeis, Floudas, Lambris, Morikis, 2004)

Metabolic Networks: Inverse Problem
Find reaction pathway (linear combination of extreme points for fluxes) that minimizes squared deviation from NMR spectra for given selection of measured metabolites
(Ghosh, Domach, Grossmann, 2004)
MILP for all extreme points Global optimization inverse problem

Multi-Scale Model
Quantum Mechanics
Kinetics
Heat Transfer FEA
Mechanics FEA
Part Design CAD /CAM
Integrated Design of Formulated Rubber Parts Venkat Venkatasubramanian

Gani et al. (2012)

20
Carnegie Mellon
0100200300400500600700800900
1000
Biomas
s
Photov
oltaic
s
Nuclea
rWind
Hydrop
ower
Gas Coal
CO
2 eq
. (g/
kWh)
Renewables: Carbon footprint various Energy Options
Adisa Azapagic (2012)
II. Energy and Sustainability Environmental impact

21
Carnegie Mellon
Discovery of New Large Oil and Gas Reserves New technologies for Offshore oil exploration and production
54,40%
17,30%
10,10%
9,50%
5,40% 3,30%
Middle East
S. & Cent. America
Europe & Eurasia
Africa
North America
Asia Pacific
63,10% 8,90%
9,70%
8,50%
6,20% 3,60%
Year 2000 Year 2010 Total: 1105 thousand million barrels Total: 1383 thousand million barrels
Depletion of fossil fuels?
Oil Reserves
*Statistical Review of World Energy (June, 2011)
25% increase!

22
Carnegie Mellon
Depletion of fossil fuels?
In 2035 close to 50% from Shale Gas Northeast: from 0.3 trillion scft 2009 to 5.8 trillion scft 2035
Growth in Shale Gas Horizontal drilling Hydraulic fracking
23
Carnegie Mellon
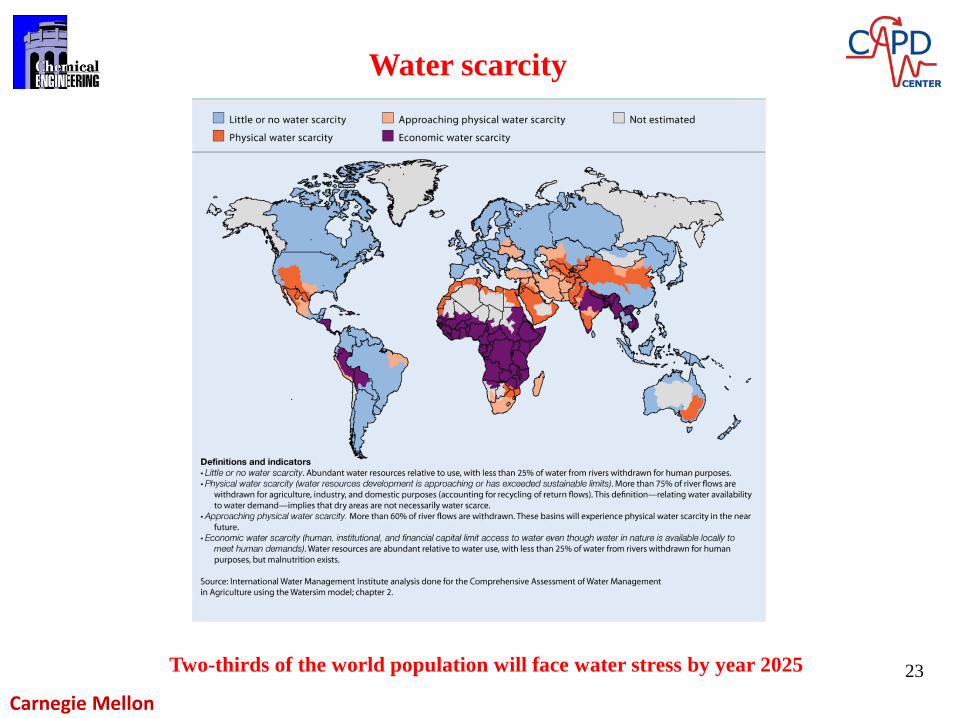
Water scarcity
Two-thirds of the world population will face water stress by year 2025

24
Carnegie Mellon
Biorefinery Bioethanol, FT-diesel and hydrogen from switchgrass Biodiesel from cooking oil or algae oil Martin, Grossmann (2012)

25
Carnegie Mellon
Conceptual Design Strategy for Energy and Water Optimization
Energy optimization Issue: fermentation reactions at modest temperatures
Multieffect distillation followed by heat integration process streams
=> No source of heat at high temperature as in petrochemicals
Water optimization Issue: cost contribution is currently still very small (freshwater contribution < 0. 1%) => Total cost optimization is unlikely to promote water conservation
Optimal process water networks for minimum energy consumption

26
Carnegie Mellon
Scope of Advanced Process Systems Engineering Tools
Energy consumption corn-based process Author (year) Energy consumption
(Btu/gal)
Pimentel (2001) 75,118
Keeney and DeLuca (1992) 48,470
Wang et al. (1999) 40,850
Shapouri et al. (2002) 51,779
Wang et al (2007) 38,323
Water consumption corn-based process
Author (year) Water consumption( gal/gal ethanol)
Gallager (2005) First plants
11
Philips (1998) 5.8MATP (2008) Old plants in 2006
4.6
MATP (2008) New plants
3.4
Author (year) Water consumption( gal/gal ethanol)
Gallager (2005) First plants
11
Philips (1998) 5.8MATP (2008) Old plants in 2006
4.6
MATP (2008) New plants
3.4
From Karrupiah et al (2007) 24,918 Btu/gal vs 38,323 Btu/gal Why? Multieffect distillation and heat integration
From Martin and Grossmann (2010) 1.5 gal water/gal ethanol vs 3.4 Why? Integrated process network with reuse and recycle

Reservoirs wells
facilities
Offshore field having several reservoirs (oil, gas, water) Gupta, Grossmann (2011)
Optimal Development of Oil Fields (deepwater)
FPSO (Floating Production Storage Offloading)
Decisions: Number and capacity of FPSO facilities Installation schedule for facilities Number of sub-seawells to drill Oil/gas production profile over time
Objective: Maximize the Net Present Value (NPV) of the project
MINLP model - Nonlinear reservoir behavior - Three components (oil, water, gas) - Lead times for FPSO construction - FPSO Capacity expansion - Well Drilling Schedule

20 Year Time Horizon 10 Fields 3 FPSOs 23 Wells 3 Yr lead time FPSO 1 Yr lead time expansion
FPSO-2 FPSO-3
Field-2
Field-1
Field-3
Field-5
FPSO-1
Field-4
Total Oil/Gas Production
Field-10
Field-6
Field-8
Field-9
Field-7
Yr4
Yr4
Yr4 Yr5
Yr5
Yr5 Yr6
Yr7 Yr7
Yr7
Optimal NPV = $30.946 billion Example
Yr 1 Yr 2
Yr 1
050
100150200250300350400450
t1 t2 t3 t4 t5 t6 t7 t8 t9 t10
t11
t12
t13
t14
t15
t16
t17
t18
t19
t20
x (k
stb/
d)
Time
Oil Flowrate
fpso1
fpso2
fpso3
1 2 3 4 5 6 7 8 9 10 11 12 13 14 15 16 17 18 19 20

III. Enterprise-wide Optimization Beyond the plant level/ Integration with business operations
Lifecycle Management
Development
0.5 - 2 yrs 1 - 2 yrs 1.5 - 3.5 yrs 2.5 - 4 yrs 0.5-2 yrs
Discovery Market
2-5 yrs
Submission& Approval
10-20 yrs
Phase 3 Phase 2a/b Phase 1 Pre-
clinical Development
Targets
Hits Leads
Candidate
Colin Gardner (Transform Pharmaceuticals)
Dennis Houston (ExxonMobil)
Wellhead Pump Trade & Schedule
Crude and Other
Feedstocks
Transfer of Crude and Feedstocks to Refinery
Refinery Optimization
Trade & Schedule Products
Transfer of Products
from Refinery
to Terminal
Terminal Loading

Enterprise Optimization
30
Production Site: • Reactors:
– Products it can produce – Batch sizes for each product – Batch process time for each product (hr) – Operating costs ($/hr) for each material – Sequence dependent change-over times
=> Lost capacity (hrs per transition for each material pair) – Time the reactor is available during a given
month (hrs)
Customers: Monthly forecasted demands for desired products Price paid for each product
Materials: Raw materials, Intermediates, Finished products Unit ratios (lbs of needed material per lb of material produced)
F1
F2
F3
F4
Reaction 1 A
Reaction 2 B
Reaction 3 C
INTERMEDIATE STORAGE
STORAGE
STORAGE
STORAGE
week 1 week 2 week t
due date due date due date
week 1 week 2 week t
due date due date due date
Erdirik, Grossmann (2007)
Production Planning for Parallel Batch Reactors

31
Network Structure at Location Map Design of Responsive Chemical Supply Chains under Uncertainty
You, Grossmann (2009)

32 China, September 2007
Technology 1
Technology I
Technology 1
Technology I
DMKlpt
PUjpt
QPL jkpt
QWH klpt
Suppliers
Plants j=1,…,J
Warehouses k=1,…,K
Marketsl=1,…,L
Wijpt
INVkpt
CPLijt
CWHkt
Optimal Planning of Sustainable Chemical Supply Chains
Bicriterion optimization Max Net Present Value Min Environmental Impact Eco-Indicator 99 for LCA (Health, Ecosystem, Resources) Uncertainty in emissions
Life Cycle Analysis
Pareto-Optimal Solutions
Parametric programming
Guillen, Grossmann (2007)

Energy Supply Chain Model
Biomass availabilities from database
Coal availabilities from database
Natural gas availabilities from database
Energy Supply Chain Optimization Model
Transportation fuel demand
Transportation infrastructure
CBGTL plant parameters
Grid points of candidate facility locations
Water supply Carbon dioxide sequestration
capacities
Hybrid Coal, Biomass, and Natural Gas to Liquids Systems
33
Floudas et al., 2011)

130 facilities selected (9 small, 74 medium, 47 large)
Overall cost: $18.93/GJ LHV ($95.11/bbl crude oil)
50% reduction in emissions
Network Layout MILP: 105,000 binary variables, 3,311,000 continuous 62,000 constraints.
34

Concluding Remarks
Major challenges in Process Systems Engineering
Product and Process Design Energy and Sustainability
Enterprise-wide Optimization +
Fundamentals of Process Systems Engineering Modeling
Optimization Process Synthesis/Process Integration
Process Operations Process Control
Challenge of Process Systems/Process Integration community: Communicate importance of area to rest of Chemical Engineering Driven by Industrial Needs!!
35