REVIEW Multi-scale heat and mass transfer modelling...
23
Phil. Trans. R. Soc. A (2010) 368, 561–583 doi:10.1098/rsta.2009.0248 R EVIEW Multi-scale heat and mass transfer modelling of cell and tissue cryopreservation B Y F ENG X U 1 ,S ANGJUN M OON 1 ,X IAOHUI Z HANG 1 ,L EI S HAO 1 , Y OUNG S EOK S ONG 2,∗ AND U TKAN D EMIRCI 1,3, * 1 Bio-Acoustic-MEMS in Medicine (BAMM) Laboratory, Center for Bioengineering, Department of Medicine, Brigham and Women’s Hospital, Harvard Medical School, Boston, MA, USA 2 Polymer System Division, Fiber System Engineering, Dankook University, Yongin-si, Gyeonggi-do, Korea 3 Harvard-Massachusetts Institute of Technology Health Sciences and Technology, Cambridge, MA, USA Cells and tissues undergo complex physical processes during cryopreservation. Understanding the underlying physical phenomena is critical to improve current cryopreservation methods and to develop new techniques. Here, we describe multi- scale approaches for modelling cell and tissue cryopreservation including heat transfer at macroscale level, crystallization, cell volume change and mass transport across cell membranes at microscale level. These multi-scale approaches allow us to study cell and tissue cryopreservation. Keywords: multi-scale modelling; heat and mass transfer; cryopreservation 1. Introduction Cryopreservation aims to preserve cells/tissues without significantly impacting their function (e.g. viability, mechanical properties; Whittingham et al. 1972; Ludwig et al. 1999; Agca 2000; Stachecki & Cohen 2004). Biological activity is first slowed down or even stopped through cooling down to subzero temperatures. This activity is retrieved after warming back to physiological temperature. Cryopreservation has been used for many important applications such as in vitro fertilization (i.e. oocyte (Porcu et al. 1997; Isachenko et al. 2005; Antinori et al. 2007) and sperm (Guthrie & Welch 2005; van den Berg et al. 2007) preservation); stem cell research (Bakken 2006; Demirci & Montesano 2007a ; Hunt & Timmons 2007; Kashuba Benson et al. 2008); preservation of organs for transplantation surgery (Ishine et al. 2000); and storage and transportation of tissue engineered products (Nerem 2000). Recent advances in nano- and micro-technologies have *Authors for correspondence ([email protected]; [email protected]). One contribution of 9 to a Theme Issue ‘Multi-scale biothermal and biomechanical behaviours of biological materials’. This journal is © 2010 The Royal Society 561 on August 25, 2018 http://rsta.royalsocietypublishing.org/ Downloaded from
Transcript of REVIEW Multi-scale heat and mass transfer modelling...

Phil. Trans. R. Soc. A (2010) 368, 561–583doi:10.1098/rsta.2009.0248
REVIEW
Multi-scale heat and mass transfer modellingof cell and tissue cryopreservation
BY FENG XU1, SANGJUN MOON1, XIAOHUI ZHANG1, LEI SHAO1,YOUNG SEOK SONG2,∗ AND UTKAN DEMIRCI1,3,*
1Bio-Acoustic-MEMS in Medicine (BAMM) Laboratory, Center forBioengineering, Department of Medicine, Brigham and Women’s Hospital,
Harvard Medical School, Boston, MA, USA2Polymer System Division, Fiber System Engineering, Dankook University,
Yongin-si, Gyeonggi-do, Korea3Harvard-Massachusetts Institute of Technology Health Sciences and
Technology, Cambridge, MA, USA
Cells and tissues undergo complex physical processes during cryopreservation.Understanding the underlying physical phenomena is critical to improve currentcryopreservation methods and to develop new techniques. Here, we describe multi-scale approaches for modelling cell and tissue cryopreservation including heat transferat macroscale level, crystallization, cell volume change and mass transport across cellmembranes at microscale level. These multi-scale approaches allow us to study cell andtissue cryopreservation.
Keywords: multi-scale modelling; heat and mass transfer; cryopreservation
1. Introduction
Cryopreservation aims to preserve cells/tissues without significantly impactingtheir function (e.g. viability, mechanical properties; Whittingham et al. 1972;Ludwig et al. 1999; Agca 2000; Stachecki & Cohen 2004). Biological activity isfirst slowed down or even stopped through cooling down to subzero temperatures.This activity is retrieved after warming back to physiological temperature.Cryopreservation has been used for many important applications such as in vitrofertilization (i.e. oocyte (Porcu et al. 1997; Isachenko et al. 2005; Antinori et al.2007) and sperm (Guthrie & Welch 2005; van den Berg et al. 2007) preservation);stem cell research (Bakken 2006; Demirci & Montesano 2007a; Hunt & Timmons2007; Kashuba Benson et al. 2008); preservation of organs for transplantationsurgery (Ishine et al. 2000); and storage and transportation of tissue engineeredproducts (Nerem 2000). Recent advances in nano- and micro-technologies have
*Authors for correspondence ([email protected]; [email protected]).
One contribution of 9 to a Theme Issue ‘Multi-scale biothermal and biomechanical behaviours ofbiological materials’.
This journal is © 2010 The Royal Society561
on August 25, 2018http://rsta.royalsocietypublishing.org/Downloaded from

562 F. Xu et al.
channel-based method
liquid nitrogen tank
cellsTS OPS SOPS QMC
(a) (b)droplet-basedmethod
Figure 1. Channel-based and droplet-based methods for cryopreservation. (a) In channel-basedmethods, cells are mixed with media, e.g. CPAs, inside a channel. The whole channel is thenimmersed in liquid nitrogen for freezing. In droplet-based methods, cell-laden droplets are ejectedinto nitrogen for freezing (Demirci & Montesano 2007a). (b) A comparison of the devices used inchannel-based methods (Arav et al. 2002; He et al. 2008): the traditional straw (TS), the open-pulledstraw (OPS), the superfine open-pulled straw (SOPS) and the quartz micro-capillary (QMC).Adapted from He et al. (2008).
allowed new applications in the field of bioengineering (Khademhosseini et al.2005; Zhu et al. 2005; Demirci 2006; Burg et al. 2007; Cheng et al. 2007a,b;Demirci & Montesano 2007b; Ling et al. 2007), where novel cell cryopreservationtechniques have also emerged over the past decade (Lane et al. 1999; Hyttel et al.2000; Arav et al. 2002; Cho et al. 2003) such as quartz capillary channels(Arav et al. 2002; Risco et al. 2007; He et al. 2008) and cell encapsulation usingmicrodroplets (Demirci & Montesano 2007b; Murua et al. 2009). Figure 1 showsthe channel-based and droplet-based methods for cryopreservation. The commonfeature among these methods is the decreased sample size (e.g. channel volumeand droplet diameter; see figure 1b) to achieve higher cooling rates. In vivo tests,e.g. implantation of myoblasts cryopreserved in microcapsules into mice (Muruaet al. 2009), have shown that there is little difference between cells cryopreservedusing droplet-based methods and non-cryopreserved controls (figure 2).
The cellular response to thermal loading at cryogenic temperatures is a complexthermophysical process, i.e. heat transfer process coupled with phase change,moving phase interface (Stefan problem), mass transport (e.g. water) owing toosmotic pressure difference and volume change on freezing (Zhang et al. 2006).These thermophysical events (e.g. ice formation, vitrification) are generallymanipulated with chemical adjuvants (e.g. cryoprotective agents (CPAs),antifreeze protein) to improve the cryopreservation outcome. For example, CPAs(e.g. trehalose, dimethyl sulphoxide (DMSO), glycerol, propanediol) have beenfound to improve the survivability of cryopreserved mammalian cells (Erogluet al. 2000) and reduce the impact of the freezing process on tissue function(Neidert et al. 2004).
Phil. Trans. R. Soc. A (2010)
on August 25, 2018http://rsta.royalsocietypublishing.org/Downloaded from

Review. Modelling of cryopreservation 563
(a) (b)
(c)
Figure 2. Droplet-based cryopreservation is a promising method as shown from in vivo results.(a) Post-thawed morphology of microencapsulated myoblasts in alginate gel droplet with 10%DMSO. Histological analysis (hematoxylin and eosin staining) 180 days post-implantation shows(c) the myoblasts cryopreserved in microcapsules explanted from the subcutaneous tissue ofindividuals compared with (b) non-cryopreserved control. Freezing protocol used: 1 h at −20 ◦C;23 h at −80 ◦C; liquid nitrogen (−196 ◦C) for 44 days. Adapted from Murua et al. (2009). Scalebars: (a) 100 μm, (b,c) 200 μm.
Cryopreservation involves four steps: CPA loading, freezing, thawing andCPA unloading. Slow freezing (approx. −1 ◦C min−1) and vitrification (approx.−100 ◦C min−1, transition from liquid state to glass state without formingcrystals) are two currently widely used methods (Karlsson & Toner 2000). Bothmethods aim to minimize or eliminate cell damage during cryopreservation byminimizing the intracellular ice crystal formation. Slow freezing usually takesadvantage of low concentrations of CPAs (1–2 M), offering low chemical toxicityand osmotic shock to cells (Parkening et al. 1976; Karlsson & Toner 1996).Conventional slow freezing methods function in part by the extracellular iceformation, which gradually increases the solute concentration and dehydratescells. In contrast, vitrification uses high CPA concentrations (4–8 M) coupledwith rapid cooling rates (Luyet & Hodapp 1938; Crowe et al. 1998; Aravet al. 2002; Demirci & Montesano 2007a; Gook & Edgar 2007). Vitrificationusing different tools, including open-pulled straws, electron microscopy grids andcryoloops, all rely on the use of short-term exposure to high levels of CPAswith resulting rapid dehydration of cells prior to freezing (Parkening et al. 1976;Karlsson & Toner 1996; Martino et al. 1996; Lane et al. 1999; Lane &Gardner 2001). The concern with the vitrification approach is the toxic effectsand osmotic shock associated with high CPA levels (Arav et al. 2002). Thethawing procedure could cause similar problems, such as recrystallization andosmotic shock. Most protocols adopt rapid thawing to prevent intracellularice formation (IIF) by limiting time for crystallization (Crowe et al. 1998;Demirci & Montesano 2007a).
Phil. Trans. R. Soc. A (2010)
on August 25, 2018http://rsta.royalsocietypublishing.org/Downloaded from
564 F. Xu et al.
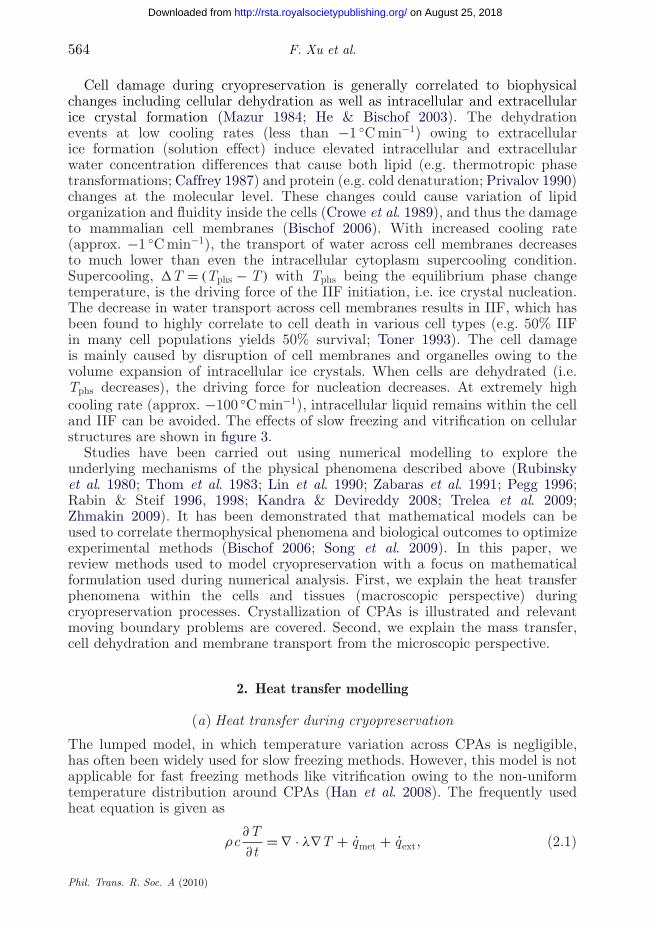
Cell damage during cryopreservation is generally correlated to biophysicalchanges including cellular dehydration as well as intracellular and extracellularice crystal formation (Mazur 1984; He & Bischof 2003). The dehydrationevents at low cooling rates (less than −1 ◦C min−1) owing to extracellularice formation (solution effect) induce elevated intracellular and extracellularwater concentration differences that cause both lipid (e.g. thermotropic phasetransformations; Caffrey 1987) and protein (e.g. cold denaturation; Privalov 1990)changes at the molecular level. These changes could cause variation of lipidorganization and fluidity inside the cells (Crowe et al. 1989), and thus the damageto mammalian cell membranes (Bischof 2006). With increased cooling rate(approx. −1 ◦C min−1), the transport of water across cell membranes decreasesto much lower than even the intracellular cytoplasm supercooling condition.Supercooling, �T = (Tphs − T ) with Tphs being the equilibrium phase changetemperature, is the driving force of the IIF initiation, i.e. ice crystal nucleation.The decrease in water transport across cell membranes results in IIF, which hasbeen found to highly correlate to cell death in various cell types (e.g. 50% IIFin many cell populations yields 50% survival; Toner 1993). The cell damageis mainly caused by disruption of cell membranes and organelles owing to thevolume expansion of intracellular ice crystals. When cells are dehydrated (i.e.Tphs decreases), the driving force for nucleation decreases. At extremely highcooling rate (approx. −100 ◦C min−1), intracellular liquid remains within the celland IIF can be avoided. The effects of slow freezing and vitrification on cellularstructures are shown in figure 3.
Studies have been carried out using numerical modelling to explore theunderlying mechanisms of the physical phenomena described above (Rubinskyet al. 1980; Thom et al. 1983; Lin et al. 1990; Zabaras et al. 1991; Pegg 1996;Rabin & Steif 1996, 1998; Kandra & Devireddy 2008; Trelea et al. 2009;Zhmakin 2009). It has been demonstrated that mathematical models can beused to correlate thermophysical phenomena and biological outcomes to optimizeexperimental methods (Bischof 2006; Song et al. 2009). In this paper, wereview methods used to model cryopreservation with a focus on mathematicalformulation used during numerical analysis. First, we explain the heat transferphenomena within the cells and tissues (macroscopic perspective) duringcryopreservation processes. Crystallization of CPAs is illustrated and relevantmoving boundary problems are covered. Second, we explain the mass transfer,cell dehydration and membrane transport from the microscopic perspective.
2. Heat transfer modelling
(a) Heat transfer during cryopreservation
The lumped model, in which temperature variation across CPAs is negligible,has often been widely used for slow freezing methods. However, this model is notapplicable for fast freezing methods like vitrification owing to the non-uniformtemperature distribution around CPAs (Han et al. 2008). The frequently usedheat equation is given as
ρc∂T∂t
= ∇ · λ∇T + q̇met + q̇ext, (2.1)
Phil. Trans. R. Soc. A (2010)
on August 25, 2018http://rsta.royalsocietypublishing.org/Downloaded from

Review. Modelling of cryopreservation 565
slow freezing vitrification
×20
×100×100
×20
(a) (b)
(c) (d)
Figure 3. Morphology of frozen and vitrified pancreatic substitute beads at −90 ◦C. The beadscomprise TC3 cells encapsulated in alginate gel. Beads frozen using a conventional controlled-rate(−1 ◦C min−1) protocol with 1 M DMSO show considerable ice formation throughout the construct(white spaces a,c). In contrast, beads vitrified with VS55 appear to be ice free (b,d). At highermagnification (c,d), the encapsulated individual cells and clusters of cells appear to be shrunkenand compressed within the frozen matrix (c) compared with the more normal appearance of thecells encapsulated in the vitrified matrix (d). Adapted from Song et al. (2005).
where ρ (kg m−3), c (J kg−1 K−1) and λ (W m−1 K−1) are the density, specificheat and thermal conductivity of tissue, respectively, t (s) is time, T (K) is thetemperature, �T is the temperature gradient, q̇met (W m−3) is the metabolic heatgeneration and q̇ext(W m−3) is the external heat source.
Equation (2.1) has been used to describe cryopreservation processes. Forexample, in channel-based cryopreservation methods (figure 1a) with no externalenergy sources, equation (2.1) can be written using the cylindrical coordinatesystem (Jiao et al. 2006) as
ρc∂T∂t
= 1r
∂
∂r
(λr
∂T∂r
)+ ∂
∂z
(λ∂T∂z
)+ q̇met. (2.2)
Here, several assumptions can be made: (i) negligible latent heat owing to low icecrystallization (Jiao et al. 2006; Han et al. 2008), (ii) ignorable heat transfer inz direction (straw axis) due to the geometry of a very thin and long channel,(iii) temperature-independent (ρ, c and λ �= f (T )) and geometry-independent(ρ, c and λ �= f (r , z)) physical parameters, and (iv) metabolic heat generation
Phil. Trans. R. Soc. A (2010)
on August 25, 2018http://rsta.royalsocietypublishing.org/Downloaded from

566 F. Xu et al.
is negligible (q̇met = 0). With these assumptions, equation (2.2) simply changesinto the following form:
1r
∂
∂r
(r∂T∂r
)= 1
α
∂T∂t
, (2.3)
where α = λ/ρcp (m2 s−1) is the thermal diffusivity.By solving equation (2.3), the resulting transient temperature distribution is
given as (Zhmakin 2009)
T (r) = T∞ + (T0 − T∞)
[ ∞∑n=1
Cn exp(−ζ 2nF0)J0
(ζn
rr0
)], (2.4)
where T0 (K) is the initial temperature and T∞ (K) is the final balancedtemperature, Cn = (2/ζn)J1(ζn)/(J 2
0 (ζn) + J 21 (ζn)), F0 = αt/r2
0 , Jn is nth kind ofthe Bessel function and ζn is the positive roots of the transcendental equation ofζnJ1(ζn)/J0(ζn) = 2hr0/k with h (W m−2 K−1) being the individual heat transfercoefficient.
It should also be noted that the above heat transfer equation, equation (2.1), isbased on the classical Fourier law for heating, which assumes that the propagatingspeed of any temperature disturbance or thermal wave is infinite. The classicalFourier law is given as
q(r , t) = −λ∇T (r , t), (2.5)
where q (W m−2) is the heat flux vector representing heat flow per unit time, perunit area of the isothermal surface in the direction of the decreasing temperatureand r stands for the position vector.
The Fourier heat transfer equation has wide-ranging applicability. However, itstill has limitations due to the Fourier assumption, which is that the temperaturedisturbance or thermal wave is assumed to propagate at an infinite speed throughthe medium. This assumption has been shown to be physically unrealizable sinceany equilibrium state in thermodynamic transition takes time to establish (Liu &Lu 1997). Fourier’s law has been shown to fail during the short duration of aninitial transient of heat transfer (e.g. in microscale laser heating of thin metal filmsand in laser surgery techniques; Peshkov 1944), or when the thermal propagationspeed of the thermal wave is not high enough (e.g. in biomaterials; Morse &Feshbach 1953; Cattaneo 1958; Vernotte 1958).
(i) Hyperbolic heat equation
The thermal wave phenomenon was first experimentally observed in liquidhelium with a finite speed (Peshkov 1944; Brown et al. 1966), and later inshort-pulse laser processing of thin-film engineering structures (Glass et al. 1985;Brorson et al. 1987; Yang 1991; Li 1992; Qiu & Tien 1992, 1993; Banerjee et al.2005). Similar phenomena have also been experimentally observed in materialswith non-homogeneous inner structure (e.g. sand; Kaminski 1990). The non-homogeneous inner structure of biological tissues suggests the existence of unusualheat conduction behaviour, such as temperature oscillation1 (Richardson et al.1950; Roemer et al. 1985) and wave-like behaviour (Mitra et al. 1995).1An unusual oscillation of tissue temperature with heating.
Phil. Trans. R. Soc. A (2010)
on August 25, 2018http://rsta.royalsocietypublishing.org/Downloaded from

Review. Modelling of cryopreservation 567
There are physical viewpoints to explain the fundamental wave behaviour inheat conduction (Cattaneo 1958; Vernotte 1958). A heat conduction equationusing the concept of a finite heat propagation velocity has been proposed. Thisequation is a linear extension of the unsteady Fourier equation, equation (2.5),with introduction of an additional parameter, τq (s), to account for the thermalwave behaviour not captured by Fourier’s theory. This equation is given as(Cattaneo 1958; Vernotte 1958)
q(r , t + τq) = −λ∇T (r , t). (2.6)
Here, τq = α/C 2t (s) is defined as the thermal relaxation time, α (m2 s−1) and Ct
(m s−1) are the thermal diffusivity and the speed of thermal wave in the medium(Mitra et al. 1995; Tzou 1997), respectively. The first-order Taylor expansion ofequation (2.6) gives
q(r , t) + τq∂q(r , t)∂t
= −λ∇T (r , t). (2.7)
Various physical points of view have been proposed for the thermal relaxationtime τq (Tzou 1993), e.g. τq results from the phase lag between the heat flux vectorand temperature gradient in a high-rate response, or τq represents a physicalconstant at which the intrinsic length scales of diffusion behaviour and wavepropagation merge together. Most biomaterials have non-homogeneous structurecomposed of cells, extracellular matrix of superstructures, liquids and solid/softtissue. This feature results in higher thermal relaxation times compared withengineering materials. For example, τq for biological tissues was measured to be inthe range of 10–1000 s at cryogenic temperatures and 1–100 s at room temperature(Vedavarz et al. 1994).
Substituting the heat conduction equation (2.1) into the thermal waveequation, we can get the thermal wave model of heat transfer as
τqρc∂2T∂t2
= λ∇2T +(
q̇met + q̇ext + τq∂ q̇met
∂t+ τq
∂ q̇ext
∂t
). (2.8)
This equation is known as a hyperbolic heat equation because there appears atwo-double-derivative term (called the wave term mathematically) that modifiesthe parabolic Fourier heat equation into a hyperbolic partial differential equation(Tang & Araki 1996).
The thermal wave model has been used to explain interesting phenomena (Tzou1992). However, its validity has been questioned since: (i) it is not built uponthe details of energy transport in the material; (ii) although the thermal wavemodel can capture the macroscale response in time, the wave concept does notcapture the microscale response in space (Ozisik & Tzou 1994; Tzou 1997); and(iii) the thermal wave model can lead to unusual solutions (Taitel 1972; Godoy &García-Colín 1997; Körner & Bergmann 1998).
(ii) Dual-phase-lag model
To address the limitations of the thermal wave model, i.e. ignoring theeffect of microstructural interactions in the fast transient process of heattransport (e.g. fast cooling during cryopreservation processes), the phase lag timeconstant for temperature gradient, τT (s), has been introduced to equation (2.6)
Phil. Trans. R. Soc. A (2010)
on August 25, 2018http://rsta.royalsocietypublishing.org/Downloaded from
568 F. Xu et al.
(Ozisik & Tzou 1994; Tzou 1995, 1997). This gives the heat conduction equationcalled the dual-phase-lag (DPL) equation:
q(r , t + τq) = −λ∇T (r , t + τT ), (2.9)
where τq and τT can be interpreted as the periods arising from ‘thermal inertia’and ‘microstructural interaction’, respectively (Tzou 1995).
The simplest example of the DPL model is its first-order Taylor expansions forboth q and T , given as (Xu et al. 2008a, 2009)
q(r , t) + τq∂q(r , t)∂t
= −λ
[∇T (r , t) + τT ∂T (r , t)
∂t
]. (2.10)
Upon substituting equation (2.1) into this equation, we get
τqρc∂2T∂t2
− λ∇2T + τTλ∇2 ∂T∂t
+(
q̇met + q̇ext + τq∂ q̇met
∂t+ τq
∂ q̇ext
∂t
). (2.11)
Antaki (2005) pointed out that the DPL model combines the wave features ofhyperbolic conduction with a diffusion-like feature not captured by the hyperboliccase. By fitting the experimental data of Mitra et al. (1995) on muscle tissue tothe model, it was found that τq = 16 s, τT = 0.043 s for experiment 12 and τq = 14 s,τT = 0.056 s for experiment 3.3
(b) Crystallization
Crystallization occurs through ice crystal nucleation and growth in bothintracellular and extracellular regions when the temperature of the liquidapproaches its crystallization temperature. The crystallization is the phasetransition of the first order including energy release owing to the latent heatof fusion. A number of factors such as cooling rate, homogeneity and pressureaffect the phase transition from liquid to solid.
The kinematic equation of ice crystallization (χ being the ratio of the totalquantity of crystallized ice on cooling to the maximum crystallizable ice) isexpressed as (Baudot et al. 2000)
dχ
dt= κa1(χ)(Tmelting − T ) exp
(− Q
RT
), (2.12)
where κ = L/πδ2vTmrf and a1(χ) = χ2/3(1 − χ). Here, Q (J mol−1) is theactivation energy, Tmelting (K) is the final temperature of the freezing process,R (J mol−1 K−1) is the gas constant, L (J kg−1) is the latent heat, δ (m) isthe thickness of the transition layer between liquid and solid, rf (m) is theradius of the ice region, and v (m2 s−1) is the kinematic viscosity. Note that theheat transfer equation and crystallization equation are solved in an uncoupled
2The experiments were designed to show that heat waves take a finite time to reach a particularpoint inside the sample. In the experiment, two identical meat samples at different initialtemperatures were brought into contact with each other.3The experiments were designed to show wave superposition: one thin sample is sandwiched bytwo thicker ones.
Phil. Trans. R. Soc. A (2010)
on August 25, 2018http://rsta.royalsocietypublishing.org/Downloaded from

Review. Modelling of cryopreservation 569
manner. Integration of equation (2.12) leads to the following implicit equationof χ (Baudot et al. 2000):
A(χ) = κ
∫ t
0(Tmelting − T ) exp
(− Q
RT
)dt, (2.13)
where A(χ) = ∫χ
0 dχ/x2/3(1−χ) = − ln(1 − χ1/3) + (1/2) ln(1 + χ1/3 + χ2/3) + √3
arctan [√3χ1/3/(2 + χ1/3)].There are three main approaches that macroscopically model the solidification
of liquids: uncoupled method, Stefan approach (sharp interface method) and zonemodel. As explained through equations (2.1)–(2.5) and (2.12), the uncoupledmethod is based on the assumption that the latent heat generation of liquid duringcooling process is negligible. Consequently, the energy equation is decoupledfrom the kinetics of the liquid (Ren et al. 1994). Basically, the Stefan problemhas characteristics of a moving boundary between liquid and solid with a sharpinterface (Friedman 1968). In the classical Stefan problem addressing the meltingof ice, the contribution of diffusion and convection to solidification can beneglected. In this case, crystallization is determined only by the temperatureevolution (Friedman 1968). Assuming that the thermophysical parameters areconstant, the following simple equation is used in both liquid and solid domains:
ρc∂T∂t
= −λ∇T . (2.14)
The interface between liquid phase and solid phase is determined by the continuityof the heat flux, including the latent heat, at the interface as boundary conditions:
λs∂T∂nΓ
∣∣∣∣s− λ1
∂T∂nΓ
∣∣∣∣l= LvΓ , (2.15)
where L (J kg−1) is the latent heat during crystallization and melting, nΓ isthe outer normal vector to the solid domain and vΓ is the normal componentof the interface velocity. In Stefan’s approach, the entire domain is sharplydivided into solid and liquid sub-domains. However, it was reported that thesharp interface assumption is not always reasonable since smooth change ofthe phase is more accurate to describe the underlying physics, i.e. smoothformation of ice crystals (Benard & Advani 1995). In §2c, we will explain howto deal with the moving boundary. As an alternative, the zone model uses adegree of crystallization χ (equation (2.12)). It is found that one can model thecrystallization process as a propagating zone that can be either very large or verynarrow (sharp interface), depending on the processing conditions and materialparameters (Benard & Advani 1995). Furthermore, the zone models are basedon the hypothesis that the total heat content can be calculated by an enthalpyfunction (Le Bot & Delaunay 2008).
There is another parameter named the probability of intracellular ice formation(PIF), where when PIF is larger than the threshold that the entire intracellularvolume will freeze at once. A model has also been proposed for PIF, usingheterogeneous nucleation theory (Toner 1993) as
PIF = 1 − exp[− 1
B
∫T
Tseed
AΩ exp(− κ
�T 2T 3
)dT
], (2.16)
Phil. Trans. R. Soc. A (2010)
on August 25, 2018http://rsta.royalsocietypublishing.org/Downloaded from

570 F. Xu et al.
where B (K s−1) is the cooling rate, A (m2) is the cellular surface area, Tseed (K)is the ice seeding temperature, �T is the supercooling defined as (Tphs − T ), Ωis a heterogeneous term of the nucleation related to the ability of water moleculesto cross the interface and join the ice phase and κ is the thermodynamic termof the nucleation related to the Gibbs free energy for the formation of a criticalnucleus of ice (Toner 1993; Devireddy et al. 2002).
(c) Moving boundary problems for cryopreservation
Once the formulation of solidification is determined, we have to selecta numerical method to calculate the moving boundary between liquid andsolid phases during cryopreservation. The methods for the moving boundaryproblem are classified mainly into two groups (Crank 2005): front trackingmethod and front capturing method. First, the front tracking method thatpossesses the Lagrangian feature uses a set of marker points indicating thefront interface. In this method, there is a discontinuity of solution across theinterface, which is modelled by a differential equation with lower dimensionality.This method also requires interface updating, followed by interface smoothing.One of the promising methods using this Lagrangian approach is the arbitraryLagrangian Eulerian method, which moves meshes in the domain. Second,the front capturing method is based on the Eulerian concept (Braess &Wriggers 2000). Since the front capturing method uses a fixed mesh, itis more suitable for a system with a complex, three-dimensional geometry.Furthermore, the front capturing method commonly encompasses three popularsub-methods: phase field (volume of fluid (VOF)), level set, and marker and cellmethod. For instance, in the VOF method, the phase function f (x) is given as(Zhmakin 2009)
f (x) ={1, x ∈ Ωs
0, x ∈ Ωl.(2.17)
Here, the entire domain consists of a solid sub-domain Ωs and a liquid sub-domain Ωl. The interface is determined by a function with a value in the rangeof 0 through 1. On the other hand, the level set method uses the smooth functionξ(x, t) instead of f (x), defined as (Sussman et al. 1994)
ξ(x, t) =⎧⎨⎩
>0, x ∈ Ωs
=0, x ∈ Γ0
<0, x ∈ Ωl,(2.18)
where Γ0 is the interface front. The phase function (or the smooth function) isgoverned by
∂ξ
∂t+ v · ∇ξ = 0, (2.19)
where v is the interface velocity. The unit normal vector to the interface and thecurvature of the interface are expressed as n0 = −∇ξ/|∇ξ | and Kinterface = ∇ · n0,respectively.
Phil. Trans. R. Soc. A (2010)
on August 25, 2018http://rsta.royalsocietypublishing.org/Downloaded from

Review. Modelling of cryopreservation 571
–250
–200
–150
–100
–50
0
50
100
T (
°C)
d (mm)
0 2 4 6 8 10 0 5 10 15 20 25 30
–150
–100
–50
0
50
t (s)
liquid nitrogen tank
skinsample d
H =
10
mm
epidermis
dermis
epidermis–dermis interface
dermis–fat interface
T jump withDPL
model
wave front
fat
(a)
(b) (c)
Figure 4. Modelling of tissue cryopreservation. Different models (i.e. Fourier model, thermal wavemodel and DPL model) are used to indicate the non-Fourier effect on heat transfer process duringtissue cryopreservation. (a) Schematic of skin tissue immersed in liquid nitrogen for freezing. (b)Temperature distribution within skin at t = 30 s. (c) Temperature variation with time at dermis–fatinterface at r = 1.6 mm. (b,c) Solid line, τq = 0 s and τT = 0 s; dashed line, τq = 10 s and τT = 0 s;and dotted line, τq = 10 s and τT = 10 s.
(d) Case study
A case study is performed here to investigate the effect of the non-Fourier effecton tissue freezing (figure 4a). At t = 0, the tissue that is initially of temperatureT = 37 ◦C (e.g. maintained in an incubator) is frozen by suddenly immersinginto liquid nitrogen. The skin is modelled as a layered structure (i.e. epidermis,dermis and fat layers) mimicking the real skin. The problem is solved by usingthree models, i.e. Fourier model (equation (2.1)), thermal wave model (equation(2.8)) and DPL model (equation (2.11)). The relevant parameters used for heattransfer analysis can be found in Xu et al. (2008b).
The comparison between results predicted by the three heat transfer modelsis shown in figure 4b for temperature spatial distribution along skin depth andin figure 4c for temperature temporal variation at the dermis–fat interface.The results demonstrate that tissue temperatures during the freezing processpredicted by the different models deviate substantially. With the thermal wavemodel, the temperature inside the tissue was undisturbed during the initial stageof freezing before jumping instantaneously (t < 15 s in figure 4c). This may be
Phil. Trans. R. Soc. A (2010)
on August 25, 2018http://rsta.royalsocietypublishing.org/Downloaded from

572 F. Xu et al.
viewed as the wave front emerging from the finite propagation of the thermalwave, i.e. existence of a relaxation time τq that is the phase lag in establishing theheat flux and the associated conduction through a medium. Unlike the thermalwave model, no wave behaviour is observed in results from the DPL model, buta non-Fourier diffusion-like behaviour exists. This is due to the second thermalrelaxation time τT which accounts for the diffusion of heat ahead of sharp wavefronts that would be induced by τq . This relaxation time constant is the phaselag in establishing the temperature gradient across the medium during whichconduction occurs through its small-scale structures. The existence of τq weakensthe thermal wave and thereby destroys the sharp wave front. It is noticed that asudden temperature step at both boundaries is associated with the DPL model,as shown in figure 4b. In summary, these results demonstrate that non-Fourierfeatures could play an important role in the tissue cryopreservation process.
3. Mass transport modelling of cryopreservation
(a) Mass transfer at macroscale
To load and unload CPAs, macroscopic flow along with CPAs can be used. Forinstance, a microfluidic device can be designed and fabricated to load cells withCPAs along a microfluidic channel, where the concentration of CPAs progressivelyvaries along the channel by diffusion (Song et al. 2009). In this case, themacroscopic flow at steady state is governed by the Navier–Stokes equations as
ρu · ∇u = ∇ · η(∇u + (u)T) − ∇P (3.1)
and
∇ · u = 0, (3.2)
where η (Pa s−1) is the fluid viscosity depending on the CPA concentration,u (m s−1) is the velocity vector and P (Pa) is the fluid pressure. Assuming thatCPAs interact only with water molecules, the CPA transport is modelled by usingthe convection and diffusion equation at steady state:
∇ · (cu) = ∇ · (D∇c), (3.3)
where c (M) is CPA concentration and D (m2 s−1) is the diffusion coefficientof CPAs.
(b) Cell dehydration
As cells are cooled down, the formed ice rejects solute resulting in unfrozenfractions with higher solute concentrations. The reduced amount of water in theintracellular region causes an increase in the intracellular concentration of solutes(Katkov 2002), and thus an osmotic pressure difference across the cell membrane.This pressure difference exposes the unfrozen fraction setting up a driving forcefor exosmosis of water from the cell, or dehydration. The dehydration can induceserious damage to cells (Fathallah et al. 1995). Mazur’s model is widely used for
Phil. Trans. R. Soc. A (2010)
on August 25, 2018http://rsta.royalsocietypublishing.org/Downloaded from

Review. Modelling of cryopreservation 573
describing cell dehydration (Mazur 1963), which is given as
dVdt
= LpA(πi − πo), (3.4)
where V (m3) is the cell volume, t (s) is time, Lp is the hydraulic permeability(m3 N−1 s−1) and can be found in He & Bischof (2003) for a variety of cell types, A(m2) is the cell surface area, and πi (N m−2) and πo (N m−2) are the intracellularand extracellular osmotic pressures, respectively.
To examine the water transport across the cell membrane, salt concentration(c−i
salt) and actual salt concentration (cisalt) can be defined as (Collado 2007)
c−isalt = moles of salt
total cell volume= Nsalt
V(3.5)
and
cisalt = moles of salt
osmotically active volume= Nsalt
V − Vb, (3.6)
where Vb (m3) denotes the osmotically inactive volume. Consideration of thefraction of the osmotically inactive cell volume φ = Vb/V derives the followingequation:
c−isalt = ci
salt(1 − φ). (3.7)
When taking into account the presence of another semipermeable solute (e.g.CPA), the mean cellular concentration becomes c−i
s = Ns/V with Ns being molesof this solute. By applying Henry’s law of absorption with coefficient k (Batyckyet al. 1997) to describe the absorption of semipermeable solute to internalorganelle membranes, we can get
c−is = ci
s(1 − φ + kα + Kφ), (3.8)
where α = Sm/V (Sm being the specific surface area of organelle membranes) andK means the partition coefficient into organelles.
With the help of the Reynolds transport theorem also known as the Leibniz–Reynolds transport theorem (Collado 2007) and considering the conservation ofsolutes within the moving control volume V (t), the total moles of salt N (t) canbe calculated as
N (t) =∫V (t)
c(r, t) dV , (3.9)
where c(r, t) (M) is the solute concentration. Also, the equation can be rewrittenin the derivative form as
dNdt
=∫V (t)
(∂c∂t
+ v · ∇c)
dV +∫∂V (t)
dS · (u − v)c, (3.10)
where ∂V is the volume boundary moving with velocity u (or surface of thecontrol volume) and v is the mass average velocity of convection across the
Phil. Trans. R. Soc. A (2010)
on August 25, 2018http://rsta.royalsocietypublishing.org/Downloaded from
574 F. Xu et al.
volume boundary. In the case of a spherical cell geometry
N (t) =∫R(t)
0c(r, t)r2 dr , (3.11)
and the rate of solute or salt concentration variation in a cell is given as
dNdt
= 4π
∫R(t)
0
∂c∂t
r2 dr + 4πR(t)2u(t)c(R(t), t)
= 4πR2(
D̄∂ c̄dr
+ uc)∣∣∣∣
r=R. (3.12)
The term above in parentheses represents the flux of solutes.
(c) Mass transport across cell membrane
Models have been proposed to describe the mass transport across cellmembranes by diffusion during freezing (Kleinhans 1998; Woods et al. 1999; Cuiet al. 2002; Ateshian et al. 2006; Li 2006), such as Fick’s equation (Rubinsky &Pegg 1988; Rubinsky 1989; Bischof & Rubinsky 1993) and Mazur’s equation(Batycky et al. 1997; Zhmakin 2009). These models can commonly be classifiedinto three subtypes, i.e. one-parameter, two-parameter and three-parametermodels, depending on whether solute permeability, water permeability and/or theinteraction between the solute and the solvent are considered (Kleinhans 1998;Woods et al. 1999; Ateshian et al. 2006). In these models, it is assumed thata permeable CPA diffuses in/out of cells and water channels interact with low-molecular-weight CPA channels. The three-parameter model, also known as theKedem–Katchalsky model, adopts the reflection coefficient to couple the waterand solute transport across the cell membrane. As a result, the model can helpto understand the change in fluid fluxes, volume changes, and CPA molarity ofcells due to osmotic pressure. Assuming that cells are submerged in the CPAs,the water flux across the cell membrane (Jw) is given as (Cui et al. 2002; Li 2006;Song et al. 2009)
Jw = Lp�P − LpσsRT�c, (3.13)
P i − Pe = EV − V0
V0+ P i
0 − Pe0 (3.14)
anddVw
dt= JwA, (3.15)
where Lp (m3 N−1 s−1) indicates the membrane hydraulic conductivity; σs is themembrane reflection coefficient of CPAs (related to how the cell membrane canreflect solute particles from passing through); R (J mol−1 K−1) is the universal gasconstant; T (K) is the temperature; c (M) is the concentration of CPAs; A (m2)is the cell surface area; E (Pa) is the cellular elastic modulus; and Vw (m3) is thewater volume of cells. In addition, superscripts i and e in the above equations
Phil. Trans. R. Soc. A (2010)
on August 25, 2018http://rsta.royalsocietypublishing.org/Downloaded from
Review. Modelling of cryopreservation 575
denote the intracellular and extracellular regions, respectively. Next, the CPAflux (Jc) is expressed as
Jc = (1 − σs)cupJw + ωRT�c (3.16)
anddVc
dt= JcA, (3.17)
where ω (mol N−1 s−1) and cup (M) are the membrane permeability of CPAs andthe upstream concentration of CPAs, respectively. On the other hand, since thesemicroscopic equations are coupled with the macroscopic transport phenomena(equations (3.1)–(3.3)), we have to take into account all of them simultaneously(Friedman 1968).
It should be noted that the current approaches as reviewed in this paperhave limitations. They cover macroscale (greater than 1 mm, tissue level)and microscale (approx. 1 μm to 1 mm, cellular level), where the continuumassumption is still valid. However, when the scale goes down to nanoscale(less than 100 nm, molecular level, e.g. protein, lipid and DNA), the continuumassumption is not applicable. In this range, on which we do not focus in thispaper, mathematical models follow molecular dynamics (Bromfield et al. 2009;Wang et al. 2009).
(d) Case study
During cryopreservation, cells may undergo some damage due to osmotic shock,dehydration and extracellular/intracellular ice crystallization (Mazur et al. 1992;Hyttel et al. 2000; Ogonuki et al. 2006). Therefore, it is of great importance tominimize the cell damage through the cryopreservation processes. In particular,osmotic shock before freezing and after thawing (i.e. in CPA loading andunloading processes) acts as a primary factor that reduces cell viability duringcryopreservation (Song et al. 2009). In this case study, the mass transport in amicrofluidic channel is investigated by carrying out macroscopic analyses withequations (3.1)–(3.3). The model, equations (3.4)–(3.13), was used to simulatethe CPA loading and unloading processes in a microfluidic device (figure 5a;Song et al. 2009). Cells are infused into the middle channel with simultaneousinjection of CPAs during CPA loading process or phosphate buffered saline (PBS)buffer during CPA unloading process into the two side channels. The Kedem andKatchalsky model (equations (3.13)–(3.17)) is used here to characterize osmoticshock at a microscale, i.e. water and CPA transport across the cell membrane,figure 5b,c. Cells experience the variation in the CPA and water concentration(e.g. water goes into cells and CPA comes out of cells in the CPA unloading step)in a progressive manner while flowing through the channel due to the diffusionprocess and laminar flow (Reynolds number Re ∼ 3; figure 5d,e). This smoothvariation of intracellular water concentration prevents cells from abrupt changein water flux and thus from high levels of osmotic shock. The model simulationresults are consistent with the experimental results for both CPA loading andunloading processes (figure 5d,e).
From this case study, we can understand how water and CPA fluxes arecorrelated with osmotic shock that cells experience during CPA loading andunloading processes. Such a modelling approach gives insight into the macroscopic
Phil. Trans. R. Soc. A (2010)
on August 25, 2018http://rsta.royalsocietypublishing.org/Downloaded from

576 F. Xu et al.
channel length (m)
0.2 0.4 0.6 0.8 1.0 1.2 1.40
0.2
0.4
0.6
0.8
1.0
norm
aliz
ed C
PA c
once
ntra
tion
channel length (m)
0.2 0.4 0.6 0.8 1.0 1.2 1.40
0.2
0.4
0.6
0.8
1.0
norm
aliz
ed C
PA c
once
ntra
tion
0 1 2 3 4 5 6
–1.0
–0.8
–0.6
–0.4
–0.2
0
J C/J
C0
J W/J
W0
t/t0
t/t0
–0.02
0
0.02
0.04
0.06
0.08
0 5 10 15 20
0
0.2
0.4
0.6
0.8
1.0
J W/J
W0
–0.10
–0.08
–0.06
–0.04
–0.02
0
J C/J
C0
CPAcell
PBS
100 µm
1 cm
cell
H2OCPA
cell
H2OCPA
(a) (b)
(c)
(e)(d)
Figure 5. Modelling of CPA uploading and unloading processes using a microfluidic device for cellcryopreservation. (a) The microfluidic device has a three-input channel with dimensions of 100 μmin height, 100 μm in width and 1.5 m in length. Bright field image is the microfluidic channel inletduring flow. (b) Dimensionless water fluxes and CPA fluxes across cell membrane during the CPAloading step and (c) CPA unloading step. Here, V0 is the initial water volume in the cell, C0 isthe final CPA concentration, t0 = V0/(A0RTC0Lp) is the characteristic time, Jw0 = V0/(A0t0) isthe initial water flux and Jc0 = C0/(A0t0) is the initial CPA flux. Normalized CPA concentrationvariation along the microfluidic channel in the (d) loading step and (e) unloading step agreeswell with experimental data. (b,c) Solid line, water flux; dotted line, CPA flux. (d,e) Filled circle,experiment run 1; open circle, experiment run 2; inverted triangle, experiment run 3; solid line,numerical. Adapted from Song et al. (2009).
transport behaviour of CPAs in a microfluidic channel. This can help tooptimize the current cryopreservation protocols and to develop new protocolsby minimizing osmotic shock during CPA loading and unloading.
Phil. Trans. R. Soc. A (2010)
on August 25, 2018http://rsta.royalsocietypublishing.org/Downloaded from

Review. Modelling of cryopreservation 577
4. Summary
We present mathematical formulation and methods regarding heat and masstransfer processes during cryopreservation. The models cover the multiple spatialand temporal scales from cell scale to tissue scale. In the heat transfer section,modelling of heat transfer in tissues and ice crystallization in cells duringcryopreservation were elucidated. In the mass transfer section, physiologicalphenomena related to cells such as cell dehydration and cell membrane transportwere outlined. The imbalance of osmotic pressure across cell membranes thatserves as a driving force was formulated mathematically. Since these macroscopicanalyses for cryopreservation are linked to the microscopic results, it is necessaryto investigate the entire cryopreservation process from multiple perspectives, i.e.through combining microscale and macroscale analyses.
The multi-scale modelling approach as reviewed in this paper can also beapplied to other fields such as cryosurgery, where malignant or unwantedcells/tissues are destroyed by localized freezing using a fine surgical probe(Rubinsky 2000). Cryosurgery is now used routinely for treatment of cancer andother diseases (Rubinsky 2000; Spencer 2004). The need to design and predictthe treatment outcome necessitates mathematical models. For example, bothmacroscale (Chua et al. 2007; Romero-Mendez et al. 2007) and microscale (Zhanget al. 2003) models have been developed for cancer cryosurgery to achieve maximalcell destruction within the tumour while preserving neighbouring healthy tissue.
The ultimate goal of the mathematical modelling is to improve cryopreservationoutcome by supplying reliable prediction of local temperature and crystallizationin cells/tissues during cryopreservation. This necessitates accurate informationon parameters used in the models such as thermal properties (e.g. thermalconductivity and specific heat), mass transfer properties (e.g. mass diffusivity)and geometry (e.g. cell shape and tissue microarchitecture). These parametersare often temperature dependent. More quantitative measurements of thesemodel parameters are thus needed. Also, the connection between thermophysicalparameters and the ultimate biological outcome (e.g. cell viability and tissuefunction) is still not well understood. Furthermore, most of the mathematicalmodels handle the freezing process and few consider the storage process duringcryopreservation, where the tolerance of cells to cryopreservation is induced (e.g.cold shock protein; Kim et al. 1998, 2009). An enhanced understanding of themechanisms involved in this cell tolerance induction will help further developmentand application of cryopreservation techniques.
F.X., S.M., X.Z., L.S. and U.D. would like to acknowledge the support from NIH R21 (EB007707)and NIH R01 (AI081534). Y.S.S. would like to thank the research fund of Dankook Universityin 2009.
References
Agca, Y. 2000 Cryopreservation of oocyte and ovarian tissue. ILAR J. 41, 207–220.Antaki, P. J. 2005 New interpretation of non-Fourier heat conduction in processed meat. J. Heat.
Transf. 127, 189–193. (doi:10.1115/1.1844540)Antinori, M., Licata, E., Dani, G., Cerusico, F., Versaci, C. & Antinori, S. 2007 Cryotop vitrification
of human oocytes results in high survival rate and healthy deliveries. Reprod. Biomed. Online14, 72–79.
Phil. Trans. R. Soc. A (2010)
on August 25, 2018http://rsta.royalsocietypublishing.org/Downloaded from

578 F. Xu et al.
Arav, A., Yavin, S., Zeron, Y., Natan, D., Dekel, I. & Gacitua, H. 2002 New trends in gamete’scryopreservation. Mol. Cell. Endocrinol. 187, 77–81.
Ateshian, G. A., Likhitpanichkul, M. & Hung, C. T. 2006 A mixture theoryanalysis for passive transport in osmotic loading of cells. J. Biomech. 39, 464–475.(doi:10.1016/j.jbiomech.2004.12.013)
Bakken, A. M. 2006 Cryopreserving human peripheral blood progenitor cells. Curr. Stem Cell Res.Ther. 1, 47–54. (doi:10.2174/157488806775269179)
Banerjee, A., Ogale, A. A., Das, C., Mitra, K. & Subramanian, C. 2005 Temperature distribution indifferent materials due to short pulse laser irradiation. Heat Transf. Eng. 26, 41–49. (doi:10.1080/01457630591003754)
Batycky, R. P., Hammerstedt, R. & Edwards, D. A. 1997 Osmotically driven intracellular transportphenomena. Phil. Trans. R. Soc. Lond. A 355, 2459–2488. (doi:10.1098/rsta.1997.0143)
Baudot, A., Alger, L. & Boutron, P. 2000 Glass-forming tendency in the system water–dimethylsulfoxide. Cryobiology 40, 151–158. (doi:10.1006/cryo.2000.2234)
Benard, A. & Advani, S. G. 1995 Energy equation and the crystallization kinetics of semi-crystalline polymers: regimes of coupling. Int. J. Heat Mass Transf. 38, 819–832. (doi:10.1016/0017-9310(94)00205-A)
Bischof, J. C. 2006 Micro and nanoscale phenomenon in bioheat transfer. Heat MassTransf./Waerme- und Stoffuebertragung 42, 955–966.
Bischof, J. C. & Rubinsky, B. 1993 Microscale heat and mass transfer of vascular and intracellularfreezing. J. Heat Transf. 115, 1029–1035. (doi:10.1115/1.2911357)
Braess, H. & Wriggers, P. 2000 Arbitrary Lagrangian Eulerian finite element analysis of free surfaceflow. Comput. Methods Appl. Mech. Eng. 190, 95–109. (doi:10.1016/S0045-7825(99)00416-8)
Brazhnikov, A. M., Karpychev, V. A. & Luikova, A. V. 1975 One engineering method of calculatingheat conduction processes. Inzh. Fiz. Zh. 28, 677–680.
Bromfield, J. J., Coticchio, G., Hutt, K., Sciajno, R., Borini, A. & Albertini, D. F. 2009 Meioticspindle dynamics in human oocytes following slow-cooling cryopreservation. Hum. Reprod. 24,2114–2123. (doi:10.1093/humrep/dep182)
Brorson, S. D., Fujimoto, J. G. & Ippen, E. P. 1987 Femtosecond electronic heat transfer dynamicsin thin gold film. Phys. Rev. Lett. 59, 1962–1965. (doi:10.1103/PhysRevLett.59.1962)
Brown, J. B., Chung, D. Y. & Matthews, P. W. 1966 Heat pulses at low temperatures. Phys. Lett.21, 241–243. (doi:10.1016/0031-9163(66)90794-3)
Burg, T. P., Godin, M., Knudsen, S. M., Shen, W., Carlson, G., Foster, J. S., Babcock, K. &Manalis, S. R. 2007 Weighing of biomolecules, single cells and single nanoparticles in fluid.Nature 446, 1066–1069. (doi:10.1038/nature05741)
Caffrey, M. 1987 The combined and separate effects of low temperature and freezing on membranelipid mesomorphic phase behavior: relevance to cryobiology. Biochim. Biophys. Acta 896,123–127. (doi:10.1016/0005-2736(87)90365-8)
Cattaneo, C. 1958 A form of heat conduction equation which eliminates the paradox ofinstantaneous propagation. Comp. Rend. 247, 431–433.
Cheng, X., Liu, Y. S., Irimia, D., Demirci, U., Yang, L., Zamir, L., Rodriguez, W. R., Toner, M. &Bashir, R. 2007a Cell detection and counting through cell lysate impedance spectroscopy inmicrofluidic devices. Lab Chip 7, 746–755. (doi:10.1039/b705082h)
Cheng, X., Irimia, D., Dixon, M., Sekine, K., Demirci, U., Zamir, L., Tompkins, R. G., Rodriguez,W. & Toner, M. 2007b A microfluidic device for practical label-free CD4(+) T cell counting ofHIV-infected subjects. Lab Chip 7, 170–178. (doi:10.1039/b612966h)
Chester, M. 1963 Second sound in solid. Phys. Rev. 131, 2013–2015. (doi:10.1103/PhysRev.131.2013)
Cho, B. S., Schuster, T. G., Zhu, X., Chang, D., Smith, G. D. & Takayama, S. 2003 Passivelydriven integrated microfluidic system for separation of motile sperm. Anal. Chem. 75, 1671–1675.(doi:10.1021/ac020579e)
Chua, K. J., Chou, S. K. & Ho, J. C. 2007 An analytical study on the thermal effects of cryosurgeryon selective cell destruction. J. Biomech. 40, 100–116. (doi:10.1016/j.jbiomech.2005.11.005)
Collado, F. J. 2007 Reynolds transport theorem for a two-phase flow. Appl. Phys. Lett. 90, 024101.(doi:10.1063/1.2430675)
Phil. Trans. R. Soc. A (2010)
on August 25, 2018http://rsta.royalsocietypublishing.org/Downloaded from

Review. Modelling of cryopreservation 579
Crank, J. 2005 Free and moving boundary problems. New York, NY: Oxford University Press.Crowe, J. H., Hoekstra, F. A., Crowe, L. M., Anchordoguy, T. J. & Drobnis, E. 1989 Lipid phase
transitions measured in intact cells with Fourier transform infrared spectroscopy. Cryobiology26, 76–84. (doi:10.1016/0011-2240(89)90035-7)
Crowe, J. H., Carpenter, J. F. & Crowe, J. F. 1998 The role of vitrification in anhydrobiosis. Annu.Rev. Physiol. 6, 73–103. (doi:10.1146/annurev.physiol.60.1.73)
Cui, Z. F., Dykhuizen, R. C., Nerem, R. M. & Sembanis, A. 2002 Modeling of cryopreservationof engineered tissues with one-dimensional geometry. Biotechnol. Prog. 18, 354–361.(doi:10.1021/bp0101886)
Demirci, U. 2006 Acoustic picoliter droplets for emerging applications in semiconductor industryand biotechnology. J. Microelectromech. Syst. 15, 957–966. (doi:10.1109/JMEMS.2006.878879)
Demirci, U. & Montesano, G. 2007a Cell encapsulating droplet vitrification. Lab Chip 7, 1428–1433.(doi:10.1039/b705809h)
Demirci, U. & Montesano, G. 2007b Single cell epitaxy by acoustic picolitre droplets. Lab Chip 7,1139–1145. (doi:10.1039/b704965j)
Devireddy, R. V., Smith, D. J. & Bischof, J. C. 2002 Effect of microscale mass transport and phasechange on numerical prediction of freezing in biological tissue. J. Heat Transf. 124, 365–374.(doi:10.1115/1.1445134)
Eroglu, A., Russo, M. J., Bieganski, R., Fowler, A., Cheley, S., Bayley, H. & Toner, M. 2000Intracellular trehalose improves the survival of cryopreserved mammalian cells. Nat. Biotechnol.18, 163–167. (doi:10.1038/72608)
Fathallah, H., Coezy, E., de Neef, R. S., Hardy-Dessources, M. D. & Giraud, F. 1995 Inhibition ofdeoxygenation-induced membrane protein dephosphorylation and cell dehydration by phorbolesters and okadaic acid in sickle cells. Blood 86, 1999–2007.
Friedman, A. 1968 The Stefan problem in several space variables. Trans. Am. Math. Soc. 133,51–87. (doi:10.2307/1994932)
Glass, D. E., Ozisik, M. N. & Vick, B. 1985 Hyperbolic heat conduction with surface radiation.Int. J. Heat Mass Transf. 28, 1823–1830. (doi:10.1016/0017-9310(85)90204-2)
Godoy, S. & García-Colín, L. S. 1997 Nonvalidity of the telegrapher’s diffusion equationin two and three dimensions for crystalline solids. Phys. Rev. E 55, 2127–2131.(doi:10.1103/PhysRevE.55.2127)
Gook, D. A. & Edgar, D. H. 2007 Human oocyte cryopreservation. Hum. Reprod. Update 13,591–605. (doi:10.1093/humupd/dmm028)
Guthrie, H. D. & Welch, G. R. 2005 Impact of storage prior to cryopreservation on plasmamembrane function and fertility of boar sperm. Theriogenology 63, 396–410. (doi:10.1016/j.theriogenology.2004.09.020)
Han, X., Ma, H. B., Jiao, A. J. & Critser, J. K. 2008 Investigations on the heat transport capabilityof a cryogenic oscillating heat pipe and its application in achieving ultra-fast cooling rates forcell vitrification cryopreservation. Cryobiology 56, 195–203. (doi:10.1016/j.cryobiol.2008.02.006)
He, X. & Bischof, J. C. 2003 Quantification of temperature and injury response in thermal therapyand cryosurgery. Crit. Rev. Biomed. Eng. 31, 355–422. (doi:10.1615/CritRevBiomedEng.v31.i56.10)
He, X., Park, E. Y., Fowler, A., Yarmush, M. L. & Toner, M. 2008 Vitrification by ultra-fastcooling at a low concentration of cryoprotectants in a quartz micro-capillary: a study usingmurine embryonic stem cells. Cryobiology 56, 223–232. (doi:10.1016/j.cryobiol.2008.03.005)
Hunt, C. J. & Timmons, P. M. 2007 Cryopreservation of human embryonic stem cell lines. MethodsMol. Biol. 368, 261–270.
Hyttel, P., Vajta, G. & Callesen, H. 2000 Vitrification of bovine oocytes with theopen pulled straw method: ultrastructural consequences. Mol. Reprod. Dev. 56, 80–88.(doi:10.1002/(SICI)1098-2795(200005)56:1<80::AID-MRD10>3.0.CO;2-U)
Isachenko, V., Montag, M., Isachenko, E., Zaeva, V., Krivokharchenko, I., Shafei, R. & van derVen, H. 2005 Aseptic technology of vitrification of human pronuclear oocytes using open-pulledstraws. Hum. Reprod. 20, 492–496. (doi:10.1093/humrep/deh605)
Ishine, N. B., Rubinsky, C. & Lee, Y. 2000 Transplantation of mammalian livers following freezing:vascular damage and functional recovery. Cryobiology 40, 84–89. (doi:10.1006/cryo.1999.2225)
Phil. Trans. R. Soc. A (2010)
on August 25, 2018http://rsta.royalsocietypublishing.org/Downloaded from

580 F. Xu et al.
Jiao, A. J., Han, X., Ma, H. B. & Critser, J. K. 2006 Numerical investigations of transientheat transfer characteristics and vitrification tendencies in ultra-fast cell cooling processes.Cryobiology 52, 386–392. (doi:10.1016/j.cryobiol.2006.01.009)
Kaminski, W. 1990 Hyperbolic heat conduction equation for materials with a nonhomogeneousinner structure. J. Heat Transf. 112, 555–560. (doi:10.1115/1.2910422)
Kandra, D. & Devireddy, R. V. 2008 Numerical simulation of local temperature distortionsduring ice nucleation of cells in suspension. Int. J. Heat Mass Transf. 51, 5655–5661.(doi:10.1016/j.ijheatmasstransfer.2008.04.026)
Karlsson, J. & Toner, M. 1996 Long-term storage of tissues by cryopreservation: critical issues.Biomaterials 2, 243–256. (doi:10.1016/0142-9612(96)85562-1)
Karlsson, J. O. M. & Toner, M. (eds) 2000 Cryopreservation. San Diego, CA: Academic Press.Kashuba Benson, C. M., Benson, J. D. & Critser, J. K. 2008 An improved
cryopreservation method for a mouse embryonic stem cell line. Cryobiology 56, 120–130.(doi:10.1016/j.cryobiol.2007.12.002)
Katkov, I. I. 2002 The point of maximum cell water volume excursion in case of presence of animpermeable solute. Cryobiology 44, 193–203. (doi:10.1016/S0011-2240(02)00029-9)
Khademhosseini, A., Yeh, J., Eng, G., Karp, J., Kaji, H., Borenstein, J., Farokhzad, O. C. &Langer, R. 2005 Cell docking inside microwells within reversibly sealed microfluidic channelsfor fabricating multiphenotype cell arrays. Lab Chip 5, 1380–1386. (doi:10.1039/b508096g)
Kim, M. H., Sasaki, K. & Imai, R. 2009 Cold shock domain protein 3 regulates freezing tolerancein Arabidopsis thaliana. J. Biol. Chem. 284, 23 454–23 460. (doi:10.1074/jbc.M109.025791)
Kim, W. S., Khunajakr, N. & Dunn, N. W. 1998 Effect of cold shock on protein synthesis andon cryotolerance of cells frozen for long periods in Lactococcus lactis. Cryobiology 37, 86–91.(doi:10.1006/cryo.1998.2104)
Kleinhans, F. W. 1998 Membrane permeability modeling: Kedem–Katchalsky vs. a two-parameterformalism. Cryobiology 37, 271–289. (doi:10.1006/cryo.1998.2135)
Körner, C. & Bergmann, H. W. 1998 Physical defects of the hyperbolic heat conduction equation.Appl. Phys. A: Mater. Sci. Process. 67, 397–401. (doi:10.1007/s003390050792)
Lane, M. & Gardner, D. K. 2001 Vitrification of mouse oocytes using a nylon loop. Mol. Reprod.Dev. 58, 342–347. (doi:10.1002/1098-2795(200103)58:3<342::AID-MRD13>3.0.CO;2-X)
Lane, M., Bavister, B. D., Lyons, E. A. & Forest, K. T. 1999 Containerless vitrification ofmammalian oocytes and embryos. Nat. Biotechnol. 17, 1234–1236. (doi:10.1038/70795)
Le Bot, C. & Delaunay, D. 2008 Rapid solidification of indium: modeling subcooling. Mater.Charact. 59, 519–527. (doi:10.1016/j.matchar.2007.03.010)
Li, J. D. 1992 Reduction of core loss in silicon steel sheets by laser processing. Beijing, China:Tsinghua University.
Li, L. Y. 2006 Numerical simulation of mass transfer during the osmotic dehydration of biologicaltissues. Comput. Mater. Sci. 35, 75–83. (doi:10.1016/j.commatsci.2005.03.006)
Lin, S., Gao, D. Y. & Yu, X. C. 1990 Thermal stress induced by water solidification in a cylindertube. J. Heat Transf. 112, 1079–1082. (doi:10.1115/1.2910482)
Ling, Y., Rubin, J., Deng, Y., Huang, C., Demirci, U., Karp, J. M. & Khademhosseini, A. 2007 Acell-laden microfluidic hydrogel. Lab Chip 7, 756–762. (doi:10.1039/b615486g)
Liu, J. & Lu, W. Q. 1997 Dual reciprocity boundary element method for solving thermal wavemodel of bioheat transfer. Space Med. Med. Eng. 10, 391–395.
Ludwig, M., Al-Hasani, S., Felderbaum, R. & Diedrich, K. 1999 New aspects of cryopreservationof oocytes and embryos in assisted reproduction and future perspectives. Hum. Reprod.14(Suppl. 1), 162–185.
Luyet, B. J. & Hodapp, A. 1938 Revival of frog’s spermatozoa vitrified in liquid air. Proc. Soc.Exp. Biol. 39, 433–434.
Martino, A., Songsasen, N. & Leibo, S. P. 1996 Development into blastocysts of bovineoocytes cryopreserved by ultra-rapid cooling. Biol. Reprod. 54, 1059–1069. (doi:10.1095/biolreprod54.5.1059)
Mazur, P. 1963 Kinetics of water loss from cells at subzero temperatures and the likelihood ofintracellular freezing. J. Gen. Physiol. 47, 347–369. (doi:10.1085/jgp.47.2.347)
Phil. Trans. R. Soc. A (2010)
on August 25, 2018http://rsta.royalsocietypublishing.org/Downloaded from

Review. Modelling of cryopreservation 581
Mazur, P. 1984 Freezing of living cells: mechanisms and implications. Am. J. Physiol. 247(3 Pt 1),C125–C142.
Mazur, P., Cole, K. W., Hall, J. W., Schreuders, P. D. & Mahowald, A. P. 1992 Cryobiologicalpreservation of Drosophila embryos. Science 258, 1932–1935. (doi:10.1126/science.1470915)
Mitra, K., Kumar, S., Vedavarz, A. & Moallemi, M. K. 1995 Experimental evidence of hyperbolicheat conduction in processed meat. J. Heat Transf. 117, 568–573. (doi:10.1115/1.2822615)
Morse, P. M. & Feshbach, H. 1953 Methods of theoretical physics. New York, NY: McGraw-Hill.Murua, A., Orive, G., Hernandez, R. M. & Pedraz, J. L. 2009 Cryopreservation based on freezing
protocols for the long-term storage of microencapsulated myoblasts. Biomaterials 30, 3495–3501.(doi:10.1016/j.biomaterials.2009.03.005)
Neidert, M. R., Devireddy, R. V., Tranquillo, R. T. & Bischof, J. C. 2004 Cryopreservation ofcollagen-based tissue equivalents. II. Improved freezing in the presence of cryoprotective agents.Tissue Eng. 10, 23–32. (doi:10.1089/107632704322791664)
Nerem, R. M. 2000 Tissue engineering: confronting the transplantation crisis. Proc. Inst. Mech.Eng. 214, 95–99. (doi:10.1243/0954411001535273)
Ogonuki, N. et al. 2006 Spermatozoa and spermatids retrieved from frozen reproductive organs orfrozen whole bodies of male mice can produce normal offspring. Proc. Natl Acad. Sci. USA 103,13 098–13 103. (doi:10.1073/pnas.0605755103)
Ozisik, M. N. & Tzou, D. Y. 1994 On the wave theory in heat conduction. J. Heat Transf. 116,526–535. (doi:10.1115/1.2910903)
Parkening, T., Tsunoda, Y. & Chang, M. 1976 Effects of various low temperatures, cryoprotectiveagents and cooling rates on the survival, fertilizability and development of frozen-thawed mouseeggs. J. Exp. Zool. 197, 369–374. (doi:10.1002/jez.1401970310)
Pegg, D. E. 1996 Problems in the cryopreservation of tissues and organs. Cryobiology 33, 658–659.Peshkov, V. 1944 Second sound in helium II. J. Phys. 8, 381.Porcu, E., Fabrri, R., Seracchioli, R., Chiotti, P., Magrini, O. & Flamigni, C. 1997 Birth of a
healthy female after intracytoplasmic sperm injection of cryopreserved human oocytes. Fertil.Steril. 68, 724–730. (doi:10.1016/S0015-0282(97)00268-9)
Privalov, P. L. 1990 Cold denaturation of proteins. Crit. Rev. Biochem. Mol. Biol. 25, 281–305.(doi:10.3109/10409239009090612)
Qiu, T. Q. & Tien, C. L. 1992 Short-pulse laser heating on metals. Int. J. Heat Mass Transf. 35,719–726. (doi:10.1016/0017-9310(92)90131-B)
Qiu, T. Q. & Tien, C. L. 1993 Heat transfer mechanisms during short-pulse laser heating of metals.J. Heat Transf. 115, 835–841. (doi:10.1115/1.2911377)
Quintanilla, R. & Racke, R. 2006 A note on stability in dual-phase-lag heat conduction. Int. J.Heat Mass Transf. 49, 1209–1213. (doi:10.1016/j.ijheatmasstransfer.2005.10.016)
Rabin, Y. & Steif, P. S. 1996 Analysis of thermal stresses around cryosurgical probe. Cryobiology33, 276–290. (doi:10.1006/cryo.1996.0028)
Rabin, Y. & Steif, P. S. 1998 Thermal stresses in a freezing sphere and its application to cryobiology.ASME J. Appl. Mech. 65, 328–333.
Ren, H. S., Wei, Y., Hua, T. C. & Zhang, J. 1994 Theoretical prediction of vitrification anddevitrification tendencies for cryoprotective solution. Cryobiology 31, 47–56. (doi:10.1006/cryo.1994.1006)
Richardson, A. W., Imig, C. G., Feucht, B. L. & Hines, H. M. 1950 Relationship between deeptissue temperature and blood flow during electromagnetic irradiation. Arch. Phys. Med. Rehabil.31, 19–25.
Risco, R., Elmoazzen, H., Doughty, M., He, X. & Toner, M. 2007 Thermal performance of quartzcapillaries for vitrification. Cryobiology 55, 222–229. (doi:10.1016/j.cryobiol.2007.08.006)
Roemer, R. B., Oleson, J. R. & Cetas, T. C. 1985 Oscillatory temperature response to constantpower applied to canine muscle. Am. J. Physiol. 249, R153–R158.
Roetzel, W., Putra, N. & Das, S. K. 2003 Experiment and analysis for non-Fourier conductionin materials with non-homogeneous inner structure. Int. J. Thermal Sci. 42, 541–552.(doi:10.1016/S1290-0729(03)00020-6)
Romero-Mendez, R., Franco, W. & Aguilar, G. 2007 Laser-assisted cryosurgery of prostate:numerical study. Phys. Med. Biol. 52, 463–478. (doi:10.1088/0031-9155/52/2/011)
Phil. Trans. R. Soc. A (2010)
on August 25, 2018http://rsta.royalsocietypublishing.org/Downloaded from
582 F. Xu et al.
Rubinsky, B. 1989 The energy equation for freezing of biological tissue. J. Heat Transf. 111,988–996. (doi:10.1115/1.3250815)
Rubinsky, B. 2000 Cryosurgery. Annu. Rev. Biomed. Eng. 2, 157–187. (doi:10.1146/annurev.bioeng.2.1.157)
Rubinsky, B. & Pegg, D. E. 1988 A mathematical model for the freezing process in biological tissue.Proc. R. Soc. Lond. B 234, 343–358. (doi:10.1098/rspb.1988.0053)
Rubinsky, B., Cravalho, E. G. & Mikic, B. 1980 Thermal stress in frozen organs. Cryobiology 17,66–73. (doi:10.1016/0011-2240(80)90009-7)
Song, Y. C., Chen, Z. Z., Mukherjee, N., Lightfoot, F. G., Taylor, M. J., Brockbank, K. G. &Sambanis, A. 2005 Vitrification of tissue engineered pancreatic substitute. Transplant. Proc. 37,253–255. (doi:10.1016/j.transproceed.2004.11.027)
Song, Y. S., Moon, S., Hulli, L., Hasan, S. K., Kayaalp, E. & Demirci, U. 2009 Microfluidics forcryopreservation. Lab Chip 9, 1874–1881. (doi:10.1039/b823062e)
Spencer, J. M. 2004 Cryosurgery for skin cancer. Dermatol. Surg. 30, 1269. (doi:10.1111/j.1524-4725.2004.30391.x)
Stachecki, J. J. & Cohen, J. 2004 An overview of oocyte cryopreservation. Reprod. Biomed. Online9, 152–163.
Sussman, M., Smereka, P. & Osher, S. 1994 A level set approach for computing solutions toincompressible two-phase flow. J. Comput. Phys. 114, 146–159. (doi:10.1006/jcph.1994.1155)
Taitel, Y. 1972 On the parabolic, hyperbolic and discrete formulation of the heat conductionequation. Int. J. Heat Mass Transf. 15, 369–371. (doi:10.1016/0017-9310(72)90085-3)
Tang, D. W. & Araki, N. 1996 The wave characteristics of thermal conduction in metallic filmsirradiated by ultra-short laser pulses. J. Phys. D Appl. Phys. 29, 2527–2533. (doi:10.1088/0022-3727/29/10/001)
Thom, F., Matthes, G., Richter, E. & Hackensellner, H. A. 1983 The ductility of mammalian tissuein dependence on the deformation temperature. Cryo-Lett. 4, 341–348.
Toner, M. 1993 Nucleation of ice crystals inside biological cells. In Advances in low-temperaturebiology (ed. P. Steponkus). London, UK: JAI.
Trelea, I. C., Passot, S., Marin, M. & Fonseca, F. 2009 Model for heat and mass transfer infreeze-drying of pellets. J. Biomech. Eng. 131, 074501. (doi:10.1115/1.3142975)
Tzou, D. Y. 1992 Thermal shock phenomena under high-rate response in solids. In Annual reviewof heat transfer (ed. C. L. Tien), pp. 111–185. Washington, DC: Hemisphere.
Tzou, D. Y. 1993 An engineering assessment to the relaxation time in thermal wave propagation.Int. J. Heat Mass Transf. 36, 1845–1851. (doi:10.1016/S0017-9310(05)80171-1)
Tzou, D. Y. 1995 A unified field approach for heat conduction from macro- to micro-scales. J. HeatTransf. 117, 8–16. (doi:10.1115/1.2822329)
Tzou, D. Y. 1997 Macro- to micro-scale heat transfer: the lagging behavior. Washington, DC: Taylorand Francis.
van den Berg, H., Repping, S. & van der Veen, F. 2007 Parental desire and acceptability ofspermatogonial stem cell cryopreservation in boys with cancer. Hum. Reprod. 22, 594–597.(doi:10.1093/humrep/del375)
Vedavarz, A., Kumar, S. & Moallemi, M. K. 1994 Significance of non-Fourier heat waves inconduction. J. Heat Transf. 116, 221–224. (doi:10.1115/1.2910859)
Vernotte, P. 1958 Les paradoxes de la theorie continue de l’equation de la chaleur. Comp. Rend.246, 3154–3155.
Wang, B., Tchessalov, S., Cicerone, M. T., Warne, N. W. & Pikal, M. J. 2009 Impact of sucrose levelon storage stability of proteins in freeze-dried solids: II. Correlation of aggregation rate withprotein structure and molecular mobility. J. Pharm. Sci. 98, 3145–3166. (doi:10.1002/jps.21622)
Whittingham, D. G., Leibo, S. P. & Mazur, P. 1972 Survival of mouse embryos frozen to −196◦and −269◦C. Science 178, 411–414. (doi:10.1126/science.178.4059.411)
Woods, E. J., Liu, J., Gilmore, J. A., Reid, T. J., Gao, D. Y. & Critser, J. K. 1999 Determinationof human platelet membrane permeability coefficients using the Kedem–Katchalsky formalism:estimates from two- vs. three-parameter fits. Cryobiology 38, 200–208. (doi:10.1006/cryo.1998.2146)
Phil. Trans. R. Soc. A (2010)
on August 25, 2018http://rsta.royalsocietypublishing.org/Downloaded from

Review. Modelling of cryopreservation 583
Xu, F., Seffen, K. A. & Lu, T. J. 2008a Non-Fourier analysis of skin biothermomechanics. Int. J.Heat Mass Transf. 51, 2237–2259. (doi:10.1016/j.ijheatmasstransfer.2007.10.024)
Xu, F., Wen, T., Seffen, K. A. & Lu, T. J. 2008b Biothermomechanics of skin tissue. J. Mech.Phys. Solids 56, 1852–1884. (doi:10.1016/j.jmps.2007.11.011)
Xu, F., Lu, T. J., Seffen, K. A. & Ng, E. Y. K. 2009 Bioheat transfer of skin tissue. Appl. Mech. Rev.62, 050801. (doi:10.1115/1.3124646)
Yang, H. Q. 1991 Non-Fourier effect on heat conduction during welding. Int. J. Heat Mass Transf.34, 2921–2924. (doi:10.1016/0017-9310(91)90252-A)
Yarmush, M. L., Toner, M., Dunn, J. C., Rotem, A., Hubel, A. & Tompkins, R. G. 1992 Hepatictissue engineering. Development of critical technologies. Ann. NY Acad. Sci. 665, 238–252.(doi:10.1111/j.1749-6632.1992.tb42588.x)
Zabaras, N., Ruan, Y. & Richmond, O. 1991 On the calculation of deformations and stresses duringaxially symmetric solidification. ASME J. Appl. Mech. 58, 865–871.
Zhang, A., Xu, L. X., Sandison, G. A. & Zhang, J. 2003 A microscale model for predictionof breast cancer cell damage during cryosurgery. Cryobiology 47, 143–154. (doi:10.1016/j.cryobiol.2003.08.002)
Zhang, A., Xu, L. X., Sandison, G. A. & Cheng, S. 2006 Morphological study of endothelial cellsduring freezing. Phys. Med. Biol. 51, 6047–6060. (doi:10.1088/0031-9155/51/23/007)
Zhmakin, A. I. 2009 Fundamentals of cryobiology: physical phenomena and mathematical models.Berlin, Germany: Springer.
Zhu, X. et al. 2005 Fabrication of reconfigurable protein matrices by cracking. Nat. Mater. 4,403–406. (doi:10.1038/nmat1365)
Phil. Trans. R. Soc. A (2010)
on August 25, 2018http://rsta.royalsocietypublishing.org/Downloaded from