Retirement Date Funds Investment Report -...
12
Retirement Date Funds Investment Report June 30, 2013 Group Retirement Solutions
-
Upload
nguyenmien -
Category
Documents
-
view
215 -
download
0
Transcript of Retirement Date Funds Investment Report -...
Retirement Date Funds Investment ReportJune 30, 2013
Group Retirement Solutions
Retirement Date Funds
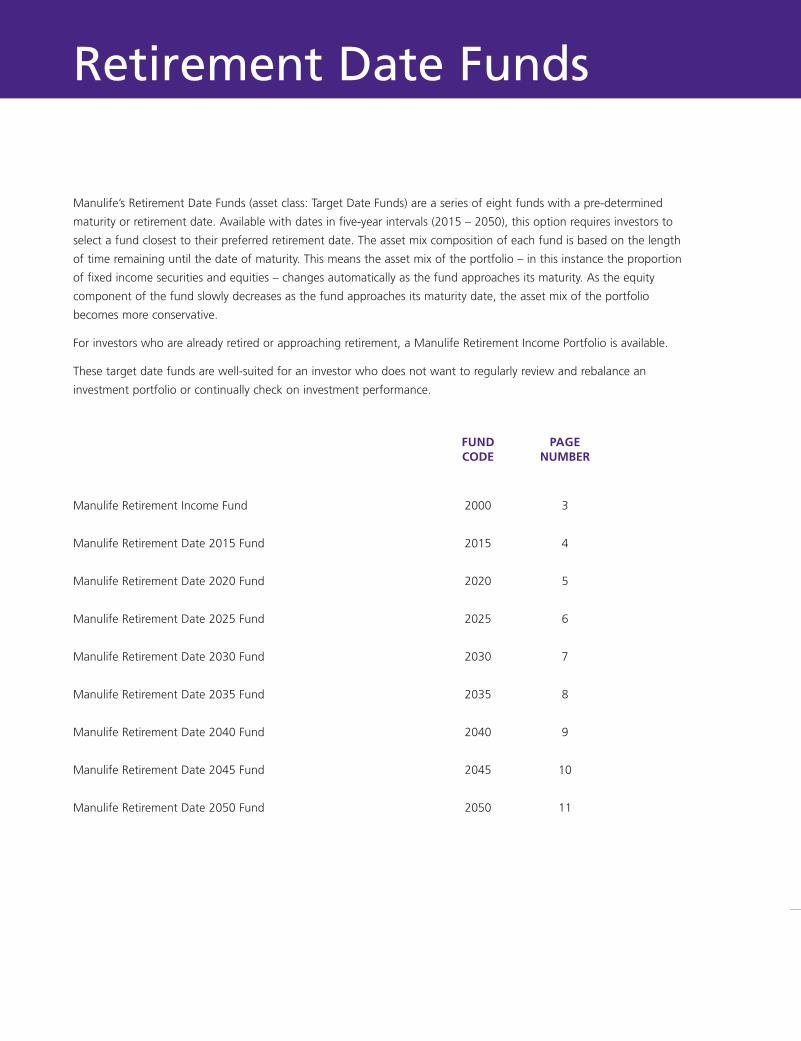
Manulife’s Retirement Date Funds (asset class: Target Date Funds) are a series of eight funds with a pre-determined
maturity or retirement date. Available with dates in five-year intervals (2015 – 2050), this option requires investors to
select a fund closest to their preferred retirement date. The asset mix composition of each fund is based on the length
of time remaining until the date of maturity. This means the asset mix of the portfolio – in this instance the proportion
of fixed income securities and equities – changes automatically as the fund approaches its maturity. As the equity
component of the fund slowly decreases as the fund approaches its maturity date, the asset mix of the portfolio
becomes more conservative.
For investors who are already retired or approaching retirement, a Manulife Retirement Income Portfolio is available.
These target date funds are well-suited for an investor who does not want to regularly review and rebalance an
investment portfolio or continually check on investment performance.
FUND PAGECODE NUMBER
Manulife Retirement Income Fund 2000 3
Manulife Retirement Date 2015 Fund 2015 4
Manulife Retirement Date 2020 Fund 2020 5
Manulife Retirement Date 2025 Fund 2025 6
Manulife Retirement Date 2030 Fund 2030 7
Manulife Retirement Date 2035 Fund 2035 8
Manulife Retirement Date 2040 Fund 2040 9
Manulife Retirement Date 2045 Fund 2045 10
Manulife Retirement Date 2050 Fund 2050 11
Volatility meter
Based on 2 year standard deviation of the Fund
Low (1) High (25)
4
TARGET DATE Code 2000
Manulife Retirement Income Fund
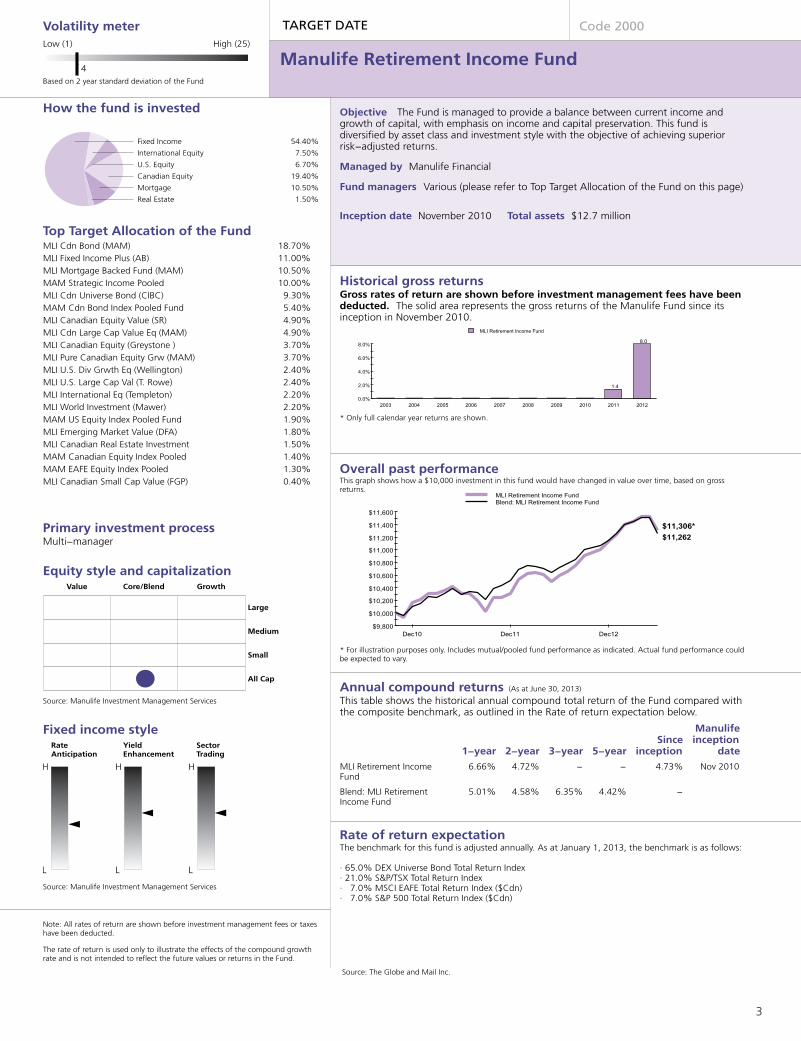
Fixed Income 54.40%
Real Estate 1.50%
International Equity 7.50%
Mortgage 10.50%
U.S. Equity 6.70%
Canadian Equity 19.40%
How the fund is invested
Top Target Allocation of the FundMLI Cdn Bond (MAM) 18.70%MLI Fixed Income Plus (AB) 11.00%MLI Mortgage Backed Fund (MAM) 10.50%MAM Strategic Income Pooled 10.00%MLI Cdn Universe Bond (CIBC) 9.30%MAM Cdn Bond Index Pooled Fund 5.40%MLI Canadian Equity Value (SR) 4.90%MLI Cdn Large Cap Value Eq (MAM) 4.90%MLI Canadian Equity (Greystone ) 3.70%MLI Pure Canadian Equity Grw (MAM) 3.70%MLI U.S. Div Grwth Eq (Wellington) 2.40%MLI U.S. Large Cap Val (T. Rowe) 2.40%MLI International Eq (Templeton) 2.20%MLI World Investment (Mawer) 2.20%MAM US Equity Index Pooled Fund 1.90%MLI Emerging Market Value (DFA) 1.80%MLI Canadian Real Estate Investment 1.50%MAM Canadian Equity Index Pooled 1.40%MAM EAFE Equity Index Pooled 1.30%MLI Canadian Small Cap Value (FGP) 0.40%
Primary investment processMulti−manager
Equity style and capitalization
Source: Manulife Investment Management Services
Fixed income style
Source: Manulife Investment Management Services
Value Core/Blend Growth
Large
Medium
Small
All Cap
RateAnticipation
YieldEnhancement
SectorTrading
Note: All rates of return are shown before investment management fees or taxeshave been deducted.
The rate of return is used only to illustrate the effects of the compound growthrate and is not intended to reflect the future values or returns in the Fund.
Objective The Fund is managed to provide a balance between current income andgrowth of capital, with emphasis on income and capital preservation. This fund isdiversified by asset class and investment style with the objective of achieving superiorrisk−adjusted returns.
Managed by Manulife Financial
Fund managers Various (please refer to Top Target Allocation of the Fund on this page)
Inception date November 2010 Total assets $12.7 million
Historical gross returnsGross rates of return are shown before investment management fees have beendeducted. The solid area represents the gross returns of the Manulife Fund since itsinception in November 2010.
* Only full calendar year returns are shown.
Overall past performanceThis graph shows how a $10,000 investment in this fund would have changed in value over time, based on grossreturns.
* For illustration purposes only. Includes mutual/pooled fund performance as indicated. Actual fund performance couldbe expected to vary.
Annual compound returns (As at June 30, 2013)
This table shows the historical annual compound total return of the Fund compared withthe composite benchmark, as outlined in the Rate of return expectation below.
1−year 2−year 3−year 5−yearSince
inception
Manulifeinception
date
MLI Retirement IncomeFund
6.66% 4.72% − − 4.73% Nov 2010
Blend: MLI RetirementIncome Fund
5.01% 4.58% 6.35% 4.42% −
Rate of return expectation The benchmark for this fund is adjusted annually. As at January 1, 2013, the benchmark is as follows:
· 65.0% DEX Universe Bond Total Return Index· 21.0% S&P/TSX Total Return Index· 7.0% MSCI EAFE Total Return Index ($Cdn)· 7.0% S&P 500 Total Return Index ($Cdn)
Source: The Globe and Mail Inc.
3
Volatility meter
Based on 3 year standard deviation of the Fund
Low (1) High (25)
4
TARGET DATE Code 2015
Manulife Retirement Date 2015 Fund
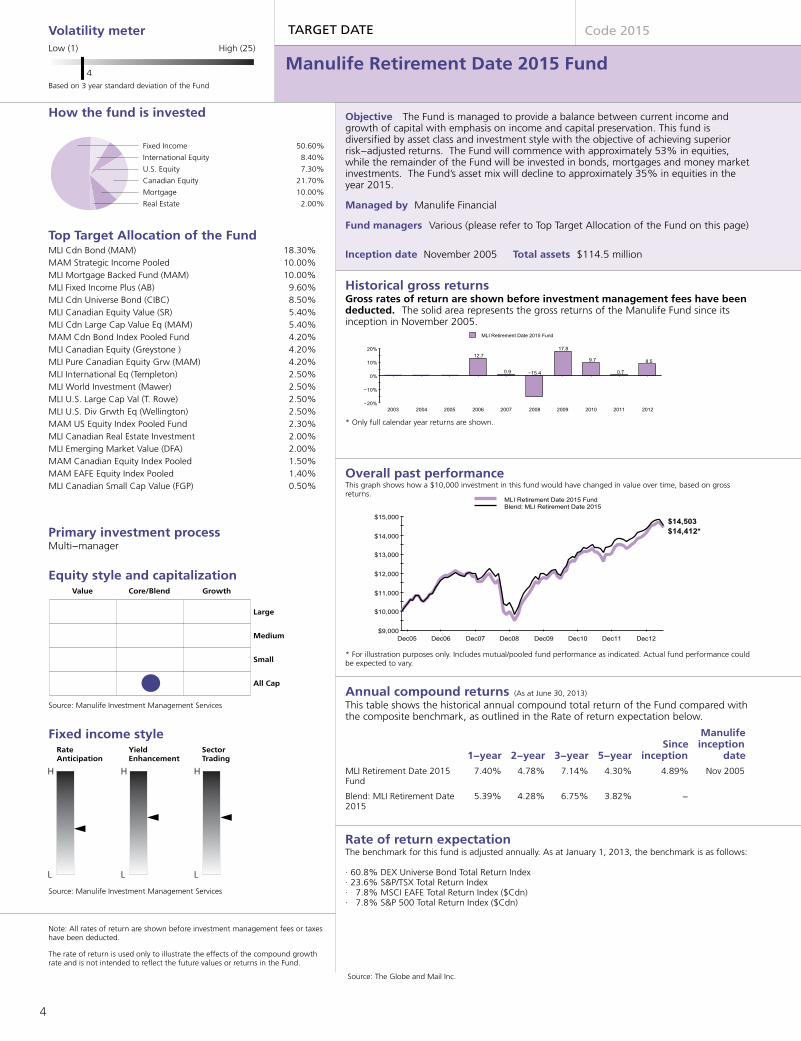
Fixed Income 50.60%
Real Estate 2.00%
International Equity 8.40%
Mortgage 10.00%
U.S. Equity 7.30%
Canadian Equity 21.70%
How the fund is invested
Top Target Allocation of the FundMLI Cdn Bond (MAM) 18.30%MAM Strategic Income Pooled 10.00%MLI Mortgage Backed Fund (MAM) 10.00%MLI Fixed Income Plus (AB) 9.60%MLI Cdn Universe Bond (CIBC) 8.50%MLI Canadian Equity Value (SR) 5.40%MLI Cdn Large Cap Value Eq (MAM) 5.40%MAM Cdn Bond Index Pooled Fund 4.20%MLI Canadian Equity (Greystone ) 4.20%MLI Pure Canadian Equity Grw (MAM) 4.20%MLI International Eq (Templeton) 2.50%MLI World Investment (Mawer) 2.50%MLI U.S. Large Cap Val (T. Rowe) 2.50%MLI U.S. Div Grwth Eq (Wellington) 2.50%MAM US Equity Index Pooled Fund 2.30%MLI Canadian Real Estate Investment 2.00%MLI Emerging Market Value (DFA) 2.00%MAM Canadian Equity Index Pooled 1.50%MAM EAFE Equity Index Pooled 1.40%MLI Canadian Small Cap Value (FGP) 0.50%
Primary investment processMulti−manager
Equity style and capitalization
Source: Manulife Investment Management Services
Fixed income style
Source: Manulife Investment Management Services
Value Core/Blend Growth
Large
Medium
Small
All Cap
RateAnticipation
YieldEnhancement
SectorTrading
Note: All rates of return are shown before investment management fees or taxeshave been deducted.
The rate of return is used only to illustrate the effects of the compound growthrate and is not intended to reflect the future values or returns in the Fund.
Objective The Fund is managed to provide a balance between current income andgrowth of capital with emphasis on income and capital preservation. This fund isdiversified by asset class and investment style with the objective of achieving superiorrisk−adjusted returns. The Fund will commence with approximately 53% in equities,while the remainder of the Fund will be invested in bonds, mortgages and money marketinvestments. The Fund’s asset mix will decline to approximately 35% in equities in theyear 2015.
Managed by Manulife Financial
Fund managers Various (please refer to Top Target Allocation of the Fund on this page)
Inception date November 2005 Total assets $114.5 million
Historical gross returnsGross rates of return are shown before investment management fees have beendeducted. The solid area represents the gross returns of the Manulife Fund since itsinception in November 2005.
* Only full calendar year returns are shown.
Overall past performanceThis graph shows how a $10,000 investment in this fund would have changed in value over time, based on grossreturns.
* For illustration purposes only. Includes mutual/pooled fund performance as indicated. Actual fund performance couldbe expected to vary.
Annual compound returns (As at June 30, 2013)
This table shows the historical annual compound total return of the Fund compared withthe composite benchmark, as outlined in the Rate of return expectation below.
1−year 2−year 3−year 5−yearSince
inception
Manulifeinception
date
MLI Retirement Date 2015Fund
7.40% 4.78% 7.14% 4.30% 4.89% Nov 2005
Blend: MLI Retirement Date2015
5.39% 4.28% 6.75% 3.82% −
Rate of return expectation The benchmark for this fund is adjusted annually. As at January 1, 2013, the benchmark is as follows:
· 60.8% DEX Universe Bond Total Return Index· 23.6% S&P/TSX Total Return Index· 7.8% MSCI EAFE Total Return Index ($Cdn)· 7.8% S&P 500 Total Return Index ($Cdn)
Source: The Globe and Mail Inc.
4

Volatility meter
Based on 3 year standard deviation of the Fund
Low (1) High (25)
5
TARGET DATE Code 2020
Manulife Retirement Date 2020 Fund
U.S. Equity 9.30%
Real Estate 2.70%
Mortgage 8.30%
International Equity 10.20%
Fixed Income 43.00%
Canadian Equity 26.50%
How the fund is invested
Top Target Allocation of the FundMLI Cdn Bond (MAM) 14.90%MAM Strategic Income Pooled 10.00%MLI Mortgage Backed Fund (MAM) 8.30%MLI Fixed Income Plus (AB) 7.70%MLI Cdn Universe Bond (CIBC) 6.90%MLI Canadian Equity Value (SR) 6.40%MLI Cdn Large Cap Value Eq (MAM) 6.40%MLI Canadian Equity (Greystone ) 5.10%MLI Pure Canadian Equity Grw (MAM) 5.10%MAM Cdn Bond Index Pooled Fund 3.50%MLI U.S. Div Grwth Eq (Wellington) 3.30%MLI U.S. Large Cap Val (T. Rowe) 3.30%MLI International Eq (Templeton) 3.10%MLI World Investment (Mawer) 3.10%MAM US Equity Index Pooled Fund 2.70%MLI Canadian Real Estate Investment 2.70%MLI Emerging Market Value (DFA) 2.40%MAM Canadian Equity Index Pooled 1.70%MAM EAFE Equity Index Pooled 1.60%MLI Canadian Small Cap Value (FGP) 0.90%
Primary investment processMulti−manager
Equity style and capitalization
Source: Manulife Investment Management Services
Fixed income style
Source: Manulife Investment Management Services
Value Core/Blend Growth
Large
Medium
Small
All Cap
RateAnticipation
YieldEnhancement
SectorTrading
Note: All rates of return are shown before investment management fees or taxeshave been deducted.
The rate of return is used only to illustrate the effects of the compound growthrate and is not intended to reflect the future values or returns in the Fund.
Objective The Fund is managed to provide a balance between current income andgrowth of capital, with emphasis on income and capital preservation. This fund isdiversified by asset class and investment style with the objective of achieving superiorrisk−adjusted returns. The Fund will commence with approximately 66% in equities,while the remainder of the Fund will be invested in fixed income, mortgages and moneymarket investments. The Fund’s asset mix will decline to approximately 35% in equities inthe year 2020.
Managed by Manulife Financial
Fund managers Various (please refer to Top Target Allocation of the Fund on this page)
Inception date November 2005 Total assets $200.9 million
Historical gross returnsGross rates of return are shown before investment management fees have beendeducted. The solid area represents the gross returns of the Manulife Fund since itsinception in November 2005.
* Only full calendar year returns are shown.
Overall past performanceThis graph shows how a $10,000 investment in this fund would have changed in value over time, based on grossreturns.
* For illustration purposes only. Includes mutual/pooled fund performance as indicated. Actual fund performance couldbe expected to vary.
Annual compound returns (As at June 30, 2013)
This table shows the historical annual compound total return of the Fund compared withthe composite benchmark, as outlined in the Rate of return expectation below.
1−year 2−year 3−year 5−yearSince
inception
Manulifeinception
date
MLI Retirement Date 2020Fund
8.96% 4.74% 7.75% 3.95% 4.83% Nov 2005
Blend: MLI Retirement Date2020
6.79% 4.14% 7.34% 3.36% −
Rate of return expectation The benchmark for this fund is adjusted annually. As at January 1, 2013, the benchmark is as follows:
· 51.4% DEX Universe Bond Total Return Index· 29.2% S&P/TSX Total Return Index· 9.7% MSCI EAFE Total Return Index ($Cdn)· 9.7% S&P 500 Total Return Index ($Cdn)
Source: The Globe and Mail Inc.
5

Volatility meter
Based on 3 year standard deviation of the Fund
Low (1) High (25)
7
TARGET DATE Code 2025
Manulife Retirement Date 2025 Fund
U.S. Equity 11.60%
International Equity 12.70%
Mortgage 5.90%
Real Estate 3.50%
Fixed Income 33.20%
Canadian Equity 33.10%
How the fund is invested
Top Target Allocation of the FundMLI Cdn Bond (MAM) 10.20%MAM Strategic Income Pooled 10.00%MLI Canadian Equity Value (SR) 7.60%MLI Cdn Large Cap Value Eq (MAM) 7.60%MLI Canadian Equity (Greystone ) 6.30%MLI Pure Canadian Equity Grw (MAM) 6.30%MLI Mortgage Backed Fund (MAM) 5.90%MLI Fixed Income Plus (AB) 5.30%MLI Cdn Universe Bond (CIBC) 4.80%MLI U.S. Div Grwth Eq (Wellington) 4.30%MLI U.S. Large Cap Val (T. Rowe) 4.30%MLI International Eq (Templeton) 3.90%MLI World Investment (Mawer) 3.90%MLI Canadian Real Estate Investment 3.50%MAM US Equity Index Pooled Fund 3.00%MLI Emerging Market Value (DFA) 3.00%MAM Cdn Bond Index Pooled Fund 2.90%MAM Canadian Equity Index Pooled 2.10%MAM EAFE Equity Index Pooled 1.90%MLI Canadian Small Cap Value (FGP) 1.60%
Primary investment processMulti−manager
Equity style and capitalization
Source: Manulife Investment Management Services
Fixed income style
Source: Manulife Investment Management Services
Value Core/Blend Growth
Large
Medium
Small
All Cap
RateAnticipation
YieldEnhancement
SectorTrading
Note: All rates of return are shown before investment management fees or taxeshave been deducted.
The rate of return is used only to illustrate the effects of the compound growthrate and is not intended to reflect the future values or returns in the Fund.
Objective The Fund is managed to provide a balance between current income andgrowth of capital, with emphasis on growth of capital. This fund is diversified by assetclass and investment style with the objective of achieving superior risk−adjusted returns.The Fund will commence with approximately 77% in equities, while the remainder of theFund will be invested in fixed income, mortgages and money market investments. TheFund’s asset mix will decline to approximately 35% in equity investments in the year2025.
Managed by Manulife Financial
Fund managers Various (please refer to Top Target Allocation of the Fund on this page)
Inception date November 2005 Total assets $228.7 million
Historical gross returnsGross rates of return are shown before investment management fees have beendeducted. The solid area represents the gross returns of the Manulife Fund since itsinception in November 2005.
* Only full calendar year returns are shown.
Overall past performanceThis graph shows how a $10,000 investment in this fund would have changed in value over time, based on grossreturns.
* For illustration purposes only. Includes mutual/pooled fund performance as indicated. Actual fund performance couldbe expected to vary.
Annual compound returns (As at June 30, 2013)
This table shows the historical annual compound total return of the Fund compared withthe composite benchmark, as outlined in the Rate of return expectation below.
1−year 2−year 3−year 5−yearSince
inception
Manulifeinception
date
MLI Retirement Date 2025Fund
10.94% 4.70% 8.42% 3.66% 4.82% Nov 2005
Blend: MLI Retirement Date2025
8.59% 3.98% 7.81% 2.80% −
Rate of return expectation The benchmark for this fund is adjusted annually. As at January 1, 2013, the benchmark is as follows:
· 39.2% DEX Universe Bond Total Return Index· 36.4% S&P/TSX Total Return Index· 12.2% MSCI EAFE Total Return Index ($Cdn)· 12.2% S&P 500 Total Return Index ($Cdn)
Source: The Globe and Mail Inc.
6
Volatility meter
Based on 3 year standard deviation of the Fund
Low (1) High (25)
8
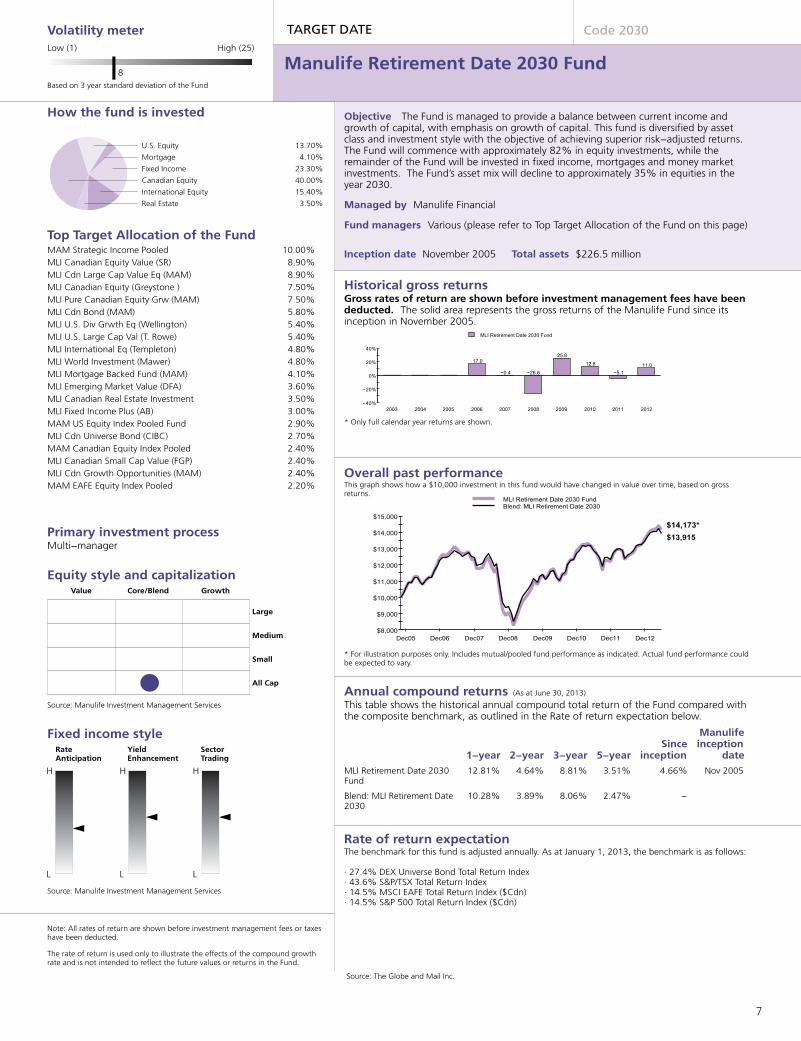
TARGET DATE Code 2030
Manulife Retirement Date 2030 Fund
U.S. Equity 13.70%
Real Estate 3.50%
Mortgage 4.10%
International Equity 15.40%
Fixed Income 23.30%
Canadian Equity 40.00%
How the fund is invested
Top Target Allocation of the FundMAM Strategic Income Pooled 10.00%MLI Canadian Equity Value (SR) 8.90%MLI Cdn Large Cap Value Eq (MAM) 8.90%MLI Canadian Equity (Greystone ) 7.50%MLI Pure Canadian Equity Grw (MAM) 7.50%MLI Cdn Bond (MAM) 5.80%MLI U.S. Div Grwth Eq (Wellington) 5.40%MLI U.S. Large Cap Val (T. Rowe) 5.40%MLI International Eq (Templeton) 4.80%MLI World Investment (Mawer) 4.80%MLI Mortgage Backed Fund (MAM) 4.10%MLI Emerging Market Value (DFA) 3.60%MLI Canadian Real Estate Investment 3.50%MLI Fixed Income Plus (AB) 3.00%MAM US Equity Index Pooled Fund 2.90%MLI Cdn Universe Bond (CIBC) 2.70%MAM Canadian Equity Index Pooled 2.40%MLI Canadian Small Cap Value (FGP) 2.40%MLI Cdn Growth Opportunities (MAM) 2.40%MAM EAFE Equity Index Pooled 2.20%
Primary investment processMulti−manager
Equity style and capitalization
Source: Manulife Investment Management Services
Fixed income style
Source: Manulife Investment Management Services
Value Core/Blend Growth
Large
Medium
Small
All Cap
RateAnticipation
YieldEnhancement
SectorTrading
Note: All rates of return are shown before investment management fees or taxeshave been deducted.
The rate of return is used only to illustrate the effects of the compound growthrate and is not intended to reflect the future values or returns in the Fund.
Objective The Fund is managed to provide a balance between current income andgrowth of capital, with emphasis on growth of capital. This fund is diversified by assetclass and investment style with the objective of achieving superior risk−adjusted returns.The Fund will commence with approximately 82% in equity investments, while theremainder of the Fund will be invested in fixed income, mortgages and money marketinvestments. The Fund’s asset mix will decline to approximately 35% in equities in theyear 2030.
Managed by Manulife Financial
Fund managers Various (please refer to Top Target Allocation of the Fund on this page)
Inception date November 2005 Total assets $226.5 million
Historical gross returnsGross rates of return are shown before investment management fees have beendeducted. The solid area represents the gross returns of the Manulife Fund since itsinception in November 2005.
* Only full calendar year returns are shown.
Overall past performanceThis graph shows how a $10,000 investment in this fund would have changed in value over time, based on grossreturns.
* For illustration purposes only. Includes mutual/pooled fund performance as indicated. Actual fund performance couldbe expected to vary.
Annual compound returns (As at June 30, 2013)
This table shows the historical annual compound total return of the Fund compared withthe composite benchmark, as outlined in the Rate of return expectation below.
1−year 2−year 3−year 5−yearSince
inception
Manulifeinception
date
MLI Retirement Date 2030Fund
12.81% 4.64% 8.81% 3.51% 4.66% Nov 2005
Blend: MLI Retirement Date2030
10.28% 3.89% 8.06% 2.47% −
Rate of return expectation The benchmark for this fund is adjusted annually. As at January 1, 2013, the benchmark is as follows:
· 27.4% DEX Universe Bond Total Return Index· 43.6% S&P/TSX Total Return Index· 14.5% MSCI EAFE Total Return Index ($Cdn)· 14.5% S&P 500 Total Return Index ($Cdn)
Source: The Globe and Mail Inc.
7

Volatility meter
Based on 3 year standard deviation of the Fund
Low (1) High (25)
9
TARGET DATE Code 2035
Manulife Retirement Date 2035 Fund
U.S. Equity 15.00%
Mortgage 3.00%
Real Estate 3.50%
International Equity 17.00%
Fixed Income 17.10%
Canadian Equity 44.40%
How the fund is invested
Top Target Allocation of the FundMAM Strategic Income Pooled 10.00%MLI Canadian Equity Value (SR) 9.60%MLI Cdn Large Cap Value Eq (MAM) 9.60%MLI Canadian Equity (Greystone ) 8.30%MLI Pure Canadian Equity Grw (MAM) 8.30%MLI U.S. Div Grwth Eq (Wellington) 6.10%MLI U.S. Large Cap Val (T. Rowe) 6.10%MLI International Eq (Templeton) 5.30%MLI World Investment (Mawer) 5.30%MLI Emerging Market Value (DFA) 4.00%MLI Canadian Real Estate Investment 3.50%MLI Canadian Small Cap Value (FGP) 3.00%MLI Cdn Bond (MAM) 3.00%MLI Cdn Growth Opportunities (MAM) 3.00%MLI Mortgage Backed Fund (MAM) 3.00%MAM US Equity Index Pooled Fund 2.80%MAM Canadian Equity Index Pooled 2.60%MAM EAFE Equity Index Pooled 2.40%MLI Fixed Income Plus (AB) 1.60%MLI Cdn Universe Bond (CIBC) 1.40%
Primary investment processMulti−manager
Equity style and capitalization
Source: Manulife Investment Management Services
Fixed income style
Source: Manulife Investment Management Services
Value Core/Blend Growth
Large
Medium
Small
All Cap
RateAnticipation
YieldEnhancement
SectorTrading
Note: All rates of return are shown before investment management fees or taxeshave been deducted.
The rate of return is used only to illustrate the effects of the compound growthrate and is not intended to reflect the future values or returns in the Fund.
Objective The Fund is managed to provide a balance between current income andgrowth of capital, with emphasis on growth of capital. This fund is diversified by assetclass and investment style with the objective of achieving superior risk−adjusted returns.The Fund will commence with approximately 84% in equities, while the remainder of theFund will be invested in fixed income, mortgages and money market investments. TheFund’s asset mix will gradually decline to approximately 35% in equities in the year 2035.
Managed by Manulife Financial
Fund managers Various (please refer to Top Target Allocation of the Fund on this page)
Inception date November 2005 Total assets $196.5 million
Historical gross returnsGross rates of return are shown before investment management fees have beendeducted. The solid area represents the gross returns of the Manulife Fund since itsinception in November 2005.
* Only full calendar year returns are shown.
Overall past performanceThis graph shows how a $10,000 investment in this fund would have changed in value over time, based on grossreturns.
* For illustration purposes only. Includes mutual/pooled fund performance as indicated. Actual fund performance couldbe expected to vary.
Annual compound returns (As at June 30, 2013)
This table shows the historical annual compound total return of the Fund compared withthe composite benchmark, as outlined in the Rate of return expectation below.
1−year 2−year 3−year 5−yearSince
inception
Manulifeinception
date
MLI Retirement Date 2035Fund
13.90% 4.74% 9.05% 3.51% 4.70% Nov 2005
Blend: MLI Retirement Date2035
11.30% 3.92% 8.23% 2.40% −
Rate of return expectation The benchmark for this fund is adjusted annually. As at January 1, 2013, the benchmark is as follows:
· 20.0% DEX Universe Bond Total Return Index· 48.0% S&P/TSX Total Return Index· 16.0% MSCI EAFE Total Return Index ($Cdn)· 16.0% S&P 500 Total Return Index ($Cdn)
Source: The Globe and Mail Inc.
8

Volatility meter
Based on 3 year standard deviation of the Fund
Low (1) High (25)
9
TARGET DATE Code 2040
Manulife Retirement Date 2040 Fund
Fixed Income 14.30%
Mortgage 2.50%
Real Estate 3.70%
U.S. Equity 15.60%
International Equity 17.70%
Canadian Equity 46.20%
How the fund is invested
Top Target Allocation of the FundMLI Canadian Equity Value (SR) 10.10%MLI Cdn Large Cap Value Eq (MAM) 10.10%MLI Canadian Equity (Greystone ) 8.50%MLI Pure Canadian Equity Grw (MAM) 8.50%MAM Strategic Income Pooled 8.40%MLI U.S. Div Grwth Eq (Wellington) 6.40%MLI U.S. Large Cap Val (T. Rowe) 6.40%MLI International Eq (Templeton) 5.50%MLI World Investment (Mawer) 5.50%MLI Emerging Market Value (DFA) 4.20%MLI Canadian Real Estate Investment 3.70%MLI Canadian Small Cap Value (FGP) 3.20%MLI Cdn Growth Opportunities (MAM) 3.20%MAM US Equity Index Pooled Fund 2.80%MAM Canadian Equity Index Pooled 2.60%MAM EAFE Equity Index Pooled 2.50%MLI Mortgage Backed Fund (MAM) 2.50%MLI Cdn Bond (MAM) 2.50%MLI Fixed Income Plus (AB) 1.30%MLI Cdn Universe Bond (CIBC) 1.20%
Primary investment processMulti−manager
Equity style and capitalization
Source: Manulife Investment Management Services
Fixed income style
Source: Manulife Investment Management Services
Value Core/Blend Growth
Large
Medium
Small
All Cap
RateAnticipation
YieldEnhancement
SectorTrading
Note: All rates of return are shown before investment management fees or taxeshave been deducted.
The rate of return is used only to illustrate the effects of the compound growthrate and is not intended to reflect the future values or returns in the Fund.
Objective The Fund is managed to provide a balance between current income andgrowth of capital, with emphasis on growth of capital. This fund is diversified by assetclass and investment style with the objective of achieving superior risk−adjusted returns.The Fund will commence with approximately 85% in equities, while the remainder of theFund will be invested in fixed income, mortgages and money market investments. TheFund’s asset mix will gradually decline to approximately 35% in equities in the year 2040.
Managed by Manulife Financial
Fund managers Various (please refer to Top Target Allocation of the Fund on this page)
Inception date November 2005 Total assets $161.2 million
Historical gross returnsGross rates of return are shown before investment management fees have beendeducted. The solid area represents the gross returns of the Manulife Fund since itsinception in November 2005.
* Only full calendar year returns are shown.
Overall past performanceThis graph shows how a $10,000 investment in this fund would have changed in value over time, based on grossreturns.
* For illustration purposes only. Includes mutual/pooled fund performance as indicated. Actual fund performance couldbe expected to vary.
Annual compound returns (As at June 30, 2013)
This table shows the historical annual compound total return of the Fund compared withthe composite benchmark, as outlined in the Rate of return expectation below.
1−year 2−year 3−year 5−yearSince
inception
Manulifeinception
date
MLI Retirement Date 2040Fund
14.28% 4.78% 9.15% 3.49% 4.66% Nov 2005
Blend: MLI Retirement Date2040
11.71% 3.93% 8.33% 2.32% −
Rate of return expectation The benchmark for this fund is adjusted annually. As at January 1, 2013, the benchmark is as follows:
· 16.8% DEX Universe Bond Total Return Index· 50.0% S&P/TSX Total Return Index· 16.6% MSCI EAFE Total Return Index ($Cdn)· 16.6% S&P 500 Total Return Index ($Cdn)
Source: The Globe and Mail Inc.
9
Volatility meter
Based on 3 year standard deviation of the Fund
Low (1) High (25)
9
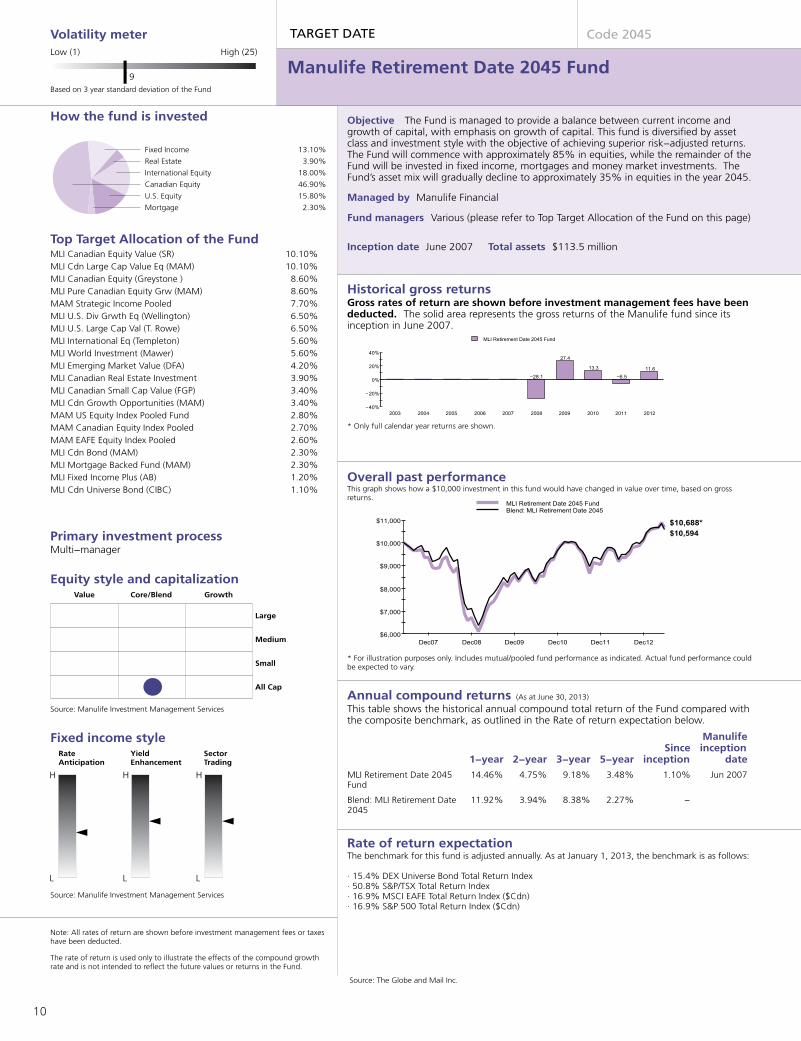
TARGET DATE Code 2045
Manulife Retirement Date 2045 Fund
Fixed Income 13.10%
Mortgage 2.30%
Real Estate 3.90%
U.S. Equity 15.80%
International Equity 18.00%
Canadian Equity 46.90%
How the fund is invested
Top Target Allocation of the FundMLI Canadian Equity Value (SR) 10.10%MLI Cdn Large Cap Value Eq (MAM) 10.10%MLI Canadian Equity (Greystone ) 8.60%MLI Pure Canadian Equity Grw (MAM) 8.60%MAM Strategic Income Pooled 7.70%MLI U.S. Div Grwth Eq (Wellington) 6.50%MLI U.S. Large Cap Val (T. Rowe) 6.50%MLI International Eq (Templeton) 5.60%MLI World Investment (Mawer) 5.60%MLI Emerging Market Value (DFA) 4.20%MLI Canadian Real Estate Investment 3.90%MLI Canadian Small Cap Value (FGP) 3.40%MLI Cdn Growth Opportunities (MAM) 3.40%MAM US Equity Index Pooled Fund 2.80%MAM Canadian Equity Index Pooled 2.70%MAM EAFE Equity Index Pooled 2.60%MLI Cdn Bond (MAM) 2.30%MLI Mortgage Backed Fund (MAM) 2.30%MLI Fixed Income Plus (AB) 1.20%MLI Cdn Universe Bond (CIBC) 1.10%
Primary investment processMulti−manager
Equity style and capitalization
Source: Manulife Investment Management Services
Fixed income style
Source: Manulife Investment Management Services
Value Core/Blend Growth
Large
Medium
Small
All Cap
RateAnticipation
YieldEnhancement
SectorTrading
Note: All rates of return are shown before investment management fees or taxeshave been deducted.
The rate of return is used only to illustrate the effects of the compound growthrate and is not intended to reflect the future values or returns in the Fund.
Objective The Fund is managed to provide a balance between current income andgrowth of capital, with emphasis on growth of capital. This fund is diversified by assetclass and investment style with the objective of achieving superior risk−adjusted returns.The Fund will commence with approximately 85% in equities, while the remainder of theFund will be invested in fixed income, mortgages and money market investments. TheFund’s asset mix will gradually decline to approximately 35% in equities in the year 2045.
Managed by Manulife Financial
Fund managers Various (please refer to Top Target Allocation of the Fund on this page)
Inception date June 2007 Total assets $113.5 million
Historical gross returnsGross rates of return are shown before investment management fees have beendeducted. The solid area represents the gross returns of the Manulife fund since itsinception in June 2007.
* Only full calendar year returns are shown.
Overall past performanceThis graph shows how a $10,000 investment in this fund would have changed in value over time, based on grossreturns.
* For illustration purposes only. Includes mutual/pooled fund performance as indicated. Actual fund performance couldbe expected to vary.
Annual compound returns (As at June 30, 2013)
This table shows the historical annual compound total return of the Fund compared withthe composite benchmark, as outlined in the Rate of return expectation below.
1−year 2−year 3−year 5−yearSince
inception
Manulifeinception
date
MLI Retirement Date 2045Fund
14.46% 4.75% 9.18% 3.48% 1.10% Jun 2007
Blend: MLI Retirement Date2045
11.92% 3.94% 8.38% 2.27% −
Rate of return expectation The benchmark for this fund is adjusted annually. As at January 1, 2013, the benchmark is as follows:
· 15.4% DEX Universe Bond Total Return Index· 50.8% S&P/TSX Total Return Index· 16.9% MSCI EAFE Total Return Index ($Cdn)· 16.9% S&P 500 Total Return Index ($Cdn)
Source: The Globe and Mail Inc.
10

Volatility meter
Based on 3 year standard deviation of the Fund
Low (1) High (25)
9
TARGET DATE Code 2050
Manulife Retirement Date 2050 Fund
Fixed Income 12.20%
Mortgage 2.20%
Real Estate 3.90%
U.S. Equity 16.10%
International Equity 18.30%
Canadian Equity 47.30%
How the fund is invested
Top Target Allocation of the FundMLI Canadian Equity Value (SR) 10.20%MLI Cdn Large Cap Value Eq (MAM) 10.20%MLI Canadian Equity (Greystone ) 8.70%MLI Pure Canadian Equity Grw (MAM) 8.70%MAM Strategic Income Pooled 7.20%MLI U.S. Div Grwth Eq (Wellington) 6.60%MLI U.S. Large Cap Val (T. Rowe) 6.60%MLI International Eq (Templeton) 5.70%MLI World Investment (Mawer) 5.70%MLI Emerging Market Value (DFA) 4.30%MLI Canadian Real Estate Investment 3.90%MLI Canadian Small Cap Value (FGP) 3.40%MLI Cdn Growth Opportunities (MAM) 3.40%MAM US Equity Index Pooled Fund 2.90%MAM Canadian Equity Index Pooled 2.70%MAM EAFE Equity Index Pooled 2.60%MLI Mortgage Backed Fund (MAM) 2.20%MLI Cdn Bond (MAM) 2.10%MLI Fixed Income Plus (AB) 1.10%MLI Cdn Universe Bond (CIBC) 1.00%
Primary investment processMulti−manager
Equity style and capitalization
Source: Manulife Investment Management Services
Fixed income style
Source: Manulife Investment Management Services
Value Core/Blend Growth
Large
Medium
Small
All Cap
RateAnticipation
YieldEnhancement
SectorTrading
Note: All rates of return are shown before investment management fees or taxeshave been deducted.
The rate of return is used only to illustrate the effects of the compound growthrate and is not intended to reflect the future values or returns in the Fund.
Objective The Fund is managed to provide a balance between current income andgrowth of capital, with emphasis on growth of capital. This fund is diversified by assetclass and investment style with the objective of achieving superior risk−adjusted returns.The Fund will commence with approximately 85% in equities, while the remainder of theFund will be invested in fixed income, mortgages and money market investments. TheFund’s asset mix will gradually decline to approximately 35% in equities in the year 2050.
Managed by Manulife Financial
Fund managers Various (please refer to Top Target Allocation of the Fund on this page)
Inception date June 2007 Total assets $89.8 million
Historical gross returnsGross rates of return are shown before investment management fees have beendeducted. The solid area represents the gross returns of the Manulife fund since itsinception in June 2007.
* Only full calendar year returns are shown.
Overall past performanceThis graph shows how a $10,000 investment in this fund would have changed in value over time, based on grossreturns.
* For illustration purposes only. Includes mutual/pooled fund performance as indicated. Actual fund performance couldbe expected to vary.
Annual compound returns (As at June 30, 2013)
This table shows the historical annual compound total return of the Fund compared withthe composite benchmark, as outlined in the Rate of return expectation below.
1−year 2−year 3−year 5−yearSince
inception
Manulifeinception
date
MLI Retirement Date 2050Fund
14.59% 4.71% 9.20% 3.42% 1.02% Jun 2007
Blend: MLI Retirement Date2050
12.07% 3.92% 8.42% 2.23% −
Rate of return expectation The benchmark for this fund is adjusted annually. As at January 1, 2013, the benchmark is as follows:
· 14.4% DEX Universe Bond Total Return Index· 51.4% S&P/TSX Total Return Index· 17.1% MSCI EAFE Total Return Index ($Cdn)· 17.1% S&P 500 Total Return Index ($Cdn)
Source: The Globe and Mail Inc.
11

Available 24 hours a day, 7 days a week at www.manulife.ca/GRO
Manulife, Manulife Financial, the Manulife Financial For Your Future logo, the Block Design, the Four Cubes Design, and strong reliable trustworthy forward-thinking are trademarks of The Manufacturers Life Insurance Company and are used by it, and by its affiliates under license.
GP5030E 0 6/2013
You need your customer number and your personal identification number (PIN) to access this service. If you
need a PIN, or have forgotten it, call toll-free 1-888-727-7766 and press '0' to speak with a Customer Service
Representative.
A secure website designed to help you.