Retail Sweep Programs and Bank Reserves, 1994-1999
40
WORKING PAPER SERIES Retail Sweep Programs and Bank Reserves, 1994--1999 Richard G. Anderson and Robert H. Rasche Working Paper 2000-023A http://research.stlouisfed.org/wp/2000/2000-023.pdf PUBLISHED: Federal Reserve Bank of St. Louis Review, 83(1), January/February 2001, pp. 51-72. FEDERAL RESERVE BANK OF ST. LOUIS Research Division 411 Locust Street St. Louis, MO 63102 ______________________________________________________________________________________ The views expressed are those of the individual authors and do not necessarily reflect official positions of the Federal Reserve Bank of St. Louis, the Federal Reserve System, or the Board of Governors. Federal Reserve Bank of St. Louis Working Papers are preliminary materials circulated to stimulate discussion and critical comment. References in publications to Federal Reserve Bank of St. Louis Working Papers (other than an acknowledgment that the writer has had access to unpublished material) should be cleared with the author or authors. Photo courtesy of The Gateway Arch, St. Louis, MO. www.gatewayarch.com
Transcript of Retail Sweep Programs and Bank Reserves, 1994-1999

WORKING PAPER SERIES
Retail Sweep Programs and Bank Reserves, 1994--1999
Richard G. Anderson and Robert H. Rasche
Working Paper 2000-023Ahttp://research.stlouisfed.org/wp/2000/2000-023.pdf
PUBLISHED: Federal Reserve Bank of St. Louis Review, 83(1), January/February 2001, pp. 51-72.
FEDERAL RESERVE BANK OF ST. LOUISResearch Division411 Locust Street
St. Louis, MO 63102
______________________________________________________________________________________
The views expressed are those of the individual authors and do not necessarily reflect official positions ofthe Federal Reserve Bank of St. Louis, the Federal Reserve System, or the Board of Governors.
Federal Reserve Bank of St. Louis Working Papers are preliminary materials circulated to stimulatediscussion and critical comment. References in publications to Federal Reserve Bank of St. Louis WorkingPapers (other than an acknowledgment that the writer has had access to unpublished material) should becleared with the author or authors.
Photo courtesy of The Gateway Arch, St. Louis, MO. www.gatewayarch.com

August 21, 2000 Page 1
The authors are, respectively, vice president and economist, and senior vice president and director of research,Federal Reserve Bank of St. Louis. Marcela M. Williams, senior research analyst, Federal Reserve Bank of St.Louis, provided research assistance.
Retail Sweep Programs and Bank Reserves, 1994–1999
Richard G. Anderson
Robert H. Rasche
Federal Reserve Bank of St. Louis
August 2000
Abstract
Since January 1994, the Federal Reserve Board has permitted depository institutions inthe United States to implement so-called retail sweep programs. The essence of theseprograms is computer software that dynamically reclassifies customer deposits betweentransaction accounts, which are subject to statutory reserve requirement ratios as high as10 percent, and money market deposit accounts, which have a zero ratio. Through theuse of such software, hundreds of banks have sharply reduced the amount of theirrequired reserves. In some cases, this new level of required reserves is less than theamount that the bank requires for its ordinary, day-to-day business. In the terminologyintroduced by Anderson and Rasche (1996b), such deposit-sweeping activity has allowedthese banks to become “economically nonbound,” and has reduced to zero the economicburden (“tax”) due to statutory reserve requirements. In this analysis, we examine alarge panel of U.S. banks and develop quantitative estimates of the impact of sweepsoftware programs on the demand for bank reserves.

August 21, 2000 Page 2
In January 1994, the Federal Reserve Board permitted a commercial bank to begin using a new
type of computer software that dynamically reclassifies the balances in customer accounts between
transaction deposits and a type of personal-saving deposit, the money market deposit account (MMDA).
This software allows a bank to reduce its required reserves while leaving unchanged the amount of
transactions deposits that are available to its customers. Currently, transaction deposits are subject to a
10 percent statutory reserve-requirement ratio on amounts over the low-reserve tranche (approximately
$45 million), while personal-saving accounts are subject to a zero ratio. 1
The use of deposit-sweeping software spread slowly between January 1994 and April 1995, but
rapidly thereafter. Estimates of the amounts of transaction deposits reclassified as MMDA at all U.S.
depository institutions, prepared by the Board of Governors’ staff, are shown in Figure 1.2 By late 1999,
the amount was nearly $350 billion. In contrast, the aggregate amount of transaction deposits in the
published M1 monetary aggregate, as of December 1999, was $599.2 billion.3
In this analysis, we interpret the effects of deposit-sweeping software on bank balance sheets to
be economically the same as if regulators had reduced statutory reserve-requirement ratios. We seek to
measure the amount by which such deposit-sweeping activity has reduced bank reserves (vault cash and
deposits at Federal Reserve Banks).
To be useful in policy analysis and empirical studies, aggregate quantity data on bank reserves
must be adjusted for the effects of changes in statutory reserve requirements on the quantity of reserves
1 In its linking of transaction and saving accounts, the deposit-sweeping activity of the 1990s is reminiscent of theautomatic transfer from-savings (ATS) accounts of the 1970s. In addition to reducing required reserves at memberbanks, ATS accounts also were motivated by depositors’ desires for interest on checking balances and by the wish ofsome thrift institutions to offer transaction accounts, even though they could not offer demand deposits.2 These data are updated monthly, with a one-month lag, and are available on this Bank’s web site at<www.stls.frb.org>.3 Transaction deposits in M1 are measured as the sum of lines 7 and 8, Table 1.21, Federal Reserve Bulletin, August2000. The Monetary Control Act imposed reserve requirements on “net transaction deposits,” which equals the sumof checkable deposits due to individuals, partnerships, corporations (including other depository institutions), theTreasury, state and local governments and government agencies; minus, cash items in process of collection anddemand deposits due from other depository institutions. This is not the same aggregate as the sum of demand andother checkable deposits included in M1. So far as we are aware, net transaction deposits has not been published bythe Federal Reserve Board staff since implementation of the Monetary Control Act. Prior to the act, Federal reserverequirements applied to net demand deposits at member banks. Data on net demand deposits were published through
August 21, 2000 Page 3
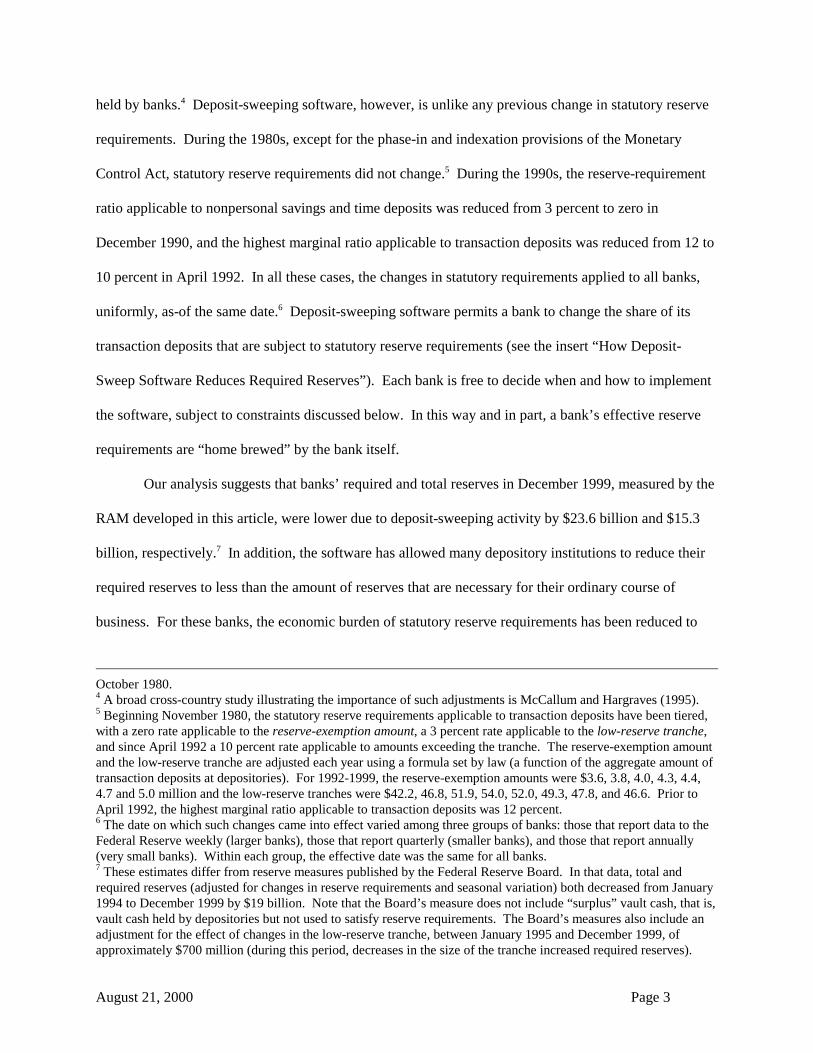
held by banks.4 Deposit-sweeping software, however, is unlike any previous change in statutory reserve
requirements. During the 1980s, except for the phase-in and indexation provisions of the Monetary
Control Act, statutory reserve requirements did not change.5 During the 1990s, the reserve-requirement
ratio applicable to nonpersonal savings and time deposits was reduced from 3 percent to zero in
December 1990, and the highest marginal ratio applicable to transaction deposits was reduced from 12 to
10 percent in April 1992. In all these cases, the changes in statutory requirements applied to all banks,
uniformly, as-of the same date.6 Deposit-sweeping software permits a bank to change the share of its
transaction deposits that are subject to statutory reserve requirements (see the insert “How Deposit-
Sweep Software Reduces Required Reserves”). Each bank is free to decide when and how to implement
the software, subject to constraints discussed below. In this way and in part, a bank’s effective reserve
requirements are “home brewed” by the bank itself.
Our analysis suggests that banks’ required and total reserves in December 1999, measured by the
RAM developed in this article, were lower due to deposit-sweeping activity by $23.6 billion and $15.3
billion, respectively.7 In addition, the software has allowed many depository institutions to reduce their
required reserves to less than the amount of reserves that are necessary for their ordinary course of
business. For these banks, the economic burden of statutory reserve requirements has been reduced to
October 1980.4 A broad cross-country study illustrating the importance of such adjustments is McCallum and Hargraves (1995).5 Beginning November 1980, the statutory reserve requirements applicable to transaction deposits have been tiered,with a zero rate applicable to the reserve-exemption amount, a 3 percent rate applicable to the low-reserve tranche,and since April 1992 a 10 percent rate applicable to amounts exceeding the tranche. The reserve-exemption amountand the low-reserve tranche are adjusted each year using a formula set by law (a function of the aggregate amount oftransaction deposits at depositories). For 1992-1999, the reserve-exemption amounts were $3.6, 3.8, 4.0, 4.3, 4.4,4.7 and 5.0 million and the low-reserve tranches were $42.2, 46.8, 51.9, 54.0, 52.0, 49.3, 47.8, and 46.6. Prior toApril 1992, the highest marginal ratio applicable to transaction deposits was 12 percent.6 The date on which such changes came into effect varied among three groups of banks: those that report data to theFederal Reserve weekly (larger banks), those that report quarterly (smaller banks), and those that report annually(very small banks). Within each group, the effective date was the same for all banks.7 These estimates differ from reserve measures published by the Federal Reserve Board. In that data, total andrequired reserves (adjusted for changes in reserve requirements and seasonal variation) both decreased from January1994 to December 1999 by $19 billion. Note that the Board’s measure does not include “surplus” vault cash, that is,vault cash held by depositories but not used to satisfy reserve requirements. The Board’s measures also include anadjustment for the effect of changes in the low-reserve tranche, between January 1995 and December 1999, ofapproximately $700 million (during this period, decreases in the size of the tranche increased required reserves).

August 21, 2000 Page 4
zero.
Deposit-Sweeping Software, Required Reserves and RAM
The effectiveness of deposit-sweeping software hinges on use of the money market deposit
account. This deposit instrument was created in 1982 by a provision in the Garn–St.Germain Act. At
that time, many banks perceived extreme competitive pressures from money market mutual funds. The
MMDA allowed them to offer a type of deposit that was fully competitive with money market fund
shares. It was not subject to Regulation Q interest rate controls and, so long as no more than 6
withdrawals were made by check or pre-authorized transfer during a month, not subject to the reserve
requirements applicable to transactions deposits. (If a bank permitted more than six such withdrawals,
the MMDA account was reservable as a transaction deposit.) The Monetary Control Act specified three
categories of deposits subject to reserve requirements: net transactions deposits, savings deposits
(personal and nonpersonal), and time deposits (with a minimum maturity of seven days). The act set the
reserve requirement ratio for personal-saving deposits to zero, and the Board of Governors set the ratio
for nonpersonal-saving deposits to zero in December 1990. Because MMDA’s were not time deposits
and the act prohibited the Federal Reserve from imposing transaction-deposit reserve requirements, they
are classified as savings deposits for reserve-requirement purposes. 8
At its start, the software creates a “shadow” MMDA deposit for each customer account. These
MMDA are not visible to the customer, that is, the customer can neither make deposits to nor
withdrawals from the MMDA. To depositors, it appears as if their transaction-account deposits are
unaltered; to the Federal Reserve, it appears as if a bank’s level of reservable transaction deposits has
8 Other combinations of transaction and saving deposits have been attempted in the past. In one case, a banksuggested that customers maintain several MMDA accounts and simply shift all funds among the accounts asnecessary to avoid making more than six third-party payments (or transfers to other accounts) during the month (12CFR 204.133). In another, a bank reclassified transaction deposits as seven-day large-time deposits, staggering thematurity so as to be able to pay, each day, all checks presented (12 CFR 204.134). In these cases, the Board ofGovernors reclassified the saving and large-time deposits as transaction deposits and imposed transaction-depositreserve requirements. See Board of Governors Regulation D, 12 CFR Ch. 11.

August 21, 2000 Page 5
decreased sharply. Although computer software varies, the objective is the same: to minimize a bank’s
level of reservable transaction deposits, subject to several constraints. The general parameters of this
optimization problem are:
• The Federal Reserve calculates a bank’s required reserves based on a 14-day average of the close-of-day level of its transaction deposits. 9
• Each calendar month, an unlimited number of transfers may be made from a customer’s transactiondeposit account into the shadow MMDA. However, only six transfers may be made out of theshadow MMDA to the customer’s transaction deposit account.
• Checks presented to the bank for payment are only debited against the customer’s transaction depositaccount, not against the MMDA. If the amount of funds in the transaction deposit is inadequate, atransfer must be made from the MMDA.
• On the sixth transfer, all funds remaining in the MMDA are moved to the transaction deposit. (Aseventh transfer would cause the MMDA to be subject to the reserve requirements applicable totransaction deposits.)
Because no debits are made to customer transaction deposits between just-before the close of business on
Friday and just-before the opening of business on Monday, some early software simply reclassified
transaction deposits as shadow MMDA prior to the close of business on Friday. This reduced a bank’s
weekly average level of required reserves by 3/7ths: its transaction deposit liabilities for Friday, Saturday
and Sunday, as reported to the Federal Reserve, were zero. About ten times each year, a Monday holiday
allowed delaying the return of funds to transaction deposits out of the MMDA until the opening of
business on Tuesday. Later software is more sophisticated, and analyzes the receipt and payment
patterns of customers. Of course, regardless of the efficiency of the software, the bank faces two
additional constraints that limit how much it can reduce its reserves. It must keep on hand sufficient
vault cash so as to be able to redeem customer deposits into currency, and it must maintain sufficient
deposits at Federal Reserve Banks to be able to satisfy interbank debits while not overdrawing its account
9 The computation of statutory required reserves involves two legally defined time periods, the reserve computationperiod and the reserve maintenance period. The former are 14-day periods that end every other Monday; the latterare 14-day periods that end every other Wednesday. Prior to August 1998, a bank’s required reserves, to bemaintained during a reserve maintenance period, were based on a bank’s deposits during the reserve computationperiod ending 2 days prior to the end of the reserve maintenance period. Beginning August 1998, the requiredreserves have been based on deposits during the reserve computation period ending 30 days before the end of thereserve maintenance period. Required reserves must be satisfied by eligible vault cash and deposits held during themaintenance period at Federal Reserve Banks. Eligible vault cash is vault cash held by a bank during the reserve

August 21, 2000 Page 6
at the end of the day.
To measure the effect of deposit-sweeping software on bank reserves, we need a benchmark, or
alternative. The reserve adjustment magnitude (RAM) furnishes one such measure. RAM was designed
to measure the amount by which bank reserves are affected by differences in statutory reserve
requirements between those in effect during the current period and a specific base period.10 The view
that deposit-sweeping activity should be analyzed as a change in statutory reserve requirements, and
hence fits within the framework of RAM, is not universally held, however. The Board of Governors’
staff, for example, does not adjust its reserve aggregates for the effects of deposit-sweeping activity,
apparently believing that the impact of such activity is not to be interpreted as economically equivalent to
a change in statutory requirements.11
In recent Congressional testimony, Federal Reserve Governor Lawrence Meyer discussed
together, as if they were equivalent, deposit-sweeping activity during the 1970s and the 1990s (Meyer,
2000). In our opinion, this view is inappropriate. The business-oriented sweep programs of the 1970s
essentially were overnight collateralized loans to mutual funds and banks, initiated by depositors (see
Kohn, 1994, chapter 9, or Stigum, 1990, chapter 13). These loans were made with the full participation
of depositors, who received directly the lion’s share of the investment return—the bank’s net earnings
arose from being a middleman. Although such sweeps reduced banks’ required reserves, their primary
purpose was to simulate a legally prohibited interest-bearing demand deposit. The retail-oriented
deposit-sweeping activity of the 1990s differs. It seems likely that few depositors understand the
process, even though many banks have notified customers that “…your deposit may be reclassified for
purposes of compliance with Federal Reserve Regulation D… ”. Except for competitive market
computation period ending 30 days before the end of the maintenance period.10 See for example Anderson and Rasche (1996a,b) and earlier references therein.11 Alternative measures of adjusted reserves currently are published by the Board of Governors of the FederalReserve System and by the Federal Reserve Bank of St. Louis. The measures differ with respect to the includedassets and the adjustment for changes in reserve requirements. See for example the annual benchmark releaseReserves of Depository Institutions (Division of Monetary Affairs, Board of Governors of the Federal ReserveSystem).

August 21, 2000 Page 7
pressures, it seems unlikely that banks have directly passed along the earnings from deposit-sweeping
activity to transaction-account customers.12 Further, the sweeps of the 1970s required banks to maintain
a significant amount of high-quality liquid collateral for use in repurchase agreements with corporate
deposit customers. The retail sweeps of the 1990s allow a bank to deploy into higher-earning assets, as it
sees fit, the funds released by reduced required reserves. In the example shown in the boxed insert, the
bank’s earning assets increase with no increase in total deposits or funding costs.
In his recent testimony, Governor Meyer argued that banks likely would reduce or eliminate the
use of deposit-sweeping software if the Federal Reserve was allowed to pay interest, at approximately the
federal funds rate, on deposits at Federal Reserve Banks. In our opinion, this outcome is unlikely for two
reasons. First, it seems unlikely that banks have passed much of the benefit from 1990s-style deposit-
sweeping activity on to their transaction-deposit customers. Second, because newly released funds may
be invested as the bank sees fit, including in consumer and business loans, it seems unlikely that deposits
at Federal Reserve Banks, earning interest at the federal funds rate, would be an attractive investment.
In all economic aspects, deposit-sweeping software programs of the 1990s differ distinctly from
the collateralized overnight-loan sweep programs of the 1970s—to borrow a phrase, they are not “yours
father’s Oldsmobile.”
Reserve-Requirement Ratios and Economically Bound Banks
To measure the amount of reserves released by deposit-sweeping activity, we need to separate
banks wherein the quantity of reserves demanded is sensitive to changes in reserve-requirement ratios,
from those in which it is not. When reserve requirements are “low,” a depository institution’s demand
for reserves may be largely, or even entirely, determined by its business needs (converting customer
deposits into currency, originating interbank wire transfers, settling interbank check collection debits)
12 To test this hypothesis, we have examined scatter plots of differentials between bank offering rates on OCD andtime deposits, relative to market yields on short and long-term Treasury issues. In monthly data, no change isapparent during the last decade.

August 21, 2000 Page 8
rather than statutory requirements.13 When statutory reserve requirements are “high,” the amount of
reserves held will be approximately equal to its required reserves.14 Hence, measuring RAM requires a
model of banks’ demand for reserves that includes an explicit role for statutory requirements. Let us
denote a depository institution’s reserve demand function as ( )rrDTR D , , where D denotes the
institution’s deposit liabilities and rr the statutory reserve requirement ratio. Further, omitting all tiering
of reserve requirements, let us denote its required reserves as ( ) DDrrrrDRR ∗=, . Then, when rr is
relatively large, ( ) ( ) ( )
0,, >
∂∗∂=
∂∂≅
∂∂
rr
Drr
rr
rrDRR
rr
rrDTR D
, such that statutory reserve requirements are,
at the margin, the binding constraint that determines the amount of reserves held. When rr is relatively
small, we assume that ( )
0, =
∂∂
rr
rrDTR D
, such that the bank’s business needs, rather than statutory
requirements, are the binding constraint. In Anderson and Rasche (1996b), we introduced the term
economically nonbound to describe a bank where ( )
0, =
∂∂
rr
rrDTR D
and economically bound to describe
the case where ( )
0, >
∂∂
rr
rrDTR D
.
To measure RAM, we must know (or infer) the sign of the derivative ( )rr
rrDTR D
∂∂ ,
at all dates
and for all banks in our sample. To be specific, for an individual bank, let ( )0, rrDRR t and ( )tt rrDRR ,
denote the period t levels of required reserves when the statutory requirements of a base period, 0, and of
period t, respectively, are in effect. For all cases, assume that sufficient data on reservable liabilities
during period t exist so as to permit calculation of the quantity ( )0, rrDRR t . Then, consider four cases:
Case 1: If trrrr =0 , that is, reserve requirements have not changed, RAM = 0.
13 In the U.S., the level of reserves held in the absence of statutory reserve requirements may be very small indeed, inpart because banks are permitted to run large daylight overdrafts on their deposit accounts at the Federal ReserveBanks. See for example Emmons (1997).14 This statement assumes that all base money held by depository institutions can be used to satisfy reserverequirements. As such, it must be adjusted for differing institutional arrangements. For example, in the United States,

August 21, 2000 Page 9
Case 2: If ( )
0,
0
0
=∂
∂
==
rrrrDD
D
rr
rrDTR and
( )0
, =∂
∂
==
t
trrrrDD
D
rr
rrDTR, that is, if the business needs of the
bank were the binding constraint in both the base period 0 and period t, then RAM = 0.
Case 3: If both ( )
0,
0
0
>∂
∂
==
rrrrDD
D
rr
rrDTR
and
( )0
, >∂
∂
==
t
trrrrDD
D
rr
rrDTR , that is, if the statutory
requirements were a binding constraint on the bank in both the base period 0 and period t, then the RAM
adjustment for period t (conditional on the choice of period 0 as the base period) is
( ) ( )tttt rrDRRrrDRRRAM ,, 0 −= .
Case 4: If ( )
0,
0
0
>∂
∂
==
rrrrDD
D
rr
rrDTR but
( )0
, =∂
∂
==
t
trrrrDD
D
rr
rrDTR , that is, if the statutory requirements
were binding in the base period but not in period t, then to measure RAM we must find the smallest
reserve requirement ratio, say rr*, for which ( )
0,
*
>∂
∂
==
t
t
rrrrDD
D
rr
rrDTR. Then,
( ) ( )*0 ,, rrDRRrrDRRRAM ttt −=
An empirical criterion for measuring RAM in Case 3, for dates beginning November 1980, was
developed by Anderson and Rasche (1996b), based on statistical analysis of a large panel dataset.15 That
analysis suggested that a bank was economically bound during a reserve maintenance period (that is, in
Case 3 above) if the bank was legally bound and had more than $135 million in net transaction deposits.
Empirical Analysis
Because the design, implementation, and operation of sweep software is idiosyncratic, our
analysis focuses on a longitudinal panel of 1231 depository institutions, between January 1991 and
member banks could not apply vault cash to satisfy reserve requirements between 1917 and 1959.15 The above analysis is applicable to cases where the only change in statutory reserve requirements between twoperiods is the reserve requirement ratio, rr, and data exist to calculate the counterfactual level of required reserves,
( )0, rrDRR t . For analysis of other cases, see Anderson and Rasche (1999).

August 21, 2000 Page 10
December 1999. A depository institution is included in the panel if, during at least one reserve-
maintenance period, it was either economically or legally bound. (A bank is said to be legally bound if
its required reserves exceed its vault cash.) Our panel is a subset of a larger dataset containing more than
7500 depository institutions which, in turn, is an updated version of the dataset used in Anderson and
Rasche (1996b). For some banks, data begin after January 1991 because either the bank only then
opened for business (or was created by the merger of other, existing banks), or it only then began
reporting data to the Federal Reserve. For others, the data stop before December 1999 because the bank
failed, merged with another bank, or was dropped from the reporting panel. For each such bank, we use
the Federal Reserve’s bank structure database to trace predecessors and successors. When a bank with
deposit-sweeping activity is acquired by another bank, we add the amount of activity at the acquired bank
to the amount at the acquiring bank. In all cases, we focus special attention on those institutions where
deposit-sweeping software has reduced the level of transaction deposits to such an extent that the level of
the depository’s required reserves is less than the amount of base money required for its day-to-day
business activity.
RAM 1991-1993
We begin by re-examining RAM from January 1991 through December 1993. Our previous
measure of RAM was based on the statistical models of Anderson and Rasche (1996b). Those results
suggested that Case 3 banks (the only ones included in that measure of RAM) were characterized by
required reserves that exceeded their vault cash, and by more than $135 million in net transaction
deposits. This schema allowed us to classify banks into broad groups without tedious examination of
time-series data for individual banks.
In this analysis, we revise our measure for 1991–1993, for two reasons. First, because deposit-
sweeping software allows banks to home-brew reserve requirements, our analysis for 1994–1999 must
necessarily be based on examination of individual-bank data. It is important to assess whether this
change in procedure—from using aggregated data for groups of banks to using individual-bank data—has

August 21, 2000 Page 11
any effect on measured RAM. The 1991–1993 period provides an experimental control for this change
in procedure. Second, we seek to reduce the number of occurrences when a bank, and its deposits, moves
from being included in RAM to being excluded. It seems unlikely that a bank’s responsiveness to
possible changes in a statutory reserve-requirement ratio fluctuates very much period-to-period. Absent
changes in statutory reserve requirements (or a merger), we assume that a typical bank switches
infrequently between economically nonbound (Case 2) or bound (Case 3).
The most reliable indicator of a bank’s economically bound or nonbound status is its response to
a change in statutory reserve requirements. An economically bound bank will reduce its holdings of
reserves, following a reduction in reserve requirements, by approximately the same amount as the
decrease in its required reserves. An economically nonbound bank will not, although it might reduce its
holdings by a smaller amount. Between January 1991 and December 1993, there were only two ways
that the statutory reserve-requirement ratio for a bank could change:
• In April 1992, the Federal Reserve reduced the statutory reserve-requirement ratio on transaction
deposits above the low-reserve tranche from 12 to 10 percent. If a bank reduced its deposits at
Federal Reserve Banks (relative to transaction deposits) following the April 1992 reduction in
reserve requirements and did not begin or increase the size of a clearing-balance contract, then we
classified the bank as economically bound from January 1991 to December 1993. If the bank
began, or increased the amount of, a clearing balance contract, we classified the bank as
economically nonbound from the date of that increase through the end of December 1993. 16 An
increase in the bank’s clearing balance contract at the time of the reduction indicates that payments
activity, not statutory reserve requirements, was determining the level of reserves held by the bank.
16 A clearing-balance contract is a contractual agreement between a depository institution and a Federal ReserveBank. In the contract, the depository agrees to maintain a specific amount of deposits at the Federal Reserve Bank,above and beyond the amount, if any, necessary to satisfy its statutory reserve requirement. In turn, the depositoryinstitution accrues, at approximately the federal funds rate, “earnings credits” which may be used to defray the costof services purchased from the Federal Reserve, such as check clearing and wire transfers. Earnings credits may notbe converted to cash, and have no cash value except in exchange for Federal Reserves services. Penalties apply forentering into such a contract and subsequently not holding sufficient deposits (see Stevens, 1994). A bill now

August 21, 2000 Page 12
• The second change affected only banks that acquired another bank. Federal Reserve regulations
permit an acquiring bank to “amortize” over 8 quarters the low-reserve tranche of the acquired
bank.17 For an acquirer with transaction deposits greater than the low-reserve tranche, the
amortization reduces the acquirer’s required reserves. If an acquirer did not reduce its holdings of
reserves so as to match the reduced required reserves, we classified the bank as nonbound beginning
in that maintenance period.
Finally, we also classify a bank as economically nonbound in a reserve-maintenance period if it is
legally nonbound (that is, if its eligible vault cash exceeds its required reserves). Because some banks
alternate between legally bound and nonbound, we modify this presumption by judgmentally smoothing
changes in status.
Figure 2 compares two measures of RAM for 1991–1993, one based on our 1996 method and one
based on the method in this analysis. The two measures, for all practical purposes, are the same.
RAM 1994-1999
Deposit-sweeping activity by banks substantially complicates measuring RAM for 1994-1999.
To cope, we follow a three-step procedure. First, we identify the dates (reserve-maintenance periods)
affected by new or expanded deposit-sweeping activity, and estimate the amounts of transaction deposits
relabeled as MMDA. Second, we classify each bank, for each reserve-maintenance period between
January 1994 and December 1999, as economically bound or nonbound. This procedure is similar to our
revised measure for RAM during 1991-1993, and relies heavily on the observed response of the bank to
changes in reserve-requirement ratios and the effects of implementing its deposit-sweeping software.
Finally, we calculate RAM based on the framework of Cases 1, 2, 3, and 4 introduced above.
pending in Congress would eliminate earnings credits in favor of cash interest payments (see Meyer, 2000).17 Under Federal Reserve Regulation D, when a bank acquires another and the combined bank has transactiondeposits that exceed the low-reserve tranche, the surviving bank’s required reserves are reduced. The reductionarises because the surviving bank is granted the right to use the low-reserve tranche amount that was previously usedby the acquired bank. In effect, the surviving bank faces only a 3, rather than a 10 (12, before April 1992) percentreserve requirement ratio on an additional $50 million or so of deposits. This reduction is phased-out over 8 quarters

August 21, 2000 Page 13
Sweep dates and amounts
Our first task is to identify the dates on which banks either began or changed their deposit-
sweeping activity. Although the date of the first such deposit-sweep program is known, January 1994,
banks are not required to notify the Federal Reserve when a program is implemented, expanded, or
discontinued, nor are they required to report the amount of deposits affected.18 To identify those dates
when deposit-sweeping activity either began or was expanded, we visually analyzed times-series data for
each bank. The variables examined were changes in the levels of transaction and savings deposits;
changes in the size of a clearing-balance contract; and the ratios of vault cash and deposits at Federal
Reserve Banks to transaction deposits.19 For a typical bank, the data signature of deposit-sweeping
activity consists of two simultaneous changes:
• The level of transaction deposits decreases and the level of savings deposits increases, during the
same reserve-maintenance period and by approximately the same dollar amount, while the bank’s
level of total deposits is approximately unchanged. It is important to condition on the level of total
deposits because, in some cases, mergers of banks with different mixtures of deposits otherwise
create false signals.
• The ratio of vault cash to reported transaction deposits (that is, transaction deposits not reclassified
as MMDA) increases sharply. This most likely occurs because the amount of vault cash held by a
bank depends on its customers’ perceived amount of transaction deposits, not the amount of
reservable transaction deposits reported by the bank to the Federal Reserve.
For each so-identified maintenance period, our estimate of the amount of deposits affected is the smaller
of the increase in savings deposits and (the absolute value of) the decrease in transaction deposits. For
some identified periods, however, transaction deposits increased, savings deposits decreased, and the
after the acquisition.18 The staff of the Board of Governors maintains a database of sweep dates and amounts at individual banks, gleanedfrom deposit-report data and interviews with staff of individual banks. This database was not available for ourresearch.19 We also experimented with statistical methods, including a VAR containing transactions and savings deposits.

August 21, 2000 Page 14
ratio of vault cash to transaction deposits fell. We interpret these changes to indicate that deposit
sweeping was discontinued or reduced in amount. The amount of the change in deposit-sweeping
activity is calculated as the negative of the above calculations, but is capped at the maximum amount that
we estimate the bank previously had been sweeping.
Overall, we observe deposit-sweeping activity at 680 of the 1231 banks in our panel dataset. 20
Due to mergers, acquisitions and liquidations, as of December 1999 our panel includes only 649 active
banks. Of these, we estimate that 463 banks were operating deposit-sweeping software, affecting $255.9
billion of transaction deposits. Figure 3a shows estimates of the amount of deposit-sweeping activity at
our panel of banks during 1994–1999. For comparison, the figure also shows the Board of Governors’
staff’s estimate of the amount of deposit-sweeping activity at all depository institutions. As of December
1999, the Board staff estimate is $368.7 billion. Figure 3b shows the ratio of the two estimates. Prior to
mid-1995, the aggregate amount measured in our panel of banks is approximately 85-90 percent that of
the Board staff’s; since mid-1997, our measure has been approximately 65-70 percent of their total. The
difference between the amounts may be due to one or more of three factors:
• Deposit-sweeping programs at smaller banks: Our panel includes only 1231 banks, those which
are relevant to measuring RAM; the Board staff’s estimate seeks to include all banks. For our
purpose—measuring the reduction in total and required reserves due to deposit-sweeping activity—
the difference is unlikely to be important. Our previous analysis (Anderson and Rasche, 1996b)
suggests that the smaller banks omitted from our panel are unlikely to change their holdings of
reserves in response to a change in statutory reserve-requirement ratios.
• Overlooked deposit-sweeping programs: Repeated re-examinations of our data suggest that we
The identification error rates from these methods, in our opinion, were unacceptably high.20 For 671 banks, we have identified specific reserve-maintenance periods in which we believe deposit-sweepingactivity began or was expanded. For 9 banks, deposit-sweeping activity is inferred because they acquired otherbanks with deposit-sweeping activity. Among the 671 banks, there were 425 acquisitions of banks by others betweenJanuary 1994 and December 1999. (This number includes acquired banks that later were acquired by others amongthe 671.) Bank mergers and acquisitions are handled by assuming that the acquirer continues to sweep the sameamount of deposits as was being swept by the acquired bank.

August 21, 2000 Page 15
have overlooked few, if any, banks within our sample that are operating deposit-sweeping programs.
We have searched, not only for the implementation of deposit-sweeping software, but also for
subsequent changes in the level of sweep activity.
• Inaccurate estimates of the amount of reclassified deposits: Our estimated amounts are the
smaller of the absolute values of the change in transaction and savings deposits, subject to caveats
explained above. As a further check, we visually examined two ratios for each bank: vault cash
divided by reported [reservable] transaction deposits, VC/NT, and vault cash divided by the sum of
net transaction deposits plus the estimated amounts of deposits reclassified as MMDA,
VC/(NT+SWP), where SWP denotes the amount of transaction deposits reclassified. These data
suggest that our estimates of the amounts being reclassified are quite accurate. The ratio VC/NT
almost always increases sharply when deposit-sweeping activity begins or expands. On these same
dates, the ratio VC/(NT+SWP) shows no such jumps.
Figure 4 displays total transaction deposits at the banks in our panel. The smaller series is the amount of
transaction deposits reported by our panel of banks to the Federal Reserve, NT, and hence subject to
statutory reserve requirements. The larger series is the sum of NT plus SWP. The difference, of course,
is deposit-sweeping activity.
E-Bound Status
We emphasize that our purpose in this analysis is not to estimate the total number of banks using
deposit-sweep software, nor the total amount of deposits involved. Rather, we wish to identify how
deposit-sweep activity at economically bound banks has reduced the quantity of reserves held during
each reserve maintenance period between 1994–1999. The concept and calculation of RAM focuses on
deposits, not on banks. It is the derived demand for reserves, arising from the level of deposits and the
characteristics of the banks, that is of primary interest to us. Our next step, therefore, is to classify, for
each biweekly reserve-maintenance period, a bank (and its deposits) as either economically nonbound or
economically bound. To do so, we visually analyzed time-series data, for individual banks, on a period-

August 21, 2000 Page 16
by-period basis from 1994–1999. Similar to 1991–1993, we believe that banks should not (and do not)
alternate often between bound and nonbound status.
The most important indicator of the bank’s bound and nonbound status is the change in its
holdings of reserves, relative to the change in its required reserves.
• If a bank acquired another bank, did it make use of the reduction in required reserves as provided for
by Federal Reserve regulations?21 If not, then the acquiring bank is revealed to be economically
nonbound during those periods. In most cases, such a bank is classified as economically nonbound in
all subsequent periods.
• If a bank implemented a sweep program, did its ratio of reserves to reported transaction deposits
(after subtracting required reserves against the low-reserve tranche from the numerator, and the
deposit-amount of the low-reserve tranche from the denominator) increase above 10 percent? If so,
the bank is revealed to be economically nonbound because it holds more reserves than is necessary to
satisfy statutory reserve requirements. In most cases, such a bank is classified as economically
nonbound for all subsequent periods.
• If a bank implemented a sweep program, did it increase its required clearing-balance contract? If so,
the bank is revealed to be economically nonbound because it voluntarily increased its reserves above
the amount necessary to satisfy legal requirements. In most cases, the bank is classified as
economically nonbound for all subsequent periods unless it reduces or eliminates its clearing balance
contract.
• If a bank implemented a sweep program, did its required reserves decrease below its vault cash (that
is, did the bank become legally nonbound)? If so, the bank is revealed to be economically nonbound
because the amount of vault cash necessary for its ordinary business exceeds its required reserves.
The bank is classified as economically nonbound for all periods in which it is legally nonbound.

August 21, 2000 Page 17
In general, if a bank is re-classified to economically nonbound from economically bound, it remains
nonbound through to the end of the sample. We observe that a few banks, however, subsequently sharply
reduce their excess reserves and begin responding to changes in reserve requirements. Although the
reasons for such changes in behavior are unknown to us, we reclassify these banks as economically
bound beginning at the date of the change.
Banks that did not implement a deposit-sweep program nor acquire another bank during 1994–
1999 experienced no change in their statutory required-reserve ratio. Hence, we use different criteria to
classify these as economically bound or nonbound. For most banks, their status as of December 1993 is
extended forward through December 1999. A bank’s status might be changed if it significantly changes
its level of excess reserves, enters into a clearing-balance contract, or experiences a major change in its
level or mixture of deposits. In our sample, there are 551 such banks; 88 of these have their classification
changed between January 1994 and December 1999.
Figure 5 shows the numbers of banks in our panel classified as economically bound and
nonbound, and the amounts of their reservable transaction deposits. Changes in the numbers of banks
should not be over-interpreted because of the large number of bank mergers and acquisitions since 1995.
Regardless, the figure shows clearly that a major shift has occurred since deposit-sweeping computer
software began to spread rapidly through the U.S. banking industry. In late 1994, for example, deposits
in our panel’s economically bound banks totaled approximately $500 billion, and deposits in
economically nonbound banks less than $100 billion. By late 1999, reported transaction deposits
(subject to statutory reserve requirements) in economically bound banks totaled less than $100 billion,
and reported transaction deposits in economically nonbound banks approximately $250 billion.
Estimate rr*
The above analysis allows us to classify each bank in our dataset, during each reserve-maintenance
period, as being in either Case 1, 2, 3 or 4. For those banks in Case 1 and 2, RAM = 0. For those in Case
21 See footnote 18..

August 21, 2000 Page 18
3, calculation of RAM is straightforward, as shown above. For banks in Case 4, it remains to estimate
rr*.
We remind the reader that rr* does not equal the marginal reserve-requirement ratio against
transaction deposits, but rather is the smallest (counterfactual) reserve-requirement ratio for which
( )0
,
*
>∂
∂
==
t
t
rrrrDD
D
rr
rrDTR,
when ( )
0,
0
0
>∂
∂
==
rrrrDD
D
rr
rrDTR ,
( )0
, =∂
∂
==
t
trrrrDD
D
rr
rrDTR, rr0 > rrt , and rr0 and rrt are, respectively, the base
period and period t reserve requirement ratios. In this case, ( ) ( )*0 ,, rrDRRrrDRRRAM ttt −= . An
estimate of rr* is calculated only once, for the maintenance period before the sweep activity that allows
the bank to become economically nonbound. This mimics in spirit the pre-1994 Federal Reserve
statutory regime in which reserve-requirement ratios changed by specific amounts at specific dates and
then remained fixed at the new values until the next change. RAM is calculated for all subsequent
periods in the dataset as if the calculated value for rr* were the applicable statutory ratio.
In what follows, we treat rrt and rr* as ratios of reserves (vault cash, VC, plus deposits at Federal
Reserve Banks, RB) divided by the sum (NT + SWP).22 Complications regarding tiering (the reserve-
exemption amount and low-reserve tranche) are omitted because all aspects of the statutory reserve
requirement system, including tiering, are irrelevant to Case 4 banks. To estimate rr*, recall that the
amount of reserves held by an economically nonbound, Case 4 bank is determined by its day-to-day
business needs, not by statutory reserve requirements. Hence, the amount is less than the product of rr*
times the sum (NT + SWP):
( )SWPNTrrRBVC +∗<+ *)(
22 In this analysis, “RB” refers to total deposits held by banks at Federal Reserve Banks, including amounts held tosatisfy clearing-balance contracts (line 25, Table 1.18, Federal Reserve Bulletin, August 2000). Note that thisdiffers from the concept of reserve balances published by the Board of Governors staff, which equals deposits atFederal Reserve Banks minus the amount of clearing-balance contracts (line 1, Table 1.12, Federal Reserve Bulletin,

August 21, 2000 Page 19
Note that the opposite is true for an economically bound Case 3 bank where, at the margin, the amount of
reserves is determined by the statutory reserve-requirement ratio rrt:23
( )SWPNTrrRBVC t +∗≥+ )( .
These two relationships are not sufficient, however, to provide an estimator for rr*. To do so, we impose
one additional condition, that the amount of a bank’s vault cash is determined by its day-to-day retail
business needs and is not affected by statutory reserve requirements or deposit-sweep activity.
Conditional on this assumption, we next examine separately the ratios VC/(NT + SWP) and RB/(NT +
SWP).
At many banks, our data suggest that deposit-sweeping activity was phased-in during more than
one reserve-maintenance period. Also, some banks expanded their activity at later dates, often a year or
more after the initial implementation. For each such bank, we visually searched the data to identify the
first and last reserve-maintenance periods affected by changes in the intensity of deposit-sweeping
activity (that is, the period before sweep activity begins and the period in which the bank’s transaction
and savings deposits later settle down to new levels or trends). We infer from the ratios VC/(NT + SWP)
and RB/(NT + SWP) whether the economically bound status of the bank was changed by implementation
of deposit-sweep software. We classify 442 banks that were economically bound before implementing
deposit-sweeping software as economically nonbound after (Case 4); 113 banks that were economically
bound before as remaining bound after (Case 3); 117 banks that were economically nonbound before as
remaining nonbound after; and 6 banks that were economically nonbound before as bound after.
Data for the 442 banks that changed status from economically bound to nonbound provide
evidence for a lower bound for rr*. Scatter plots and smoothed density functions of the ratios VC/(NT +
SWP) and RB/(NT + SWP) are shown in Figures 6 and 7 for the reserve-maintenance periods immediately
before and after implementation of deposit-sweep activity (the normal density is included for
August 2000).23 This analysis ignores the carryover provision of Federal Reserve accounting. That provision allows a bank’srequired reserves during a reserve maintenance period to exceed the sum of its eligible vault cash and deposits at

August 21, 2000 Page 20
reference).24 For vault cash, Figure 6, the similarity of the “before” and “after” distributions is striking.
The mean is approximately the same in both cases, 4.6 percent, and the densities have similar dispersion.
The Kolmogorov-Smirnov D-statistic fails to reject the equality of the two distributions, with a value of
0.017 and a p-value of 0.034. For deposits at Federal Reserve Banks, the difference between the “before”
and “after” distributions is striking.25 The mean of the pre-sweep distribution is 3.5 percent; the mean
and median of the post-sweep distribution are, respectively, 1.2 percent and 0.8 percent. These
distributions suggest that the mean of rr* likely is not less than 5.8 (= 4.6 + 1.2) percent.
Data for the 113 economically bound banks that remain bound after implementing sweep
programs provide evidence in favor of an upper bound for rr*. Scatter plots and densities are shown in
Figures 8 and 9. The means of the two vault cash-ratio distributions are equal, at 4.0 percent, and
equality of the before and after distributions is not rejected at the 6.1 percent level, with a D-statistic
value of 0.030. The means of the two distributions for deposits at the Federal Reserve are 4.7 and 2.2
percent. These data suggest that the mean of rr* likely is not more than 6.2 (= 4.0 + 2.2) percent.
These results support our assumption that the amount of vault cash held by banks is largely
determined by their retail business, and largely unaffected by statutory reserve requirements. Because
deposit-sweeping activity does not change the amount of transaction deposits as perceived by bank
customers, it apparently also does not affect vault-cash ratios. These distributions suggest that a typical
bank in our sample, in the absence of statutory reserve requirements, would maintain approximately a 1
percent ratio of deposits at Federal Reserve Banks (including deposits used to satisfy clearing-balance
contracts) to total net transaction deposits (including any amounts reclassified as MMDA). Hence, we
conclude that a reasonable estimator for rr* for a Case 4 bank is the sum of 1 percent plus the bank’s
Federal Reserve Banks so long as the deficiency is offset (made up) during the following period.24 The densities are calculated by the Rats program KERNEL.SRC, which computes a nonparametric estimate of theunconditional distribution using the Epanechnikov kernel. We also have examined these ratios during the fifth, tenth,fifteenth, twentieth, and twenty-fifth periods after the intensity of sweep activity stabilized. Those densities andscatter plots are nearly identical to the ones shown.25 Note that the inclusion of deposits at the Federal Reserve used to satisfy required clearing balance contracts givesthe distributions thick right tails.

August 21, 2000 Page 21
vault-cash ratio during the reserve-maintenance period immediately before the period (or sequence of
periods) during which the bank began (or changed the intensity of) its deposit-sweeping activity.
As-of December 1999, we had estimated rr* for 318 of the 649 active banks in our panel (that is,
318 banks were classified as Case 4). In the other groups, 121, 60, and 150 banks, respectively, were
classified as Cases 1, 2 and 3.26
RAM
To illustrate the importance of our adjustments for deposit-sweeping activity and for banks falling
below “frictional” levels of reserve demand (the rr* correction, in Case 4), four alternative RAM series
are shown in Figure 8.
• Our preferred measure, which includes the effects of deposit-sweeping activity and rr*, is labeled “1.
RAM, 2000 method.” This measure suggests that bank reserves in December 1999 were lower by
$15.3 billion, relative to what might be expected in the absence of deposit-sweeping software.
• The series labeled “2.” is the same calculation as “1.” except that it ignores the rr* adjustment. That
is, it assumes, for each bank, that the amount of reserves freed by deposit-sweeping activity equals
the reduction in required reserves. Our analysis shows, however, that deposit-sweeping software
often is able to reduce a bank’s required reserves to a level below the reserves necessary for the
bank’s day-to-day business. This measure suggests that banks’ required reserves in December 1999
were lower by $23.6 billion, relative to what might be expected in the absence of such software.
• The series labeled “3.” is RAM according to the method of Anderson and Rasche (1996b). This
series ignores deposit-sweeping activity.
• The series labeled “4.” is the same as “3.” except that it adjusts for rr*-type behavior. The very
small difference between series “3.” and “4.” ($0.8 billion in December 1999) emphasizes that a
26 We estimate that 463 banks were sweeping deposits as-of December 1999: 308 of the 318 in Case 4, 67 of the 150in Case 3, and 88 others. This illustrates the idiosyncratic nature of banks—a few banks in our panel seem to havebecome economically nonbound during the 1990s without deposit-sweep activity, and not every bank thatimplements a deposit-sweep program is able to reduce its reserves enough to be classified as economically nonbound

August 21, 2000 Page 22
correct RAM adjustment must capture the effects of interaction between reductions in reserve
requirements and banks finding that their required reserves have fallen below the amount necessary
for day-today business.
SUMMARY AND CONCLUSIONS
This analysis has examined the extraordinary unwinding of statutory reserve requirements in the
United States since January 1994. Based on the statistical results in Anderson and Rasche (1996b), we
selected a panel of 1231 banks whose demand for reserves likely is responsive to changes in statutory
reserve requirements. For these banks, we estimate that deposit-sweep activity has reduced required
reserves in December 1999 by $23.6 billion. Adjusting for banks where the new lower level of required
reserves is less than the bank’s necessary day-to-day operating balances, we estimate that deposit-sweep
activity has reduced total bank reserves, as-of December 1999, by $15.3 billion relative to the amount
that would be held in the absence of such activity.
Our analysis suggests that the willingness of bank regulators to permit use of deposit-sweeping
software has made statutory reserve requirements a “voluntary constraint” for most banks. That is, with
adequately intelligent software, many banks seem easily to be able to reduce their transaction deposits by
a large enough amount that the level of their required reserves is less than the amount of reserves that
they require for day-to-day operation of the bank. For these banks at least, the economic burden of
statutory reserve requirements is zero.
(that is, unlikely to respond to future changes in statutory reserve requirements).

August 21, 2000 Page 23
References
Anderson, Richard G. and Robert H. Rasche. “Eighty Years of Observations on the Adjusted MonetaryBase: 1918–1997,” Federal Reserve Bank of St. Louis Review, January/February 1999, pp. 3-22.
“Measuring the Adjusted Monetary Base in an Era of Financial Change,” Federal Reserve Bank ofSt. Louis Review, November/December 1996, pp. 3-37 [1996b].
“A Revised Measure of the St Louis Adjusted Monetary Base,” Federal Reserve Bank of St. LouisReview, March/April, pp. 3-13 [1996a]
Board of Governors of the Federal Reserve System. Federal Reserve Bulletin, August 2000.
, Division of Monetary Affairs. Reserves of Depository Institutions, March 2000.
Regulation D: Reserves of Depository Institutions (12 CFR 240).
Bennett, Paul and Spence Hilton. “Falling Reserve Balances and the Federal Funds Rate,” Current Issuesin Economics and Finance, Federal Reserve Bank of New York, April 1997.
Edwards, Cheryl L. “Open Market Operations in the 1990s,” Federal Reserve Bulletin, November 1997,pp. 859–74.
Emmons, William R. “Recent Developments in Wholesale Payments Systems,” Federal Reserve Bank ofSt Louis Review, November/December 1997, pp. 23-43.
Hilton, Spence. “Highlights of Domestic of Open Market Operations During 1988,” Federal ReserveBulletin, April 1999, pp. 217–35.
Kohn, Donald (1996). “Commentary [on Anderson and Rasche, 1996b],” Federal Reserve Bank of St.Louis Review, November/December, pp. 45-9.
Kohn, Meir (1994). Financial Institutions and Markets (McGraw Hill)
McCallum, Bennett T. and Monica Hargraves (1995), “A Monetary Impulse Measure for Medium-TermPolicy Analysis,” Staff Studies for the World Economic Outlook, International Monetary Fund,September, pp. 52-70.
Meyer, Lawrence H. (2000), “Statement before the Committee on Banking and Financial Services, U.S.House of Representatives, May 3, 2000,” Federal Reserve Bulletin, July 2000, pp. 454-62.
Stevens, Edward (1994). “Required Clearing Balance Contracts,” Federal Reserve Bank of ClevelandEconomic Review.
Stigum, Marcia (1990), The Money Market 3rd ed (Dow Jones Irwin)

August 21, 2000 Page 24
-----------------------------------------------Boxed Insert 1-----------------------------------------------------------------
How Deposit-Sweeping Software Reduces Required Reserves Let us consider a hypothetical $1 billion bank with $200 million in transaction deposits. We focus on
two constraints faced by the bank: to satisfy the Federal Reserve’s statutory reserve requirements; and to
convert deposits into currency and settle interbank debits (related to check clearing and wire transfers)
using deposits at the Federal Reserve. Fortunately, the assets involved—vault cash and deposits at the
Federal Reserve—do double-duty.
THE BANK BEFORE DEPOSIT-SWEEPING SOFTWARE
Statutory required reserves: A bank’s required reserves are calculated from close-of-business data.
Excluding any special adjustments, the bank’s required reserves as-of late January 1999 would be:
• 0% on the first $5 million of transaction deposits (the reserve-exemption amount);• 3% on the next $41.5 million of transaction deposits (up to the low-reserve tranche of $46.5 million),
equal to $1.245 million;• 10% on the amount in excess of $46.5 million, or $15.350 million.
Banking industry data suggest that such a bank might choose to hold vault cash equal to approximately 5
percent of its transaction deposits, or $10 million. If all vault cash is “applied” to satisfy reserve
requirements, the bank would need to maintain at least $6.595 million on deposit at the Federal Reserve
to satisfy its statutory reserve requirement. Its balance sheet might look as:
Assets Liabilities (as of close of business; dollar amounts are in thousands)
Vault cash Deposits at Federal Reserve Other assets Total assets Memo: Required reserves Applied vault cash Surplus vault cash Applied Federal Reserve deposits Excess reserves (ex. vault cash)
$10,000 7,000
983,000
1,000,000
16,595 10,000
0 6,595
405
Transaction deposits Savings and time deposits Other liabilities and capital Total liabilities
$200,000 700,000 100,000
1,000,000

August 21, 2000 Page 25
Payments activity and the reserve-requirement tax: Banking-industry data used in our analysis
suggest that a typical bank, in the absence of statutory reserve requirements, would tend to maintain
deposits at the Federal Reserve equal to approximately 1 percent of its transaction deposits (in the
example, $2 million). The data also suggest that deposit-sweeping activity does not affect the amount of
vault cash held, relative to the sum of transaction deposits plus the amount of deposits being reclassified
as MMDA. For the example bank, the reserve-requirement tax is the interest foregone by maintaining $7
million, rather than $2 million, on deposit at the Federal Reserve.
OVERNIGHT RP-BASED DEPOSIT SWEEPING During the 1970s, many banks began “sweeping” customer deposits into overnight repurchase
agreements (RPs). Let us suppose that the bank in this example wishes, at the behest of its large
customers, to sweep half its deposits each night. To do so, it maintains an inventory of high-quality
liquid securities, such as Treasury bills. Its balance sheet at 3 p.m., prior to sweeping, might look like:
Assets Liabilities (as of close of business; dollar amounts are in thousands)
Vault cash Deposit at Federal Reserve Bank Treasury bills Other assets Total assets Memo: Required reserves Applied vault cash Surplus vault cash Excess reserves ex. Vault cash)
$10,000 7,000
100,000 883,000
1,000,000
16,595 10,000
0 405
Transaction deposits Savings deposits Other liabilities Total Liabilities
$200,000 700,000 100,000
1,000,000

August 21, 2000 Page 26
At 6 p.m., after sweeping, it might appear as:
Assets Liabilities (as of close of business; dollar amounts are in thousands)
Vault cash Deposit at Federal Reserve Bank Treasury bills Federal funds sold Other assets Total assets Memo: Required reserves Applied vault cash Surplus vault cash Excess reserves (ex. Vault cash)
$10,000 2,000
0 5,000
883,000
900,000
6,595 6,595
405 2,000
Transaction deposits Savings deposits Other liabilities Total liabilities
$100,000 700,000 100,000
900,000
This example includes the sale (lending) of $5 million in the federal funds market; the bank is assumed to
retain $2 million deposits to service customer accounts and reduce the risk of an overnight overdraft at
the Federal Reserve. If the bank’s customers routinely desire to engage in overnight RPs, the bank likely
will reduce its balance at the Federal Reserve and this lending will vanish.
1990s MMDA-BASED SWEEPING
Our examination of banking data suggests that MMDA-based sweeping may reduce transaction
deposits at a typical bank by two-thirds or more. If the bank in our example does so, its required reserves
will decrease by more than 80 percent, to $3.295 million ($1.245 million on the first $46.5 million of
deposits, plus $2.050 million on the next $20.5 million). Its vault cash—$10 million—is now more than
adequate to fully satisfy its new, lower required reserves.

August 21, 2000 Page 27
Assets Liabilities (as of close of business; dollar amounts are in thousands)
Vault cash Deposit at Federal Reserve Bank Other assets Total assets Memo: required reserves applied vault cash surplus vault cash excess reserves (ex. vault cash)
$10,000 2,000
988,000
1,000,000
3,295 3,295 6,705 2,000
Transaction deposits Savings deposits, including MMDA Other liabilities Total liabilities
$67,000 833,000 100,000
1,000,000
Although the bank no longer needs deposits at the Federal Reserve to satisfy reserve requirements, we
assume that the bank retains $2 million to service customer accounts and reduce the risk of an overnight
overdraft.
In our example, both RP-based and MMDA-based sweeps reduce to zero the “burden” of
statutory reserve requirements—the bank holds no more reserves than are necessary for its day-to-day
operations. In addition, both types of sweeps reduce the bank’s required reserves by enough that they are
fully satisfied with vault cash. But, the two types of sweeps differ in other aspects. Note that RP-based
sweeps constrain the bank’s balance sheet—the bank must hold an inventory of suitable liquid securities,
as collateral—but MMDA-based sweeps do not. Also, RP-based sweeps typically are conducted only
with large customers, and often in amounts of several million dollars. These customers are economically
equivalent to partners with the bank in the RP-based sweeps, and hence are likely to receive a significant
share of the earnings. In contrast, MMDA-based sweeps may be implemented for most, if not all
transaction-deposit customers, and may be invisible to the customers. Finally, MMDA-based sweeps do
not directly change the bank’s total assets, liabilities or deposits. Rather, like changes in statutory
reserve requirements, they allow the bank to deploy funds from non-interest bearing deposits at Federal
Reserve Banks into loans and other investments.

August 21, 2000 Page 28
THE ROLE OF CLEARING BALANCE CONTRACTS
The analysis above excludes one additional effect of MMDA-based deposit-sweeping activity: an
increase in clearing-balance contracts. A clearing-balance contract is an agreement between a bank and
the Federal Reserve wherein the bank agrees to maintain a certain amount of deposits at the Federal
Reserve above and beyond any amount necessary to satisfy statutory reserve requirements. As
compensation for (and an incentive to enter into) the contract, the bank receives earnings credits from the
Federal Reserve. Earnings credits accrue at a rate slightly less than the federal funds rate, and may only
be used to defray the cost of financial services, such as check clearing, purchased from the Federal
Reserve.
Kohn (1996, p. 48) notes that, through 1996, the aggregate amount of clearing-balance contracts
had tended to increase by 16 to 17 cents for each dollar that required reserves decreased due to deposit-
sweep activity. Let us, therefore, reconsider our example bank. Suppose that this bank incurs an annual
cost of $200,000 due to check clearing and wire transfers through the Federal Reserve, on behalf of
customers. In our example, MMDA-based deposit-sweeping software reduced required reserves by more
than $13 million and freed the bank from using its remaining $2 million at the Fed to satisfy required
reserves. If this bank were typical of Kohn’s average, it might sign a $2 million clearing-balance
contract. This clearing-balance contract does not require the bank to increase its deposit at the Fed
beyond the initial $2 million, nor does it infringe in any way on the bank’s ability to use its $2 million
deposit for routine business activity. If the federal funds rate were to be (say) 5 percent, the bank would
receive approximately $100,000 per year in earnings credits. The deposit-sweeping software has done
double-duty—it eliminated the reserve-requirement tax and, at no cost to the bank, reduced by one-half
its payments to the Federal Reserve for purchased services.
----------------------------------------- end of boxed insert ------------------------------------------------------------

August 21, 2000 Page 29
--------------------------------------------------Boxed Insert 2------------------------------------------------------
Federal Reserve Publications and Deposit-Sweep Programs
During the 1990s, Federal Reserve publications have documented the spread of deposit-sweeping
software through the U.S. banking industry. The July 1994 Humphrey-Hawkins Act monetary-policy
report introduced deposit-sweep programs, in a single sentence. The July 1995 report noted that
approximately $12 billion of deposits were involved in sweep activity and, as a result, that deposits at
Federal Reserve Banks had decreased by about $1.2 billion. It also raised concern regarding an increase
in federal funds rate volatility if deposits decreased further. The July 1996 report included a special
appendix on the operation of sweep programs. The February 1997 report noted that the aggregate
amount of deposits affected by sweep programs had increased to approximately $116 billion, compared
to $45 billion in 1995. The July 1997 report noted the introduction of deposit-sweep programs for
household demand deposits, and noted that some banks were increasing the size of their clearing balance
contracts when sweep programs reduced their required reserves. Subsequent reports have repeated these
themes, along with an appeal that the Congress allow the Federal Reserve to pay interest on reserve
balances. In addition, deposit-sweep activity also has been highlighted in the annual reports of the Open
Market Desk (see, for example, Hilton 1999, and Bennett and Hilton, 1997) and in the Federal Reserve
Bulletin (Edwards, 1997).
----------------------------------------- end of boxed insert 2----------------------------------------------

Figure 1: Sweeps of Transaction Deposits into MMDAsBoard of Governors Staff Estimates, January 1994 - July 2000
Bill
ion
s o
f D
olla
rs
1994 1995 1996 1997 1998 1999 20000
50
100
150
200
250
300
350
400

RAM, 1996 MethodRAM, 2000 Method
Figure 2 : RAM, 1991-1993B
illio
ns
of
Do
llars
1991 1992 1993-1.6
0.0
1.6
3.2
4.8
6.4
8.0
9.6
11.2

St. Louis, Sample of 1231 Banks BOG, All Banks
Figure 3a: Sweeps of Transaction Deposits into MMDAs
Bill
ion
s o
f D
olla
rs
1994 1995 1996 1997 1998 19990
50
100
150
200
250
300
350
400
St. Louis Sweeps / BOG Sweeps
Figure 3b: Ratio of St. Louis to BOG Sweeps
1994 1995 1996 1997 1998 19990.5
0.6
0.7
0.8
0.9
1.0

Reported Deposits Plus Sweeps into MMDAsReported Deposits
Figure 4: Transaction Deposits
Bill
ion
s o
f D
olla
rs
91 92 93 94 95 96 97 98 99300
350
400
450
500
550
600
650

ENonbound banks EBound banks
Figure 5a: Number of Active Banks in Panel
91 92 93 94 95 96 97 98 990
250
500
750
1000
ENonbound banks EBound banks
Figure 5b: Deposits
Bill
ion
s o
f D
olla
rs
91 92 93 94 95 96 97 98 990
80
160
240
320
400
480
560

Figure 6: Vault Cash/(Reported Net Trans + Sweeps)Banks Ebound Before to Enonbound After Sweep, Obs =442
After SweepNormal(0,1)
Panel A
Normalized Value
Den
sity
-4 -2 0 2 4
0.0
0.1
0.2
0.3
0.4
0.5
Before SweepNormal(0,1)
Panel B
Normalized Value
Den
sity
-4 -2 0 2 4
0.0
0.1
0.2
0.3
0.4
0.5
After SweepBefore Sweep
Panel C
Value
Den
sity
0.000 0.025 0.050 0.075 0.100 0.125 0.150
0.0
0.1
0.2
0.3
0.4
0.5
Panel D
After Sweep
Bef
ore
Sw
eep
0.000 0.025 0.050 0.075 0.100 0.125 0.150
0.000
0.025
0.050
0.075
0.100
0.125
0.150

Figure 7: Deposits at the Federal Reserve/(Reported Net Trans + Sweeps)Banks Ebound Before to Enonbound After Sweep, Obs =442
After SweepNormal(0,1)
Panel A
Normalized Value
Den
sity
-4 -2 0 2 4
0.00
0.08
0.16
0.24
0.32
0.40
0.48
0.56
0.64
Before SweepNormal(0,1)
Panel B
Normalized Value
Den
sity
-4 -2 0 2 4
0.00
0.08
0.16
0.24
0.32
0.40
0.48
0.56
0.64
After SweepBefore Sweep
Panel C
Value
Den
sity
0.000 0.025 0.050 0.075 0.100 0.125 0.150
0.00
0.08
0.16
0.24
0.32
0.40
0.48
0.56
0.64
Panel D
After Sweep
Bef
ore
Sw
eep
0.000 0.025 0.050 0.075 0.100 0.125 0.150
0.000
0.025
0.050
0.075
0.100
0.125
0.150

Figure 8: Vault Cash/(Reported Net Trans + Sweeps)Banks Bound Before and After, Obs =113
After SweepNormal(0,1)
Panel A
Normalized Value
Den
sity
-4 -2 0 2 4
0.0
0.1
0.2
0.3
0.4
0.5
Before SweepNormal(0,1)
Panel B
Normalized Value
Den
sity
-4 -2 0 2 4
0.0
0.1
0.2
0.3
0.4
0.5
After SweepBefore Sweep
Panel C
Value
Den
sity
0.000 0.025 0.050 0.075 0.100 0.125 0.150
0.0
0.1
0.2
0.3
0.4
0.5
Panel D
After Sweep
Bef
ore
Sw
eep
0.000 0.025 0.050 0.075 0.100 0.125 0.150
0.000
0.025
0.050
0.075
0.100
0.125
0.150

Figure 9: Deposits at the Federal Reserve/(Reported Net Trans + Sweeps)Banks Bound Before and After, Obs =113
After SweepNormal(0,1)
Panel A
Normalized Value
Den
sity
-4 -2 0 2 4
0.00
0.08
0.16
0.24
0.32
0.40
0.48
0.56
0.64
Before SweepNormal(0,1)
Panel B
Normalized Value
Den
sity
-4 -2 0 2 4
0.00
0.08
0.16
0.24
0.32
0.40
0.48
0.56
0.64
After SweepBefore Sweep
Panel C
Value
Den
sity
0.000 0.025 0.050 0.075 0.100 0.125 0.150
0.00
0.08
0.16
0.24
0.32
0.40
0.48
0.56
0.64
Panel D
After Sweep
Bef
ore
Sw
eep
0.000 0.025 0.050 0.075 0.100 0.125 0.150
0.000
0.025
0.050
0.075
0.100
0.125
0.150

1. RAM, 2000 Method2. 2000 Method, No rr* Adjustment3. RAM, 1996 Method4. 1996 Method, No rr* Adjustment
Figure 10: RAM, 1991-1999B
illio
ns
of
Do
llars
1991 1992 1993 1994 1995 1996 1997 1998 1999-5
0
5
10
15
20
25
30
35
2.
1.
3.
4.