RESOLV INVENTORY PLANNING - SAP Gold Partnerachieveits.com/assets/whitepapers/Resolv 9.2 HANA -...
88
RESOLV INVENTORY PLANNING USER MANUAL Version 9.2 Desktop for HANA PRESENTED BY ACHIEVE IT SOLUTIONS Copyright 2010 - 2016 by Achieve IT Solutions
Transcript of RESOLV INVENTORY PLANNING - SAP Gold Partnerachieveits.com/assets/whitepapers/Resolv 9.2 HANA -...

RESOLV INVENTORY PLANNING
USER MANUAL
Version 9.2 Desktop for HANA
PRESENTED BY
ACHIEVE IT SOLUTIONS
Copyright 2010 - 2016 by Achieve IT Solutions

These materials are subject to change without notice. These materials are provided by Achieve
IT Solutions for informational purposes only, without representation or warranty of any kind,
and Achieve IT Solutions shall not be liable for errors or omissions with respect to the materials.
The use and copying of this document and the associated computer software is subject to
Achieve IT Solutions customer registration agreement. Any other use is prohibited.
Resolv is a trademark of Achieve IT Solutions.
SAP Business One is a trademark of SAP AG.
All other trademark or service marks are the property of their respective owners.
This documentation is as of Resolv version 92.000.60901
Achieve IT Solutions 640 Belle Terre Road Building B Port Jefferson, New York 11777 631-543-3200
RESOLV INVENTORY PLANNING
USER GUIDE
The Resolv Inventory Planning is part of the Resolv Suite, which has been certified by SAP as
conforming to SAP’s standards for Business One add-on solutions.

Table of Contents Overview ......................................................................................................................... 1
Desktop Components .................................................................................................. 1
Plus Mobility Components for HANA ........................................................................... 1
Introduction .................................................................................................................. 2
Replenishment ......................................................................................................... 3
Forecasting .............................................................................................................. 3
Inventory Planning Setups ........................................................................................... 5
Inventory Planning Configuration ............................................................................. 5
Inventory Usage Periods ........................................................................................ 13
Inventory Planning Service Scheduler ................................................................... 14
Item Groups Setup ................................................................................................. 15
Item Master Data .................................................................................................... 16
Business Partner Master Data ............................................................................... 19
Inventory Planning Procedures .................................................................................. 20
Summary of Procedures ........................................................................................ 20
Warehouse Item Planning ...................................................................................... 22
Monthly Resets ...................................................................................................... 34
Purchasing Reports ................................................................................................ 47
Inventory Planning Reports .................................................................................... 59
Suggestions for Special Situations ......................................................................... 67
Appendix I: Replenishment Formulas ........................................................................ 79
Sample Replenishment Calculations ...................................................................... 81
Appendix II: Replenishment and Forecasting Glossary ............................................. 82

1 | P a g e R e s o l v I n v e n t o r y P l a n n i n g U s e r G u i d e
Overview
The Resolv Distribution suite for HANA is a collection of functionality enhancements added to
the SAP Business One suite. The Suite is organized into Desktop components, which are add-ons
to the SAP Business One Client, and the Plus Mobility components which utilize the SAP FIORI
interface.
Desktop Components Inventory Planning
Order – to – Cash and Sales & Purchasing
Cross Sell
AR Collections
Data Messenger
Order Reservations
3PL
Container Management Desktop
EDI
Freight Management
Quality Control Desktop
Equipment Rental Desktop
Style
Plus Mobility Components for HANA Container Management Mobile
Quality Control Mobile
Rental Mobile
Warehouse Management Mobile
This document will focus on Inventory Planning.
2 | P a g e R e s o l v I n v e n t o r y P l a n n i n g U s e r G u i d e
Introduction
A prime concern of every distribution company is to determine when to procure stock items, and how
much of each one to order. SAP Business One with Resolv Inventory Planning provides three different
approaches to supply-chain management. Each company may select whichever method is most useful,
or different methods may be used for different groups of items or different sectors of the business.
MRP: This is the standard Business One supply management methodology. It includes the ability to include open Sales Orders, Purchase Orders, and Production Orders, as well as user-defined Forecasts to determine demand and supply over a pre-defined period of time. MRP procedures are not discussed in this manual.
Replenishment: This Resolv methodology is based on the formulas developed by Gordon Graham. It bases estimates of future demand on averages of past usage, lead times, and other factors calculated by the system.
Forecasting: This Resolv methodology is based on a set of formulas developed by Effective Inventory Management, Inc. They incorporate various trends and weighted averages along with past usage to predict demand. Forecasts are calculated by the system.
The object of supply-chain management, in all instances, is to provide a proactive approach to procuring
stock items. Rather than wait until someone notices that stock is getting low, the system establishes a
procedure to determine when each item should be ordered, and the quantity to order each time.
All of the methodologies require that various system settings and item-by-item settings be maintained
by users. Each one may be implemented by running a simple set of procedures for all or selected items,
which may be performed at any desired interval and for specific warehouses as needed.
The following section describes each of the Resolv Inventory Planning methods in more detail.
Note: Terms shown in red are defined in the glossary at the end of this manual.

3 | P a g e R e s o l v I n v e n t o r y P l a n n i n g U s e r G u i d e
Replenishment
This methodology is based on the work of Gordon Graham, as defined in Distribution Inventory
Management for the 1990’s, 1987, and subsequent publications. It defines a set of procedures for
determining procurement needs, while also providing flexibility to handle exception and unusual
situations. In addition, there are several options as to the methods used in the calculations, which may
be set individually by item and warehouse.
The primary assumption in the replenishment methodology is that future demand can be predicted by
past history. For that reason, the system keeps a monthly usage record of each item in each warehouse,
and computes an average usage figure for the past six months. It also tracks the lead time on receipts
and computes an average lead time.
Of course history does not repeat itself exactly. The user is able to manipulate a number of variables so
as to account for sales trends, product succession, unusual high or low sales, and so on.
In order to perform the required calculations and to keep the predictions current, it is necessary to run a
series of update programs. It is recommended that these updates be run on a monthly basis, but it is
possible to run them at any time. The updates will also provide a set of reports that can be used as
reference and to indicate items that might require more intensive investigation.
Forecasting
The Forecasting methodology is based on a series of documents by Effective Inventory Management,
Inc. It is designed to offer several different formulas that incorporate various timeframes, weightings,
and seasonality along with past usage to predict future demand. You may select those formulas that
seem relevant to your products and industry. Different formulas may be used at different times, or for
different items.
As with the Replenishment methodology, the Forecasting system uses historical data when predicting
future behavior of the items. The monthly usage figures are utilized in all of the formulas. However,
many of the formulas will also incorporate factors such as seasonality and sales trends.
The following formulas are available in this system:
Six Month Rolling Average – Average of the usage recorded in the previous six inventory periods.
Six Month Rolling Average w/ Standard Trend – Six month rolling average method with non-Seasonal trend factor.
Three Month Rolling Average – Average of the usage recorded in the previous three inventory periods.
Three Month Rolling Average w/ Standard Trend – Three month rolling average method with non-Seasonal trend factor.

4 | P a g e R e s o l v I n v e n t o r y P l a n n i n g U s e r G u i d e
Year Ago Upcoming 3 Months – Average the usage recorded last year in the inventory period being forecast and the following two inventory periods.
Weighted 3.0/2.5/2.0/1.5/1.0 – Weighted average of the usage recorded in the previous periods using the listed weights.
Weighted 3.0/2.5/2.0/1.5/1.0 w/ Standard Trend – Weighted average of the usage recorded in the previous periods using the listed weights with non-Seasonal trend factor.
Weighted 5.0/2.0/1.0 - Weighted average of the usage recorded in the previous periods using the listed weights.
Weighted 2.0/1.0 - Average the usage recorded last year in the inventory period being forecast and the following inventory period using the listed weights.
Weighted 2.0/1.0 w/ Seasonal Trend - Average the usage recorded last year in the inventory period being forecast and the following inventory period using the listed weights with the Seasonal trend factor.
Weighted 1.0/1.0/1.0 w/ Seasonal Trend - Average the usage recorded last year in the inventory period being forecast and the following two inventory periods with the listed weights and a Seasonal trend factor.
Weighted 1.0 w/ Seasonal Trend – Usage recorded in the inventory period being forecast last year with a Seasonal trend factor.
Weighted 4.0/1.0 w/ Seasonal Trend – Weighted average of the usage recorded last year in the period being forecast and the following period using the listed weights and a Seasonal trend factor.
Weighted TY3.0/LYPV2.0/9.0/3.0/1.0 – Weighted average of the usage in the previous period this year, and the upcoming periods last year, using the listed weights.
Weighted TY2.0/LYPV1.0/6.0/1.0 – Weighted average of the usage in the previous period this year, and the upcoming periods last year, using the corresponding weights.
Like the Replenishment system, the Forecasting methodology requires periodic recalculation to keep the
forecasts up to date. A similar set of update programs is available to perform these calculations.

5 | P a g e R e s o l v I n v e n t o r y P l a n n i n g U s e r G u i d e
Inventory Planning Setups
A number of initial setups are necessary when using the various features of Resolv Inventory Planning.
It is not required to enter setups for aspects of the program that will not be utilized, and you may enter
or change these settings at any time.
Inventory Planning Configuration
(Administration > Resolv Setup > Resolv Inventory Planning > IP Configuration)
Replenishment Tab

6 | P a g e R e s o l v I n v e n t o r y P l a n n i n g U s e r G u i d e
These options are used for the basic settings for the Replenishment methodology. The following fields
must be set appropriately in order for the system to function correctly.
Use Alternate Periods If you do not use a standard 12-period year for accounting purposes, or if you do not wish to use the standard SAP posting periods for tracking inventory usage, you may check this box to indicate that you will create alternative periods for use in the Inventory Planning programs. You must logoff and login to SAP Business One after changing this setting.
Default Procurement Method
Select the most common method for procuring items. This setting will be used as the default for all items; however, it may be changed by item and warehouse.
Buy
Make
Transfer
Set Qualified Usage to Actual
Check this box if you wish the qualified usage for each month to automatically default to the same quantity as the actual usage. If this box is not checked, the qualified usage will be set to zero until changed by the user. In either case, the qualified usage may be edited by the user.
Number of Usage Periods
Enter the maximum number of periods to store item usage. The minimum needed for replenishment calculations is 28; enter 999 for unlimited usage storage.
Date to Start Usage Tracking
Enter the date from which the system will start tracking item usage.
Warehouse Transfers Usage
Select the desired option for tracking usage when items are transferred from one warehouse to another.
Always Track – count usage on every transfer.
Do Not Track – never count usage on transfers.
Based on Replenishment Path – count usage if the item’s Replenishment Path is “transfer” and it is being transferred from the warehouse designated as the Replenishment Warehouse.
Default Safety Allowance
Enter the percentage of the safety stock allowance to be calculated for each item. This figure will be used as the default for all items; however, it may be changed by item and warehouse. The initial default is 50%.
Default Order Quantity Method
Select the default Order Quantity Method. This selection will be used as the default for all items; however, it may be changed by item and warehouse.
Economic Order Quantity
Movement Class
Manual

7 | P a g e R e s o l v I n v e n t o r y P l a n n i n g U s e r G u i d e
Default Restocking Method
Select the default Restocking Method. This selection will be used as the default for all items; however, it may be changed by item and warehouse.
Order Point / Line Point
Minimum / Maximum
Over Minimum Percentage
This field is used for items that use the Minimum/Maximum restocking method. It represents the percentage above the minimum quantity at which an order should be placed.
R Cost Dollars This figure represents the cost of replenishment. It is an estimate of the cost of processing each line item on a purchase order. The initial default is $5.00.
K Cost Percentage This figure represents the cost of warehouse overhead. It is expressed as a percentage of inventory value. The initial default is 30%. The recommended value is the prime rate of interest, plus 10.
Number of Lead Times to Average
Enter the number of lead times to use in computing the average lead times for items. Recommended figures would be from 2 to 6.
Review Cycle in Days Enter the number of days that is typical between orders for each vendor. For example, if you order from most vendors about twice a month, enter 15.
Use Movement Class Check if you wish to use Movement Class calculations.
Default Movement Class
Enter the number of the movement class to be entered for new items, from 1 to 14. The default value is 14. This selection will be used as the default for all items; however, it may be changed by item and warehouse.
Use Total Sales From Select the source for total sales figures.
Deliveries
Invoices
Orders
Resolv Processor Updates Usage
Check to use the Resolv Processor to calculate usage.
Additional Item Information Field
Enter the name of a field that contains item information that you would like to appear on various reports and screens within the Inventory Planning module. You may use any field in the Item Master table, including User-Defined Fields.
Use Last Purchase Price
Check to create Purchase Orders with same the unit price used on the last PO for the same Vendor / Item combination. Clear to determine the unit price based on the Price List Selection setting.

8 | P a g e R e s o l v I n v e n t o r y P l a n n i n g U s e r G u i d e
Allow Users to Edit Actual Usage
Check this box to let users with proper Inventory Planning authorizations (found in the SAP Authorizations screen) to manually edit the Actual Usage on item records.
Price List Selection Select either Vendor Default or Warehouse Select to determine the source of the unit price on the Purchase Orders that are created via the Create PO button on the Demand Action Report, Forecast Replenishment Report and Replenishment Report.
When Vendor Default is selected, the unit price on the PO defaults from the Price List associated with the Business Partner (Vendor).
When Warehouse Select is selected, the unit price on the PO defaults from the PO List Price column on the Inventory Data tab in Item Master Data.

9 | P a g e R e s o l v I n v e n t o r y P l a n n i n g U s e r G u i d e
Nonstocks Button
Use the Nonstocks button to associate an Item Property with each Warehouse. This association
determines which Warehouse(s) will have Item Warehouse records automatically created.
In the above example, if Item Property 3 (in Item Master) is ‘Y’ then an Item Warehouse record is
automatically created for the Port Jefferson, NY warehouse. If Item Property 1 is set to ‘Y then Item
Warehouse records are created the five warehouses indicated.

10 | P a g e R e s o l v I n v e n t o r y P l a n n i n g U s e r G u i d e
Create Usage Button
There is a button at the bottom of the screen labelled Create Usage that if you click, will clear all existing
usage and queue up all SAP transactions for the Resolv Server Processor to create new usage. If you
would like to do this, just click on it and say Yes to the prompt.

11 | P a g e R e s o l v I n v e n t o r y P l a n n i n g U s e r G u i d e
Forecast Tab
Forecast Demand formula
Select the default Forecast Demand formula to be used for new Item Warehouse records.
Forecast Low Level Percentage
Enter the value of the lower bound that defines unusual usage in the Unusual Usage Report.
Forecast High Level Percentage
Enter the value of the upper bound that defines unusual usage in the Unusual Usage Report.
Use Forecast Comparative Calculation
Check this selection to add the Forecast Comparative Calculation option to the SAP Business One menu. Clear this checkbox to remove it. You must logoff and login to SAP Business One after changing this setting.

12 | P a g e R e s o l v I n v e n t o r y P l a n n i n g U s e r G u i d e
Use Forecast Warehouse Item Demand Reset
Check this selection to add the Forecast Warehouse Item Demand Reset option to the SAP Business One menu. Clear this checkbox to remove it. You must logoff and login to SAP Business One after changing this setting.
Use Forecast Unusual Usage
Check this selection to add the Forecast Unusual Usage option to the SAP Business One menu. Clear this checkbox to remove it. You must logoff and login to SAP Business One after changing this setting.
Use Forecast Safety Stock
Check this selection to add the Forecast Safety Stock option to the SAP Business One menu. Clear this checkbox to remove it. You must logoff and login to SAP Business One after changing this setting.
Recalculate Safety Multiplier
Check this selection to make the Reset button is active on the Forecast Safety Stock screen; clear this checkbox to remove the Reset button.
Use Forecast Simulator Check this selection to add the Forecast Simulator option to the SAP Business One menu. Clear this checkbox to remove it. You must logoff and login to SAP Business One after changing this setting.
Use Forecast Ranking Analyzer
Check this selection to add the Forecast Ranking Analyzer option to the SAP Business One menu. Clear this checkbox to remove it. You must logoff and login to SAP Business One after changing this setting.
Note: Entries in the Inventory Planning Configuration provide default settings in Warehouse
Item Planning records as they are created. You may change these entries at any time.
However, changing fields in the Configuration will not change any Warehouse Item Planning
records that already exist in the system.

13 | P a g e R e s o l v I n v e n t o r y P l a n n i n g U s e r G u i d e
Inventory Usage Periods
(Administration > Resolv Setup > Resolv Inventory Planning > IP Usage Periods)
This program appears on the menu when “Use Alternate Periods” is selected in Inventory Planning
Configuration. You must logoff and login to SAP Business One after changing this setting.
Use this program to create an alternative set of periods for the purpose of tracking inventory usage. The
system will use these period codes for all functions within the Inventory Planning module, in place of the
standard Posting Periods.
Enter the year and the year name in the header. The system will automatically create twelve periods,
using the format shown above. You may change the period names if you wish.
The system will assume that the periods represent calendar months beginning with January. The
starting and ending dates for each period can be changed. Periods must not overlap; there cannot be
any gaps between periods.
You may add as many years as you wish. Be sure that periods exist for a new year before it begins.

14 | P a g e R e s o l v I n v e n t o r y P l a n n i n g U s e r G u i d e
Inventory Planning Service Scheduler
(Administration > Resolv Setup > Resolv Inventory Planning > IP Service Scheduler)
If you are using the Resolv Processor Creates Usage option, then you will need to setup a scheduler to
let the service know how often to run. Utilizing the IP Service Scheduler, along with the Resolv HANA
Processor (see the Resolv 9.2 HANA Installation and Setup Guide to learn how to set the processor up),
the system will auto create your usage records for you.
Give you scheduler setup a name, then choose the appropriate options for how often you would like the
processor to run for IP, and save your options. This will dictate to the Resolv HANA Processor when to
execute the IP usage service.

15 | P a g e R e s o l v I n v e n t o r y P l a n n i n g U s e r G u i d e
Item Groups Setup
(Administration > Setup > Inventory > Item Groups)
If necessary, use the View pull-down menu to view User-Defined Fields on the Item Groups setup
screen.
The Use Forecast Demand Formula field allows selection of a default formula to be used when this item
group is used for a new item. This setup applies to the Forecasting methodology only.
You may also indicate a default procurement method for the item group. You may select buy, make, or
transfer as methods.
16 | P a g e R e s o l v I n v e n t o r y P l a n n i n g U s e r G u i d e
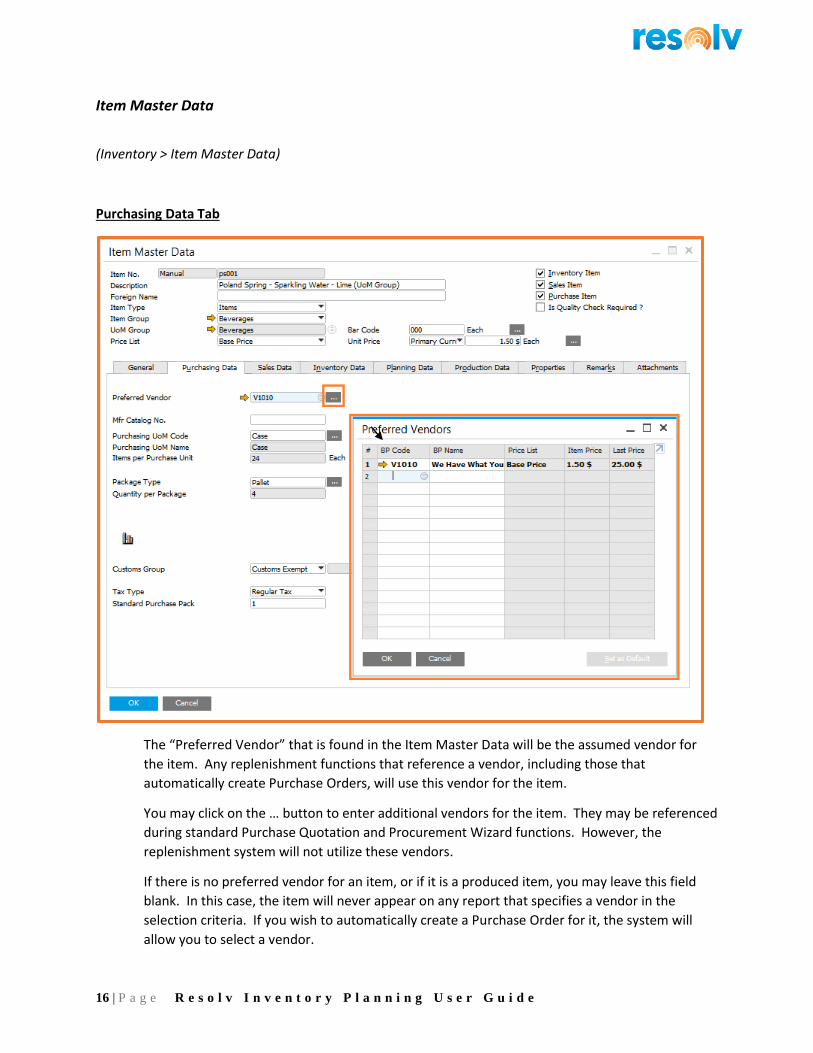
Item Master Data
(Inventory > Item Master Data)
Purchasing Data Tab
The “Preferred Vendor” that is found in the Item Master Data will be the assumed vendor for
the item. Any replenishment functions that reference a vendor, including those that
automatically create Purchase Orders, will use this vendor for the item.
You may click on the … button to enter additional vendors for the item. They may be referenced
during standard Purchase Quotation and Procurement Wizard functions. However, the
replenishment system will not utilize these vendors.
If there is no preferred vendor for an item, or if it is a produced item, you may leave this field
blank. In this case, the item will never appear on any report that specifies a vendor in the
selection criteria. If you wish to automatically create a Purchase Order for it, the system will
allow you to select a vendor.

17 | P a g e R e s o l v I n v e n t o r y P l a n n i n g U s e r G u i d e
Inventory Data Tab
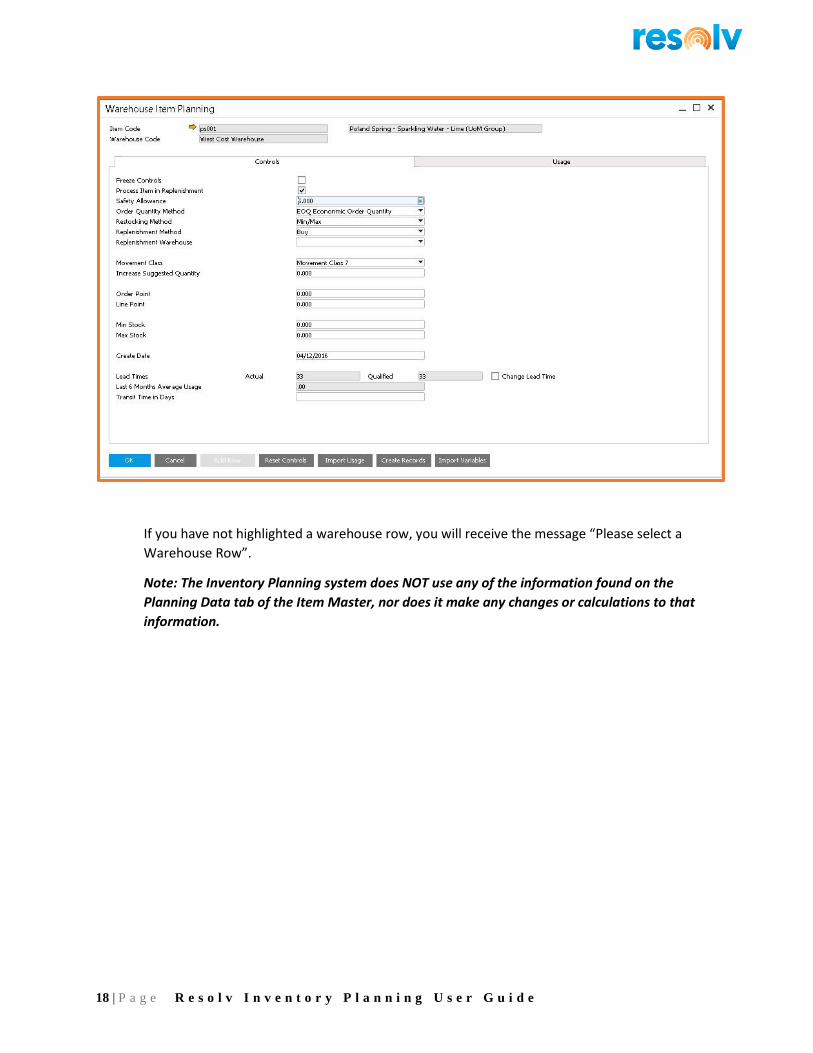
The “Whse/Item Plan” button opens the Warehouse Item Planning screen for this item for the
highlighted warehouse. The Warehouse Item Planning screen can also be launched via the right-
click menu from this screen.
If the record does not exist, it will create it as the screen opens.
18 | P a g e R e s o l v I n v e n t o r y P l a n n i n g U s e r G u i d e
If you have not highlighted a warehouse row, you will receive the message “Please select a
Warehouse Row”.
Note: The Inventory Planning system does NOT use any of the information found on the
Planning Data tab of the Item Master, nor does it make any changes or calculations to that
information.

19 | P a g e R e s o l v I n v e n t o r y P l a n n i n g U s e r G u i d e
Business Partner Master Data
(Business Partners > Business Partner Master Data)
Inventory Planning Tab
The fields on this tab are available only for vendors. They should be filled in as appropriate for the
preferred vendors of stock items.
Review Cycle in Days: Enter the number of days in the vendor’s review cycle. This is the number of days
that would normally elapse between orders to this vendor. For example, if you normally place two
orders per month with this vendor, enter 15 days.
$ Buying Target: Enter a target or minimum dollar amount for purchase orders to this vendor. The
system will show a warning message if you attempt to enter a purchase order that is below the buying
target. If you are using the order point/line point replenishment method, the system will prompt you to
increase purchases, if necessary, to reach the buying target.
Weight Buying Target: Enter a target or minimum weight for purchase orders to this vendor. The
system will show a warning message if you attempt to enter a purchase order that is below the buying
target. If you are using the order point/line point replenishment method, the system will prompt you to
increase purchases, if necessary, to reach the buying target.
Note: A dollar Buying Target or a Weight Buying Target can be entered, but not both.

20 | P a g e R e s o l v I n v e n t o r y P l a n n i n g U s e r G u i d e
Inventory Planning Procedures
Summary of Procedures
The following list provides a summary of the procedures that may be used on an ongoing basis in Resolv
Inventory Planning. Each is described in more detail in the rest of the manual.
1. As new items are added to the system, be sure that the Warehouse Item Planning records are set with the most appropriate variables for order quantity method and replenishment method.
2. Daily procedures:
a. Run the Demand Action Report for items using Replenishment. This will identify items that are at or below their minimum or order point. Create Purchase Orders, Transfer Requests, or Production Orders if needed.
b. Run the Replenishment Report for items using Replenishment that have vendors that are due for orders. This will identify items that are in need of procurement before the next scheduled order date for these vendors. Create Purchase Orders, Transfer Requests, or Production Orders if needed.
c. Run the Forecast Replenishment Report for items using Forecasting that have vendors that are due for orders. This will identify items that are in need of procurement before the next scheduled order date for these vendors. Create Purchase Orders, Transfer Requests, or Production Orders if needed.
3. Monthly procedures:
a. Run the Zero Usage program (available as a button on the Movement Class Reset, Warehouse Item Controls Reset, and Forecast Warehouse Item Demand Reset screens). This program creates zero-usage records for all months in which items had no sales. It is important to run this program each month, before running any of the reset programs.
b. Run the Movement Class Reset program for all items in selected warehouses. This will reset each item’s movement class rank in comparison to all items in the warehouse. Movement Class may be used in Replenishment calculations, and is also valuable when analyzing an item’s sales behavior.
c. Run the Warehouse Item Controls Reset program for items using Replenishment. This will reset each item’s order quantity and replenishment controls (min/max or order point/line point).

21 | P a g e R e s o l v I n v e n t o r y P l a n n i n g U s e r G u i d e
d. Run the Forecast Ranking Analyzer program for all items in selected warehouses. This is will reset each item’s forecast rank in comparison to all items in the warehouse. The forecast rank is valuable when analyzing an item’s sales behavior.
e. Run the Forecast Warehouse Item Demand Reset program for items using Forecasting. This will reset each item’s demand level for the next six months, based on the formula selected. You may run the program multiple times with different selections of items and formulas.
f. If you have chosen to have the system recalculate the safety multiplier, then run the Forecast Safety Stock program. This will analyze each item’s usage history and determine how much safety stock is necessary in future months.
4. Other procedures – perform as desired. Most reports can be run for specific items, item groups, and/or warehouses.
a. Run the Procurement Report to see projected quantities of items on various dates, based on existing supply and demand documents.
b. Run the Quantity Report to see items on either supply or demand documents.
c. Run the Surplus Report to see items whose available quantity exceeds their maximum or line point.
d. Run the Forecast Comparative Calculation program to see a comparison of the different Forecast formulas as well as a detailed usage history for a specific item.
e. Run the Unusual Usage Report to see items where qualified usage was outside the normal range compared to the forecast.
f. Run the Demand Simulator to see the results of manipulating variables when calculating replenishment values.

22 | P a g e R e s o l v I n v e n t o r y P l a n n i n g U s e r G u i d e
Warehouse Item Planning
(Resolv > Resolv Inventory Planning > Warehouse Item Planning)
For each warehouse/item combination, a record is created in the Warehouse Item Planning table. The
record is created automatically the first time there is activity for the item in that warehouse, or the
record may be created manually by the users. This record contains information that is used by the
system in calculating replenishment and/or forecasting for the item in that warehouse.
Display Tabs
Controls Tab
This tab relates to the Replenishment methodology. It contains settings that are unique to this item in
this warehouse. Most of the entries will default from the Replenishment Configuration, but it is
important to make adjustments as needed for individual items.
Freeze Controls Check if you wish all control settings to remain as they are, without any recalculations by the system. Controls may be manually changed if desired. The default for this field is “No”.

23 | P a g e R e s o l v I n v e n t o r y P l a n n i n g U s e r G u i d e
Process Item in Replenishment
Check if you wish the item to be included in replenishment calculations by the system. The default for this field is “Yes”.
Safety Allowance Enter the percentage of the safety stock allowance to be maintained for this item in this warehouse.
Order Quantity Method Enter the order quantity method for this item in this warehouse.
Economic Order Quantity
Movement Class
Manual
Restocking Method Enter the restocking method for this item in this warehouse.
Order Point / Line Point
Minimum / Maximum
Replenishment Method Select the replenishment method for this item in this warehouse. This would be the method most likely to be used to procure the item when stock is low. You may select:
B – Buy
M – Make
T – Transfer
Replenishment Warehouse For items where the Replenishment Method is “Transfer”, enter the warehouse from which the item is most likely to be transferred.
Increase Suggested Quantity
This is the quantity that will be recommended for replenishment orders. It may be entered manually or calculated by the system.
Movement Class If enabled, enter the movement class from 1 to 14 for this item in this warehouse. After 12 months usage has been accumulated, the system can recalculate the movement class.
Order Point For items using the Order Point / Line Point restocking method, this is the quantity of the order point. It may be entered manually or calculated by the system.
Line Point For items using the Order Point / Line Point restocking method, this is the quantity of the line point. It may be entered manually or calculated by the system.
Min Stock For items using the Minimum / Maximum restocking method, this is the quantity of the minimum. It may be entered manually or calculated by the system via the Reset Controls function.

24 | P a g e R e s o l v I n v e n t o r y P l a n n i n g U s e r G u i d e
Max Stock For items using the Minimum / Maximum restocking method, this is the quantity of the maximum. It may be entered manually or calculated by the system via the Reset Controls function.
Create Date This is the date on which the warehouse/item record was created. It will be entered automatically by the system.
Lead Times Actual The calculated average lead time for the item in this warehouse is displayed. This represents the number of days between the date a Purchase Order or Production Order is entered, and the date the item is received. It is averaged according to the number of receipts specified in the Inventory Planning Configuration.
Lead Times Qualified If desired, you may enter a different lead time, if you feel that the average lead time is not an accurate predictor for future orders. The system will use the Qualified Lead Time in all calculations.
Change Lead Time You must check this box in order to manually enter the Qualified Lead Time.
Last 6 Months Average Usage
The average usage for the item in this warehouse is displayed.
Transit Time in Days Enter in the number or in transit days for this item. This field work in conjunction with Resolv Order Reservations. For more information see that section in this document.

25 | P a g e R e s o l v I n v e n t o r y P l a n n i n g U s e r G u i d e
Forecast Tab
This tab relates to the Forecast methodology. These fields contain settings that are unique to this item
in this warehouse.
Safety Multiplier Enter the safety multiplier percentage for this item in this warehouse. It may be entered manually; if “Recalculate Safety Multiplier” was chosen it can be calculated via the Reset button in Warehouse Item Controls Reset.
Target Inventory Turns Enter the number of turns per year that is the target for this item in this warehouse.
Forecast Ranking Enter the ranking for this item, compared to total sales in the warehouse. This entry can be calculated via the Forecast Ranking Analyzer. Choices for this field are:
A – Top 80 %
B – Next 15%
C – Next 4%
D – Last 1%
X – No Sales

26 | P a g e R e s o l v I n v e n t o r y P l a n n i n g U s e r G u i d e
Forecast Formula Select the formula to be used to generate forecasts from sales history for this item / warehouse.
Last Forecast Formula Used
The system will display the formula last used to calculate forecasts for this item.
Date Reset Displays the date of the last time Reset Demand was performed for this item / warehouse.
Demand Period 1 – 6 These six fields display the forecast amount for each of the next six months. The system may calculate these figures, based on the formula displayed above, or they may be entered by the user.
Usage Tab
This screen contains the usage information for each month since the creation of the individual
warehouse/item record.
Qualified and actual usage appear for each period. Actual usage is calculated from the following
transactions:
Sales Deliveries or Invoices, depending on the ‘Use Total Sales From’ setting in Inventory Planning Configuration

27 | P a g e R e s o l v I n v e n t o r y P l a n n i n g U s e r G u i d e
Goods Issue transactions
Issues for Production transactions
Customer Returns – negative usage
Warehouse Transfers – depending on the ‘Warehouse Transfers Usage’ setting in Inventory Planning Configuration
Qualified usage may be edited to reflect real-world conditions that affected past sales but should not
affect inventory planning. The actual usage may not be changed, except by the user ‘manager’.
If ‘Set Qualified Usage to Actual’ is checked in Inventory Planning Configuration then usage is
automatically set to the actual usage value for each month. If ‘Set Qualified Usage to Actual’ is cleared,
then the qualified usage will be set to zero for each month.
NOTE: All calculations in the system that include usage use qualified usage, not actual usage.
The following are examples where changes should be made to qualified usage:
A new item may be expected to have usage similar to an existing item. You may wish to create hypothetical usage in order to calculate replenishment for the item before it has had a chance to accumulate actual usage.
An item’s usage may be skewed by unusual circumstances, such as a single large buy from a particular customer, shipping delays, quality problems, etc. You may wish to enter qualified usage to reflect the item’s expected demand, rather than allowing the average to be too high or low.
An item may be expected to change its usage pattern, due to a newer version becoming available, the loss of a major customer, or other circumstances. You may wish to change the qualified usage so that the average reflects the new demand level.
Buttons
Qualified Usage by Year
Actual Usage by Year

28 | P a g e R e s o l v I n v e n t o r y P l a n n i n g U s e r G u i d e
Use the Qualified Usage by Year and Actual Usage by Year buttons to display usage history by calendar
month regardless of the period setup.
Action Buttons
In addition to the usual Add/Update and Cancel buttons, the Warehouse Item Planning screen has a
number of buttons that can be used to perform various functions.
Add Row This button may be used on the Usage tab to add a new row to the grid.
Reset Controls This button may be used on the Controls tab. When pressed, the system will recalculate either the minimum and maximum quantities or the order point and line point quantities; it will also calculate the order quantity. You may change the qualified usage or various parameters, such as the order quantity method, replenishment method, and safety allowance, and reset the controls to see what differences will result. The new values will be saved when the record is updated.
Reset Demand This button may be used on the Forecast tab. When pressed, the system will recalculate the demand for the next six months, using the formula shown on the screen. Note that it is not possible to change the formula from this screen; however, you may change qualified usage and then reset the demand to see what differences will result. The new values are saved when the record is updated.
Import Usage This button is used to import usage data for some or all items. It is particularly useful when a company is first starting to use Resolv Inventory Planning, and no usage history exists yet in the system. If the data is available from some other source, it can be imported from a spreadsheet.
A confirmation message appears allowing you to proceed.

29 | P a g e R e s o l v I n v e n t o r y P l a n n i n g U s e r G u i d e
Click No to cancel and return control to Warehouse Item Control. Click Yes to continue the
import process.
A message will appear laying out the proper file format for import (note the Date Format)
Click OK and a Windows File Open screen appears. Indicate the location of the usage import file.
Navigate to the desired file and click the Open button to select it and proceed to the next step.
Supported file types are comma separated values (.csv) and text files (.txt). Use the Excel Save
As function to save spreadsheets in one of these formats.
After a file is selected, the system prompts if the file contains individual transactions or Totals.
Select Transactions when each row in the import file corresponds to a shipment (i.e. Delivery or
Invoice).

30 | P a g e R e s o l v I n v e n t o r y P l a n n i n g U s e r G u i d e
Select Totals when the data in the file is rolled up by Inventory Planning period. When Totals
are selected the system prompts if current usage data should be cleared. Select Yes to remove
all usage data for each item found in the import file. When the Usage Import completes the
only usage data for items in the import file will be the data imported from the file. Select No to
leave existing usage data as is and insert the usage data from the file. (The clear current usage
option is not available when importing Transactions).
The system confirms your settings prior to performing the Usage Import.
Click Yes to proceed and No to cancel the import process.
For each item/warehouse record in the usage import file, the system will create a Warehouse
Item Planning record if it does not exist, and will enter the usage for the period indicated. Note
that the period codes must exist in the Business One Posting Periods table.
Create Records This button will create blank warehouse item records for all items in all
warehouses, if they do not already exist. Only default information will be entered, based on the
Inventory Planning configuration and the Item Group setup. The time needed to perform this
function is based on the number of Item records and the number warehouses.
Import Variables This button may be used to import variables on the Controls and Forecasting
tabs. It is particularly useful if you wish to change various settings, such as the safety allowance
or order quantity method, for a large number of records at once. You may create a spreadsheet
that includes all of the items you wish to change, along with the desired values in the
appropriate columns.
A confirmation message appears allowing you to proceed.

31 | P a g e R e s o l v I n v e n t o r y P l a n n i n g U s e r G u i d e
Click No to cancel and return control to Warehouse Item Planning. Click Yes to continue the
import process.
The following message appears documenting the format of the import file.

32 | P a g e R e s o l v I n v e n t o r y P l a n n i n g U s e r G u i d e
Click OK and a second window appears documenting the valid options for the Forecast Formula
field (Column 20 / T).
Click OK and a Windows File Open screen appears. Indicate the location of the variables import
file. Navigate to the desired file and click the Open button to select it and proceed to the next
step.
Supported file types are comma separated values (.csv) and text files (.txt). Use the Excel Save
As function to save spreadsheets in one of these formats.
For each item/warehouse record in the import file, the system will create a Warehouse Item
Planning record if it does not exist, and will enter the variables as indicated.
Note: A template for this spreadsheet is available; you may request it from your Resolv
support consultant.

33 | P a g e R e s o l v I n v e n t o r y P l a n n i n g U s e r G u i d e
Creating Warehouse Item Planning Records
There are several methods for creating Warehouse Item Planning records:
Manual: You may use the ADD mode to create records as needed.
Automatic: The system will automatically create a Warehouse Item Planning record for an item the first time usage is recorded for the item in a particular warehouse. Default values will be used for all variables.
Special Items: As we saw above, if desired, you may designate one or more item properties to indicate items that require special treatment by the replenishment system. These properties must be specified in the Inventory Planning Configuration. When a new item is added that has one of these properties checked, the system will create records for that item in all warehouses. The following settings will be entered, regardless of the system defaults:
o “Freeze Controls” is set to “Yes” o The Restocking Method is set to “Min/Max” o The minimum quantity is set to zero o The maximum quantity is set to zero o The safety allowance is set to zero
o These settings ensure that the item will not be suggested for replenishment unless orders have been entered for it (i.e., the available quantity is negative). In that case, the suggested order quantity will be the amount needed to fill the orders, without any extra stock.
o If the item later becomes a stock item, you may change the settings as needed.
Whse/Item Plan button on the Item Master: As we mentioned earlier, if you click on this button and no inventory planning record exists, it will create one.
Import programs: The import programs (import usage and import variables) will create new records for items that are listed on the import file but do not have existing records in the Warehouse Item Planning table. Note that all settings not included in the import file will be set according to system defaults.
Create Records program: As discussed above, the “Create Records” button will create records for every item/warehouse combination that does not already exist in the Warehouse Item Planning table. System defaults will be used.

34 | P a g e R e s o l v I n v e n t o r y P l a n n i n g U s e r G u i d e
Monthly Resets
Although all of the fields described in the previous sections may be entered or edited by the user, it
would be extremely time-consuming to monitor every field for every warehouse/item record. In
addition, it is preferable to use tested and documented formulas to make these calculations, rather than
to allow individuals to change the settings based on hunches or incomplete data.
The following programs may be used to reset various replenishment values.
Zero Usage
Average usage is a critical element in many of the replenishment calculations. It is computed
automatically by the system as the average of the previous six months’ usage. As indicated earlier,
usage is entered whenever a relevant document (delivery or invoice, issue for production, return, and
possibly inventory transfer) is added to the system. Usage is always posted to the month in which the
document is entered.
If an item has no usage for a given month, then no usage record is created for that month. This will
cause the average usage to be incorrect. Here is an example:
Month Qualified Usage
January 100
February 125
April 50
May 75
July 40
August 50
In September, the system will calculate the total sales for the last six usage records as 440, with an
average usage of 73.33. But the usage records should actually be the following:
Month Qualified Usage
January 100
February 125
March 0
April 50
May 75
June 0
July 40
August 50

35 | P a g e R e s o l v I n v e n t o r y P l a n n i n g U s e r G u i d e
Again taking the last six months in September, the total usage was actually 215, with an average usage
of 35.83. This is the true demand level for that period of time.
In order to create the zero-usage records for each month, it is necessary to run the “Zero Usage”
program. This should be done each month, before running any of the other reset programs. You can
run this program by means of the “Zero Usage” button at the bottom of the screen in the Movement
Class Reset, Warehouse Item Controls Reset, and the Forecast Warehouse Demand Reset screens.
It is only necessary to run the program once each month for each warehouse, from whichever screen
you wish. Be sure that the screen is set to display all items from the warehouse, and that all are
selected.
See further instructions in the sections below.

36 | P a g e R e s o l v I n v e n t o r y P l a n n i n g U s e r G u i d e
Movement Class Reset
(Resolv > Resolv Inventory Planning > Monthly Resets > Movement Class Reset)
The Movement Class represents each item’s relative rank in sales compared to all of the other items in
the warehouse. There are 12 movement classes for active items, with class 1 being the highest dollar
value of units sold. Movement class 13 represents dead stock or items that have not sold in the past 12
months. Movement class 14 represents new items that have not yet accumulated 12 months of usage.
Movement Class is calculated by taking the total cost of all units of an item sold in the past 12 months,
and determining its percentage of the total of all sales in that warehouse. Items in high movement
classes will generally be high in both cost and quantity, while items in low movement classes will
generally be low-value items with few sales.
The Movement Class listing provides an excellent tool for understanding which items are contributing
the most towards sales activity. For that reason, it is recommended that the classes should be reset and
the resulting listing printed at least once each year. However, if the Movement Class is also used as an
Order Quantity method for all or some of the items, the classes should be reset monthly.
Filters
Vendor Enter a vendor or leave blank to include all vendors
Warehouse Code Enter a warehouse code or select “All Warehouses” to not use this filter
Item Group Enter an item group or select “All Item Groups” to not use this filter

37 | P a g e R e s o l v I n v e n t o r y P l a n n i n g U s e r G u i d e
Click on the “Display” button.
The screen will display the items specified. For each item the item code / description, vendor code /
name, item group, current movement class, qualified usage, the value of the units sold and the
percentage which that item represents of the total warehouse COGS are displayed. The system
calculates the new movement class, based on the current total COGS. If an Additional Information Field
was specified in Inventory Planning Configuration then a column for the indicated field appears after the
item description.
To update the movement class in the Warehouse/Item records, click on the “Reset” button. The new
movement class will then be duplicated in the current MC column, and the Warehouse/Item records will
be changed accordingly.
Note: While you may wish to examine the movement classes of one item group at a time, the system
cannot recalculate new movement classes unless all of the items in the warehouse are included.
Therefore, the “Reset” button is only available when all item groups are displayed.
Buttons
Reset: Use the Reset button to update the current Movement Class (Current MC Column) with the recalculated Movement Class (New MC column).
Zero Usage: Before resetting the Movement Classes, you can use this button to set any periods that have no sales of an item to zero. This ensures that the month will not be skipped in computing the item’s total usage for the past 12 months.
o The Zero Usage button is available only for SAP Business One users who have the Superuser indicator checked in the Users – Setup screen. This button is not visible to Non-superusers.
Clear Old Usage If the system is set for a limited number of months to store usage history, you may use this button to clear usage records for any months beyond the maximum number set in the Inventory Planning Configuration.

38 | P a g e R e s o l v I n v e n t o r y P l a n n i n g U s e r G u i d e
Warehouse Item Controls Reset
(Resolv > Resolv Inventory Planning > Monthly Resets > Warehouse Item Controls Reset)
The replenishment system is based on each item’s restocking controls (order point and line point, or
minimum and maximum), and its order quantity. For most items, this information must be recalculated
monthly in order to achieve the most accurate analysis of when to procure additional stock, and how
much to procure at a time. Warehouse Item Controls Reset recalculates these values.
The program may be run for one warehouse at a time. You may select a single item group, or combine
all item groups.
Filters
Warehouse Code: Select the warehouse
Item Group: Enter an item group or select “All Item Groups” to not use this filter
The list of selected items is displayed. For each item, the screen shows the item code and description,
item group, safety allowance, movement class, order quantity method, current order quantity,
restocking method, current order point and line point or current minimum and maximum, average lead
time, qualified usage, and number of periods included in the usage.
To reset these values, select one or more items and click on the “Reset” button. (You may click on
“Select All” to select all of the items on the list.) Using the order quantity method and restocking
method for each item, the system will recalculate the order quantity and order point/line point or
minimum/maximum quantities. The list will be re-displayed when the calculations are completed.

39 | P a g e R e s o l v I n v e n t o r y P l a n n i n g U s e r G u i d e
Note: The reset may also be performed for a single warehouse/item record by pressing the “Reset
Controls” button on the Warehouse Item Planning record.
The following calculations are performed:
1. Order Quantity: The order quantity method determines how much of each item should be procured. The setting for each item is found in the Warehouse/Item record. There are three options:
a. Economic Order Quantity
This method balances the cost of warehousing (e.g., buying large quantities), against the
cost of replenishment (e.g., buying frequently):
EOQ =
24 x Cost of Replenishment (R$) x Usage Rate
Cost of Carrying Inventory (K%) x Unit Cost
b. Movement Class
This method uses the movement class rank of each item to determine its order quantity:
Movement Class 1: Order quantity = 1 month’s usage
Movement Class 2: Order quantity = 2 month’s usage
Movement Class 3: Order quantity = 3 month’s usage
Etc.
Movement Class 12: Order quantity=12 month’s usage
c. Manual
This method uses no computer-generated calculations. You enter the desired quantity;
the computer will not change it at any point. You must monitor the quantity and change
it to fit changing conditions.

40 | P a g e R e s o l v I n v e n t o r y P l a n n i n g U s e r G u i d e
2. Restocking Quantities: The Restocking Method determines when an item is in need of procurement. The setting for each item is found in the Warehouse/Item record. There are two options:
a. Order Point / Line Point
For each item, there is a range of acceptable quantities. If the item falls below the
range, it is in danger of going out of stock before replacements can arrive; if it is above
the range, then there is a surplus which cannot be sold within a reasonable time. The
low point of the range is the Order Point, and the high point is the Line Point.
Order Point = (Usage Rate x Lead Time) + Safety Allowance
Line Point = Order Point + Usage during Review Cycle
During replenishment calculations, the system groups Order Point/Line Point
items by vendor and brings the total order up to the vendor’s Buying Target.
b. Minimum / Maximum
This method also establishes a range of quantities for each item.
Minimum = (Usage Rate x Lead Time) + Safety Allowance
(Note: This is the same calculation as the Order Point)
Maximum = Minimum + % Above Minimum + Order Quantity
With this method, each item is considered individually, and no provision is made for
reaching the vendor’s Buying Target.
Buttons
Select All Selects all rows in the grid
Zero Usage Before resetting the replenishment controls, you may use this button to set any periods for which there were no sales of an item to zero. This ensures that the month will not be skipped in computing the item’s average usage for the past 6 months.
o The Zero Usage button is available only for SAP Business One users who have the Superuser indicator checked in the Users – Setup screen. This button is not visible to Non-superusers.
Clear Old Usage If the system is set for a limited number of months to store usage history, you may use this button to clear usage records for any months beyond the maximum number set in the Inventory Planning Configuration.

41 | P a g e R e s o l v I n v e n t o r y P l a n n i n g U s e r G u i d e
Forecast Ranking Analyzer
(Resolv > Resolv Inventory Planning > Monthly Resets > Forecast Ranking Analyzer)
The Forecast Ranking Analyzer computes the relative rank of each item in the warehouse.
Filters
Warehouse Code Select the warehouse
Enter the warehouse, and click on the “Display” button.
The total cost of goods sold for the warehouse is shown at the top of the screen. Each item is shown,
ranked according to its qualified cost of goods sold (the total usage multiplied by the unit cost of the
item). The item’s percentage of the total warehouse COGS is also shown. Finally, each item’s rank is
determined, according to this formula:
A – Top 80 %
B – Next 15%
C – Next 4%
D – Last 1%
X – No Sales

42 | P a g e R e s o l v I n v e n t o r y P l a n n i n g U s e r G u i d e
To update the warehouse/item records with the new rankings, highlight the desired items and click on
the “Reset” button.
Buttons
Display Displays the selected items. For each item, the screen shows the item number / description, the cost of goods sold for the qualified usage, the calculated rank based on the rank determination logic described above. If an Additional Information Field was specified in Inventory Planning Configuration then a column for the indicated field appears after the item description.
Reset Click the Reset button to apply the calculated ranking. Rank information is saved in the warehouse/item records.

43 | P a g e R e s o l v I n v e n t o r y P l a n n i n g U s e r G u i d e
Forecast Warehouse Item Demand Reset
(Resolv > Resolv Inventory Planning > Monthly Resets > Forecast Warehouse Item Demand Reset)
This program is the primary tool for setting demand forecasts. It will calculate six months’ estimated
demand, based on whichever formula you select. These figures will be stored in the warehouse/item
record.
Filters
Vendor Enter a vendor or leave blank to include all vendors
Item or Partial Item Code Enter an item code or partial item code, or leave blank to include all items.
Warehouse Code Select the warehouse
Item Group Enter an item group or select “All Item Groups” to not use this filter
Use default formula for item Select this checkbox to generate the forecast based on the formula associated with each item. Alternatively, clear this checkbox to enable the Formula field; the formula specified will be used for all rows in the grid instead of using the item’s forecast formula.

44 | P a g e R e s o l v I n v e n t o r y P l a n n i n g U s e r G u i d e
Formula Select the formula to be used in this screen’s calculations. This field is enabled when Use default formula for item is cleared.
Buttons
Display Displays the selected items. For each item, the screen shows the vendor, item number and description, the current demand forecast for 6 months, the total qualified usage, and the number of months for the usage. If an Additional Information Field was specified in Inventory Planning Configuration then a column for the indicated field appears after the item description.
Reset To reset the forecasts, select one or more items and click on the “Reset” button. (You may click on “Select All” to select all of the items on the list.) The system will recalculate and re-display the six forecast periods. These figures will be automatically saved in the warehouse/item records.
Note: You may change the formula on the screen and reset the forecasts again, as many times as
you wish.
Select All Use this button to select all the rows in the grid for processing.
Zero Usage Before resetting the forecasts, you may use this button to set any periods for which there were no sales of an item to zero. This ensures that the month will not be skipped in computing the item’s average usage over the period of time used by the forecast formula.
o The Zero Usage button is available only for SAP Business One users who have the Superuser indicator checked in the Users – Setup screen. This button is not visible to non-superusers.
Clear Old Usage If the system is set for a limited number of months to store usage history, you may use this button to clear usage records for any months beyond the maximum number set in the Inventory Planning Configuration.

45 | P a g e R e s o l v I n v e n t o r y P l a n n i n g U s e r G u i d e
Forecast Comparative File Creation
(Resolv > Resolv Inventory Planning > Monthly Resets > Forecast Comparative File Creation)
The Forecast Comparative File Creation screen will perform a Forecast Comparative Calculation (which
we will discuss later in this document) to determine the recommended forecast formula for a range of
items screen. It then will create an export file with the calculated information so that you can turn
around and import it back into the system, thus updating your items according to the suggestions.
Filters
Vendor Enter a vendor or leave blank to include all vendors
Buyer Enter a buyer or leave blank to include all buyer
Item or Partial Item Code Enter an item code or partial item code, or leave blank to include all items
Warehouse Code Select the warehouse
Item Group Enter an item group or select “All Item Groups” to not use this filter
File Name and Path Enter the full path and file name for the file to be generated by this process
Buttons
Generate File This button will create two files (see below) based on your selected filters and the Forecast Calculations
Import Variables This button launches the Import Variable function that we saw earlier in this document in the Warehouse Item Planning section
After you enter your filters and select your output file directory, you can click on the Generate File
button. The system will then confirm that you want to create the files, and if you say yes then it will
begin exporting. Note, if there is already a file in that destination with the same name it will ask you if
you want to overwrite it or not.

46 | P a g e R e s o l v I n v e n t o r y P l a n n i n g U s e r G u i d e
Once the export has completed you will be left with two files; An Import File, which you can use to
import back in the suggested forecast formula using the Import Variables function (explained earlier in
this document); and an Archive file, which will have “Save” on the end of its name, that you can keep for
reference or use to import in to undo previously imported formulas.
As you can see from the screenshot, the export file will have 3 columns filled in. The first has the item,
the second has the warehouse, and the third, all the way over to the right, will be the recommended
forecast formula code (see the below table for definitions). The reason it is all the way in that column is
so it is lines up correctly for the Import Variables file format.
Code Formula
01 Six Month Rolling Average
02 Six Month Rolling Average w/4 Trend
03 Three Month Rolling Average
04 Three Month Rolling Average w/ 4 Trend
05 Year Ago Upcoming 3 months
06 Weighted Std 3.0/2.5/2.0/1.5/1.0
07 Weighted Std 3.0/2.5/2.0/1.5/1.0 + Trend
08 Weighted Std 5.0/2.0/1.0
09 Weighted Sea 2.0/1.0
10 Weighted Sea 2.0/1.0 + Seasonal Trend
11 Weighted Sea 1.0/1.0/1.0+Sea Trend
12 Weighted Sea 1.0+ Seasonal Trend
13 Weighted Sea 4.0/1.0+SeaTrend
14 Weighted Sea TY3.0/LYPV2.0/9.0/3.0/1.0
15 Weighted Sea TY2.0/LYPV1.0/6.0/1.0

47 | P a g e R e s o l v I n v e n t o r y P l a n n i n g U s e r G u i d e
Purchasing Reports
When all system controls are set and replenishment variables have been calculated, the system may be
used to make recommendations for procurement. There are several reports that may be used to
determine which items are due for restocking.
Demand Action Report
(Resolv > Resolv Inventory Planning > Purchasing Reports > Demand Action Report)
It is recommended to run the Demand Action Report daily. It will display only items that are already
below their minimum or order point quantity. These are items for which proactive purchasing is no
longer possible – they are in need of immediate procurement.
Filters
Buyer Enter a buyer or leave blank for all buyers. Buyers can be associated with Business Partners (Vendors).
Vendor Enter a vendor code or leave blank to include all vendors
Warehouse Code Enter a warehouse code or select “All Warehouses” to not use this filter

48 | P a g e R e s o l v I n v e n t o r y P l a n n i n g U s e r G u i d e
Item Group Enter an item group or select “All Item Groups” to not use this filter
Replenishment Method Select Buy, Make, or Transfer
For each item, the screen displays the item code and description, item group, procurement method,
available and on order quantities, future demand, restocking method, movement class, order point and
line point or minimum and maximum quantities, order quantity, buying targets for the vendor, sales and
purchasing blanket orders, and purchasing standard pack. If an additional identification field has been
designated in the Inventory Planning Configuration, it will be displayed to the right of the item
description.
The suggested quantity is calculated by the normal replenishment formulas, with the addition of the
amount below the minimum or order point. If the purchasing standard pack is greater than one, then
the suggested quantity will be raised to the next highest multiple of the purchasing standard pack. You
may change the suggested order quantity if you wish.
If desired, this screen may also be used to create Purchase Orders, Production Orders, Transfer
Requests, and Vendor Quote Requests. Highlight the items to be procured by one of the methods, and
click on the “Create PO”, “Create Production”, or “Create Transfer” button. Please note the following:
In the case of Purchase Orders, the system will use the preferred vendor for the item, as shown on the screen. If there is no preferred vendor, or if you have selected items with multiple vendors, the system will ask which vendor to use. All of the selected items will be placed on a purchase order for the same vendor.
In the case of Production Orders, the system will use the Bill of Materials that is in the system for each item. A separate Production Order will be created for each highlighted item. If no Bill of Materials exists for a selected item, a message will appear indicating that it is not possible to create a Production Order.
In the case of Transfer Requests, the system will create a Transfer Request document for a transfer into the warehouse that is displayed. You will be able to specify which warehouse to transfer the items from.
After one set of documents has been created, you may select other items and create additional
documents.
Buttons
Display Displays items matching the filters entered and that have an available quantity that is below the minimum or order point.
Create PO Creates purchase orders for the selected rows.

49 | P a g e R e s o l v I n v e n t o r y P l a n n i n g U s e r G u i d e
Create Production Creates production orders for the selected rows.
Create Transfer Creates transfer requests for the selected rows.
ATP If you highlight a row and click this button, the standard SAP Available to Promise screen will open for that item.
Note, you are not required to use the procurement method specified for each item; for example, an
item with a transfer method may be purchased. Also, quantities shown for items on sales blanket
orders and purchase blanket orders are for information only, and are not included in the
replenishment calculations.

50 | P a g e R e s o l v I n v e n t o r y P l a n n i n g U s e r G u i d e
Replenishment Report
(Resolv >Resolv Inventory Planning > Purchasing Reports > Replenishment Report)
The Replenishment Report is the primary tool in the replenishment system. It provides a list of those
items that are in need of replenishment and the recommended order quantity for each. The object of
the report is to provide proactive notification of items that are approaching their lowest acceptable
quantity, before they become out of stock or backordered.
It is recommended to run this report for each vendor separately, on the scheduled date of purchasing
from particular vendors. In this way, you will not need to work with all items at one time. On any given
day, there may be only a few vendors whose products are in need of review.
Run the report for items that are managed by Replenishment.
Filters
Buyer Enter a buyer or leave blank for all buyers. Buyers can be associated with Business Partners (Vendors).
Vendor Enter a vendor code or leave blank to include all vendors.
Warehouse Code Enter a warehouse code.
Item Group Enter an item group or select “All Item Groups” to not use this filter.
Surplus Warehouse Enter a warehouse where surplus quantities might be available.

51 | P a g e R e s o l v I n v e n t o r y P l a n n i n g U s e r G u i d e
Click the “Display” button. The screen will display a list of items from the criteria that were entered, and
that have been determined to require replenishment at this time.
For each item, the screen displays the item code and description, item group, procurement method,
available and on order quantities, future demand, restocking method, movement class, order point and
line point or minimum and maximum quantities, order quantity, buying targets for the vendor, sales
blanket orders, purchase blanket orders, and purchasing standard pack. If an additional identification
field has been designated in the Inventory Planning Configuration, it will be displayed as well.
The suggested quantity is calculated by the normal replenishment formulas, with the addition of any
amount below the minimum or order point. If the purchasing standard pack is greater than one, then
the suggested quantity will be raised to the next highest multiple of the purchasing standard pack. You
may change the suggested order quantity if you wish.
You may also choose to add items to this screen that have not been selected by means of the system
calculations. To do so, click on the “Add Items” button.
If you have specified a single vendor for the report, the system will add all remaining items for which that vendor is the primary vendor.
If you have not specified a particular vendor, the system will display a list of vendors. You may choose one, and the system will then add all remaining items for which that vendor is the primary vendor.
If desired, this screen may also be used to create Purchase Orders, Production Orders, Transfer
Requests, and Vendor Quote Requests. Highlight the items to be procured by one of the methods, and
click on the “Create PO”, “Create Production”, or “Create Transfer”. Please note the following:
In the case of Purchase Orders, the system will use the preferred vendor for the item, as shown on the screen. If there is no preferred vendor, the system will ask which vendor to use. All of the selected items will be placed on a purchase order for the same vendor.
In the case of Production Orders, the system will use the Bill of Materials that is in the system for each item. A separate Production Order will be created for each highlighted item. If no Bill of Materials exists for a selected item, a message will appear indicating that it is not possible to create a Production Order.
In the case of Transfer Requests, the system will create a Transfer Request document for a transfer into the warehouse that is displayed. You will be able to specify which warehouse to transfer the items from.
After one set of documents has been created, you may select other items and create additional
documents.
If you highlight a row and click on the ATP button, the standard SAP Available to Promise screen will
open for that item
Note: You are not required to use the procurement method specified for each item; for example, an
item with a transfer method may be purchased. Quantities shown for items on sales blanket orders
and purchase blanket orders, are for information only, and are not included in the replenishment
calculations.

52 | P a g e R e s o l v I n v e n t o r y P l a n n i n g U s e r G u i d e
Forecast Replenishment Report
(Resolv > Resolv Inventory Planning > Purchasing Reports > Forecast Replenishment Report)
The Forecast Replenishment Report is the primary tool in the forecasting system. It provides a list of
those items that are in need of replenishment and the recommended order quantity for each. The
object of the report is to provide proactive notification of items that are approaching their lowest
acceptable quantity, before they become out of stock or backordered.
It is recommended to run this report for each vendor separately, on the scheduled date of purchasing
from particular vendors. In this way, you will not need to work with all items at one time. On any given
day, there may be only a few vendors whose products are in need of review.
Run the report for items that are managed by Forecasting.
Filters
Buyer Enter a buyer or leave blank for all buyers. Buyers can be associated with Business Partners (Vendors).
Vendor Enter a vendor code or leave blank to include all vendors
Warehouse Code Enter a warehouse code

53 | P a g e R e s o l v I n v e n t o r y P l a n n i n g U s e r G u i d e
Item Group Enter an item group or select “All Item Groups” to not use this filter
Surplus Warehouse Enter a warehouse where surplus quantities might be available.
Click the “Display” button. The screen will display a list of items from the criteria that were entered, and
that have been determined to require replenishment at this time.
For each item, the screen displays the vendor, warehouse, item code and description, item group,
procurement method, average lead time, on hand, committed, available and on order quantities, future
demand, rank, buying targets, sales blanket orders, purchase blanket orders, surplus, standard pack, and
suggested quantity. Note that the future demand is calculated as the portion of the forecast demand
that will be needed during the item’s lead time.
The suggested quantity is the quantity needed to meet this demand in addition to the existing available
quantity. If the purchasing standard pack is greater than one, then the suggested quantity will be raised
to the next highest multiple of the purchasing standard pack. Note that you may change the suggested
order quantity if you wish.
If desired, this screen may also be used to create Purchase Orders, Production Orders, Transfer
Requests, and Vendor Quote Requests. Highlight the items to be procured by one of the methods, and
click on the “Create PO”, “Create Production”, or “Create Transfer” button. Please note the following:
In the case of Purchase Orders, the system will use the preferred vendor for the item, as shown on the screen. If there is no preferred vendor, the system will ask which vendor to use. All of the selected items will be placed on purchase orders for the same vendor.
In the case of Production Orders, the system will use the Bill of Materials that is in the system for each item. A separate Production Order will be created for each highlighted item. If no Bill of Materials exists for a selected item, a message will appear indicating that it is not possible to create a Production Order.
In the case of Transfer Requests, the system will create a Transfer Request document for a transfer into the warehouse that is displayed. You will be able to specify which warehouse to transfer the items from.
After one set of documents has been created, you may select other items and create additional
documents.
Note: You are not required to use the procurement method specified for each item; for example, an
item with a transfer method may be purchased.
If you highlight a row and click on the ATP button, the standard SAP Available to Promise screen will
open for that item.
Note: Quantities shown for items on sales blanket orders, and purchase blanket orders are for
information only, and are not included in the replenishment calculations.

54 | P a g e R e s o l v I n v e n t o r y P l a n n i n g U s e r G u i d e
Procurement Reporting
(Resolv > Resolv Inventory Planning > Purchasing Reports > Procurement Report)
The Procurement Report allows you to see the projected quantities of an item at various points in time,
based on existing sales orders, purchase orders, transfer requests, and production orders. This
information can be very useful in making long-term procurement decisions, and should be used to
supplement the recommendations provided by the replenishment reports.
This report is similar to the SAP Business One Available to Promise Report but it is more flexible in that
you may select a specific warehouse and may also display multiple items based on item group or partial
item codes. The Procurement Report also relates the item quantities to the minimum or order point
quantity in the warehouse/item record.
Filters
Warehouse Code Enter a warehouse code.
Item or Partial Item Code Enter an item code or partial item code.
Item Group Enter an item group or select “All Item Groups” to not use this filter. Click on the “Display” button.
The screen displays the procurement information for the item or items specified. For each item, it
shows the current quantity on hand. Then all open supply and demand documents are listed in
chronological order, based on the request date of each. Each line shows the expected balance on hand
after the document is fulfilled. The “Status” column also reports when an item’s quantity would be
below its minimum level.
You may drill down on the item code and the document numbers.

55 | P a g e R e s o l v I n v e n t o r y P l a n n i n g U s e r G u i d e
Quantity Report
(Resolv > Resolv Inventory Planning > Purchasing Reports > Quantity Report)
The Quantity Report serves several purposes. It displays items that are on documents with either supply
or demand quantities. The report can be very useful in determining the overall status of open
documents in the system, as well as the upcoming supply or demand status of particular items. This
information may be used to supplement the recommendations on the replenishment reports.
View 1: Display of Supply (Sources)

56 | P a g e R e s o l v I n v e n t o r y P l a n n i n g U s e r G u i d e
View 2: Display of Demand (Consumption)
Filters
Item or Partial Item Code Enter an item code or partial item code.
Warehouse Code Enter a warehouse code.
Item Group Enter an item group or select “All Item Groups” to not use this filter.
Quantity Select either Supply to view documents that increase the quantity of the item(s) or Demand to view documents that decrease the quantity of the item(s).
Click on the “Display” button. The system displays all items that have quantities in the selected quantity
type. For each item, a separate line is displayed for each open document. The screen shows the item,
warehouse, quantity, document type, document number, and request date.
Supply documents include Purchase Orders, Transfer Requests (“To” warehouse), and Production Orders
(finished items).
Demand documents include Sales Orders, Transfer Requests (“From” warehouse) and Production Orders
(component items).

57 | P a g e R e s o l v I n v e n t o r y P l a n n i n g U s e r G u i d e
Surplus Report
(Resolv > Resolv Inventory Planning > Purchasing Reports > Surplus Report)
The Surplus Report displays items that have an available quantity that is greater than the line point or
maximum quantity in the warehouse/item record. This report may be useful in determining items that
might be returned to the vendor, transferred to another warehouse, or targeted for special sales
activity.
Filters
Vendor Enter a vendor or leave blank to include all vendors
Item or Partial Item Code Enter an item code, partial item code or leave blank to select all items
Warehouse Code Enter a warehouse code or select “All Warehouses” to not use this filter
Item Group Enter an item group or select “All Item Groups” to not use this filter

58 | P a g e R e s o l v I n v e n t o r y P l a n n i n g U s e r G u i d e
Click on the “Display” button.
The screen displays all items for the selection criteria that have a surplus quantity in the warehouse. It
shows the item code and description, warehouse, item group, on hand quantity, available quantity, line
point, maximum, and surplus quantities, as well as the value of the surplus quantity.
Note: An item may have a line point quantity or a maximum quantity, but not both. The available
quantity is compared to whichever quantity is greater than zero. If both are zero, then the entire
available quantity is considered to be surplus.

59 | P a g e R e s o l v I n v e n t o r y P l a n n i n g U s e r G u i d e
Inventory Planning Reports
Resolv Inventory Planning contains several other reports and displays which may be used for additional
information and assistance in analyzing item behavior and purchasing decisions.
Forecast Comparative Calculation
(Resolv > Resolv Inventory Planning > Inventory Planning Reports > Forecast Comparative Calculation)
This program provides a tool for comparing the results of all of the different forecasting formulas. It
may be utilized for one item at a time. While the results are not retained in the system, they may be
used for quick reference. The primary purpose, however, is to determine which formula is most useful
for a particular item or group of items.
Filters
Item Code Enter an item code
Warehouse Code Enter a warehouse code

60 | P a g e R e s o l v I n v e n t o r y P l a n n i n g U s e r G u i d e
There will be a pause while the system calculates data and displays the data.
The upper part of the screen will display the qualified usage information for the item. Usage for up to
27 past months is shown, beginning with the most recent month.
The lower left part of the screen then displays the demand forecast for the previous six months, using
each of the formulas in the system. The right-hand section of the screen displays the monthly difference
percentage for each formula when comparing the forecast with the qualified usage.
In the example above, the first formula – six months rolling average – would predict 628 units sold in the
most recent month (2012-05). However, the qualified usage for that month was 816. The usage was
greater than the prediction by 188 units, or 29.9%. Over the course of six months, the average variance
for this formula was -47.2%, indicating that the average usage was significantly less than the average
prediction.
The lowest average variance for the six months is shown in red (see arrow on the screen print). This
indicates the formula that was most accurate (closest to zero variance) over the six month period.
Using this screen, an experienced purchasing agent will be able to determine which formula is the most
realistic for this particular item. The same formula will most likely be useful for similar items in the
company’s stock.
Note: Some formulas require more months of usage than others. If an item has less than 27 months’
usage, some formulas will yield inaccurate results.

61 | P a g e R e s o l v I n v e n t o r y P l a n n i n g U s e r G u i d e
Display Details: Click on the “Display Details” button to view more detailed information about the item.
In addition to the usage figures, the screen also displays the Change Percentage (percent of change from
one month to the next), the standard trend, and the seasonal trend for each month. Note that the
trends are only calculated for the past 12 months.

62 | P a g e R e s o l v I n v e n t o r y P l a n n i n g U s e r G u i d e
Unusual Usage Report
(Resolv > Resolv Inventory Planning > Inventory Planning Reports > Unusual Usage Report)
This report displays items that have usage that is either above or below the guidelines set in the
configuration. Qualified usage is compared to the forecast. Only items that have forecasts set in the
Warehouse Item Planning record will be included in this report.
Filters
Warehouse Code Enter a warehouse code
Item Group Enter an item group or select “All Item Groups” to not use this filter
Click on the “Display” button.
The low and high percentages, as set in the Inventory Planning configuration, are shown above the grid.
The screen displays items matching the filter criteria where the total usage is either above or below the
acceptable range for the percentage of forecast demand. For example, in the screen above, the second
item had a total usage of zero and a forecast of 10. The acceptable range would be from 30% of forecast
to 150% of forecast, or a low of 3 to a high of 15. Since the usage was zero, that is marked as Low.
However, the first item on the screen had a total usage of 15 and a forecast of 12. The acceptable range
would be from 3.6 to 18. The item’s usage falls within that range, so there is no entry in the “Unusual”
column.
The forecast formula used for each item is also displayed on the screen. If an item’s usage is
significantly above or below its forecast, then perhaps the forecast is not accurate. A different
forecasting method might be more appropriate.

63 | P a g e R e s o l v I n v e n t o r y P l a n n i n g U s e r G u i d e
Forecast Safety Stock Report
(Resolv > Resolv Inventory Planning > Inventory Planning Reports > Forecast Safety Stock)
This program displays the amount of safety stock that is left each month, based on the difference
between the demand forecast and the qualified usage. It may also be used to calculate desired levels of
safety stock.
Filters
Item or Partial Item Code Enter an item code, partial item code or leave blank to select all items
Warehouse Code Enter a warehouse code or select “All Warehouses” to not use this filter
Item Group Enter an item group or select “All Item Groups” to not use this filter
Click on the “Display” button.
The screen displays all of the selected items, with a separate line for each of the past 5 months. On each
line, it shows the item group, unit cost, period, forecast demand, usage, the difference between forecast
and usage, and the amount of safety stock that was used. If an Additional Information Field was
specified in Inventory Planning Configuration then a column for the indicated field appears after the
item description.

64 | P a g e R e s o l v I n v e n t o r y P l a n n i n g U s e r G u i d e
For example, in the screen above, Item A00001 in period 2012-03 had a demand forecast of 99 but
usage of 26. The difference, -73, indicates that no safety stock was used. However, the same item in
period 2012-05 had a forecast of 42 and usage of 107, with a difference of 65. This is the amount of
safety stock that was used during the month.
Note: If “Recalculate Safety Multiplier” is checked in Inventory Planning configuration, the “Safety
Multiplier %” column appears. It contains displays the calculated safety multiplier. A “Reset” button
will allow you to reset the safety multiplier on the forecast tab of the Warehouse Item Planning record
to the new value.
Buttons
Display Displays the selected items.
Summary Highlight an item and click on the “Summary” button to see further details.
The following information is displayed:
Total Positive Difference: the sum of the quantities where usage exceeded the forecast.
Number of Months to Consider: number of months where usage exceeded the forecast.
Average Difference: the average of the months in which usage exceeded the forecast.
Difference Multiplier: Multiplier of average difference used to calculate safety stock quantity. These multipliers represent approximate customer service levels:
o 3 = 97% 2 = 95% 1 = 65%
Safety Stock Quantity: Safety stock quantities resulting from each Difference Multiplier. This represents the safety stock needed for one, two, and three months of above-forecast demand.
Value of Safety Stock: Dollar value of the safety stock quantities.

65 | P a g e R e s o l v I n v e n t o r y P l a n n i n g U s e r G u i d e
Demand Simulator
(Resolv > Resolv Inventory Planning > Inventory Planning Reports > Forecast Simulator)
This program allows you to see the effects of the different variables in the Replenishment formulas. You
can change some or all of the variables, and see the difference in the resulting values for specific items.
Filters
Buyer Enter a buy or leave blank to include all buyers
Vendor Enter a vendor or leave blank to include all vendors
Warehouse Code Select the warehouse
Item Group Enter an item group or select “All Item Groups” to not use this filter
Buttons
Display Displays the selected items
Reset Use the Reset button to save changes made in this screen

66 | P a g e R e s o l v I n v e n t o r y P l a n n i n g U s e r G u i d e
These two views of the screen illustrate the information that is displayed by this program. For each
item, the screen shows the warehouse, item code and description, item group, unit cost, 6 months’
qualified usage, average usage, average lead time, safety stock percentage, lead time usage, safety
stock, inventory low level (minimum or order point), review cycle, K cost, R cost, inventory high level
(maximum or line point), EOQ value, average inventory quantity, and average inventory dollar value.
Some of the fields may be edited, while others may not.
You may make changes in the editable fields to simulate changes in item behavior or system settings.
Then highlight the lines that have been changed and click on the “Reset” button. All resulting
calculations will be changed to reflect the new variables. While these changes will not be carried over to
the system, you may use them to consider changes that you may wish to make in reality.
For example:
Change Lead Time: this may result in changes to the low level, high level, and average inventory. To effect this change, you may wish to consider changing your vendor to one with a closer location or more prompt deliveries, or change the shipping method for purchases.
Change Safety Stock %: this may result in changes to the low level, high level, and average inventory. You can make this change in the Warehouse Item Planning records.
Change Review Cycle: this may result in changes to the high level and average inventory. You can make this change in the Business Partner Master for selected vendors. You must also purchase the item more or less frequently for the change to produce actual results.
Change K Cost and/or R Cost: this may result in changes to the EOQ and average inventory. You can make this change in the Inventory Planning Configuration. Remember that these settings affect all items using EOQ.
If you decide that some actual changes in the Warehouse Item Planning settings are desirable, and you
wish to make these changes for a number of items simultaneously, you may use the “Import Variables”
feature to change settings – such as safety stock, order quantity method, or replenishment method – for
a list of items on a spreadsheet.

67 | P a g e R e s o l v I n v e n t o r y P l a n n i n g U s e r G u i d e
Suggestions for Special Situations
All of the procedures discussed in the sections above make certain assumptions about items and their
behavior. Averages and formulas are used to make predictions about the demand for each item, based
primarily on its usage history. However, there are situations where these assumptions are not valid, or
where the history is not available.
Resolv Inventory Planning includes very flexible tools that can adapt to many different situations. But it
is necessary to be aware of how to use them in order to obtain the best and most useful results.
Remember that the goal is always to provide procurement recommendations that will keep enough
stock on hand to avoid backorders, but will also avoid overstocking and overspending.
The following section contains suggestions for using the system to accomplish this goal in a variety of
scenarios. While some of these situations may be more common in some industries than in others,
every company is sure to encounter at least some of them from time to time.
New Items
When new items are added to the Item Master, there is no usage history or average lead time. All
variables in the Warehouse Item Planning record will be set according to system defaults.
There are two ways to manage this scenario:
1. If the item is similar to an existing item, and you expect it to sell at approximately the same level, you can enter qualified usage for the past six months at the level of the existing item. You can also enter a qualified lead time that is appropriate for the vendor and type of item. The system will use these values to calculate averages and gradually replace them with actual values as sales occur in the coming months. At some point you should remove the “Change Lead Time” flag so that the actual calculated average lead time will be used.
2. If you have no comparable item on which to base projected activity, you will need to estimate how much of the item you should keep in stock. Set the control variables as shown:

68 | P a g e R e s o l v I n v e n t o r y P l a n n i n g U s e r G u i d e
Freeze Controls Prevents the system from making new calculations based on incomplete activity.
Process Item in Replenishment
Allows the item to appear in purchasing reports.
Safety Allowance Use the system default.
Order Quantity Method
Since the controls are frozen, this field will not actually be used. Setting it to “Manual” may serve as an additional reminder that the normal calculations will not apply.
Restocking Method Normally Min/Max is easier to manage in this scenario. However, if the item is part of an existing vendor’s product line, and you typically use order point/line point for that product line, you may use it in this case.
Replenishment Method
Set as appropriate for the item.
Movement Class Movement Class is typically set to 14 for new items.
Increase Suggested Quantity
This is the quantity that will be recommended for replenishment orders. It may be entered manually or calculated by the system.

69 | P a g e R e s o l v I n v e n t o r y P l a n n i n g U s e r G u i d e
Order Point and Line Point
Leave at zero if using min/max. Otherwise, set as in minimum and maximum.
Minimum and Maximum
Enter the lowest and highest levels of stock you want to maintain for this item. These will necessarily be estimates at the beginning; you can change them as you see how the item sells. Note that the Order Quantity should be the difference between the minimum and maximum quantities.
Lead Times Check “Change Lead Time”, and enter the expected lead time for the item, based on your knowledge of the vendor’s performance.
It is very important to monitor the item’s activity and modify these settings as time goes on. Once the
item has established activity for 6 months or more, remove the freeze and the manual Order Quantity
Method, and allow the settings to revert to their normal defaults.
It is recommended to create an alert to remind you to check on the status of these items. You can base
the alert on the Creation Date of the Warehouse Item Planning record.

70 | P a g e R e s o l v I n v e n t o r y P l a n n i n g U s e r G u i d e
Special Order Items
A special order item is one that you do not intend to keep in stock. You maintain it on your items list,
and customers may order it, but you will only procure it if it has been placed on order by a customer.
Therefore, it will normally have a zero available quantity until it is backordered; at that time it will have
a negative available quantity.
Note: An item might be a stock item in one warehouse, but a special order item in another warehouse.
Set the Warehouse Item Planning record as shown for all special order items.
Freeze Controls Prevents the system from making new calculations based on the assumption that it should be kept in stock.
Process Item in Replenishment
Allows the item to appear in the purchasing reports.
Safety Allowance Set to zero so the system will not try to increase quantities to create safety stock.
Order Quantity Method
Since the controls are frozen, this field will not actually be used. Setting it to “Manual” may serve as an additional reminder that the normal calculations will not apply.

71 | P a g e R e s o l v I n v e n t o r y P l a n n i n g U s e r G u i d e
Restocking Method Always use Min/Max in this case.
Replenishment Method
Set as appropriate for the item.
Movement Class This can be set by the system based on yearly sales.
Increase Suggested Quantity
Enter zero.
Order Point and Line Point
Leave at zero.
Minimum and Maximum
Enter zero for both minimum and maximum.
Lead Times You can use the system’s calculated average lead time, or set a qualified lead time.
The result of these settings is that the system will not attempt to replenish the item unless the available
quantity is negative. At that point, it will suggest only the quantity needed to return the available
quantity to zero (e.g., the amount needed to fill the backorder).

72 | P a g e R e s o l v I n v e n t o r y P l a n n i n g U s e r G u i d e
Superseding Items
In many industries it is common for manufacturers to replace existing items with newer models, either
occasionally or on a regular basis. The new items will have somewhat different features, and so they
must be entered as new part numbers in the Item Master. However, it is reasonable to assume that
they will establish usage patterns similar to the parts they have replaced.
Follow the directions above for new items, using method #1. If there is an entire product line that is
being replaced, it may be useful to export the usage from the existing items, change the part numbers
on the spreadsheet, and then import the usage back in for the new items. At the same time, another
spreadsheet can be created to import the other variables as specified for all of the new items. The new
items must exist in the Item Master before doing this.
Note: The items that have become obsolete should no longer appear in the replenishment reports.
Simply remove the flag for “Process In Replenishment” and the system will no longer suggest
procurement of these items.

73 | P a g e R e s o l v I n v e n t o r y P l a n n i n g U s e r G u i d e
Items with Low or Erratic Usage
It may be the case that some items in your inventory are sold only occasionally – you may have a few
sold in one month, none at all in other months, and so on. In this case, averaging the quantity sold over
six months will not produce a useful prediction as to how many should be kept in stock. Similarly, most
of the forecasting formulas will not give realistic results for these items.
In this case, it is best to decide how much of the item should be kept in stock in each warehouse. Your
decision may be based in part on the cost of the item (if it is low cost, you may want to keep several on
hand in case they are needed, but if it is expensive you would not want to have more than one or two),
and also on availability from the supplier. If there is a long lead time, and if you have several
warehouses, you might want to keep several on hand in one central warehouse and transfer from there
to the other warehouses as needed. In any case, it is necessary to make this decision based on your
knowledge of the situation, bearing in mind that you may need to change it later.
Once you have determined the appropriate stock level, follow the directions for entering new items,
using method #2. If you only wish to maintain a very low level of inventory, set the minimum at 1 and
the maximum at 2 or 3.
These items should be monitored carefully. If they become more active, increase the inventory levels,
or allow them to revert to normal replenishment processing. If they remain very inactive, consider
moving them to a special order status.

74 | P a g e R e s o l v I n v e n t o r y P l a n n i n g U s e r G u i d e
Seasonal Items
If some or most of the items you carry are seasonal, you must take that into account when planning
procurement. The replenishment features in Resolv Inventory Planning rely very much on the average
of the last six months’ usage. This method is not appropriate for seasonal items, since the demand in
the coming month will not reflect the usage of the past six months.
However, several of the Forecast formulas are specifically designed to accommodate seasonality. Use
the Forecast Comparative Calculation program to evaluate which formula will most accurately predict
demand for your items. Note that a minimum of 12 months’ usage is required for these formulas to be
useful for seasonal items. As much as 27 months is required for some formulas.
Loss of a Major Customer for Items
It may be that certain items are sold primarily to a single customer, although there may be some sales to
other customers as well. If for any reason you know that the primary customer will no longer be
ordering these items, you must adjust your procurement of the items accordingly.
1. Consider changing the status of the items to special order items, so that you will purchase them only when they have been ordered by a customer.
2. If you wish to keep the items in stock at some level, do the following:
a. Determine the quantity sold to the primary customer during each month for the last six months (or longer if it was a seasonal item). You may use the Sales Analysis Report to find this information.
b. For each item, reduce the Qualified Usage quantity in each of the past 6-12 months by the amount purchased by the primary customer.
c. If there is still a steady quantity of Qualified Usage, continue with normal replenishment procedures for the items. The system will use the recalculated average usage figures to recommend ongoing procurement.
d. If there is very low or erratic usage remaining, follow the directions for items with this type of behavior in the section above.

75 | P a g e R e s o l v I n v e n t o r y P l a n n i n g U s e r G u i d e
Non-Perpetual Inventory
The Business One program allows you to indicate if you use a perpetual inventory system or not. Once
you begin to use the program, you cannot change this setting.
Most companies in the United States use perpetual inventory. In this system, the program creates
journal entries each time an item is received or issued. The item’s value is maintained on a continuous
basis, either by average, FIFO, or standard valuation.
However, this method is less common in some other countries, and some companies in the US also
prefer to use a non-perpetual inventory system. In this case, no value is maintained for the individual
items, and journal entries are not created on an ongoing basis. Instead, there is a yearly valuation of the
entire inventory, and a variance account for the changes that occur over the course of the year.
For most elements of Resolv Inventory Planning, there is no difference between a perpetual or non-
perpetual inventory system. Usage records and average lead times are maintained in either case.
However, the Movement Class Reset and Forecast Ranking Reset depend on the unit cost of the items,
and there are several other screens where the values of the items are shown. For this purpose, it is
required that some method exists to indicate the approximate unit cost of each item.
One of the standard programs provides such a method. The Inventory Valuation Simulation program
(Inventory > Inventory Reports > Inventory Valuation Simulation Report) may be used to create a Last
Evaluated Price for each item. Resolv Inventory Planning will automatically use the Last Evaluated Price
in place of the average cost for all items in a non-perpetual inventory system.
The Inventory Valuation Simulation program must be run monthly, before any of the reset programs, in
order to yield correct results. Follow these directions to create the Last Evaluated Prices:

76 | P a g e R e s o l v I n v e n t o r y P l a n n i n g U s e r G u i d e
Set the criteria as shown. It is best to include all warehouses where items are received from suppliers or produced.
You may enter an ending posting date if you wish to only consider transactions up to a certain date.
For the calculation method, be sure to select “Moving Average”.
For the display method, select “Row Per Item”, unless you want to see every transaction for every item.
If you have ever had negative inventory at any time for any item, you must check “Allow Negative Inventory”.
Once the criteria have been entered, click on “OK”. The system will calculate the average cost of each
item based on all transactions. The resulting list will be displayed.
You may print or export the list, but it is not necessary to do so. The system automatically updates each
item’s Last Evaluated Price according to the values shown.
FIFO Items
In SAP Business One there is the option to value items by average cost, FIFO, or standard cost. It is also
possible to value different items by different methods, if you wish.
For average-cost items, the system maintains the cost in a field in the Item Master, either for each
warehouse individually or for all warehouses combined, depending on whether you manage the item by
warehouse or not. Standard costs are maintained in the same field. Resolv Inventory Planning uses
these costs in the Movement Class Reset and Forecast Ranking Reset, as well as other screens where
item values are displayed.
However, in the case of FIFO items, there is no field in the system that maintains an overall cost for the
item. Each FIFO layer is maintained separately, based on the transaction by which it was received. In
order to ascertain the unit cost of these items, it is necessary to have some way to approximate the
average cost.
Resolv Inventory Planning will use each FIFO item’s Last Evaluated Price in place of the average cost. In
order to calculate and update the Last Evaluated Price, see the instructions in the section above on non-
perpetual inventory. It is necessary to perform this procedure each month, before running any of the
monthly reset programs.

77 | P a g e R e s o l v I n v e n t o r y P l a n n i n g U s e r G u i d e
Managing Multiple Warehouses
If your company maintains more than one stocking warehouse, there are two major options for handling
item procurement.
1. Each warehouse purchases and/or produces items individually, with little movement of items from one warehouse to another. A purchasing manager or warehouse manager at each location is responsible for monitoring the inventory and determining replenishment needs, as well as actually placing purchase orders and production orders.
This option works well in cases where each warehouse has high activity, and needs to be able to
react quickly in cases of low stock or special orders. It may also be possible to save money on
freight if inventory can be purchased locally.
When using Resolv Inventory Planning in this situation, each record in the Warehouse Item
Planning will be configured according to the needs of the specific warehouse. If items are
purchased within a vendor’s product line, and buying targets apply to the purchases, then you
may wish to use the order point/line point method for order quantity. While it is always useful
to be aware of surpluses in other warehouses, each warehouse will plan its own purchasing
schedule and quantities based on its own usages and lead times. Transfers from other
warehouses should be the exception rather than the rule, and usage should not be tracked on
transfers.
2. Purchasing and/or production are managed from a main warehouse, and other warehouses are normally supplied by means of transfers. The purchasing manager or department at the main location is responsible for maintaining adequate supplies of items at all warehouses. Transfers as well as purchases must be scheduled on an ongoing basis.
This method works best when the main warehouse has significantly more space than the
secondary warehouses. It may or may not also be a selling warehouse on its own; it may simply
be a distribution center with no other function. It is also possible to recognize considerable
savings by buying items in large quantities; this is especially true of imports, where entire
container-loads may be purchased at one time even though no one warehouse would need that
quantity. Also, it is easier to avoid surpluses at the individual warehouses when a central office
oversees the inventory at all locations.

78 | P a g e R e s o l v I n v e n t o r y P l a n n i n g U s e r G u i d e
In this case, it is necessary to take some care with the Warehouse Item Planning setups in Resolv
Inventory Planning:
The Inventory Planning Configuration should be set to track usage on transfers “Based on Replenishment Path”.
Records for items in the main warehouse should have a replenishment method of “Buy” or “Make”. Records for items in the secondary warehouses should have a replenishment method of “Transfer”.
Records for items in the secondary warehouses should show the main warehouse as the Replenishment Warehouse
Records for items in the main warehouse may use either order point/line point or min/max as the Order Quantity Method. Records for items in the secondary warehouses should always use min/max. Other variables should be set according to normal system procedures in all warehouses.
Since it is not possible to track lead times on transfers, the records in the secondary warehouses should have “Change Lead Time” checked, and you should enter the number of days it would normally take from the time a transfer request is made until items are received on transfers.
The result of these setups is that when items are transferred from the main warehouse to the
secondary warehouses, usage will be added in the main warehouse. This will indicate a demand
level sufficient to supply all of the secondary warehouses (in addition to sales from the main
warehouse itself). However, if there are non-standard transfers (for example, from one
secondary warehouse to another), these will not be counted as usage since they are not the
normal replenishment path, and the shipping warehouse’s demand level will not be raised as a
result.
Note: Sales from the secondary warehouses will still be counted as usage in those warehouses,
so the demand level from each of those warehouses will correctly prompt new transfers for
replenishment as item quantities decline toward their minimum levels.

79 | P a g e R e s o l v I n v e n t o r y P l a n n i n g U s e r G u i d e
Appendix I: Replenishment Formulas
The following formulas are used by the Replenishment system. Terms highlighted in red are defined in
the glossary.
1. Order Quantity: The order quantity method determines how much of each item should be procured. The setting for each item is found in the Warehouse/Item record. There are three options:
a. Economic Order Quantity
This method balances the cost of warehousing (e.g., buying large quantities), against
the cost of replenishment (e.g., buying frequently)
EOQ =
24 x Cost of Replenishment (R$) x Usage Rate
Cost of Carrying Inventory (K%) x Unit Cost
b. Movement Class
This method uses the movement class rank of each item to determine its order
quantity:
Movement Class 1: Order quantity = 1 month’s usage
Movement Class 2: Order quantity = 2 month’s usage
Movement Class 3: Order quantity = 3 month’s usage
Etc.
Movement Class 12: Order quantity=12 month’s usage
c. Manual This method uses no computer-generated calculations. You enter the desired
quantity; the computer will not change it at any point. You must monitor the
quantity and change it to fit changing conditions.
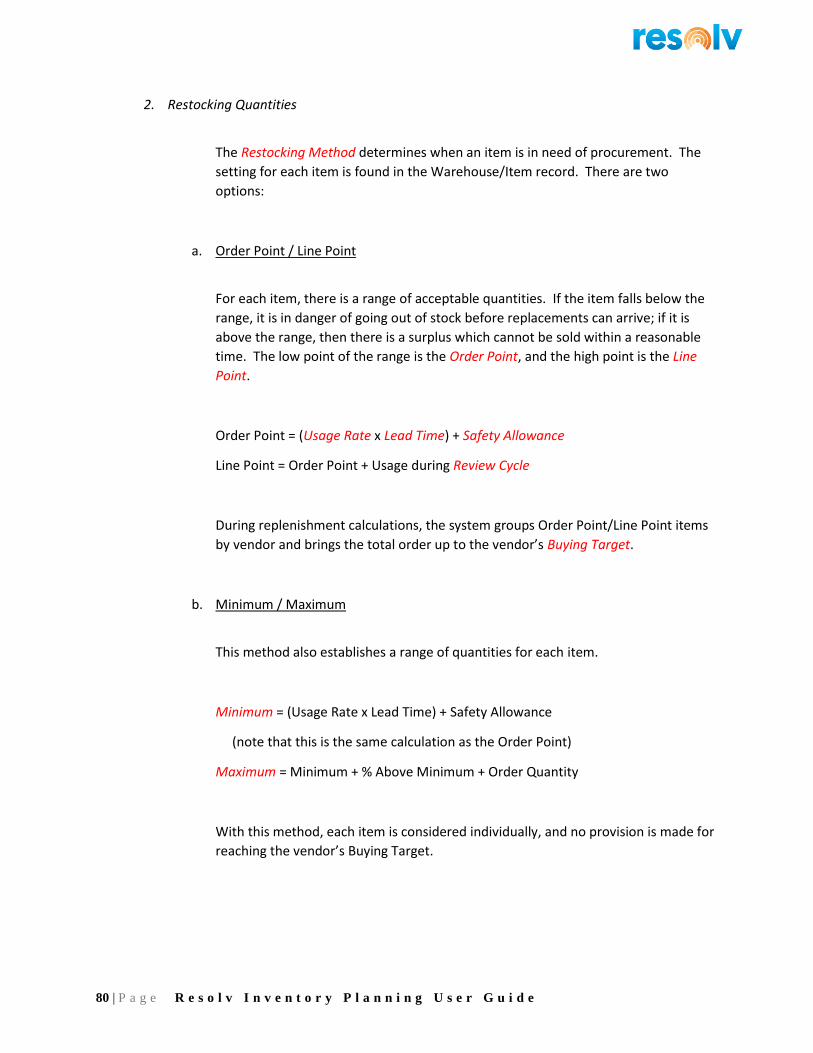
80 | P a g e R e s o l v I n v e n t o r y P l a n n i n g U s e r G u i d e
2. Restocking Quantities
The Restocking Method determines when an item is in need of procurement. The
setting for each item is found in the Warehouse/Item record. There are two
options:
a. Order Point / Line Point
For each item, there is a range of acceptable quantities. If the item falls below the
range, it is in danger of going out of stock before replacements can arrive; if it is
above the range, then there is a surplus which cannot be sold within a reasonable
time. The low point of the range is the Order Point, and the high point is the Line
Point.
Order Point = (Usage Rate x Lead Time) + Safety Allowance
Line Point = Order Point + Usage during Review Cycle
During replenishment calculations, the system groups Order Point/Line Point items
by vendor and brings the total order up to the vendor’s Buying Target.
b. Minimum / Maximum
This method also establishes a range of quantities for each item.
Minimum = (Usage Rate x Lead Time) + Safety Allowance
(note that this is the same calculation as the Order Point)
Maximum = Minimum + % Above Minimum + Order Quantity
With this method, each item is considered individually, and no provision is made for
reaching the vendor’s Buying Target.
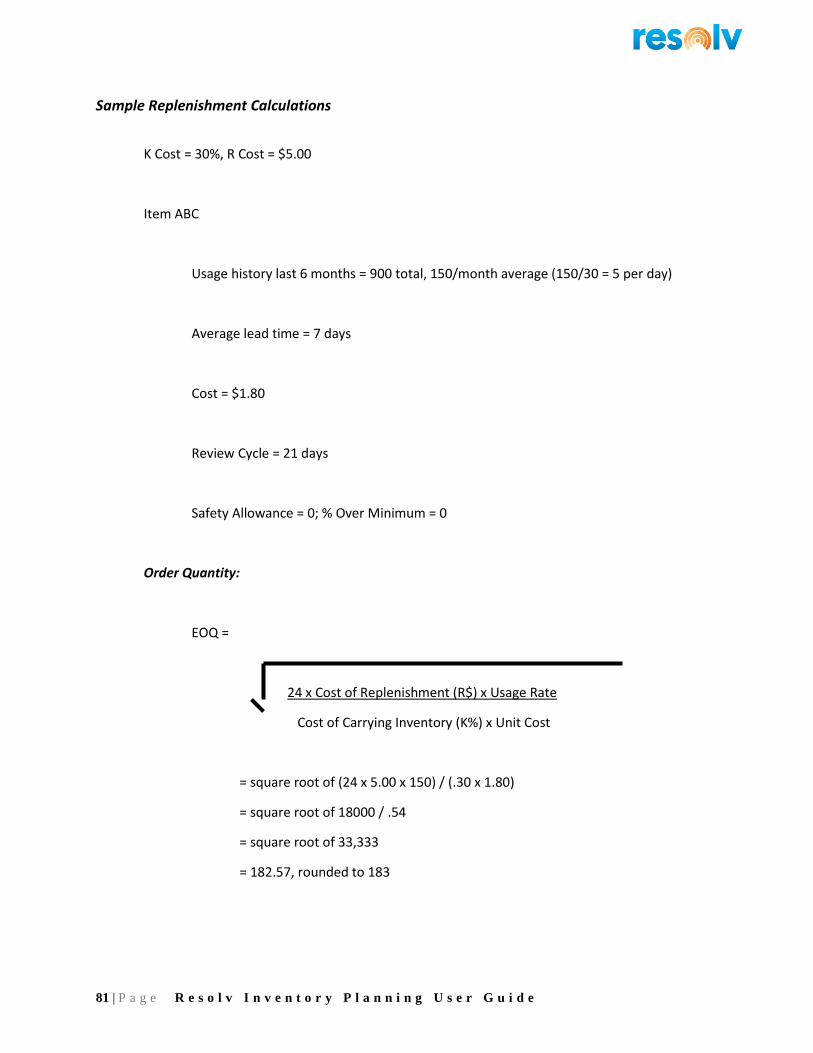
81 | P a g e R e s o l v I n v e n t o r y P l a n n i n g U s e r G u i d e
Sample Replenishment Calculations
K Cost = 30%, R Cost = $5.00
Item ABC
Usage history last 6 months = 900 total, 150/month average (150/30 = 5 per day)
Average lead time = 7 days
Cost = $1.80
Review Cycle = 21 days
Safety Allowance = 0; % Over Minimum = 0
Order Quantity:
EOQ =
24 x Cost of Replenishment (R$) x Usage Rate
Cost of Carrying Inventory (K%) x Unit Cost
= square root of (24 x 5.00 x 150) / (.30 x 1.80)
= square root of 18000 / .54
= square root of 33,333
= 182.57, rounded to 183
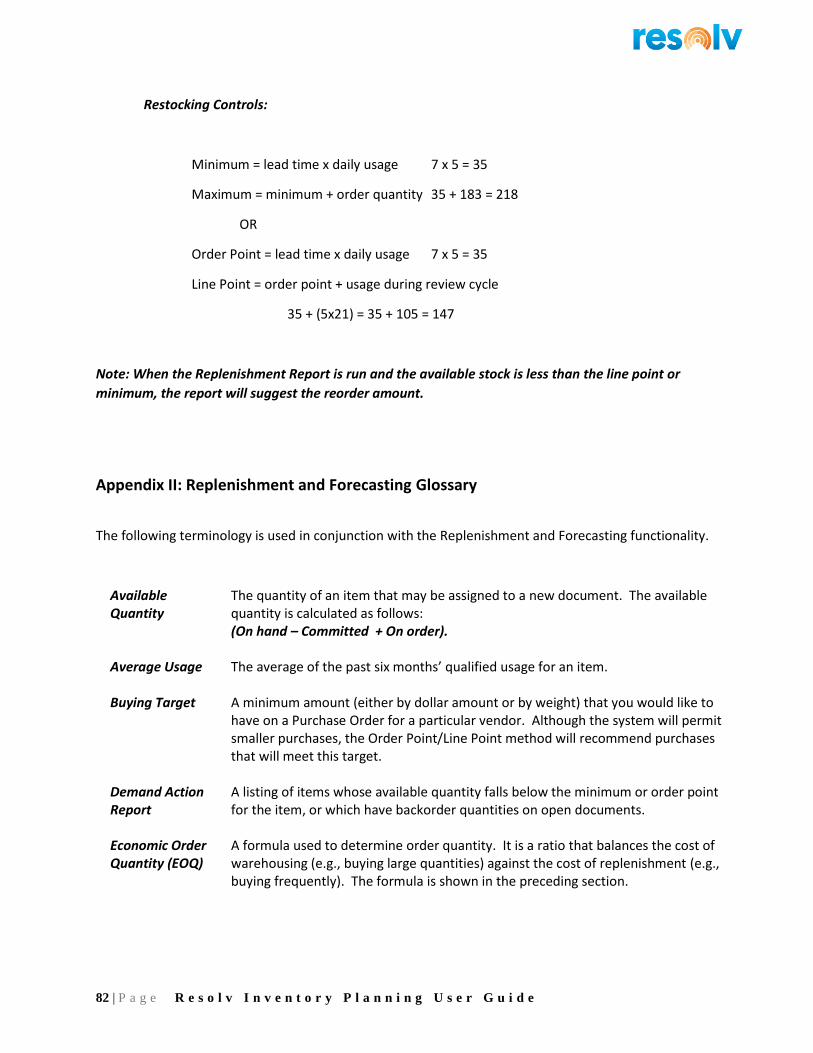
82 | P a g e R e s o l v I n v e n t o r y P l a n n i n g U s e r G u i d e
Restocking Controls:
Minimum = lead time x daily usage 7 x 5 = 35
Maximum = minimum + order quantity 35 + 183 = 218
OR
Order Point = lead time x daily usage 7 x 5 = 35
Line Point = order point + usage during review cycle
35 + (5x21) = 35 + 105 = 147
Note: When the Replenishment Report is run and the available stock is less than the line point or
minimum, the report will suggest the reorder amount.
Appendix II: Replenishment and Forecasting Glossary
The following terminology is used in conjunction with the Replenishment and Forecasting functionality.
Available Quantity
The quantity of an item that may be assigned to a new document. The available quantity is calculated as follows: (On hand – Committed + On order).
Average Usage The average of the past six months’ qualified usage for an item.
Buying Target A minimum amount (either by dollar amount or by weight) that you would like to have on a Purchase Order for a particular vendor. Although the system will permit smaller purchases, the Order Point/Line Point method will recommend purchases that will meet this target.
Demand Action Report
A listing of items whose available quantity falls below the minimum or order point for the item, or which have backorder quantities on open documents.
Economic Order Quantity (EOQ)
A formula used to determine order quantity. It is a ratio that balances the cost of warehousing (e.g., buying large quantities) against the cost of replenishment (e.g., buying frequently). The formula is shown in the preceding section.

83 | P a g e R e s o l v I n v e n t o r y P l a n n i n g U s e r G u i d e
K Cost % The cost of warehouse overhead, or carrying items in the warehouse. This cost is expressed as a percentage of inventory value. The recommended value is the prime rate of interest, plus 10.
Lead Time The time that passes between an order and the receipt of items. Lead times are tracked for Purchase Orders and Production Tickets.
Line Point The upper end of the acceptable quantity for an item, when using the Order Point/Line Point method. The formula for determining Line Point is (order point + usage during review cycle).
Maximum The upper end of the acceptable quantity for an item when using the Minimum/Maximum method. The formula for determining Maximum is (minimum + % above minimum + order quantity).
Minimum The lower end of the acceptable quantity for an item when using the Minimum/Maximum method. The formula for determining Minimum is: (usage rate x lead time) + (safety allowance).
Movement Class An item’s relative position within the entire list of stocked items for the warehouse, based on: Annual units sold x cost per item: There are twelve movement classes for items with sales for the past 12 months; movement class one represents the combination of most expensive and highest-moving items, while movement class twelve represents the least expensive and/or lowest-moving items. Movement class 13 represents items that have zero sales for a year, and movement class 14 represents items that are new and do not have enough history to be included. This value can be calculated by the system when you run the Movement Class Reset program. The Movement Class may also be used as an order quantity method. In this context, it is used to determine the quantity to procure at one time. It is used only for items in movement classes one through twelve. The number of the movement class is the number of months’ supply to procure; e.g., for movement class 1, order one month’s supply, for movement class 2, order two months’ supply, etc.
Non-Seasonal Trend Factor
Average increase or decrease in usage during the past four inventory periods.
Order Point
The lower end of the acceptable quantity for an item, when using the Order Point/Line Point method. The formula for determining Line Point is: (usage rate x lead time) + (safety allowance).
Order Quantity The recommended quantity for procurement of a stock item.
84 | P a g e R e s o l v I n v e n t o r y P l a n n i n g U s e r G u i d e
Order Quantity Method
The method for determining how much of each item should be procured. The setting for each item is found in the warehouse/item record. There are three options:
Economic Order Quantity
Movement Class
Manual
R Cost $ The cost of replenishment. This amount represents the cost of processing each line item on a purchase order. The default value is $5.00.
Replenishment Report
The report that calculates the recommended replenishment for selected items. The system determines which items are in need of replenishment, and what quantity should be ordered.
Restocking Method
The expected path for procuring an item for a particular warehouse. Options are:
B – Buy (Purchase Orders)
M – Make (Production Tickets – Bill Of Materials)
T – Transfer (Inventory Transfer)
Restocking Quantities
An item’s minimum and maximum, or order point and line point quantities.
Restocking Warehouse
When an item’s Restocking Method is Transfer, the Restocking Warehouse is the warehouse that the item is generally transferred from.
Review Cycle The frequency of regular stock purchases from a particular vendor. For example, if you normally purchase from a vendor twice a month, the review cycle would be 15 days.
Safety Allowance %
The percentage of safety stock for an item.
Safety Multiplier Same as Safety Allowance; this term is used in the Forecasting programs.
Safety Stock Inventory that is stored as a precaution against running out of stock due to a variance in anticipated lead time or usage when replenishing an item. Each item’s safety stock is calculated from its safety allowance percentage.
Seasonal Trend Factor
Difference in volume between the last three inventory periods this year, and the same inventory periods last year.

85 | P a g e R e s o l v I n v e n t o r y P l a n n i n g U s e r G u i d e
Usage The quantity of an item that is used during one month. Usage is tracked on the following documents:
Sales Deliveries
Issue for Production
Transfers – depending on setting in Configuration
Customer Returns (negative usage) Usage may also be considered an indication of the demand for an item, so it is the basis of many of the replenishment calculations.
Weighted Average
Average usage computed by multiplying some periods by a factor, as stated in the formula description. For example, “Weighted Std 3.0/2.5/2/0/1.5/1.0” would take the usage of the past 6 months and multiply the first month by 3, the second month by 2.5, the third month by 2, the fourth by nothing, the fifth by 1.5, and the sixth by 1. These formulas are used to indicate a pattern of usage over time.