RESEARCHARTICLE …ihi.eprints.org/3445/1/Paul_Smithson.pdf · RESEARCHARTICLE...
24
RESEARCH ARTICLE Impact of Malaria Control on Mortality and Anemia among Tanzanian Children Less than Five Years of Age, 1999–2010 Paul Smithson 1 *, Lia Florey 2 , S. Rene Salgado 3 , Christine L. Hershey 3 , Honorati Masanja 1 , Achuyt Bhattarai 4 , Alex Mwita 5 , Peter D. McElroy 4 , Tanzania Malaria Impact Evaluation Research Group ¶ 1 Ifakara Health Institute, Dar es Salaam, United Republic of Tanzania, 2 ICF International, Rockville, Maryland, United States of America, 3 United States Agency for International Development, U.S. President’s Malaria Initiative, Washington, DC, United States of America, 4 Centers for Disease Control and Prevention, U.S. President’s Malaria Initiative, Atlanta, Georgia, United States of America, 5 National Malaria Control Programme, Ministry of Health and Social Welfare, Dar es Salaam, United Republic of Tanzania ¶ Membership of the Tanzania Malaria Impact Evaluation Research Group is provided in the Acknowledgments. * [email protected] Abstract Background Mainland Tanzania scaled up multiple malaria control interventions between 1999 and 2010. We evaluated whether, and to what extent, reductions in all-cause under-five child mortality (U5CM) tracked with malaria control intensification during this period. Methods Four nationally representative household surveys permitted trend analysis for malaria inter- vention coverage, severe anemia (hemoglobin <8 g/dL) prevalence (SAP) among children 6–59 months, and U5CM rates stratified by background characteristics, age, and malaria endemicity. Prevalence of contextual factors (e.g., vaccination, nutrition) likely to influence U5CM were also assessed. Population attributable risk percentage (PAR%) estimates for malaria interventions and contextual factors that changed over time were used to estimate magnitude of impact on U5CM. Results Household ownership of insecticide-treated nets (ITNs) rose from near zero in 1999 to 64% (95% CI, 61.7–65.2) in 2010. Intermittent preventive treatment of malaria in pregnancy reached 26% (95% CI, 23.6–28.0) by 2010. Sulfadoxine-pyrimethamine replaced chloro- quine in 2002 and artemisinin-based combination therapy was introduced in 2007. SAP among children 6–59 months declined 50% between 2005 (11.1%; 95% CI, 10.0–12.3%) and 2010 (5.5%; 95% CI, 4.7–6.4%) and U5CM declined by 45% between baseline (1995–9) and endpoint (2005–9), from 148 to 81 deaths/1000 live births, respectively. PLOS ONE | DOI:10.1371/journal.pone.0141112 November 4, 2015 1 / 24 a11111 OPEN ACCESS Citation: Smithson P, Florey L, Salgado SR, Hershey CL, Masanja H, Bhattarai A, et al. (2015) Impact of Malaria Control on Mortality and Anemia among Tanzanian Children Less than Five Years of Age, 1999–2010. PLoS ONE 10(11): e0141112. doi:10.1371/journal.pone.0141112 Editor: Luzia Helena Carvalho, Centro de Pesquisa Rene Rachou/Fundação Oswaldo Cruz (Fiocruz- Minas), BRAZIL Received: January 23, 2015 Accepted: October 5, 2015 Published: November 4, 2015 Copyright: This is an open access article, free of all copyright, and may be freely reproduced, distributed, transmitted, modified, built upon, or otherwise used by anyone for any lawful purpose. The work is made available under the Creative Commons CC0 public domain dedication. Data Availability Statement: All datasets related to the underlying findings in this report are available at the following ICF International sites: the 1999 Tanzania Reproductive and Child Health Survey (http://dhsprogram.com/data/dataset/Tanzania_ Standard-DHS_1999.cfm?flag=0. 2004/5), the Tanzania Demographic and Health Survey (http:// dhsprogram.com/data/dataset/Tanzania_Standard- DHS_2004.cfm?flag=0. 2007/8), the Tanzania HIV/ AIDS and Malaria Indicator Survey (http:// dhsprogram.com/data/dataset/Tanzania_Standard-
Transcript of RESEARCHARTICLE …ihi.eprints.org/3445/1/Paul_Smithson.pdf · RESEARCHARTICLE...

RESEARCH ARTICLE
Impact of Malaria Control on Mortality andAnemia among Tanzanian Children Less thanFive Years of Age, 1999–2010Paul Smithson1*, Lia Florey2, S. Rene Salgado3, Christine L. Hershey3, Honorati Masanja1,Achuyt Bhattarai4, Alex Mwita5, Peter D. McElroy4, Tanzania Malaria Impact EvaluationResearch Group¶
1 Ifakara Health Institute, Dar es Salaam, United Republic of Tanzania, 2 ICF International, Rockville,Maryland, United States of America, 3 United States Agency for International Development, U.S. President’sMalaria Initiative, Washington, DC, United States of America, 4 Centers for Disease Control and Prevention,U.S. President’s Malaria Initiative, Atlanta, Georgia, United States of America, 5 National Malaria ControlProgramme, Ministry of Health and Social Welfare, Dar es Salaam, United Republic of Tanzania
¶ Membership of the Tanzania Malaria Impact Evaluation Research Group is provided in theAcknowledgments.* [email protected]
Abstract
Background
Mainland Tanzania scaled up multiple malaria control interventions between 1999 and
2010. We evaluated whether, and to what extent, reductions in all-cause under-five child
mortality (U5CM) tracked with malaria control intensification during this period.
Methods
Four nationally representative household surveys permitted trend analysis for malaria inter-
vention coverage, severe anemia (hemoglobin <8 g/dL) prevalence (SAP) among children
6–59 months, and U5CM rates stratified by background characteristics, age, and malaria
endemicity. Prevalence of contextual factors (e.g., vaccination, nutrition) likely to influence
U5CM were also assessed. Population attributable risk percentage (PAR%) estimates for
malaria interventions and contextual factors that changed over time were used to estimate
magnitude of impact on U5CM.
Results
Household ownership of insecticide-treated nets (ITNs) rose from near zero in 1999 to 64%
(95% CI, 61.7–65.2) in 2010. Intermittent preventive treatment of malaria in pregnancy
reached 26% (95% CI, 23.6–28.0) by 2010. Sulfadoxine-pyrimethamine replaced chloro-
quine in 2002 and artemisinin-based combination therapy was introduced in 2007. SAP
among children 6–59 months declined 50% between 2005 (11.1%; 95% CI, 10.0–12.3%)
and 2010 (5.5%; 95% CI, 4.7–6.4%) and U5CM declined by 45% between baseline
(1995–9) and endpoint (2005–9), from 148 to 81 deaths/1000 live births, respectively.
PLOS ONE | DOI:10.1371/journal.pone.0141112 November 4, 2015 1 / 24
a11111
OPEN ACCESS
Citation: Smithson P, Florey L, Salgado SR, HersheyCL, Masanja H, Bhattarai A, et al. (2015) Impact ofMalaria Control on Mortality and Anemia amongTanzanian Children Less than Five Years of Age,1999–2010. PLoS ONE 10(11): e0141112.doi:10.1371/journal.pone.0141112
Editor: Luzia Helena Carvalho, Centro de PesquisaRene Rachou/Fundação Oswaldo Cruz (Fiocruz-Minas), BRAZIL
Received: January 23, 2015
Accepted: October 5, 2015
Published: November 4, 2015
Copyright: This is an open access article, free of allcopyright, and may be freely reproduced, distributed,transmitted, modified, built upon, or otherwise usedby anyone for any lawful purpose. The work is madeavailable under the Creative Commons CC0 publicdomain dedication.
Data Availability Statement: All datasets related tothe underlying findings in this report are available atthe following ICF International sites: the 1999Tanzania Reproductive and Child Health Survey(http://dhsprogram.com/data/dataset/Tanzania_Standard-DHS_1999.cfm?flag=0. 2004/5), theTanzania Demographic and Health Survey (http://dhsprogram.com/data/dataset/Tanzania_Standard-DHS_2004.cfm?flag=0. 2007/8), the Tanzania HIV/AIDS and Malaria Indicator Survey (http://dhsprogram.com/data/dataset/Tanzania_Standard-

Mortality declined 55% among children 1–23 months of age in higher malaria endemicity
areas. A large reduction in U5CM was attributable to ITNs (PAR% = 11) with other malaria
interventions adding further gains. Multiple contextual factors also contributed to survival
gains.
Conclusion
Marked declines in U5CM occurred in Tanzania between 1999 and 2010 with high impact
from ITNs and ACTs. High-risk children (1–24 months of age in high malaria endemicity)
experienced the greatest declines in mortality and SAP. Malaria control should remain a pol-
icy priority to sustain and further accelerate progress in child survival.
IntroductionMalaria control in sub-Saharan Africa attained unprecedented momentum during the decadeafter 2000 [1–3]. Donor assistance for malaria control in Africa increased 10-fold between2000 and 2010, from $200 million to nearly $2 billion annually [4]. Most support came after2005 from national governments, the Global Fund to Fight AIDS, Tuberculosis and Malaria,the World Bank Booster Program, and the U.S. President’s Malaria Initiative. These resourcespermitted nationwide scale-up of highly effective malaria control interventions, includinginsecticide treated bednets (ITNs), indoor residual spraying (IRS) of household walls withinsecticides, intermittent preventive treatment of malaria during pregnancy (IPTp), and arte-misinin-based combination therapy (ACT) [4,5]. Numerous African countries are on track tomeet the World Health Assembly target of a 75% reduction in malaria incidence by 2015 [2].However, evaluations of the public health impact of malaria control at national scale are sparse[6–8].
At least 97% of the Tanzania population lived in areas with intense perennial malaria trans-mission in 2000 [9,10]. Over the following decade, funding for malaria control increased dra-matically—from less than $1 million in 2000 to more than $30 million in 2006 and nearly $140million in 2010 –a cumulative investment of $452 million (S1A and S1B Fig). This fundingfacilitated the adoption and implementation of a series of malaria control policies and strate-gies (Fig 1) [11,12]. Social marketing of ITNs and insecticide treatment kits began in 2000 [13].A year later, high levels of chloroquine resistance prompted a shift to sulfadoxine-pyrimeth-amine (SP) as first-line therapy for uncomplicated malaria [14,15]. In 2002, NMCP’s firstMedium-term Strategic Plan 2002–7 was implemented and IPTp using SP was adopted to con-trol malaria in pregnancy. Large-scale ITN distribution began with the Tanzania NationalVoucher Scheme targeted to pregnant women [16] in 2004 and then infants in 2007 [17]. AsecondMedium-term Strategic Plan 2008–13 called for an ACT (artemether-lumefantrine) asfirst-line therapy (from 2007), RDTs at peripheral health facilities (from 2009), and a target of80% ITN coverage by 2010. Distribution of 8.6 million free long-lasting insecticidal nets(LLINs) to all children less than five years of age began in 2009 and was completed in 2010[18]. Later that year a universal coverage campaign began to distribute 18 million free LLINs tocover all remaining sleeping spaces [19]. IRS was implemented in Kagera beginning in 2007,and advanced to Mwanza and Mara (three of the original 21 administrative regions) by 2010,but covered only 6% of the national population.
By 2010 malaria intervention coverage had been brought to levels where an impact may rea-sonably be expected. After a decade of stagnation, all-cause under-five child mortality (U5CM)
Impact of Malaria Control in Tanzania
PLOS ONE | DOI:10.1371/journal.pone.0141112 November 4, 2015 2 / 24
AIS_2007.cfm?flag=0), and the 2010 TanzaniaDemographic and Health Survey (http://dhsprogram.com/data/dataset/Tanzania_Standard-DHS_2010.cfm?flag=0).
Funding: The household surveys included in thisanalysis were funded in part by the United Republicof Tanzania Ministry of Health and Social Welfare, U.S. Agency for International Development, UnitedNations Children's Fund, The Global Fund,Department for International Development, UnitedNations Population Fund, World Food Programme,United Nations Development Programme, and IrishAid. The authors received no specific funding for thiswork.
Competing Interests: The authors have declaredthat no competing interests exist.

declines were already evident by 2005 [20], and current UNICEF data indicate Tanzania likelyachieved theirMillennium Development Goal 4 (MDG4) target of a two-thirds reduction inU5CM between 1990 and 2015: modeled rates of U5CM declined from 166 to 132 to 54 deathsper 1000 live births in 1990, 2000, and 2012, respectively (a 68% decline) [21].
The Roll Back Malaria (RBM) Partnership’s Monitoring and Evaluation Reference Group(MERG) recommends U5CM as the primary indicator of malaria control impact [22]. Thisrecommendation is based on our: 1) inability to measure malaria-specific mortality in mostdeveloping countries, 2) expectation that rapid scale-up of interventions to high levels willresult in measurable declines in U5CM, and 3) recognition that malaria has a substantial indi-rect effect on mortality that will be captured in U5CM estimates [23]. The MERG approachassumes that a portion of the declining trends in U5CM can be plausibly attributed to malariacontrol efforts if improvements in population-level measurements are found in steps along thecausal pathway (e.g., increased ITN coverage and reduced severe anemia prevalence) [24]. AsU5CM rates and severe anemia prevalence decline at an accelerated pace, preceded by rapidscale-up of intervention coverage, the conclusion that malaria control efforts reduced malaria-specific mortality becomes more plausible. This plausibility is strengthened if trends in othercontextual factors (e.g., immunization, micronutrient supplementation, climate) affecting mor-tality did not appreciably change during the same period.
Our objective was a summative evaluation to determine if Tanzania’s scale-up of malariainterventions during 1999–2010 helped accelerate declines in malaria morbidity (particularlysevere anemia, a common manifestation of Plasmodium falciparum infection in high transmis-sion areas [25,26]) and U5CM. The evaluation is restricted to Tanzania Mainland since Zanzi-bar has a separate Ministry of Health and its National Malaria Control Program followed adifferent trajectory.
MethodsAll surveys were approved by the ethical review board of Tanzania's National Institute forMedical Research and ICF International's institutional review board. Verbal informed consentwas sought from all survey respondents, with an informed consent statement signed by eachsurvey interviewer. All analyses were performed on anonymized and de-identified datasets.
Fig 1. Timeline depicting years when national-level implementation of specific malaria controlpolicies and interventions began in Mainland Tanzania, 2000–2010.
doi:10.1371/journal.pone.0141112.g001
Impact of Malaria Control in Tanzania
PLOS ONE | DOI:10.1371/journal.pone.0141112 November 4, 2015 3 / 24
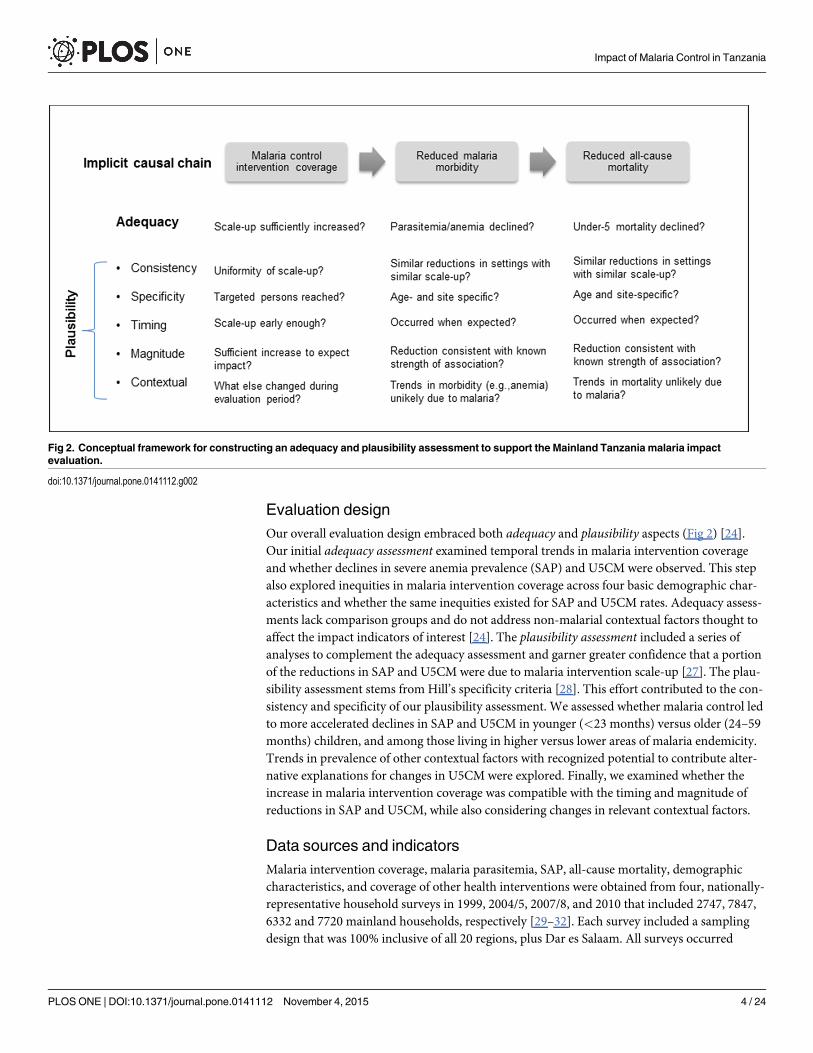
Evaluation designOur overall evaluation design embraced both adequacy and plausibility aspects (Fig 2) [24].Our initial adequacy assessment examined temporal trends in malaria intervention coverageand whether declines in severe anemia prevalence (SAP) and U5CM were observed. This stepalso explored inequities in malaria intervention coverage across four basic demographic char-acteristics and whether the same inequities existed for SAP and U5CM rates. Adequacy assess-ments lack comparison groups and do not address non-malarial contextual factors thought toaffect the impact indicators of interest [24]. The plausibility assessment included a series ofanalyses to complement the adequacy assessment and garner greater confidence that a portionof the reductions in SAP and U5CM were due to malaria intervention scale-up [27]. The plau-sibility assessment stems from Hill’s specificity criteria [28]. This effort contributed to the con-sistency and specificity of our plausibility assessment. We assessed whether malaria control ledto more accelerated declines in SAP and U5CM in younger (<23 months) versus older (24–59months) children, and among those living in higher versus lower areas of malaria endemicity.Trends in prevalence of other contextual factors with recognized potential to contribute alter-native explanations for changes in U5CM were explored. Finally, we examined whether theincrease in malaria intervention coverage was compatible with the timing and magnitude ofreductions in SAP and U5CM, while also considering changes in relevant contextual factors.
Data sources and indicatorsMalaria intervention coverage, malaria parasitemia, SAP, all-cause mortality, demographiccharacteristics, and coverage of other health interventions were obtained from four, nationally-representative household surveys in 1999, 2004/5, 2007/8, and 2010 that included 2747, 7847,6332 and 7720 mainland households, respectively [29–32]. Each survey included a samplingdesign that was 100% inclusive of all 20 regions, plus Dar es Salaam. All surveys occurred
Fig 2. Conceptual framework for constructing an adequacy and plausibility assessment to support the Mainland Tanzania malaria impactevaluation.
doi:10.1371/journal.pone.0141112.g002
Impact of Malaria Control in Tanzania
PLOS ONE | DOI:10.1371/journal.pone.0141112 November 4, 2015 4 / 24
during the drier season (Sep-Feb), but fieldwork for the 2010 survey extended three monthslonger. Malaria intervention coverage was measured using six standard RBM indicators [33]including the proportion of: households that owned at least one ITN; children<5 years of age,pregnant women, and de facto survey population who slept under an ITN the night before thesurvey; women who received IPTp-2 for pregnancies within the past two years; and children<5 years of age with fever in the past two weeks who received treatment with a first-line anti-malarial the same or next day after fever onset. Capillary blood specimens were obtained viafinger or heel prick from children 6–59 months of age who slept in each household the nightbefore the survey. Hemoglobin (Hb) concentration was measured (HemoCue1 instrument)and severe anemia defined as Hb< 8.0 g/dL, adjusted for altitude [34,35]. A histidine-rich pro-tein 2-based RDT (Paracheck1) detected P. falciparum parasitemia (2007/8 survey only).
Contextual factors (socio-economic, maternal and reproductive health, nutrition, immuni-zation, other morbidities) were sourced from the same surveys described above [29–32]. Addi-tional published sources are cited for trends in rainfall, growth in gross domestic product(GDP) [36], and HIV/AIDS indicators [37–39]. Rainfall data (1983–2010) were obtained fromapproximately 200 ground-based stations of the Tanzania National Meteorological Agency.Minimum/maximum temperatures were generated by combining weather station measure-ments with NASA’s land surface temperature estimates with a digital elevation model.
AnalysesTrends in intervention coverage, SAP and U5CM. For each survey, RBM core coverage
indicators were calculated with corresponding 95% confidence intervals (CIs) using standarderrors corrected for multi-stage survey design [34]. SAP estimates with 95% CIs were calculatedfor children 6–59 months of age. Direct estimates of U5CM and 95% CIs were calculated withthe synthetic cohort life table approach using birth histories over 0–4 years prior to each sur-vey. A chi-square test for linear trend in proportions assessed changes in intervention coverage,SAP and U5CM. ITN use, SAP, and U5CM were further stratified by four key demographiccharacteristics including sex (male/female), residence (urban/rural), wealth quintile, maternaleducation (none, primary incomplete, primary complete, secondary+) and plotted with corre-sponding 95% CIs to assess trends in equity. Under-five, infant, and neonatal mortality rateswith 95% CIs were plotted to reflect temporal trends from pre-baseline [40,41] throughendpoint.
Plausibility assessment (1): Temporal trends by age. Malaria morbidity and mortalityare highly age-dependent, with younger children (<24 months) at greater risk for both out-comes, particularly in areas with higher intensity P. falciparum transmission [42–44]. SAP wasstratified by age (6–23 and 24–59 months). Further mortality analyses excluded neonataldeaths since a minimal proportion of these deaths were likely attributable to malaria [45]. Thusall-cause mortality was dichotomized at 1–23 and 24–59 months of age.
Plausibility assessment (2): Temporal trends by malaria endemicity. SAP and mortalityrates were stratified by level of malaria endemicity to assess whether greater impact wasobserved in higher endemicity areas. Tanzania mainland regions were divided into threeendemicity categories: “lower” (7 regions, prevalence 0–9.2%), “moderate” (7 regions, preva-lence 10.4–21.9%), and “higher” (6 regions, prevalence 28.7–32.6%) using region-specific P. fal-ciparum prevalence from 2007/8 (the only national survey to include this indicator). Survey-specific adjusted odd ratios (ORs) for severe anemia and rate ratios (RRs) for all-cause mortal-ity were obtained using logistic and Cox proportional hazards regression models, respectively,to control for the four key demographic characteristics described above, malaria endemicitylevel, and age (logistic model only).
Impact of Malaria Control in Tanzania
PLOS ONE | DOI:10.1371/journal.pone.0141112 November 4, 2015 5 / 24

Plausibility assessment (3): Temporal trends by age and malaria endemicity com-bined. Age and malaria endemicity exhibited differential risk for SAP and all-cause childmortality. Trends in these outcomes were assessed separately for children 1–23 months of ageand children 24–59 months of age, stratified by endemicity.
Plausibility assessment (4): Accounting for contextual factors. Climate data were exam-ined in a three-step analysis (IRI Report, supplemental online material). The Climate Suitabil-ity for Malaria Transmission Tool [46] was first used to estimate the number of months duringthe year when climatological conditions were suitable for malaria transmission. AWeightedAnomaly of Standardized Precipitation (WASP) Tool [47,48] estimated the change in rainfallover the evaluation period relative to baseline (1995–99). WASP and temperature data werecombined to assess whether the prevailing climate in Tanzania was suitable for malaria trans-mission relative to baseline. The Climate Analysis Tool explored annual precipitation and tem-perature data according to temporal and spatial factors affecting malaria transmission. Changein per capita GDP (constant prices) was expressed as cumulative change between 1995–1999and 2005–2009. For all other contextual factors, baseline (1999) and endpoint (2010) valueswith 95% CIs and percent changes (relative) were obtained. Differences in baseline and end-point values were assessed with a Z-test using the standard errors in the Z-score formula. For asmall subset of factors lacking 1999 and 2010 values (e.g., HIV/AIDS indicators) the earliestand latest available estimates were used for baseline and endpoint.
Plausibility assessment (5): Magnitude of reductions in all-cause mortality. We derivedthe attributable changes in U5CM due to the observed increases in malaria intervention cover-age between 1999 and 2010 and for contextual factors with significant change over the sameperiod. These reductions were derived using population attributable risk percentage (PAR%)calculations based on prevalence of exposure (E) and non-exposure (Ē) to each factor in 1999and 2010, respectively, and published estimates of relative risk (RR) for all-cause mortalityassociated with that exposure factor [49–59]. The published RR estimate for effective first-lineantimalarials (specifically ACTs) used malaria-specific mortality rather than all-cause mortal-ity. The unadjusted PAR% is useful for comparing the crude marginal effects of multiple inter-ventions and was calculated as:
PAR% ¼ �E2010 þ RRðE2010Þ � ½�E1999 þ RRðE1999Þ� = �E 1999 þ RRðE1999Þ
[60].It is an estimate of how the change in prevalence of each risk factor (intervention or expo-
sure) and known strength of the association with mortality resulted in either increases ordecreases in rates of U5CM. The PAR% provides an informative link between causality andpublic health action [61,62].
Results
Adequacy assessment: Trends in intervention coverage and rates ofSAP and U5CMMalaria intervention coverage generally improved between 1999 and 2010 (Table 1). House-hold ownership of ITNs and ITN use by children less than 5 years of age, pregnant women,and the de facto population as a whole increased by 61, 62, 55, and approximately 45 percent-age points, respectively. A marked increase in ITN coverage between 2007/8 and 2010 followedthe distribution of 18 million free ITNs to children less than 5 years of age (May 2009–May2010). The proportion of pregnant women who received at least two doses of SP for IPTpincreased from 21% in 2005 to 26% in 2010 (p<0.0001). During 1999–2010, a high percentage(53% in 1999 and 60% in 2010) of children with fever in the two weeks preceding the
Impact of Malaria Control in Tanzania
PLOS ONE | DOI:10.1371/journal.pone.0141112 November 4, 2015 6 / 24

Table 1. Trends in malaria intervention coverage indicators, Mainland Tanzania, 1999–2010.
Variable†† 1999 2004/5 2007/8 2010% % % %
(95% CI) (95% CI) (95% CI) (95% CI)N N N N Change (abs.)* p†
Nets
Household ownership �1 29.8 45.9 55.6 74.7 44.9 <0.0001
(25.6–34.3) (43.1–48.6) (52.9–58.2) (72.8–76.4)
3,526 9,483 8,269 9,377
ITNs
Household ownership �1 ~2.4 22.5 38.3 63.5 61.1 <0.0001
- (20.5–24.6) (36.1–40.6) (61.7–65.2)
3,526 9,483 8,269 9,377
Use (children <5 yrs) ~1.7 15.8 24.8 63.9 62.2 <0.0001
(1.2–2.8) (13.9–18.0) (22.6–27.2) (61.2–66.5)
3,495 8,147 7,319 7,768
Use (pregnant women) ~1.9 15.7 26.0 57.1 55.2 <0.001
(0.8–4.6) (12.9–19.1) (21.7–30.9) (52.4–61.6)
369 1,054 823 922
Use (all persons) n/a** 14.9 19.7 45.1 ~45 <0.0005
(13.3–16.7) (17.8–21.6) (43.4–46.9)
44,830 40,660 45,125
IPTp during last pregnancy
2+ doses n/a 20.8 29.6 25.7 25.7 <0.0001
(19.0–22.7) (27.0–32.3) (23.6–28.0)
3,415 2,969 3,179
1+ dose n/a 50.1 56.9 59.9 59.9 <0.0001
(47.1–53.1) (53.5–60.3) (56.8–62.9)
3,415 2,969 3,179
Malaria treatment
Any antimalarial (timing not considered) 53.0 58.2 57.0 60.1 7.1 0.2347
(45.2–60.6) (54.7–61.5) (52.4–61.6) (56.7–63.4)
988 1,882 1,320 1,715
Recommended first-line (same or next day) ‡ n/a 21.4 14.2 26.7 5.3‡ 0.0002
(18.7–24.2) (11.6–17.2) (23.8–29.8)
1,882 1,320 1,715
* Percent absolute change, earliest value vs. 2010† P-value obtained from chi2 test for linear trend in proportions across the four surveys (trend test begins with 2004/5 for indicators with “n/a” in 1999)‡ First-line therapy in 1999: chloroquine; 2004/5: sulfadoxine/pyrimethamine; 2007/8 and 2010: ACT
** No ITN indicators were obtained in the 1999 (baseline) survey since these indicators were only developed and promoted by RBM after 2002.
Consequently, the 1999 survey questionnaire did not include a full roster of nets, net treatment and use. All families were questioned about the number of
nets they owned and the number of children <5 years of age per household was recorded, but net treatment (soaking in insecticidal solution) was asked
only for households with children <5 years of age where some or all children slept under nets. The data available permitted a precise estimate of
household net ownership; a fairly precise estimate of net and ITN use by children under five, and an estimate of household ITN ownership using available
data on proportion of nets that were treated.††N in the table represents weighted denominator (number of households, children under 5 years of age, pregnant women, all persons, or febrile children
under 5 years of age) for each variable shown
doi:10.1371/journal.pone.0141112.t001
Impact of Malaria Control in Tanzania
PLOS ONE | DOI:10.1371/journal.pone.0141112 November 4, 2015 7 / 24

household survey received antimalarial treatment. The percentage of children who received afirst-line antimalarial the same or next day following fever onset did not exceed 27% andshowed no consistent trend.
SAP among children 6–59 months of age declined 50%: from 11.1% (95% CI, 10.0–12.3%)in 2004/5, to 7.5% (95% CI, 6.6–8.6%) in 2007/8, and 5.5% (95% CI, 4.7–6.4%) in 2010 (trend p<0.0001). U5CM rates declined 45%: from 148 (95% CI; 129–166) deaths per 1000 live birthsin 1999, to 112 (95% CI, 103–122) in 2004/5, to 92 (95% CI, 83–101) in 2007/8, and 81 (95%CI, 72–90) in 2010 (trend p<0.0001); a decline of 67 deaths per 1,000 live births relative tobaseline. Much of the decline in U5CM was due to a 49% reduction in infant mortality rate,but with no significant improvement in neonatal mortality (Fig 3): rates remained relativelyunchanged across pre-baseline periods: 1987–91, 1991–5, and 1995–99.
Stratification by demographic characteristics revealed trends in ITN use among childrenless than 5 years of age, SAP, and U5CM associated with residence, wealth, and maternal edu-cation, but not sex. In the earlier surveys, ITN use was lower (S2A Fig) and SAP (S2B Fig) andmortality rates (S2C Fig) were higher among rural children, among children from poorerhouseholds, and among children with less educated mothers. These disparities disappeared by2010. Small numbers in the malaria treatment categories precluded analysis of trends by resi-dence, wealth, and maternal education.
Plausibility assessment (1 and 2): SAP and all-cause mortality declinedfaster among youngest children and those residing in higher endemicityareasIn 2004/5, the SAP among children 6–23 months of age (17.1%) was over twice as high than inchildren 24–59 months of age (7.8%) (adjusted OR = 2.5, 95% CI 2.1–2.9). Subsequently, age-stratified SAP estimates improved over time, with a more accelerated decline among children6–23 months (Fig 4A). In 2004/5, SAP was greater among children in the higher (15.8%) andmoderate (10.3%) endemicity strata as compared to children in the lower (6.5%, referent) stra-tum (adjusted OR = 2.4, 95% CI 1.8–3.2 and OR = 1.5, 95% CI 1.1–2.0, respectively). By 2010,declines in SAP in the higher and moderate endemicity areas were at least twice as great as thedeclines in lower endemicity (Fig 4C). Notably, the disparity in SAP across endemcity levelswas less pronounced in 2007/8, and by 2010 no differences were detected (adjusted OR = 1.4,
Fig 3. Trends in 5-year estimates of all-cause neonatal, infant, and under-five year mortality rates inMainland Tanzania, 1990–2010. Footnote: Each rate presented as the mid-point of the five-year interval itreflects (e.g., 2010 survey, measuring mortality 2005–2009, was plotted at 2007). Mortality among children1–59 months of age declined 54% between 1999 and 2010 (from 111 to 57 deaths per 1000 live births)compared to the 45% relative decline for the traditional 0–59 month age group described in text.
doi:10.1371/journal.pone.0141112.g003
Impact of Malaria Control in Tanzania
PLOS ONE | DOI:10.1371/journal.pone.0141112 November 4, 2015 8 / 24

95% CI 0.9–2.2 and OR = 1.3, 95% CI 0.8–2.1 for higher and moderate endemicity,respectively).
Children 1–23 months of age experienced a more accelerated decline in mortality rate overtime (from 78 to 35 deaths per 1000 live births) as compared to 24–59 month old children(from 28 to 19 deaths per 1000 live births) (Fig 4B).
In 1999, mortality was higher in children from higher endemicity compared to lowerendemicity areas (adjusted RR = 1.4, 95% CI 1.1–1.8), but not in those from moderateendemicity areas (adjusted RR = 1.1, 95% CI 0.9–1.6). These all-cause mortality trends in chil-dren 1–59 months of age also declined markedly across endemicity (Fig 4D), with greaterdeclines among children from the higher and moderate endemicity areas in a pattern similar tothe SAP analysis. Mortality risk in 2004/5 remained greater in the higher (adjusted RR = 1.4,95% CI 1.2–1.7) and moderate (adjusted RR = 1.4, 95% CI 1.2–1.7) endemicity groups. By2010, mortality in the higher endemicity stratum still remained greater (RR = 1.7, 95% CI 1.3–2.1), but rates in the moderate and lower strata had converged. Overall, a more accelerateddecline in all-cause mortality among 1–59 months of age occurred between 2000 and 2010 inthe higher and moderate endemicity areas (reductions of 70 and 100 deaths per 1000 livebirths, respectively) as compared to the lower endemicity areas (reduction of 38 deaths per1000 live births).
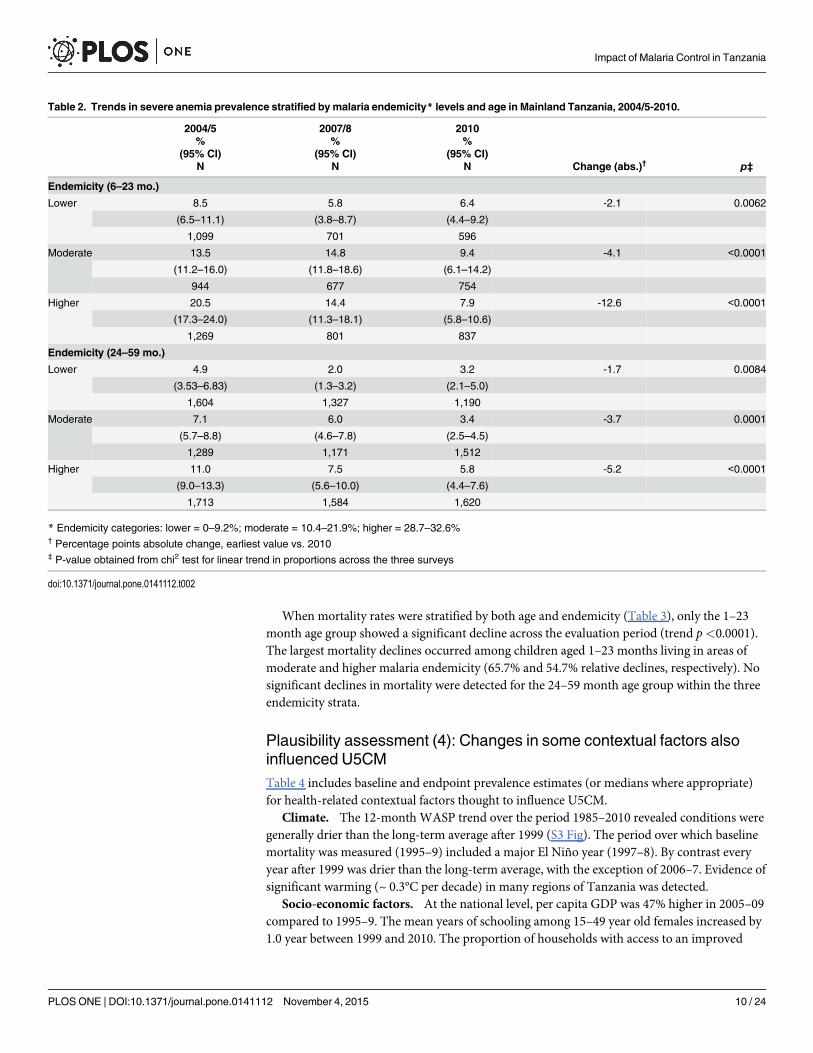
Plausibility assessment (3): SAP and all-cause mortality declined evenfaster among younger children residing in higher endemicityReductions in SAP over time were more evident upon combined stratification by age andendemicity (Table 2). In 2004/5, SAP among 6–23 month old children from low, medium, andhigh endemicity (8.5%, 13.5%, and 20.5%, respectively) were generally twice as high as theendemicity-specific estimates (4.9%, 7.1%, and 11.0% respectively) among the 24–59 monthold children. The overall reduction of SAP was most pronounced for the 6–23 month agegroup living in higher endemicity areas where SAP declined 67% between 2004/5 and 2010(from 20.5% to 7.9%).
Fig 4. Severe anemia prevalence and all-causemortality (deaths per 1000 live births) according to agegroup (A) and (B) andmalaria endemicity (C) and (D), respectively.
doi:10.1371/journal.pone.0141112.g004
Impact of Malaria Control in Tanzania
PLOS ONE | DOI:10.1371/journal.pone.0141112 November 4, 2015 9 / 24
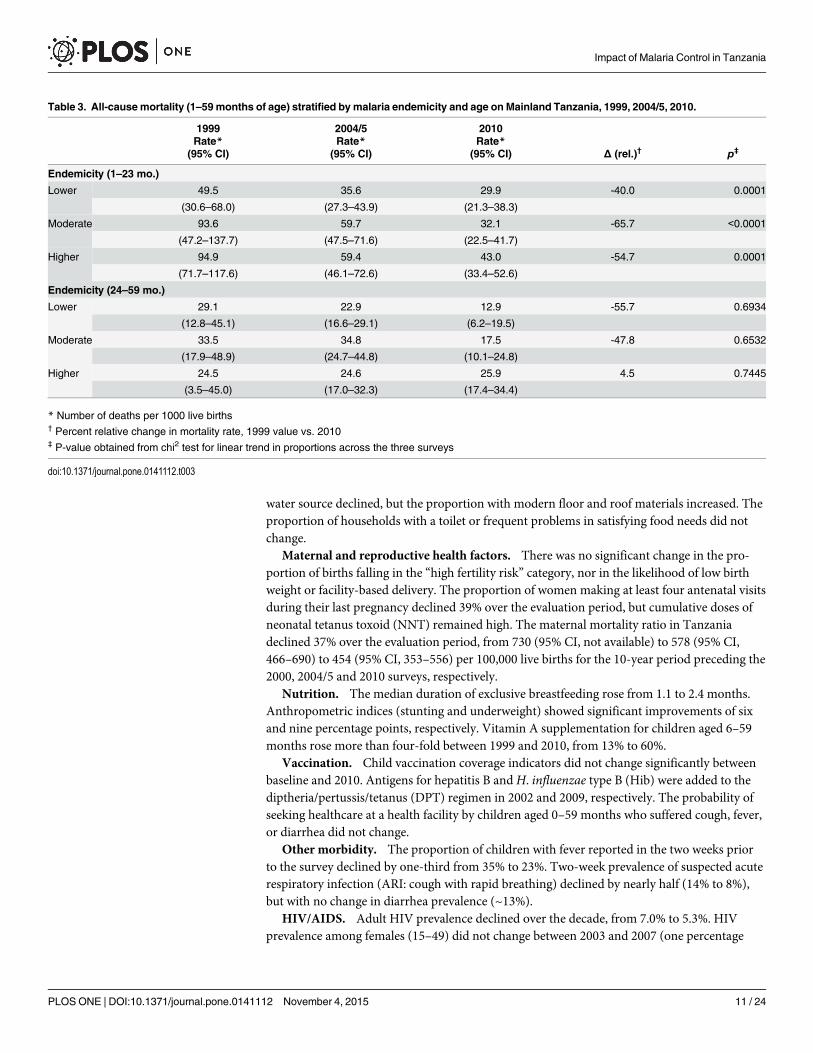
When mortality rates were stratified by both age and endemicity (Table 3), only the 1–23month age group showed a significant decline across the evaluation period (trend p<0.0001).The largest mortality declines occurred among children aged 1–23 months living in areas ofmoderate and higher malaria endemicity (65.7% and 54.7% relative declines, respectively). Nosignificant declines in mortality were detected for the 24–59 month age group within the threeendemicity strata.
Plausibility assessment (4): Changes in some contextual factors alsoinfluenced U5CMTable 4 includes baseline and endpoint prevalence estimates (or medians where appropriate)for health-related contextual factors thought to influence U5CM.
Climate. The 12-month WASP trend over the period 1985–2010 revealed conditions weregenerally drier than the long-term average after 1999 (S3 Fig). The period over which baselinemortality was measured (1995–9) included a major El Niño year (1997–8). By contrast everyyear after 1999 was drier than the long-term average, with the exception of 2006–7. Evidence ofsignificant warming (~ 0.3°C per decade) in many regions of Tanzania was detected.
Socio-economic factors. At the national level, per capita GDP was 47% higher in 2005–09compared to 1995–9. The mean years of schooling among 15–49 year old females increased by1.0 year between 1999 and 2010. The proportion of households with access to an improved
Table 2. Trends in severe anemia prevalence stratified by malaria endemicity* levels and age in Mainland Tanzania, 2004/5-2010.
2004/5 2007/8 2010% % %
(95% CI) (95% CI) (95% CI)N N N Change (abs.)† p‡
Endemicity (6–23 mo.)
Lower 8.5 5.8 6.4 -2.1 0.0062
(6.5–11.1) (3.8–8.7) (4.4–9.2)
1,099 701 596
Moderate 13.5 14.8 9.4 -4.1 <0.0001
(11.2–16.0) (11.8–18.6) (6.1–14.2)
944 677 754
Higher 20.5 14.4 7.9 -12.6 <0.0001
(17.3–24.0) (11.3–18.1) (5.8–10.6)
1,269 801 837
Endemicity (24–59 mo.)
Lower 4.9 2.0 3.2 -1.7 0.0084
(3.53–6.83) (1.3–3.2) (2.1–5.0)
1,604 1,327 1,190
Moderate 7.1 6.0 3.4 -3.7 0.0001
(5.7–8.8) (4.6–7.8) (2.5–4.5)
1,289 1,171 1,512
Higher 11.0 7.5 5.8 -5.2 <0.0001
(9.0–13.3) (5.6–10.0) (4.4–7.6)
1,713 1,584 1,620
* Endemicity categories: lower = 0–9.2%; moderate = 10.4–21.9%; higher = 28.7–32.6%† Percentage points absolute change, earliest value vs. 2010‡ P-value obtained from chi2 test for linear trend in proportions across the three surveys
doi:10.1371/journal.pone.0141112.t002
Impact of Malaria Control in Tanzania
PLOS ONE | DOI:10.1371/journal.pone.0141112 November 4, 2015 10 / 24
water source declined, but the proportion with modern floor and roof materials increased. Theproportion of households with a toilet or frequent problems in satisfying food needs did notchange.
Maternal and reproductive health factors. There was no significant change in the pro-portion of births falling in the “high fertility risk” category, nor in the likelihood of low birthweight or facility-based delivery. The proportion of women making at least four antenatal visitsduring their last pregnancy declined 39% over the evaluation period, but cumulative doses ofneonatal tetanus toxoid (NNT) remained high. The maternal mortality ratio in Tanzaniadeclined 37% over the evaluation period, from 730 (95% CI, not available) to 578 (95% CI,466–690) to 454 (95% CI, 353–556) per 100,000 live births for the 10-year period preceding the2000, 2004/5 and 2010 surveys, respectively.
Nutrition. The median duration of exclusive breastfeeding rose from 1.1 to 2.4 months.Anthropometric indices (stunting and underweight) showed significant improvements of sixand nine percentage points, respectively. Vitamin A supplementation for children aged 6–59months rose more than four-fold between 1999 and 2010, from 13% to 60%.
Vaccination. Child vaccination coverage indicators did not change significantly betweenbaseline and 2010. Antigens for hepatitis B andH. influenzae type B (Hib) were added to thediptheria/pertussis/tetanus (DPT) regimen in 2002 and 2009, respectively. The probability ofseeking healthcare at a health facility by children aged 0–59 months who suffered cough, fever,or diarrhea did not change.
Other morbidity. The proportion of children with fever reported in the two weeks priorto the survey declined by one-third from 35% to 23%. Two-week prevalence of suspected acuterespiratory infection (ARI: cough with rapid breathing) declined by nearly half (14% to 8%),but with no change in diarrhea prevalence (~13%).
HIV/AIDS. Adult HIV prevalence declined over the decade, from 7.0% to 5.3%. HIVprevalence among females (15–49) did not change between 2003 and 2007 (one percentage
Table 3. All-causemortality (1–59months of age) stratified by malaria endemicity and age on Mainland Tanzania, 1999, 2004/5, 2010.
1999 2004/5 2010Rate* Rate* Rate*
(95% CI) (95% CI) (95% CI) Δ (rel.)† p‡
Endemicity (1–23 mo.)
Lower 49.5 35.6 29.9 -40.0 0.0001
(30.6–68.0) (27.3–43.9) (21.3–38.3)
Moderate 93.6 59.7 32.1 -65.7 <0.0001
(47.2–137.7) (47.5–71.6) (22.5–41.7)
Higher 94.9 59.4 43.0 -54.7 0.0001
(71.7–117.6) (46.1–72.6) (33.4–52.6)
Endemicity (24–59 mo.)
Lower 29.1 22.9 12.9 -55.7 0.6934
(12.8–45.1) (16.6–29.1) (6.2–19.5)
Moderate 33.5 34.8 17.5 -47.8 0.6532
(17.9–48.9) (24.7–44.8) (10.1–24.8)
Higher 24.5 24.6 25.9 4.5 0.7445
(3.5–45.0) (17.0–32.3) (17.4–34.4)
* Number of deaths per 1000 live births† Percent relative change in mortality rate, 1999 value vs. 2010‡ P-value obtained from chi2 test for linear trend in proportions across the three surveys
doi:10.1371/journal.pone.0141112.t003
Impact of Malaria Control in Tanzania
PLOS ONE | DOI:10.1371/journal.pone.0141112 November 4, 2015 11 / 24

Table 4. Prevalence (%) of contextual variables recognized to influence all-causemortality over time in Mainland Tanzania, 1999 versus 2010.
1999 2010value (95% CI) N value (95% CI) N Δ (%) p
Socio-economic
Real GDP% change (1999 = 100) 100 - - 147 - - 47% na
Women (15-49y) yrs of ed. (mean) 4.7 (4.4–5.0) 3,929 5.7 (5.5–5.9) 9,813 21% <0.0005
Improved water source1 65.8 (59.1–71.8) 3,526 56.9 (53.3–60.4) 9,377 -14% 0.016
Households with toilet2 88.8 85.5–91.4 3,526 86.3 84.1–88.3 9,377 -3% 0.17
Modern floor material3 20.9 (17.0–25.4) 3,526 31.8 (28.7–35.0) 9,377 52% <0.0005
Modern roof material4 50.6 (47.3–53.8) 9,483 61.9 (58.9–64.9) 9,377 22% <0.0005
Problem satisfying food needs5 22.6 (21.2–24.1) 9,483 23.3 (21.6–25.1) 9,377 3% 0.54039
Maternal & reproductive
Births any high-risk fertility category6 56.9 (53.6–60.2) 3,196 57.1 (55.2–58.9) 7,955 0% 0.916
ANC visits 4+ 69.9 (63.8–75.4) 2,131 42.7 (40.6–44.8) 5,378 -39% <0.0005
Last pregnancy protected against NNT7 81.0 88.2 (86.7–89.6)) 5,378 9%
Delivery at a health facility 43.7 (37.6–50.0) 3,196 50.2 (46.9–53.4) 7,955 15% 0.067
Low birth weight <2500g (%) 8.4 (6.3–11.2) 772 6.1 (5.0–7.4) 2,786 -27% 0.096
Female HIV prevalence (15-49y)8 7.7 (6.8–8.6) 5,753 6.8 (6.0–7.6) 7,909 -12% na
Nutrition
Median duration exclusive breastfeed (mo) 1.1 326 2.4 818 118%
Under-fives stunted (%)9 44.0 (40.5–47.5) 2,746 35.7 (34.0–37.4) 7,265 -13% 0.003
Under-fives underweight (%)10 29.5 (26.5–32.7) 2,746 20.5 (19.1–22.0) 7,265 -31% <0.0005
Vitamin A supplementation (6-59mo)11 13.3 (10.3–16.9) 2,503 59.8 (57.4–62.2) 6,638 350% <0.0005
Vaccination
BCG 92.6 (89.7–95.5) 578 95.4 (93.5–96.8) 1,533 3% 0.13
DPT3 / DPT3-HB-Hib 80.9 (73.2–86.9) 578 87.8 (84.8–90.3) 1,533 9% 0.064
Polio3 79.9 (74.4–85.3) 578 84.9 (81.7–87.6) 1,533 6% 0.112
Measles 78.2 (72.0–84.4) 578 84.5 (81.6–86.9) 1,533 8% 0.061
All (BCG, measles, DPT3, polio3) 68.3 (61.1–74.7) 578 75.1 (71.6–78.3) 1,533 10% 0.077
Health Care Access
Health care utilisation12 70.1 63.4–76.1 1,399 68.6 65.9–71.1 2,776 -2% 0.669
Morbidity (past 2 weeks)
Fever 35.3 (31.8–39.0) 2,792 23.2 (21.5–24.9) 7,388 -35% <0.0005
Suspected ARI13 13.8 (12.0–15.8) 2,820 7.7 (6.9–8.6) 7,461 -44% <0.0005
Diarrhoea 12.4 (10.6–14.5) 2,820 14.6 (13.4–15.8) 7,461 18% 0.06
Any14 49.6 (46.4–52.9) 2,820 37.2 (35.5–39.0) 7,461 -25% <0.0005
HIV/AIDS (UNAIDS 2011 and 2013)[109,110]
Adult (male/female) HIV prevalence (15-49yrs) 7.0 (6.3–7.8) 5.3 (4.8–5.8)
Female HIV prevalence (15–49 yrs) 7.7 (6.8–8.6) 6.3 (5.7–7.0)
Pregnant women tested for HIV <1% n/a 86 —
Pregnant women HIV prevalence 5.3 —
Eligible ARV coverage (all age)15 <1% n/a 42 (39–46)
Eligible children (<15 y) ARV coverage <1% n/a 18 (16–21)
HIV-infected PW recv ARV for PMTCT <1% n/a 59 (52–68)
(Continued)
Impact of Malaria Control in Tanzania
PLOS ONE | DOI:10.1371/journal.pone.0141112 November 4, 2015 12 / 24

point decline). Prevention of mother-to-child HIV transmission (PMTCT) services com-menced in 2002. National program statistics indicate that the proportion of births to HIVinfected mothers protected by PMTCT rose from close to zero to approximately 50% in 2008.
Plausibility assessment (5): Magnitude & direction of expected changesin U5CMMalaria interventions and several other contextual factors contributed to reductions/increasesin U5CM (Table 5). Among the malaria interventions scaled-up nationally, the greatest reduc-tion in U5CM was attributable to ITN use among children less than 5 years of age, with a PAR% of 11%. Improvement in ITN use among pregnant women and IPTp (at least two doses) cov-erage both contributed to reductions, but only in the neonatal period (based upon publishedefficacy estimates for these interventions). Our derived RR for malaria-specific mortality asso-ciated with prompt access to effective first-line antimalarials yielded a PAR% of 18%.
Among the multiple contextual factors with significant change between 1999 and 2010, atleast six would be expected to result in declines in U5CM, ranging from 3% (PMTCT coverageimprovement and declines in prevalence of stunting) to 10% (vitamin A supplementationimprovement) based on published estimates of RR. Likewise, declines in four or more antenatalcare (ANC) visits over the evaluation period were associated with mortality increases (PAR% =11%), but mostly through neonatal deaths. These factors are not expected to be entirely inde-pendent of one another so that the individual impact magnitude cannot simply be summed.Nonetheless, this analysis serves to compare the expected impact of increased malaria interven-tion coverage as compared to the anticipated effect of changes in multiple other contextual fac-tors unrelated to malaria control.
Table 4. (Continued)
1999 2010value (95% CI) N value (95% CI) N Δ (%) p
HIV-exposed infants recv ARV for PMTCT <1% 68 (59–77)
1 Piped, tap, protected well, borehole2 Flush, VIP or traditional pit latrine3 Cement, tiles or other (not earth/sand/dung)4 Iron sheets, tiles, concrete, asbestos5“often” or “always” had problems satisfying food needs in past year
6 Any one or combination of: parity = 1 or 4+; age <18 or 35+; birth spacing <24 months, multiple birth7 NNT = neonatal tetanus. Includes mother with 2 injections during pregnancy of her last birth, or 2+ injections (past 3 years of last birth), or 3+ injections
(past 5 years of last birth), or 4+ injections (past 10 year of last birth, or 5+ injections prior to last birth8 Baseline figure 2003 (THIS), endpoint 2007/8 (THMIS)9 Height-for-age is below -2 SD from the median of the NCHS/CDC/WHO international reference population10 Weight-for-age is below -2 SD from the median of the NCHS/CDC/WHO international reference population11 Percent of children aged 6–59 months who received Vitamin A supplementation in past 6 months12 Percent of children 0–59 months with cough/fever/diarrhea taken to a health facility for treatment13 Definition of ARI comparable across surveys14 One or more of fever, ARI, diarrhea15 Coverage estimates based on the estimated unrounded numbers of people receiving antiretroviral therapy and the estimated unrounded need for
antiretroviral therapy (based on UNAIDS/WHO methods). The ranges in coverage estimates are based on plausibility bounds in the denominator: that is,
low and high estimates of need.
doi:10.1371/journal.pone.0141112.t004
Impact of Malaria Control in Tanzania
PLOS ONE | DOI:10.1371/journal.pone.0141112 November 4, 2015 13 / 24

DiscussionThis impact evaluation provides plausible evidence that a 45% reduction in U5CM in Tanzaniawas partially attributable to dramatic reductions in SAP following increased funding and adop-tion of sound policies to guide the scale-up of multiple malaria interventions during the period1999 to 2010. Younger age children (excluding neonates) from areas of higher malariaendemicity experienced the greatest declines in all-cause mortality and SAP (55% and 67%,respectively). Numerous other contextual factors associated with U5CM also improved overthe evaluation period and likely contributed to declines in mortality. However, few of these fac-tors contributed the same magnitude of mortality reduction as the combined malaria interven-tions. Our PAR% analysis illustrates how malaria control interventions contributed to the 45%decline in U5CM in Tanzania between 1999 and 2010, with 11% of this overall reductionattributable to ITNs alone. ITN use among Tanzanian children less than five years of agereached 64% by 2010, and further gains in child survival will be achieved with recent increasesin ITN coverage [63].
After a decade (1990s) of stagnation in child survival in Tanzania, the decline in U5CM(1999–2010) was almost certainly a consequence of reductions in malaria-specific mortalityassociated with the 50% decline in SAP. The age and endemicity stratifications for SAP andmortality exhibited a pattern of change consistent and specific to observed malaria risk, withdeclines most pronounced in the more vulnerable children aged 1–23 months (6–23 monthsfor SAP) in areas of higher malaria endemicity [42,64]. ITN coverage improved slowly between2000 and 2007/8, and then increased abruptly by 2010. At time of the 2010 survey, childrenless than 24 months of age had benefited from this protection, helping to further acceleratemortality declines in this age group. While low IPTp coverage likely had only minimal impact
Table 5. Coverage estimates of important child survival interventions and corresponding relative risk estimates with predicted proportions of all-cause under-5 mortality averted (or increased) in Mainland Tanzania, 1999–2010.
Intervention/risk factor 1999 2010 Published effect estimate Decrease/increase in U5 mortality (PAR%)(baseline) (endpoint) RR (95% CI) Source††
Malaria Interventions
ITN use <5yrs <2% 64% 0.82 (0.75–0.90) -11% (1–59 mo) [49]
ITN use pregnant women <2% 57% 0.84 (0.76–0.93) - 9% (neonatal) [50,51]
IPTp-2+ 0% 26% 0.80 (0.71–0.91) - 5% (neonatal) [50]
Effective 1st line therapy* 10% 27% 0.02 (0.01–0.14) - 18% (malaria-specific, 1–59 mo) [52]
Other contextual factors
Female education (median) 4.7 y 5.7 y 0.50 - 8% [53]
ANC visits 4+ 70% 43% 0.68 (0.59–0.79) + 11% (neonatal) [54]
PMTCT† <<1% 4% 0.57 - 3% [55]
Exclusively breastfed <6 mo. 32% 50% 0.41 (0.24–0.69) - 8% (<6 mo) [56]
Stunted‡ 44% 36% 1.47 (1.21–1.78) -3% [57]
Underweight** 30% 21% 2.49 (1.56–3.97) -9% [57]
Vitamin A supplementation 13% 60% 0.76 (0.69–0.83) - 10% [58,59]
* 1999 exposure estimate assumes half of febrile children seeking treatment received ineffective therapy due to P. falciparum reduced susceptibility to
chloroquine. Artemisinin-based combination therapy relative risk based on malaria-specific mortality reduction in ACT efficacy trials.† Prevention of mother-to-child transmission (PMTCT) of HIV infection. Figures represent proportion of all pregnant women (HIV infected and uninfected)
receiving PMTCT‡ Height-for-age is below -2 SD from the median of the NCHS/CDC/WHO international reference population
** Weight-for-age is below -2 SD from the median of the NCHS/CDC/WHO international reference population†† Sources for RR estimates represent meta-analyses or multi-country studies
doi:10.1371/journal.pone.0141112.t005
Impact of Malaria Control in Tanzania
PLOS ONE | DOI:10.1371/journal.pone.0141112 November 4, 2015 14 / 24

on U5CM, these same pregnant women also benefited from access to ITN vouchers, resultingin increased protection for infants. Although no clear trend was observed in the proportion ofchildren<5 years of age that received prompt treatment of fever with first-line antimalarials,substantial treatment efficacy had already been lost twice before national treatment policiestransitioned. In 2000, chloroquine treatment failures by day 14 were 45% in Africa and as highas 71% in Tanzania [14] where 22 million malaria cases (confirmed or probable) were reportedamong children<5 years of age that year. A substantial number of these uncomplicatedmalaria cases treated with chloroquine likely experienced poor hematologic recovery whichincreased their risk of progression to severe malaria, an outcome associated with a 10–15%case-fatality rate, and up to 25–50% when accompanied by other severe sequelae [65,66]. Justfive years later (2005) and only three years after SP replaced chloroquine, SP failure was 40%by day 14 [67]. Before SP was replaced with ACT as first-line treatment in 2007, some propor-tion of Tanzania’s annual 14–18 million uncomplicated malaria cases treated with SP during2004–6 likely progressed to severe malaria with high case-fatality. Artemether-lumefantrine(mainland Tanzania’s first-line ACT) presently remains a highly efficacious treatment in Tan-zania [68].
UNICEF estimates U5CM in Africa declined 20% between 2000 and 2010 (from 159 to 127deaths per 1000 live births), with over one million children’s lives saved due to malaria inter-ventions [4,69]. Recent national and sub-national analyses are more consistent with the higherreductions presented in this report. Zambia reduced U5CM 36% between 2001/2 and 2007,while severe anemia and parasitemia prevalence declined 68% and 53%, respectively, followingrapid scale-up of malaria interventions [70]. U5CM in Rwanda declined 50% (from 152 to 76deaths per 1000 live births) between 2001–5 and 2006–10, mostly following scale-up ITNs andACTs [71]. On Bioko Island after four years of intervention scale-up (2005–08), U5CMdeclined 64% (from 152 to 55 deaths per 1000 live births) and SAP declined 86% (from 15% to2%) [72]. Zanzibar, part of the Republic of Tanzania, achieved high intervention coverage ear-lier than the mainland and U5CM declined 52% between 2002 and 2005 [73]. A recent analysisfrom two districts in Tanzania detected a 43% decline in all-cause mortality among children1–5 years of age between 1997 and 2009, with malaria interventions associated with theobserved decline [74]. Our results are consistent with these published findings.
The United Nations Inter-Agency Group for Child Mortality Estimation (IGME) and theInstitute for Health Metrics and Evaluation (IHME) have both derived Tanzania-specific esti-mates of U5CM. The decline in U5CM between 2000 and 2010 based on IGME estimates was42% (132 to 76 deaths per 1000 live births) [69,75], quite comparable to the 45% decline in thisreport. However, IHME estimates correspond to a decline in U5CM of only 23% (127 to 98deaths per 1000 live births) [76]. The IHME mortality estimates did not include 2010 TanzaniaDHS data, thus the IHME modelled estimates likely over-estimated U5CM for 2010.
In 2010 the largest contributors to U5CM in Africa included perinatal causes (30%), pneu-monia (14%), diarrheal diseases (11%), HIV/AIDS (4%), and malnutrition through synergywith prevalent infectious diseases (35%) [77]. With approximately 15% of U5CM in Africacaused by malaria in 2010 (down from over 20% in 2000) [78], we carefully considered over 30other Tanzania-specific contextual factors (socioeconomic, biological, and environmentalrisks) in our plausibility assessment of alternative explanations for declines in U5CM. Othershave shown limited or no declines in neonatal mortality rates in Africa for the period 2000–10[76,79], and the same was observed in Tanzania. Low levels of maternal education are associ-ated with higher rates of U5CM, and in many countries more than half of the recent reductionsin child deaths are linked to improvements in female education [53,80,81]. A recent analysisshowed that for each one year increase in education of reproductive-age women (as observedin Tanzania), U5CM decreased by 9.5% [53]. Likewise, a 1% annual increase in GDP per capita
Impact of Malaria Control in Tanzania
PLOS ONE | DOI:10.1371/journal.pone.0141112 November 4, 2015 15 / 24
is associated with 0.4–0.6% reduction in U5CM [82]. Tanzania’s GDP per capita increased 47%(from $297 to $438, current U.S. dollars) between 1999 and 2010 [83], one of the fastest grow-ing economies in Africa [84]. This growth in GDP could potentially correspond to a 18–27%reduction in U5CM, or between one-third and one-half of the 45% overall decline in U5CMover the same period. Water, sanitation and hygiene indicators did not significantly change.
The single biggest improvement among the biological determinants of child health was per-centage of children 6–59 months of age who received vitamin A supplementation in the pastsix months. This intervention can reduce U5CM by up to 20%, particularly in high-prioritycountries (such as Tanzania) [58,59]. Despite a nearly 5-fold increase in vitamin A coveragebetween 1999 and 2010, the prevalence of vitamin A deficiency (serum retinol<0.70 μmol/l)among Tanzanian children actually increased from 24% in 1997 [85] to 38% in 2010 [86]. ThusTanzania had a severe public health problem of vitamin A deficiency (prevalence�20%among child< 5 years) throughout our evaluation period. Notably, WHO recommends a vita-min A coverage threshold of 70%, the minimal level at which a country can expect to observemeaningful reductions in child mortality. Tanzania had only reached supplementation of 60%by 2010, making large reductions in U5CM attributable to this intervention unlikely [32].
Pregnant women, their unborn fetuses, and newborns benefit from four or more antenatalcare (ANC4+) visits [54]. Two doses of tetanus toxoid to protect against neonatal tetanus isone intervention provided at ANC [87]. During the evaluation period, pregnant women com-pleting ANC4+ visits declined by 39% which may have increased neonatal mortality. However,sufficient cumulative dosage of tetanus toxoid remained high and thus did not account foraccelerated declines in U5CM. Maternal survival has a dramatic impact on U5CM, but it isvery difficult to measure and confidence intervals are often wide [88,89]. The 37% decline inthe maternal mortality ratio between 2000 and 2010 (from 730 to 460) [90] likely acceleratedthe declines in U5CM through other biologic determinants we examined.
Malaria transmission is sensitive to temperature and rainfall, but the effect of these onmalaria morbidity and mortality are not well delineated [91]. Temperature influences theextrinsic life-cycle of the parasite and may also modify vector or human behavior, all combin-ing to affect the transmission dynamics of sporozoites [92]. While rainfall suitable for malariatransmission persisted in Tanzania throughout the evaluation period, it is unlikely that varia-tions in rainfall significantly altered malaria transmission. Climatic variables alone did not pre-dict malaria outcomes in other analyses from northeastern Tanzania [93,94].
Tanzania experienced changes in multiple indicators of childhood nutrition, an importantdeterminant of U5CM. Exclusive breast feeding in the first six months of life is recommendedby WHO and UNICEF to partially protect against diarrheal and acute respiratory illness andmortality. Supplementation of breast milk with other liquids and foods begins very early inTanzania: nearly half of infants younger than 2–3 months receive supplements. Given the mod-est protective efficacy of exclusive breastfeeding versus partial or predominant breastfeeding[56,95], and the limited change in prevalence of exclusive breastfeeding in Tanzania over time,this practice likely accounted for only a small decline in U5CM. Stunting and underweightprevalence reflect shortness-for-age and low weight-for-age, respectively, and are indicators ofchronic malnutrition. Models estimate that a 5% reduction in prevalence of underweight isassociated with a 13% reduction in U5CM [96]. Wasting prevalence (low weight-for-height)can reflect a recent and severe event causing substantial weight loss, but this indicator did notchange in Tanzania during the evaluation period. No significant improvement in immuniza-tion coverage was detected during the evaluation period with the exception of Haemophilusinfluenza type b (Hib), introduced in 2009. While Hib is a contributor of meningitis and pneu-monia deaths among Tanzanian children under five, the rapid Hib vaccine coverage achieved
Impact of Malaria Control in Tanzania
PLOS ONE | DOI:10.1371/journal.pone.0141112 November 4, 2015 16 / 24

by 2010 (88%) is unlikely to have caused a decline in U5CM so soon after introduction (lessthan one year).
Among the 49.7 million HIV infections that occurred worldwide by 1999, 72% were in sub-Saharan Africa; as were 91% of child HIV infections and 94% of child AIDS deaths [97]. HIVprevalence in Tanzania was monitored through household surveys and ANC sentinel sites overour evaluation period. While HIV prevalence among adults declined over 30% between 1999and 2010, prevalence did not significantly decline among women of reproductive age or preg-nant women. Estimates of pediatric HIV/AIDS prevalence in Tanzania are not available, but inthe absence of antiretroviral therapy, over 50% of HIV-infected infants progress to AIDS anddie within 24 months [98]. As part of the global effort to eliminate new HIV infections ininfants, Tanzania accomplished major improvements in the provision of preventive servicesand care and treatment for HIV/AIDS, particularly PMTCT coverage which reached themajority of HIV-exposed infants by 2010. While PMTCT scale-up has reduced U5CM inAfrica [99], the scale-up of in Tanzania mostly occurred after 2007 and benefited a relativelysmall proportion of the population less than five years of age. The best estimate of the percent-age of pediatric deaths in Tanzania due to HIV/AIDS during 2010 was 5%, down from 8% in2000 [77].
Our approach was accompanied by multiple limitations. We were unable to includenational-level malaria morbidity/mortality data from health facilities, resulting in analysesentirely dependent upon household survey data. Using parasitemia prevalence data from onlythe 2007/8 Malaria Indicator Survey likely resulted in misclassification of our malaria endemic-ity categories over time. However, since malaria intervention scale-up in Tanzania occurred ata national level, this exposure misclassification over time was likely non-differential and thusnot disproportionately higher among children with anemia or those who died at a younger age.More recent reports from two distinct locations in Tanzania [100,101], while limited to onlyone or two villages, indicate major reductions in parasitemia over our same evaluation period.Health facility-based data would provide longitudinal and spatial changes in parasitema andanemia, important outcomes in the causal pathway considered in this evaluation. While all-cause mortality data from household surveys have excellent representativeness [22], the princi-ple limitation is the bias introduced to mortality estimates based solely upon birth historiesreported by respondents [102]. A disadvantage of using U5CM is the lack of specificity formalaria deaths and the non-malarial causes must be accounted for through adequacy and plau-sibility assessments. Likewise, U5CM reflects no impact for older children and adults who alsobenefit from malaria control in Tanzania, particularly those living with HIV/AIDS [103]. Mon-itoring ITN, IPTp, and case management outcome indicators through household surveys hasmultiple limitations. Prior to the deployment of LLINs (with insecticide incorporated into net-ting material), insecticide was hopefully applied directly to bednets by the beneficiary. Inabilityof a survey respondent to correctly recall timing of net retreatments may have produced unreli-able estimates of ITN coverage. An appropriately treated ITN or an LLIN with sufficient insec-ticidal content may still not protect a user due to excessive holes/tears in the net. Theproportion of children less than five years of age who sleep under an ITN continues to be influ-enced by perceptions regarding seasonal variation in malaria transmission risk [104,105]. Sincethese surveys are often done during the dry season to facilitate field team mobility, ITN use forthe rest of the year may be underestimated [106]. IPTp coverage may be unreliable stemmingfrom the respondent’s inability to identify which drug was given or how many doses [107]. Afinal major limitation of these household surveys is the lack of contemporary exposure data forchildren who died within the period covered by the survey. ITN use (night before the survey),first-line treatment (past two weeks), and all contextual factors were assessed only for childrenwho survived through the time of the survey visit, but are not assessed for child deaths in the
Impact of Malaria Control in Tanzania
PLOS ONE | DOI:10.1371/journal.pone.0141112 November 4, 2015 17 / 24

whole 5-year period preceding the survey. This limits the conventional epidemiologic analysesof individual-level exposure/outcome data and increased reliance upon a plausibility design[24].
Malaria case management (testing and treatment) indicators from household surveys areparticularly problematic for examining trends over time [52]. Respondents’ recall of facility-level diagnostic testing and treatment may not be valid. A final limitation relates to Hb mea-surement and estimates of SAP. Hb concentration among African children is influenced bymany determinants including age, sex, nutrition, infections, environment, and genetic factors[108]. While malaria interventions have been associated with a 60% reduction in the risk ofmoderate-to-severe anemia (Hb< 8 g/dL) [70], in most of Africa the leading cause of pediatricanemia is iron deficiency. Aside from age and malaria endemicity, our analyses did not exam-ine other anemia causing exposures. Notably, among Tanzania children 6–59 months of ageonly 1.4% received an iron supplement within seven days preceding the 2010 DHS [32].
Continued progress in malaria intervention scale-up and impact on the malaria burden inTanzania are further supported by the most recent 2012 Tanzania HIV/AIDS and MalariaIndicator Survey [39]. The national malaria prevalence estimate using RDTs declined to 10%in 2012, a 47% relative reduction from the national prevalence of 18% in 2007/8 (also RDT-based). One high burden region (Kagera) targeted for intensive malaria control efforts since2007 experienced a decline in malaria prevalence from 41% in 2007/8 to 8% in 2012 (and SAPamong children 6–59 months declined form 9.3% to 3.2%). Nationally, household ownershipof at least one ITN was 91% in 2012, up from less than 40% in 2007/8. The 2012 survey did notinclude new estimates for U5CM, but SAP among children 6–59 and 6–23 months (5.6% and7.8%, respectively) were not significantly different from 2010 estimates.
ConclusionAfter no improvement in child survival during the 1990s, the 45% reduction in U5CM and50% reduction in SAP following malaria intervention scale-up is a major public health achieve-ment for Tanzania. This impact was more accelerated among younger children (<23 monthsof age) living in higher malaria endemicity areas, the very children with the greatest potentialto gain health improvements following malaria intervention scale-up. While other factors alsocontributed to the observed declines in U5CM, the large proportion of decline plausibly attrib-utable to malaria control efforts is noteworthy. The progress achieved in malaria control canreverse quickly in the absence of continued financial support and strong political will. To avoida return to the intense perennial transmission conditions that prevailed for so long, sustainedfocus on and support for comprehensive programs to control malaria will be required in Tan-zania and other African countries.
Supporting InformationS1 Appendix. International Research Institute for Climate and Society/Mailman School ofPublic Health, The Earth Institute, Columbia University.Development of climate analysissection for the President’s Malaria Initiative impact evaluation: reports for Ethiopia and Tanza-nia, August 2012.(PDF)
S1 Fig. Annual funding levels and source of malaria control effort (A) and number of com-modities procured and distributed (B) in Mainland Tanzania, 2000–10. Footnote:�GoT = Government of Tanzania; PMI = U.S. President’s Malaria Initiative(TIF)
Impact of Malaria Control in Tanzania
PLOS ONE | DOI:10.1371/journal.pone.0141112 November 4, 2015 18 / 24
S2 Fig. Insecticide treated net (ITN) coverage (A), severe anemia (Hb< 8.0 g/dL) prevalence(B), and all-cause mortality among children under-five (C) stratified by background char-acteristics in Mainland Tanzania, 2004/5, 2007/8, and 2010.(TIF)
S3 Fig. Weighted anomaly of standardized precipitation (WASP) analysis for Tanzaniacomparing (A) baseline period (1995–99) and (B) malaria intervention scale-up years(2000–10). Footnote: red indicates drier, green indicates wetter (compared to baseline)(TIF)
AcknowledgmentsThe following colleagues from the Tanzania Malaria Impact Evaluation Research Group con-tributed to this work: Yazoume Ye, Fred Arnold, Trevor Croft (ICF Macro, Calverton, Mary-land); Angelica Rugarabamu, Salim Abdulla (Ifakara Health Institute, United Republic ofTanzania); Joanna Schellenberg (London School of Hygiene and Tropical Medicine, London,United Kingdom); Monica Olewe (MACEPA); Aly Mohammed, Renata Mandike, FabrizioMolteni (National Malaria Control Programme, Ministry of Health and Social Welfare, Dar esSalaam, United Republic of Tanzania); Aldegunda Komba (National Bureau of Statistics, Dares Salaam, United Republic of Tanzania); Rose Lusinde (RTI International, Dar es Salaam,United Republic of Tanzania); Chonge Kitojo, Naomi Kaspar, Jessica Kafuko (U.S. President’sMalaria Initiative—Dar es Salaam, United Republic of Tanzania); Ritha Njau (World HealthOrganization, Dar es Salaam, United Republic of Tanzania).
Author ContributionsConceived and designed the experiments: PS LF AB AW PDM. Performed the experiments: PSLF PDM. Analyzed the data: PS LF HM PDM. Contributed reagents/materials/analysis tools:PS LF CLH HM. Wrote the paper: PS LF SRS CLH HM AB AM PDM.
References1. Greenwood B, Koram K (2014) Malaria control in Africa: progress but still much to do. Lancet 383:
1703–1704. doi: 10.1016/S0140-6736(14)60044-1 PMID: 24559538
2. WHO (2013) World malaria report 2013. Geneva: World Health Organization.
3. Snow RW, Marsh K (2010) Malaria in Africa: progress and prospects in the decade since the AbujaDeclaration. Lancet 376: 137–139. doi: 10.1016/S0140-6736(10)60577-6 PMID: 20417552
4. Roll Back Malaria Partnership (2011) A decade of partnership and results. Geneva: World HealthOrganization.
5. Roll Back Malaria Partnership (2008) Global malaria action plan. Geneva: World HealthOrganization.
6. Korenromp EL (2012) Lives saved frommalaria prevention in Africa—evidence to sustain cost-effective gains. Malar J 11: 94. doi: 10.1186/1475-2875-11-94 PMID: 22455309
7. The Global Fund to Fight AIDS TaM (2010) Improving value for money in Global Fund supported pro-grams. Geneva.
8. Lancet (2010) Evaluation: the top priority for global health. Lancet. 2010/01/19 ed. pp. 526.
9. Hay SI, Guerra CA, Gething PW, Patil AP, Tatem AJ, et al. (2009) A world malaria map: Plasmodiumfalciparum endemicity in 2007. PLoS Med 6: e1000048. doi: 10.1371/journal.pmed.1000048 PMID:19323591
10. Omumbo JA, Hay SI, Snow RW, Tatem AJ, Rogers DJ (2005) Modelling malaria risk in East Africa athigh-spatial resolution. Trop Med Int Health 10: 557–566. PMID: 15941419
11. National Malaria Control Programme (2003) Tanzania malaria medium-term strategic plan2002–2007. Dar es Salaam: Tanzania Ministry of Health and Social Welfare.
Impact of Malaria Control in Tanzania
PLOS ONE | DOI:10.1371/journal.pone.0141112 November 4, 2015 19 / 24

12. National Malaria Control Programme (2008) Tanzania malaria medium-term strategic plan 2008–2013. Dar es Salaam: Tanzania Ministry of Health and Social Welfare.
13. Magesa SM, Lengeler C, deSavigny D, Miller JE, Njau RJ, et al. (2005) Creating an "enabling environ-ment" for taking insecticide treated nets to national scale: the Tanzanian experience. Malar J 4: 34.PMID: 16042780
14. (EANMAT) TEANfMAT (2003) The efficacy of antimalarial monotherapies, sulphadoxine-pyrimethamine and amodiaquine in East Africa: implications for sub-regional policy. Trop Med IntHealth 8: 860–867. PMID: 14516296
15. Mugittu K, Ndejembi M, Malisa A, Lemnge M, Premji Z, et al. (2004) Therapeutic efficacy of sulfadox-ine-pyrimethamine and prevalence of resistance markers in Tanzania prior to revision of malaria treat-ment policy: Plasmodium falciparum dihydrofolate reductase and dihydropteroate synthase mutationsin monitoring in vivo resistance. Am J Trop Med Hyg 71: 696–702. PMID: 15642957
16. Mushi AK, Schellenberg JR, Mponda H, Lengeler C (2003) Targeted subsidy for malaria control withtreated nets using a discount voucher system in Tanzania. Health Policy Plan 18: 163–171. PMID:12740321
17. Hanson K, Nathan R, Marchant T, Mponda H, Jones C, et al. (2008) Vouchers for scaling up insecti-cide-treated nets in Tanzania: methods for monitoring and evaluation of a national health system inter-vention. BMC Public Health 8: 205. doi: 10.1186/1471-2458-8-205 PMID: 18544162
18. Bonner K, Mwita A, McElroy PD, Omari S, Mzava A, et al. (2011) Design, implementation and evalua-tion of a national campaign to distribute nine million free LLINs to children under five years of age inTanzania. Malar J 10: 73. doi: 10.1186/1475-2875-10-73 PMID: 21453519
19. Renggli S, Mandike R, Kramer K, Patrick F, Brown NJ, et al. (2013) Design, implementation and eval-uation of a national campaign to deliver 18 million free long-lasting insecticidal nets to uncoveredsleeping spaces in Tanzania. Malar J 12: 85. doi: 10.1186/1475-2875-12-85 PMID: 23496881
20. Masanja H, de Savigny D, Smithson P, Schellenberg J, John T, et al. (2008) Child survival gains inTanzania: analysis of data from demographic and health surveys. The Lancet 371: 1276–1283.
21. UNICEF (2013) Committing to child survival: a promise renewed. New York: UNICEF.
22. Rowe AK, Steketee RW, Arnold F, Wardlaw T, Basu S, et al. (2007) Viewpoint: evaluating the impactof malaria control efforts on mortality in sub-Saharan Africa. Trop Med Int Health 12: 1524–1539.PMID: 18076561
23. Rowe AK, Steketee RW (2007) Predictions of the impact of malaria control efforts on all-cause childmortality in sub-Saharan Africa. Am J Trop Med Hyg 77: 48–55. PMID: 18165474
24. Habicht JP, Victora CG, Vaughan JP (1999) Evaluation designs for adequacy, plausibility and proba-bility of public health programme performance and impact. Int J Epidemiol 28: 10–18. PMID:10195658
25. Bhutta ZA, Ahmed T, Black RE, Cousens S, Dewey K, et al. (2008) What works? Interventions formaternal and child undernutrition and survival. Lancet 371: 417–440. doi: 10.1016/S0140-6736(07)61693-6 PMID: 18206226
26. Calis JC, Phiri KS, Faragher EB, Brabin BJ, Bates I, et al. (2008) Severe anemia in Malawian children.N Engl J Med 358: 888–899. doi: 10.1056/NEJMoa072727 PMID: 18305266
27. Victora CG, Habicht JP, Bryce J (2004) Evidence-based public health: moving beyond randomized tri-als. Am J Public Health 94: 400–405. PMID: 14998803
28. Hill A (1965) The environment and disease: association or causation? Proceedings of the Royal Soci-ety of Medicine 58: 295–300. PMID: 14283879
29. National Bureau of Statistics and Macro International (2000) Tanzania reproductive and child healthsurvey 1999. Calverton, Maryland: National Bureau of Statistics and Macro International Inc.
30. National Bureau of Statistics and ORCMacro (2005) Tanzania demographic and health survey2004–05. Dar es Salaam, Tanzania: National Bureau of Statistics and ORCMacro
31. Tanzania Commission for AIDS (TACAIDS) ZACZ, National Bureau of Statistics (NBS), Office ofChief Government Statistician (OCGS), and Macro International, (2008) Tanzania HIV/AIDS andmalaria indicator survey 2007–08. Dar es Salaam, Tanzania: TACAID, ZAC, NBS, OCGS, andMacro International Inc.
32. National Bureau of Statistics (NBS) and ICF Macro (2011) Tanzania demographic and health survey2010. Dar es Salaam, Tanzania: NBS and ICF Macro.
33. Roll Back Malaria Partnership (2009) Guidelines for core population-based indicators. Geneva: TheRBM Partnership.
34. MEASUREDHS/ICF International (2006) Guide to DHS statistics. Calverton, Maryland: ORCMacro.
Impact of Malaria Control in Tanzania
PLOS ONE | DOI:10.1371/journal.pone.0141112 November 4, 2015 20 / 24
35. Korenromp EL, Armstrong-Schellenberg JR, Williams BG, Nahlen BL, Snow RW (2004) Impact ofmalaria control on childhood anaemia in Africa—a quantitative review. Trop Med Int Health 9:1050–1065. PMID: 15482397
36. International Monetary Fund (2012) EconStats: World Economic Outlook data.
37. UNAIDS (2012) Global report: UNAIDS report on the global AIDS epidemic 2012. Geneva: UNAIDS.
38. Tanzania Commission fo AIDS (TACAIDS) NBoSN, and ORCMacro, (2005) Tanzania HIV/AIDS indi-cator survey 2003–04. Calverton, Maryland: TACAIDS, NBS, and ORCMacro.
39. Tanzania Commission fo AIDS (TACAIDS) ZACZ, National Bureau of Statistics (NBS), Office of ChiefGovernment Statistician (OCGS), and ICF International, (2013) Tanzania HIV/AIDS and malaria indi-cator survey 2011–12. Dar es Salaam, Tanzania: TACAIDS, ZAC, NBS, OCGS, ICF International.
40. Inc. NBoSaMI (1993) Tanzania demographic and health survey 1991/1992. Calverton, Maryland:National Bureau of Statistics and Macro International Inc.
41. Inc. NBoSaMI (1997) Tanzania demographic and health survey 1996. Calverton, Maryland: NationalBureau of Statistics and Macro International Inc.
42. Reyburn H, Mbatia R, Drakeley C, Bruce J, Carneiro I, et al. (2005) Association of transmission inten-sity and age with clinical manifestations and case fatality of severe Plasmodium falciparummalaria.JAMA 293: 1461–1470. PMID: 15784869
43. O'MearaWP, Mwangi TW, Williams TN, McKenzie FE, Snow RW, et al. (2008) Relationship betweenexposure, clinical malaria, and age in an area of changing transmission intensity. Am J Trop Med Hyg79: 185–191. PMID: 18689622
44. Okiro EA, Al-Taiar A, Reyburn H, Idro R, Berkley JA, et al. (2009) Age patterns of severe paediatricmalaria and their relationship to Plasmodium falciparum transmission intensity. Malar J 8: 4. doi: 10.1186/1475-2875-8-4 PMID: 19128453
45. Abdullah S, Adazu K, Masanja H, Diallo D, Hodgson A, et al. (2007) Patterns of age-specific mortalityin children in endemic areas of sub-Saharan Africa. Am J Trop Med Hyg 77: 99–105. PMID:18165480
46. Grover-Kopec E, KawanoM, Klaver RW, Blumenthal B, Ceccato P, et al. (2005) An online operationalrainfall-monitoring resource for epidemic malaria early warning systems in Africa. Malar J 4: 6. PMID:15663795
47. Lyon B BA (2005) ENSO and the spatial extent of interannual precipitation extremes in tropical landareas. Journal of Climate 18: 5095–5109.
48. International Research Institute (2013) Weighted anomaly of standardized precipitation (WASP) anal-yses from the IRS.
49. Lengeler C (2000) Insecticide-treated bednets and curtains for preventing malaria. Cochrane Data-base Syst Rev: CD000363.
50. Eisele TP, Larsen DA, Anglewicz PA, Keating J, Yukich J, et al. (2012) Malaria prevention in preg-nancy, birthweight, and neonatal mortality: a meta-analysis of 32 national cross-sectional datasets inAfrica. Lancet Infect Dis 12: 942–949. doi: 10.1016/S1473-3099(12)70222-0 PMID: 22995852
51. Eisele TP, Larsen D, Steketee RW (2010) Protective efficacy of interventions for preventing malariamortality in children in Plasmodium falciparum endemic areas. Int J Epidemiol 39 Suppl 1: i88–101.doi: 10.1093/ije/dyq026 PMID: 20348132
52. Thwing J, Eisele TP, Steketee RW (2011) Protective efficacy of malaria case management and inter-mittent preventive treatment for preventing malaria mortality in children: a systematic review for theLives Saved Tool. BMC Public Health 11 Suppl 3: S14. doi: 10.1186/1471-2458-11-S3-S14 PMID:21501431
53. Gakidou E, Cowling K, Lozano R, Murray CJ (2010) Increased educational attainment and its effecton child mortality in 175 countries between 1970 and 2009: a systematic analysis. Lancet 376:959–974. doi: 10.1016/S0140-6736(10)61257-3 PMID: 20851260
54. McCurdy RJ, Kjerulff KH, Zhu J (2011) Prenatal care associated with reduction of neonatal mortality inSub-Saharan Africa: evidence from Demographic and Health Surveys. Acta Obstet Gynecol Scand90: 779–790. doi: 10.1111/j.1600-0412.2011.01133.x PMID: 21426311
55. Ruton H, Mugwaneza P, Shema N, Lyambabaje A, de Dieu Bizimana J, et al. (2012) HIV-free survivalamong nine- to 24-month-old children born to HIV-positive mothers in the Rwandan national PMTCTprogramme: a community-based household survey. J Int AIDS Soc 15: 4. doi: 10.1186/1758-2652-15-4 PMID: 22289641
56. Bahl R, Frost C, Kirkwood BR, Edmond K, Martines J, et al. (2005) Infant feeding patterns and risks ofdeath and hospitalization in the first half of infancy: multicentre cohort study. Bull World Health Organ83: 418–426. PMID: 15976892
Impact of Malaria Control in Tanzania
PLOS ONE | DOI:10.1371/journal.pone.0141112 November 4, 2015 21 / 24

57. McDonald CM, Olofin I, Flaxman S, Fawzi WW, Spiegelman D, et al. (2013) The effect of multipleanthropometric deficits on child mortality: meta-analysis of individual data in 10 prospective studiesfrom developing countries. Am J Clin Nutr 97: 896–901. doi: 10.3945/ajcn.112.047639 PMID:23426036
58. Imdad A, Yakoob MY, Sudfeld C, Haider BA, Black RE, et al. (2011) Impact of vitamin A supplementa-tion on infant and childhood mortality. BMC Public Health 11 Suppl 3: S20. doi: 10.1186/1471-2458-11-S3-S20 PMID: 21501438
59. Mayo-Wilson E, Imdad A, Herzer K, YakoobMY, Bhutta ZA (2011) Vitamin A supplements for pre-venting mortality, illness, and blindness in children aged under 5: systematic review and meta-analy-sis. BMJ 343: d5094. doi: 10.1136/bmj.d5094 PMID: 21868478
60. Kelsey JL TW, Evans AS (1986) Methods in Observational Epidemiology. New York, NY: Oxfor Uni-versity Press, Inc.
61. Northridge ME (1995) Public health methods—attributable risk as a link between causality and publichealth action. Am J Public Health 85: 1202–1204. PMID: 7661224
62. Hill GB (1996) The value of the population attributable risk percentage. Am J Public Health 86: 1483.PMID: 8876530
63. Lim SS, Fullman N, Stokes A, Ravishankar N, Masiye F, et al. (2011) Net benefits: a multicountry anal-ysis of observational data examining associations between insecticide-treated mosquito nets andhealth outcomes. PLoSMed 8: e1001091. doi: 10.1371/journal.pmed.1001091 PMID: 21909249
64. Obonyo CO, Vulule J, AkhwaleWS, Grobbee DE (2007) In-hospital morbidity and mortality due tosevere malarial anemia in western Kenya. Am J Trop Med Hyg 77: 23–28. PMID: 18165471
65. Bloland PB, Lackritz EM, Kazembe PN, Were JB, Steketee R, et al. (1993) Beyond chloroquine: impli-cations of drug resistance for evaluating malaria therapy efficacy and treatment policy in Africa. JInfect Dis 167: 932–937. PMID: 8450258
66. Trape JF, Pison G, Preziosi MP, Enel C, Desgrees du Lou A, et al. (1998) Impact of chloroquine resis-tance on malaria mortality. C R Acad Sci III 321: 689–697. PMID: 9769862
67. Mugittu K, Abdulla S, Falk N, Masanja H, Felger I, et al. (2005) Efficacy of sulfadoxine-pyrimethaminein Tanzania after two years as first-line drug for uncomplicated malaria: assessment protocol andimplication for treatment policy strategies. Malar J 4: 55. PMID: 16297234
68. Joseph D, Kabanywanyi AM, Hulser R, Premji Z, Minzi OM, et al. (2013) Exploration of in vivo efficacyof artemether-lumefantrine against uncomplicated Plasmodium falciparummalaria in under fives inTabora region, Tanzania. Malar J 12: 60. doi: 10.1186/1475-2875-12-60 PMID: 23399782
69. United Nations Inter-agency Group for Child Mortality Estimation (2011) Levels and Trends in childmortality 2013. New York, NY: United Nationa Children's Fund.
70. Chizema-Kawesha E, Miller J, Steketee R, Mukonka V, Mukuka C, et al. (2010) Scaling up malariacontrol in Zambia: progress and impact 2005–2008. Am J Trop Med Hyg 83: 480–488. doi: 10.4269/ajtmh.2010.10-0035 PMID: 20810807
71. Karema C, Aregawi MW, Rukundo A, Kabayiza A, Mulindahabi M, et al. (2012) Trends in malariacases, hospital admissions and deaths following scale-up of anti-malarial interventions, 2000–2010,Rwanda. Malar J 11: 236. doi: 10.1186/1475-2875-11-236 PMID: 22823945
72. Kleinschmidt I, Schwabe C, Benavente L, Torrez M, Ridl FC, et al. (2009) Marked increase in childsurvival after four years of intensive malaria control. Am J Trop Med Hyg 80: 882–888. PMID:19478243
73. Bhattarai A, Ali AS, Kachur SP, Martensson A, Abbas AK, et al. (2007) Impact of artemisinin-basedcombination therapy and insecticide-treated nets on malaria burden in Zanzibar. PLoS Med 4: e309.PMID: 17988171
74. Alba S, Nathan R, Schulze A, Mshinda H, Lengeler C (2014) Child mortality patterns in rural Tanzania:an observational study on the impact of malaria control interventions. Int J Epidemiol 43: 204–215.doi: 10.1093/ije/dyt231 PMID: 24355745
75. United Nations Inter-agency Group for Child Mortality Estimation (2013) Levels and Trends in childmortality 2013. New York, NY: United Nations Chidlren's Fund.
76. Rajaratnam JK, Marcus JR, Flaxman AD, Wang H, Levin-Rector A, et al. (2010) Neonatal, postneona-tal, childhood, and under-5 mortality for 187 countries, 1970–2010: a systematic analysis of progresstowards Millennium Development Goal 4. Lancet 375: 1988–2008. doi: 10.1016/S0140-6736(10)60703-9 PMID: 20546887
77. Liu L, Johnson HL, Cousens S, Perin J, Scott S, et al. (2012) Global, regional, and national causes ofchild mortality: an updated systematic analysis for 2010 with time trends since 2000. Lancet 379:2151–2161. doi: 10.1016/S0140-6736(12)60560-1 PMID: 22579125
Impact of Malaria Control in Tanzania
PLOS ONE | DOI:10.1371/journal.pone.0141112 November 4, 2015 22 / 24

78. Black RE, Morris SS, Bryce J (2003) Where and why are 10 million children dying every year? Lancet361: 2226–2234. PMID: 12842379
79. Lawn JE, Kinney MV, Black RE, Pitt C, Cousens S, et al. (2012) Newborn survival: a multi-countryanalysis of a decade of change. Health Policy Plan 27 Suppl 3: iii6–28. doi: 10.1093/heapol/czs053PMID: 22692417
80. Basu AM, Stephenson R (2005) Low levels of maternal education and the proximate determinants ofchildhood mortality: a little learning is not a dangerous thing. Soc Sci Med 60: 2011–2023. PMID:15743650
81. Cleland JG, Van Ginneken JK (1988) Maternal education and child survival in developing countries:the search for pathways of influence. Soc Sci Med 27: 1357–1368. PMID: 3070762
82. Filmer D, Pritchett L (1999) The impact of public spending on health: does money matter? Soc SciMed 49: 1309–1323. PMID: 10509822
83. World Bank (2013) GDP per capita (current U.S. dollars).
84. International Monetary Fund (2011) Regional econonic outlook: sub-Saharan Africa, recovery andnew risks. Washington, DC: International Monetary Fund.
85. WHO (2009) Global prevalence of viatimin A deficiency in populations at risk 1995–2005. WHO globaldatabase on vitamin A deficiency. Geneva.
86. Macro NBoSNaI (2011) Micronutrients: Results of the 2010 Tanzania Demographic and Health Sur-vey. Dar es Salaam, Tanzania.
87. Blencowe H, Lawn J, Vandelaer J, Roper M, Cousens S (2010) Tetanus toxoid immunization toreduce mortality from neonatal tetanus. Int J Epidemiol 39 Suppl 1: i102–109. doi: 10.1093/ije/dyq027PMID: 20348112
88. WHORegional Office for Africa (2006) The health of the people: the African regional health report.Geneva: World Health Organization.
89. Yazbeck AS (2007) Challenges in measuring maternal mortality. Lancet 370: 1291–1292. PMID:17933633
90. WHOU, UNFPA, World Bank, (2012) Trends in maternal mortality 1990 to 2010. Geneva: WorldHealth Organization.
91. Stresman GH (2010) Beyond temperature and precipitation: ecological risk factors that modify malariatransmission. Acta Trop 116: 167–172. doi: 10.1016/j.actatropica.2010.08.005 PMID: 20727338
92. Paaijmans KP, Read AF, Thomas MB (2009) Understanding the link between malaria risk and cli-mate. Proc Natl Acad Sci U S A 106: 13844–13849. doi: 10.1073/pnas.0903423106 PMID:19666598
93. Drakeley CJ, Carneiro I, Reyburn H, Malima R, Lusingu JP, et al. (2005) Altitude-dependent and-independent variations in Plasmodium falciparum prevalence in northeastern Tanzania. J Infect Dis191: 1589–1598. PMID: 15838785
94. Gething PW, Smith DL, Patil AP, Tatem AJ, Snow RW, et al. (2010) Climate change and the globalmalaria recession. Nature 465: 342–345. doi: 10.1038/nature09098 PMID: 20485434
95. Black RE, Allen LH, Bhutta ZA, Caulfield LE, de Onis M, et al. (2008) Maternal and child undernutri-tion: global and regional exposures and health consequences. Lancet 371: 243–260. doi: 10.1016/S0140-6736(07)61690-0 PMID: 18207566
96. Pelletier DL, Frongillo EA Jr, Schroeder DG, Habicht JP (1995) The effects of malnutrition on childmortality in developing countries. Bull World Health Organ 73: 443–448. PMID: 7554015
97. UNAIDS (1999) AIDS epidemic update. Geneva: UNAIDS.
98. Newell ML, Coovadia H, Cortina-Borja M, Rollins N, Gaillard P, et al. (2004) Mortality of infected anduninfected infants born to HIV-infected mothers in Africa: a pooled analysis. Lancet 364: 1236–1243.PMID: 15464184
99. Govender T, Coovadia H (2014) Eliminating mother to child transmission of HIV-1 and keeping moth-ers alive: recent progress. J Infect 68 Suppl 1: S57–62. doi: 10.1016/j.jinf.2013.09.015 PMID:24139190
100. Ishengoma DS, Mmbando BP, Segeja MD, Alifrangis M, Lemnge MM, et al. (2013) Declining burdenof malaria over two decades in a rural community of Muheza district, north-eastern Tanzania. Malar J12: 338. doi: 10.1186/1475-2875-12-338 PMID: 24053121
101. Farnert A, Yman V, Homann MV, Wandell G, Mhoja L, et al. (2014) Epidemiology of malaria in a vil-lage in the Rufiji River Delta, Tanzania: declining transmission over 25 years revealed by differentparasitological metrics. Malar J 13: 459. doi: 10.1186/1475-2875-13-459 PMID: 25423887
102. Boerma JT, Sommerfelt AE (1993) Demographic and health surveys (DHS): contributions and limita-tions. World Health Stat Q 46: 222–226. PMID: 8017081
Impact of Malaria Control in Tanzania
PLOS ONE | DOI:10.1371/journal.pone.0141112 November 4, 2015 23 / 24

103. Cuadros DF, Branscum AJ, Crowley PH (2011) HIV-malaria co-infection: effects of malaria on theprevalence of HIV in East sub-Saharan Africa. Int J Epidemiol 40: 931–939. doi: 10.1093/ije/dyq256PMID: 21224274
104. Atieli HE, Zhou G, Afrane Y, Lee MC, Mwanzo I, et al. (2011) Insecticide-treated net (ITN) ownership,usage, and malaria transmission in the highlands of western Kenya. Parasit Vectors 4: 113. doi: 10.1186/1756-3305-4-113 PMID: 21682919
105. Singh M, Brown G, Rogerson SJ (2013) Ownership and use of insecticide-treated nets during preg-nancy in sub-Saharan Africa: a review. Malar J 12: 268. doi: 10.1186/1475-2875-12-268 PMID:23914731
106. Pulford J, Hetzel MW, Bryant M, Siba PM, Mueller I (2011) Reported reasons for not using a mosquitonet when one is available: a review of the published literature. Malar J 10: 83. doi: 10.1186/1475-2875-10-83 PMID: 21477376
107. Namusoke F, Ntale M, Wahlgren M, Kironde F, Mirembe F (2012) Validity of self-reported use of sul-phadoxine-pyrimethamine intermittent presumptive treatment during pregnancy (IPTp): a cross-sectional study. Malar J 11: 310. PMID: 22950456
108. Abdalla SH PG (2011) Approach to the patient in the tropics with anemia. In: Guerrant RLWD, WellerPF, editor. Tropical Infectious Diseases: Principles, Pathogens & Practice. 3rd ed: Elsevier. pp.1024–1032.
109. UNAIDS (2011) Global report: UNAIDS report on the global AIDS epidemic 2011. Geneva: JointUnited Nations Programme on HIV/AIDS.
110. UNAIDS (2013) Global report: UNAIDS report on the global AIDS epidemic 2013. Geneva: JointUnited Nations Programme on HIV/AIDS.
Impact of Malaria Control in Tanzania
PLOS ONE | DOI:10.1371/journal.pone.0141112 November 4, 2015 24 / 24