RESEARCHARTICLE EvolutionarySignaturesamongstDisease...
17
RESEARCH ARTICLE Evolutionary Signatures amongst Disease Genes Permit Novel Methods for Gene Prioritization and Construction of Informative Gene-Based Networks Nolan Priedigkeit 1,2 , Nicholas Wolfe 3 , Nathan L. Clark 3 * 1 Medical Scientist Training Program, University of Pittsburgh School of Medicine, Pittsburgh, Pennsylvania, United States of America, 2 Department of Pharmacology and Chemical Biology, University of Pittsburgh, Pittsburgh, Pennsylvania, United States of America, 3 Department of Computational and Systems Biology, University of Pittsburgh, Pittsburgh, Pennsylvania, United States of America * [email protected] Abstract Genes involved in the same function tend to have similar evolutionary histories, in that their rates of evolution covary over time. This coevolutionary signature, termed Evolutionary Rate Covariation (ERC), is calculated using only gene sequences from a set of closely relat- ed species and has demonstrated potential as a computational tool for inferring functional relationships between genes. To further define applications of ERC, we first established that roughly 55% of genetic diseases posses an ERC signature between their contributing genes. At a false discovery rate of 5% we report 40 such diseases including cancers, devel- opmental disorders and mitochondrial diseases. Given these coevolutionary signatures between disease genes, we then assessed ERC's ability to prioritize known disease genes out of a list of unrelated candidates. We found that in the presence of an ERC signature, the true disease gene is effectively prioritized to the top 6% of candidates on average. We then apply this strategy to a melanoma-associated region on chromosome 1 and identify MCL1 as a potential causative gene. Furthermore, to gain global insight into disease mechanisms, we used ERC to predict molecular connections between 310 nominally distinct diseases. The resulting “disease map” network associates several diseases with related pathogenic mechanisms and unveils many novel relationships between clinically distinct diseases, such as between Hirschsprung's disease and melanoma. Taken together, these results demonstrate the utility of molecular evolution as a gene discovery platform and show that evolutionary signatures can be used to build informative gene-based networks. Author Summary Molecular evolution has informed our understanding of gene function; however, classical methods have largely been static in their implementation, focusing on single genes. Here, PLOS Genetics | DOI:10.1371/journal.pgen.1004967 February 13, 2015 1 / 17 OPEN ACCESS Citation: Priedigkeit N, Wolfe N, Clark NL (2015) Evolutionary Signatures amongst Disease Genes Permit Novel Methods for Gene Prioritization and Construction of Informative Gene-Based Networks. PLoS Genet 11(2): e1004967. doi:10.1371/journal. pgen.1004967 Editor: Joshua M. Akey, University of Washington, UNITED STATES Received: July 22, 2014 Accepted: December 19, 2014 Published: February 13, 2015 Copyright: © 2015 Priedigkeit et al. This is an open access article distributed under the terms of the Creative Commons Attribution License, which permits unrestricted use, distribution, and reproduction in any medium, provided the original author and source are credited. Data Availability Statement: All data and analyses are available on our website: http://csb.pitt.edu/erc_ analysis/. Funding: Support for NLC was provided by a New Investigator Grant from the Charles E. Kaufman Foundation of The Pittsburgh Foundation (http:// kaufman.pittsburghfoundation.org/), a Commonwealth Universal Research Enhancement Program grant from the Commonwealth of Pennsylvania Department of Health (SAP 4100062224) (http://www.portal.state.pa.us/portal/ server.pt/community/health_research_program_cure/
-
Upload
vuongtuyen -
Category
Documents
-
view
217 -
download
0
Transcript of RESEARCHARTICLE EvolutionarySignaturesamongstDisease...

RESEARCH ARTICLE
Evolutionary Signatures amongst DiseaseGenes Permit Novel Methods for GenePrioritization and Construction ofInformative Gene-Based NetworksNolan Priedigkeit1,2, NicholasWolfe3, Nathan L. Clark3*
1 Medical Scientist Training Program, University of Pittsburgh School of Medicine, Pittsburgh, Pennsylvania,United States of America, 2 Department of Pharmacology and Chemical Biology, University of Pittsburgh,Pittsburgh, Pennsylvania, United States of America, 3 Department of Computational and Systems Biology,University of Pittsburgh, Pittsburgh, Pennsylvania, United States of America
AbstractGenes involved in the same function tend to have similar evolutionary histories, in that their
rates of evolution covary over time. This coevolutionary signature, termed Evolutionary
Rate Covariation (ERC), is calculated using only gene sequences from a set of closely relat-
ed species and has demonstrated potential as a computational tool for inferring functional
relationships between genes. To further define applications of ERC, we first established
that roughly 55% of genetic diseases posses an ERC signature between their contributing
genes. At a false discovery rate of 5% we report 40 such diseases including cancers, devel-
opmental disorders and mitochondrial diseases. Given these coevolutionary signatures
between disease genes, we then assessed ERC's ability to prioritize known disease genes
out of a list of unrelated candidates. We found that in the presence of an ERC signature, the
true disease gene is effectively prioritized to the top 6% of candidates on average. We then
apply this strategy to a melanoma-associated region on chromosome 1 and identifyMCL1as a potential causative gene. Furthermore, to gain global insight into disease mechanisms,
we used ERC to predict molecular connections between 310 nominally distinct diseases.
The resulting “disease map” network associates several diseases with related pathogenic
mechanisms and unveils many novel relationships between clinically distinct diseases,
such as between Hirschsprung's disease and melanoma. Taken together, these results
demonstrate the utility of molecular evolution as a gene discovery platform and show that
evolutionary signatures can be used to build informative gene-based networks.
Author Summary
Molecular evolution has informed our understanding of gene function; however, classicalmethods have largely been static in their implementation, focusing on single genes. Here,
PLOSGenetics | DOI:10.1371/journal.pgen.1004967 February 13, 2015 1 / 17
OPEN ACCESS
Citation: Priedigkeit N, Wolfe N, Clark NL (2015)Evolutionary Signatures amongst Disease GenesPermit Novel Methods for Gene Prioritization andConstruction of Informative Gene-Based Networks.PLoS Genet 11(2): e1004967. doi:10.1371/journal.pgen.1004967
Editor: Joshua M. Akey, University of Washington,UNITED STATES
Received: July 22, 2014
Accepted: December 19, 2014
Published: February 13, 2015
Copyright: © 2015 Priedigkeit et al. This is an openaccess article distributed under the terms of theCreative Commons Attribution License, which permitsunrestricted use, distribution, and reproduction in anymedium, provided the original author and source arecredited.
Data Availability Statement: All data and analysesare available on our website: http://csb.pitt.edu/erc_analysis/.
Funding: Support for NLC was provided by a NewInvestigator Grant from the Charles E. KaufmanFoundation of The Pittsburgh Foundation (http://kaufman.pittsburghfoundation.org/), aCommonwealth Universal Research EnhancementProgram grant from the Commonwealth ofPennsylvania Department of Health (SAP4100062224) (http://www.portal.state.pa.us/portal/server.pt/community/health_research_program_cure/

we present and prove the utility of a dynamic, network-based understanding of molecularevolution to infer relationships between genes associated with human diseases. We haveshown previously that groups of genes within functional niches tend to share similar evo-lutionary histories. Exploiting the availability of whole genomes from multiple species,these histories can be numerically scored and dynamically compared to one another usinga sequence-based signature termed Evolutionary Rate Covariation (ERC). To explore po-tential applications, we characterized ERC amongst disease genes and found that manydiseases contain significant ERC signatures between their contributing genes. We showthat ERC can also prioritize “true” disease genes amongst unrelated gene candidates. Last-ly, these signatures can serve as a foundation for creating instructive gene-based networks,unveiling novel relationships between diseases thought to be clinically distinct. Our hopeis that this study will add to the increasing evidence that advancing our understanding ofmolecular evolution can be a crucial asset in large-scale gene discovery pursuits (Link toour webserver that provides intuitive ERC analysis tools: http://csb.pitt.edu/erc_analysis/).
IntroductionAdvances in sequencing technologies and collaborative, large-scale—omics and genome-wideassociation projects are providing investigators with overwhelming lists of candidate diseasegene associations. In the past decade, nearly 2,000 genomic regions have been associated withover 300 complex traits, and open efforts such as The Cancer Genome Atlas have producedpetabytes of genetic data to sift through [1,2]. To more effectively decipher and prove candidategenes' roles in disease processes, computational tools have been created to both prioritize andplace candidate genes into some functional context for more effective experimental validation.As these candidate genes are validated and more genes become linked with functional process-es, there is also an increased ability to generate multivariable genetic networks based on theseobservations [3,4]. Here, we show a first-of-its-kind approach to prioritize candidate diseasegenes and build instructive gene-based networks based on a signature of molecular co-evolution.
Proteins do not exert their function in isolation, but rather exist within intricate networks ofmolecular relationships that can be revealed through high-throughput analyses of protein-pro-tein interactions, tissue-specific expressivity and shared regulatory elements to name a few.The influx of data from these experiments has been utilized to build informative tools thataggregate and interpret these observations to place input proteins into predicted functionallyrelated pathways [5–8]. Among many other uses, these tools have served as a catalyst for genediscovery, successfully giving functional relevance to disease gene candidates from sequencingstudies and helping to validate and enhance mechanistic conclusions from high-output biologi-cal screens [9,10]. The primary methods used to create these networks rely on sophisticatedalgorithms that weigh certain biological features based on the query genes and sometimes user-dictated parameters. These parameters include Gene Ontology (GO) terms, genomic andproteomic study results (yeast two-hybrid, ChIP-seq, physical interactome datasets, proteinstructure comparisons, subcellular localization, tissue specific expressivity, etc.) and even litera-ture mining techniques such as co-occurrence in PubMed abstracts [11].
In addition to giving functional insight to query genes, similar methods have been utilizedto prioritize a list of candidate genes for further downstream study. These tools typically imple-ment “guilt by association” strategies in which a user will have a pair of gene lists–one set ofgenes known in the literature to be involved in a particular pathway/disease of interest (referred
Evolution-Derived Gene Networks
PLOS Genetics | DOI:10.1371/journal.pgen.1004967 February 13, 2015 2 / 17
), and partial support from the National HumanGenome Research Institute of the NIH under AwardNumber U54HG008540. Computational resourceswere made possible by a Major ResearchInstrumentation grant from the United States NationalScience Foundation (CNS-1229064) (http://www.nsf.gov/). Support for NP was provided by a grant fromthe NIH National Institute of General MedicalSciences (T32 GM008208) and the University ofPittsburgh and Carnegie Mellon University MedicalScientist Training Program. The funders had no rolein study design, data collection and analysis, decisionto publish, or preparation of the manuscript.
Competing Interests: The authors have declaredthat no competing interests exist.

to as a “training set”) and another list of candidate genes that the researcher has identified aspossibly being related to the process in question. Generally, these two lists are entered into anonline resource and then the candidate genes are ranked based on their relationships to thetraining set genes using similar databases and algorithms discussed previously [12]. Gene pri-oritization techniques have been effectively used in accelerating transitions from large datasetsto solid biological insight [13–17].
As more data is acquired and as these tools continue to become more sophisticated andmore widely used, the number of disease gene associations are increasing rapidly, mirrored bythe exponential growth of entries in the Online Mendelian Inheritance in Man (OMIM) Data-base in the past decade [18]. This permits innovative strategies to not only focus on relation-ships at the molecular level, but to also implement a more expansive approach and aggregatethese relationships to generate novel links between diseases and disease classes. Groups of dis-eases that are similar, or perhaps diseases thought to be distinct entities, may share pathogenicmechanisms between them that can be uncovered by multiscale, computational approaches[19–22]. These disease-disease relationships may lend themselves to clinically impactful drugrepositioning possibilities [23,24].
Another field that has benefited greatly from this revolution in data acquisition is molecularevolution. A large number of sequenced genomes from closely related species now allows com-parative and evolutionary methods to be applied across the genome. One such method, evolu-tionary rate covariation (ERC), infers interactions between genes using only their branch-specific rates of sequence evolution in a collection of species [25,26]. Namely, genes with ratesthat statistically covary tend to participate in common functions or pathways. This statisticalcovariation results mainly from discrete pathways responding to evolutionary pressures as asingle unit, thereby causing the evolutionary rates amongst genes in the pathway to fluctuate intandem. This evolutionary signature of co-functionality, ERC, is measured as the correlationcoefficient of gene-specific branch rates between a pair of genes, for which higher values ap-proaching 1 indicate higher rate covariation. ERC has been demonstrated between functionallyrelated genes in mammals, Drosophila, fungi, and prokaryotes [1,2,26–29]. In addition, statisti-cally significant ERC signatures are found for functionally related genes within diverse func-tional pathways including meiosis and piRNA metabolism [28], fertilization [30], nucleartransport [29], and more than 60% of annotated protein complexes [26]. Given the ubiquityof ERC signatures, they have even been used to discover novel genes in established geneticpathways, such as in reproductive interactions between female and male Drosophila [31].
Here, we introduce ERC signatures to study the genetic basis of human disease, showingthat molecular evolution can serve as an innovative and complementary method for gene pri-oritization, functional annotation, and disease network generation. We show that, in severalcases, genes associated with a particular disease show significantly elevated ERC values betweenthem. Furthermore, ERC identifies target disease genes amongst many unrelated candidategenes based solely on shared ERC values between the candidates and a training set of knowndisease genes. Lastly, we demonstrate via a gene-based network approach that ERC values areelevated between diseases that share related pathogenic mechanisms and that co-evolutionarysignatures can unearth novel relationships between diseases thought to be distinct.
Results
ERC signatures are broadly elevated between genes contributing tohuman diseasesTo determine the strength of ERC signatures between disease genes we interrogated a set of310 Disease Gene Groupings (DGG), each containing at least 3 genes known to be associated
Evolution-Derived Gene Networks
PLOS Genetics | DOI:10.1371/journal.pgen.1004967 February 13, 2015 3 / 17

with an OMIM-annotated disease. We then examined the ERC values between each pair ofconstituent genes in each DGG, while testing for statistically significant elevations in ERC as agroup. We first provide an example for a single DGG, complement deficiency (Fig. 1), andthen continue with analysis of all DGGs. We measured evolutionary rates for complement defi-ciency genes C1S and CFI along all branches in a phylogeny of mammalian species. Their ratesvaried greatly between branches, but their patterns of variation were remarkably similar(Fig. 1A). We quantify this similarity with the Evolutionary Rate Covariation (ERC) metric,which is calculated as the correlation coefficient of their rates. Hence, the ERC value betweenC1S and CFI is 0.81 (Fig. 1B). All gene pairs within complement deficiency were compared inthis way (Fig. 1C). Notably, the overwhelming majority of complement deficiency ERC valuesare positive (88%), whereas random gene sets of the same size yield positive correlation coeffi-cients at a much lower rate (mean = 59%, maximum of 1000 nulls = 73%). Second, gene pairswith very high ERC values were found for those whose protein products form functional
Figure 1. ERC values between complement deficiency genes. A) Complement genesC1S andCFI show variation in their evolutionary rates betweenbranches of the mammalian phylogeny. Branches are color-coded according to rate. (Red is for rapid evolution, blue for slow, and intermediate shades forrates in between.) Tree topology and distances between species are the same for each gene. B) The same evolutionary rates for C1S andCFI are plottedagainst each other. Their correlation is apparent here in the best-fit line and correlation coefficient of 0.806. C) This matrix contains all pairwise ERC valuesbetween the OMIM genes for complement deficiency. Cells are shaded red according to the intensity of their departure from the null expectation. Blue arrowsindicate the genesC1S andCFI. It is notable that most values are positive, whereas a random collection of genes would contain equal proportions of positiveand negative values. There are also many clusters of functionally related complement proteins that contain very strong signals of ERC. The C1-relatedproteins in the upper left corner are a prime example of such an ERC hotspot.
doi:10.1371/journal.pgen.1004967.g001
Evolution-Derived Gene Networks
PLOS Genetics | DOI:10.1371/journal.pgen.1004967 February 13, 2015 4 / 17
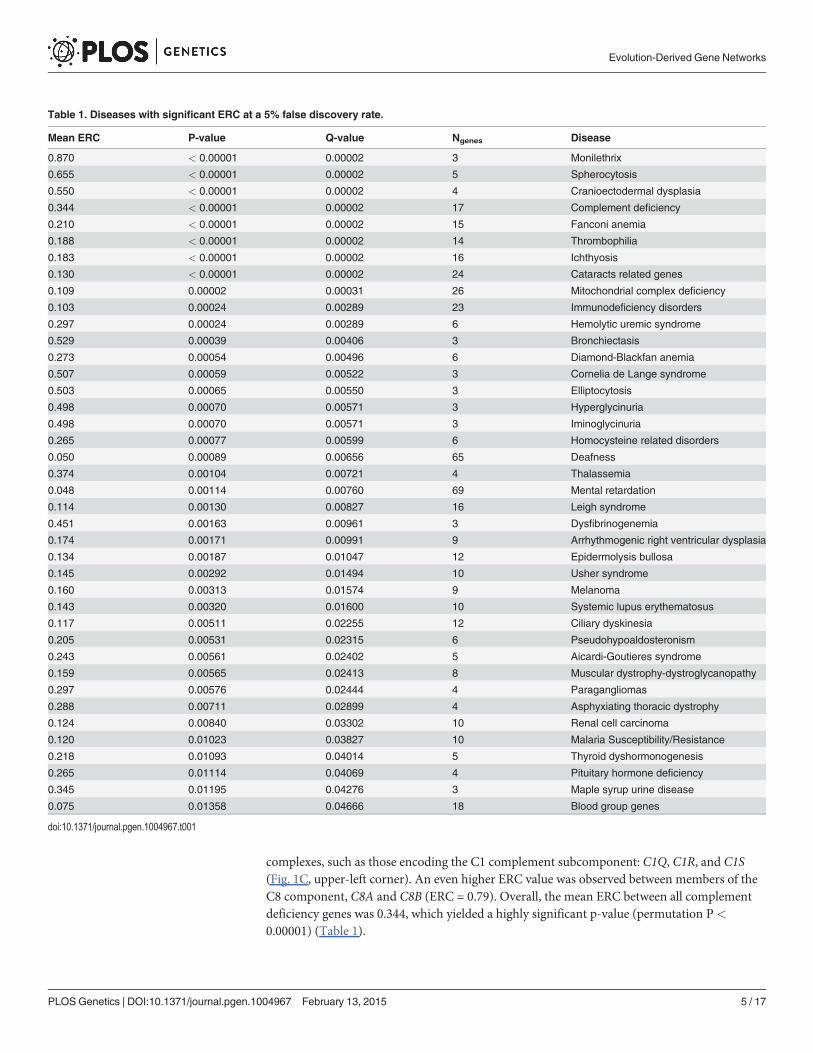
complexes, such as those encoding the C1 complement subcomponent: C1Q, C1R, and C1S(Fig. 1C, upper-left corner). An even higher ERC value was observed between members of theC8 component, C8A and C8B (ERC = 0.79). Overall, the mean ERC between all complementdeficiency genes was 0.344, which yielded a highly significant p-value (permutation P<
0.00001) (Table 1).
Table 1. Diseases with significant ERC at a 5% false discovery rate.
Mean ERC P-value Q-value Ngenes Disease
0.870 < 0.00001 0.00002 3 Monilethrix
0.655 < 0.00001 0.00002 5 Spherocytosis
0.550 < 0.00001 0.00002 4 Cranioectodermal dysplasia
0.344 < 0.00001 0.00002 17 Complement deficiency
0.210 < 0.00001 0.00002 15 Fanconi anemia
0.188 < 0.00001 0.00002 14 Thrombophilia
0.183 < 0.00001 0.00002 16 Ichthyosis
0.130 < 0.00001 0.00002 24 Cataracts related genes
0.109 0.00002 0.00031 26 Mitochondrial complex deficiency
0.103 0.00024 0.00289 23 Immunodeficiency disorders
0.297 0.00024 0.00289 6 Hemolytic uremic syndrome
0.529 0.00039 0.00406 3 Bronchiectasis
0.273 0.00054 0.00496 6 Diamond-Blackfan anemia
0.507 0.00059 0.00522 3 Cornelia de Lange syndrome
0.503 0.00065 0.00550 3 Elliptocytosis
0.498 0.00070 0.00571 3 Hyperglycinuria
0.498 0.00070 0.00571 3 Iminoglycinuria
0.265 0.00077 0.00599 6 Homocysteine related disorders
0.050 0.00089 0.00656 65 Deafness
0.374 0.00104 0.00721 4 Thalassemia
0.048 0.00114 0.00760 69 Mental retardation
0.114 0.00130 0.00827 16 Leigh syndrome
0.451 0.00163 0.00961 3 Dysfibrinogenemia
0.174 0.00171 0.00991 9 Arrhythmogenic right ventricular dysplasia
0.134 0.00187 0.01047 12 Epidermolysis bullosa
0.145 0.00292 0.01494 10 Usher syndrome
0.160 0.00313 0.01574 9 Melanoma
0.143 0.00320 0.01600 10 Systemic lupus erythematosus
0.117 0.00511 0.02255 12 Ciliary dyskinesia
0.205 0.00531 0.02315 6 Pseudohypoaldosteronism
0.243 0.00561 0.02402 5 Aicardi-Goutieres syndrome
0.159 0.00565 0.02413 8 Muscular dystrophy-dystroglycanopathy
0.297 0.00576 0.02444 4 Paragangliomas
0.288 0.00711 0.02899 4 Asphyxiating thoracic dystrophy
0.124 0.00840 0.03302 10 Renal cell carcinoma
0.120 0.01023 0.03827 10 Malaria Susceptibility/Resistance
0.218 0.01093 0.04014 5 Thyroid dyshormonogenesis
0.265 0.01114 0.04069 4 Pituitary hormone deficiency
0.345 0.01195 0.04276 3 Maple syrup urine disease
0.075 0.01358 0.04666 18 Blood group genes
doi:10.1371/journal.pgen.1004967.t001
Evolution-Derived Gene Networks
PLOS Genetics | DOI:10.1371/journal.pgen.1004967 February 13, 2015 5 / 17

When similarly considering all 310 disease states through this analysis, 255 (82%) had posi-tive mean ERC values, indicating a shift toward rate covariation between genes in a commondisease. In contrast, random gene sets size-matched to the DGGs had positive mean values inonly 59% of cases on average. The maximum observed proportion of mean positive ERCs in1000 random sets was 69%, which is far lower than that observed for the true DGGs (82%).Moreover, there was a strong enrichment of low p-values with 73 DGGs below a nominal p-value of 0.05—a 4.7-fold excess (Fig. 2). After correction for multiple testing, 40 DGGs werefound to have elevated ERC values at a false discovery rate of 5% (Table 1) [32]. From the falsediscovery rate analysis we also estimated that 55% of the 310 DGGs contain elevated ERC val-ues (proportion without ERC elevation, η0 = 45%). Those diseases with the strongest ERC sig-natures included cancers, autoimmune conditions, blood cell diseases, and developmentaldisorders among others (Table 1). Overall, the observed significant cases indicate that patho-logically related genes tend to have more positive ERC values, likely due to their analogousfunctions in the cell.
ERC effectively prioritizes candidate genes for diseases with co-evolutionary signaturesWe sought to assess the power of ERC co-evolutionary signatures as a gene prioritization meth-od. Using the 310 DGGs, we asked whether a known disease gene (a “target gene” within anOMIM DGG) was effectively prioritized among a set of chromosomal neighbors using an ERC“guilt by association” approach. More specifically, candidate genes were prioritized by theirERC values with a training set of genes known to influence that disease (the remaining OMIMDGGmembers). Candidates with higher ERC values were more highly prioritized. To demon-strate one case, the gene DSC2, which contributes to arrhythmogenic right ventricular dyspla-sia, was tested as a “target” and its chromosomal neighbors within a 1 Mb window were treatedas additional candidates. The remaining 7 genes in that disease were designated as the trainingset. ERC values between the training set and the target DSC2 were 0.16 on average, whichplaced it in position 1 out of 31 total candidates (the 96th percentile). This case was a successfulprioritization. To produce a full statistical characterization of this strategy, the same procedure
Figure 2. Disease gene groupings P-value distribution. P-values represent the significance of elevatedmean ERC within a particular disease. There is a notable excess of low p-values, indicating a large number ofdiseases with an ERC signature between their genes. False discovery rate analyses show that approximately55% of disease states interrogated have significantly elevated ERC values.
doi:10.1371/journal.pgen.1004967.g002
Evolution-Derived Gene Networks
PLOS Genetics | DOI:10.1371/journal.pgen.1004967 February 13, 2015 6 / 17

was repeated for all 2,416 OMIM disease genes in all 310 DGGs in our dataset, with a singletraining set gene being dropped from the training set and defined as the target gene iteratively.Of the 2,416 ERC prioritization tests, the 1 MB window surrounding the target gene containeda mean of 81 genes, a median of 62 genes (lower quartile = 40, upper quartile = 102) and had arange of 4 to 274 genes.
On average, ERC gene prioritization placed the target gene in the 64th percentile of all candi-date genes. However, the success of prioritization depended strongly on the strength of ERCwithin the training set (Fig. 3). When training set genes showed a significant ERC signatureamongst themselves, the target gene was prioritized to a much higher position among candi-dates. Training sets with very strong ERC (p-value< 10–4) placed the target gene in the 94th
percentile on average (median), and training sets with ERC p-values between 10–4 and 10–3
prioritized the target gene to the 87th percentile (Fig. 3). Because the strength of ERC in a train-ing set can be determined before performing prioritization, it is a strong and practical indicatorof confidence in ERC-based gene prioritization. In our scan of OMIM DGGs, small trainingsets (N� 20 genes) prioritized target genes better than large training sets (N> 20 genes). Al-though large sets demonstrated a similar relationship between training set p-value and prioriti-zation percentile, the relationship was relatively noisy. This difference was likely due to thesmaller number of DGGs in this category, which resulted in higher variance in estimates of dis-ease gene rank.
We also asked if ERC could prioritize candidate genes scattered throughout the genome in-stead of from a single chromosomal region. Such cases would be encountered if candidateswere drawn from whole-exome sequencing data for example. ERC successfully prioritizedthese candidate lists as well, and almost identically to the chromosomal regions (S1 Fig.). Thisprioritization also demonstrated a dependency on training set p-value as observed for chromo-somal regions. While low training p-values (p< 0.0001) placed the true disease gene in the
Figure 3. ERC disease gene prioritization. The prioritization of the true disease gene relative to itschromosomal neighbors improves with a stronger ERC signal within the training set. A low p-value (x-axis)indicates strong ERC within a training set. Prioritization (y-axis) is presented as the proportion of candidategenes scoring lower than the true disease gene, i.e. higher represents better prioritization. The blue series isfor diseases with training sets with 20 or fewer genes, representing the majority (70%) of OMIM diseasesinterrogated. The dotted green line is for those diseases with larger training sets.
doi:10.1371/journal.pgen.1004967.g003
Evolution-Derived Gene Networks
PLOS Genetics | DOI:10.1371/journal.pgen.1004967 February 13, 2015 7 / 17

94th percentile on average (median), that ranking decreased with increasing training set p-value. Overall, these tests demonstrate that ERC can be used to prioritize candidate genes froma chromosomal region or throughout the genome, especially if that disease has an ERC signa-ture between its known genes, i.e. the training set. In the next section, we demonstrate anexample application of this approach.
ERC infersMCL1 as a prime candidate gene within a melanoma-associated regionTo demonstrate ERC gene prioritization, we prioritized candidate genes from a melanoma-associated region. Melanoma was chosen because its 9 reported causative genes have a strongERC signature (mean ERC = 0.16, p-value = 0.00313) (Table 1), thereby providing strongpredictive power as demonstrated in the previous section. A recent genome-wide study byMacGregor et al. found an association between melanoma susceptibility and a 430 kb region ofchromosome 1q21.3 [33]. Because the region contains 10 protein-coding genes it is not clearwhich is causative. We prioritized these 10 candidate genes using their mean ERC signaturewith the 9 known melanoma genes (Table 2). One gene, myeloid cell leukemia 1 (MCL1), wasprioritized well above the other candidates with a mean ERC of 0.173; the next highest candi-date was at 0.037. The mean ERC forMCL1 was even greater than that between the genes inthe training set (0.160). Fittingly,MCL1 encodes a protein that regulates apoptosis and cellulardifferentiation, and hence is a strong candidate for involvement in melanoma susceptibility[34].
Evolution-based Disease Map: ERC signatures reveal geneticrelationships between diseasesHaving found robust ERC co-evolutionary signatures between genes within a disease, we nextsought to draw links between diseases using the same signatures. We hypothesized that suchlinks would cluster diseases with functionally related genes and potentially reveal unforeseenrelationships between diseases. Specifically, we inferred a connection between a pair of diseasesif the mean ERC value between their constituent genes was significantly elevated compared torandom gene sets. To avoid an artificial inflation of the mean ERC value, any genes shared be-tween DGG's were dropped from the calculation. Of the 48,205 disease-disease pairs 132 hadsignificantly elevated ERC at a p-value of 5 × 10⁻⁴ or lower, which represents a 5.5-fold enrich-ment. Applying a stringent 5% false discovery rate, there were a total of 81 disease-disease
Table 2. ERC gene prioritization for melanoma-associated region at 1q21.3.
Candidate Gene Mean melanoma ERC Empirical P-value
MCL1 0.173 0.071
CERS2 0.037 0.402
CTSS 0.016 0.458
CTSK -0.071 0.695
ANXA9 -0.093 0.755
HORMAD1 -0.098 0.768
GOLPH3L -0.113 0.800
ENSA -0.187 0.920
ARNT -0.232 0.959
SETDB1 -0.280 0.987
doi:10.1371/journal.pgen.1004967.t002
Evolution-Derived Gene Networks
PLOS Genetics | DOI:10.1371/journal.pgen.1004967 February 13, 2015 8 / 17

connections, which formed 12 clusters of potentially related diseases (Fig. 4). The resulting“disease map” contained ERC-drawn clusters with strong tendencies to contain diseases withrelated pathogenic mechanisms. The largest cluster consisted of 34 diseases and could bebroadly classified as blood-related disorders (Fig. 4; light red network). The second largest clus-ter of 7 diseases (light blue) consisted of mitochondrial disorders and ciliopathies, and thethird multi-gene cluster was composed of 4 heterogeneous disorders (dark green) that havesome shared symptomology relationships. Finally, the 9 remaining clusters were pairs of dis-eases consisting of a heterogeneous collection of disorders. The significance of these relation-ships is fully addressed in the Discussion section.
DiscussionIn this study we demonstrate that the relationships between disease-associated genes are oftenreflected in evolutionary signatures encoded in their gene sequences. Using our metric, evolu-tionary rate covariation (ERC), and the Online Mendelian Inheritance in Man (OMIM) data-base, we report 40 diverse diseases whose genes have elevated co-evolutionary signatures at afalse discovery rate of 5%, with an additional 130 diseases that also contain elevated rates ac-cording to false discovery rate analysis. We found statistically significant elevations of ERCboth between genes causing rare Mendelian disorders, such as Fanconi anemia, as well as morecommon diseases such as Alzheimer's disease, pancreatitis, deafness, colorectal cancer andrenal cell carcinoma (Supplemental S1 Table). The signatures we observe likely reflect the closefunctional relationships between the genes involved in a common pathogenic mechanism. We
Figure 4. Evolution-based diseasemap. ERC signatures between diseases were used to draw connections between separate diseases at a falsediscovery rate of 5%. The 12 clusters represent diseases that involve common genetic mechanisms as inferred by ERC. The largest cluster (pink network)contains several blood-related pathologies, while the light blue network contains mitochondrial diseases and ciliopathies. The remaining clusters containmany novel disease-disease relationships and are addressed fully in the Discussion section.
doi:10.1371/journal.pgen.1004967.g004
Evolution-Derived Gene Networks
PLOS Genetics | DOI:10.1371/journal.pgen.1004967 February 13, 2015 9 / 17

have observed similar signatures between functionally related genes in diverse biological pro-cesses and across different taxonomic groups ranging from single-celled organisms to mam-mals [26,28,29]. Ultimately, the signatures arise from shared fluctuations in evolutionary ratesas the genes respond to changing selective pressures. These observations also suggest that thesegene networks have been in tact throughout mammalian evolution and that they evolve togeth-er in response to shared evolutionary pressures. Overall, the strong signatures in many diseasesled us to test ERC's ability to reveal novel genetic relationships in human diseases.
ERC signatures can be calculated with existing genome sequences and are thus a practicaltool to prioritize candidate genes or to infer the function of novel genes. To demonstrate thepotential of ERC signatures to prioritize candidate genes for a given disease we again used theOMIM catalog. By treating each OMIM disease gene in turn as a hypothetically unknown dis-ease gene, we examined its mean ERC value with the remaining known genes for its disease,i.e. the training set. Compared to its chromosomal neighbors from a 1-Mb window or to a setof randomly selected genes across the genome, the true disease gene scored higher on average,yet sometimes not high enough to reliably or efficiently prioritize experimental follow-up.However, for diseases with an ERC signature in their training set (p-value< 0.05), the diseasegene was prioritized within the top 5 to 15% on average and in many cases was placed in thetop position. To assess our prioritization method, we compared our results to a study that ana-lyzed nine prioritization tools that largely rely on text mining, large-scale genomics, proteo-mics, expression and genetic association datasets [35]. For cases with a significant ERC signalin the training set, ERC performed on par with or exceeded the top methods (Table 3). The factthat ERC uses data that is completely independent of these methods raises the exciting possibil-ity that their integration with ERC would further improve prioritization. There is a notable ca-veat that success in our method depends on significant ERC within the training set, butfortunately this is a simple calculation that can be performed before any data is gathered, andwe estimate that approximately one-quarter of genetic diseases satisfy this requirement (72 of310 diseases had ERC p-values< 0.05). The potential for ERC to inform and guide experimen-tal efforts in human disease research is mirrored by ERC's previous successes in model organ-isms [28,31].
Based on our results here, there are a number of practical guidelines we can prescribe forgene prioritization. Each of these steps can be performed on our public ERC webserver usingthe 'Gene Prioritization' function, which also provides other ERC-based analysis tools (http://csb.pitt.edu/erc_analysis/). The first step is to define a training set of genes already known to beinvolved in the disease in question. Notably, chances of success should be improved by
Table 3. ERC gene prioritization compared to other methods.
Prioritization Tool Median prioritization rank (%) % cases in top 30%
ERC, P < 0.0001 92.6 78.7
ERC, P < 0.01 82.8 64.3
ERC, P < 0.05 74.3 55.4
Suspects 87.3 63.0
ToppGene 83.2 52.4
GeneWanderer-RW 77.9 61.9
Posmed-KS 68.5 23.8
GeneDistiller 88.9 78.6
Endeavour-CS 88.8 90.5
Pinta-CS 81.1 71.4
doi:10.1371/journal.pgen.1004967.t003
Evolution-Derived Gene Networks
PLOS Genetics | DOI:10.1371/journal.pgen.1004967 February 13, 2015 10 / 17

predicting likely pathogenic mechanisms when possible from clinical data or cellular pheno-types and choosing the most appropriate genes. The next step is to test for an ERC signaturewithin the chosen training set considering our results showed drastically improved prioritiza-tion for diseases with strong signatures—the effect was strong enough that we recommend pro-ceeding only if the training set shows a significantly elevated mean ERC. Based on our surveyof OMIM-curated diseases, this requirement should be met by approximately a quarter of dis-eases with a genetic component. However, a potentially larger proportion of diseases could beinterrogated if experts choose discrete pathways with stronger ERC signatures as training sets,possibly through careful examination of molecular phenotypes and integration of other bioin-formatics tools. The last step is to calculate the mean ERC value of each candidate with thetraining set. In our example, this set of steps identified theMCL1 gene from a melanoma-associated region as the most likely candidate.
Our between-disease analysis of ERC produced a set of disease-disease associations basedon evolutionary signatures (Fig. 4). Tight clusters within this disease map reproduced acceptedassociations between certain diseases; and perhaps more interestingly, ERC associations alsouncovered novel evolutionary relationships between clinically distinct diseases. For example,ERC was able to cluster four mitochondrial diseases that were all intuitively related, somebeing subclasses of the other. Additionally, a triad of clinically related diseases referred to asskeletal ciliopathies—cranioectodermal dysplasia, asphyxiating thoracic dystrophy and short-rib polydactyly syndrome—was found to share significant ERC values not only amongst eachother, but ERC also linked these diseases strongly to the mitochondrial disease network[36,37]. The relationship between mitochondrial disorders and ciliopathies is largely unad-dressed in the literature, but there are reports that mitochondrial proteins may co-localize withciliary proteins [38] and there is evidence of a mitochondrial protein deficiency (XPNPEP3)that produces a, phenotypically speaking, ciliopathy-like syndrome [39].
Many two-disease clusters also showed compelling, non-intuitive relationships. A link be-tween surfactant metabolism dysfunction and Bethlem myopathy was deemed significant byERC values, despite these two diseases having very little in common with one another clinically.Bethlem myopathy is caused by a defect in the production of a specialized collagen that leads todebilitating muscle weakness, while inherited surfactant defects leads to severe respiratory defi-cits. However, recent evidence has interestingly suggested that surfactant proteins have essen-tial collagen domains for surfactant homeostasis [40,41].
A rather dramatic pairing is the association between melanoma and Hirschsprung's disease,an embryologic defect of neural crest cell migration in which a portion of the intestinal nervoussystem lacks innervation, becomes immotile and causes gastrointestinal obstruction. Again,although these two diseases are clinically distinct, the association of the two using ERC suggestsa shared mechanism between them. Digging into this relationship further, strikingly, nearlyall genes associated with Hirschsprung's disease have had some evidence in melanoma patho-genesis. Variants in EDNRB have been loosely associated with increased melanoma risk inhumans and are hypothesized to play a role in CNS melanoma metastases [42,43]. Additional-ly, if EDNRB is heterozygously deleted in a mouse transgenically expressing RET—anotherHirschsprung disease gene—mice develop de novomelanoma lesions [44]. Moreover, yetanother Hirschsprung-associated gene, EDN3, has also been linked to melanoma invasiveness[45]. Lastly, a research group serendipitously produced a Hirschsprung's disease mouse modelwhile attempting to create a UV-induced melanoma model by knocking out a DNA repairgene in melanocytes of mice, with that same gene now being proposed as a potential mediatorof melanoma chemoresistance [46,47]. The relationship between these two diseases is largelyunaddressed specifically in the literature, although there is one report of an inherited form ofHirschsprung's disease that had a suspicious pattern of melanoma and pigment abnormalities
Evolution-Derived Gene Networks
PLOS Genetics | DOI:10.1371/journal.pgen.1004967 February 13, 2015 11 / 17

within the family (Wildin and Eichmeyer, 2008, ASHG, abstract). Melanocytes and entericnerve cells are known to be both embryologically derived from neural crest cells, perhaps ex-plaining at least in part why there may be an evolutionary link between the shared mechanismsof dysfunction that was uncovered by ERC.
Another connection of interest included one made between Noonan syndrome and Dia-mond-Blackfan anemia. These two diseases have no obvious pathogenic connection; however,they were linked by ERC. Interestingly, the two share common features including neck web-bing, micrognathia, low-set ears, specific cardiac abnormalities and epicanthus among manyothers [48,49], suggesting ERC may be able to link diseases with shared symptomatology.
The largest cluster consisted of a network of what could be broadly classified as blood-relat-ed disorders. With 34 diseases, this group consisted of 63 disease-disease connections. Themore intuitive connections included ERC links between inherited disorders that producederythrocyte structure defects—spherocytosis and eliptocytosis—and also statistically stronglinks between inherited disorders of hemostasis such as thrombophilia, dysfibrinogenemiaand general coagulation cascade deficits. ERC also linked thyroid dyshormogenesis andhypertryosinemia, of note since tyrosine molecules are the synthetic precursors of thyroidhormones. Another particularly interesting connection within this network included a stronglink between complement deficiency and systemic lupus erythematosus. Past research hasshown a strong link between these two diseases, and here, we show shared evolutionary signa-tures further corroborating this observation [50,51]. Other intriguing observations can bemade, such as a link between atypical uremic syndrome—caused by a loss of inhibitory factorswithin the complement cascade—and complement protein deficiencies. In summary, these as-sociations imply that ERC can generate large-scale, informative gene-based networks. In thiscase, we were able to build logical disease networks and uncover potentially novel pathogenicrelationships between disease-causing genes using a molecular evolution signature.
Other recent studies have laid out disease associations into maps or networks using differentapproaches. A pioneering map by Goh et al. inferred links between Mendelian diseases basedon shared contributing genes, and was able to form an expansive disease network [52]. Whileour evolution-based map explicitly ignored shared disease genes, it still exhibited a number ofdisease-disease associations in agreement with the Goh et al. map (Supplemental S3 Table).Moreover, our map revealed a number of associations not found in theirs, suggesting that ERCcan uniquely uncover linkages between diseases—an example being between melanoma andHirschsprung's disease as discussed above. Another promising ERC disease map-specific ex-ample is a cluster of renal and pulmonary diseases that share solute transport imbalance as acentral characteristic—iminoglycinuria, hyperglycinuria, pseudoaldosteronism, and bronchiec-tasis [53]. A disease map by Suthram et al. adopted a sophisticated strategy to discover diseaserelationships using both protein interaction modules and co-expression profiles [54]. This dualstrategy allowed them to move beyond Mendelian diseases and map associations betweenmulti-genic disorders. However, we were unable to compare the evolutionary map with theirsbecause we examined a different set of diseases. The most recent disease-disease associationstudy departed from genetic data and used massive databases of patient phenotypes to infer re-lationships between both common diseases and rare Mendelian ones [4]. Most diseases in thismap were not found in ours, but of those found in both studies, there was concordance. For ex-ample, both maps inferred an interconnected cluster of skin, blood, and immune-related diseases.
Lastly, a future aim of ours is to integrate our approach with other tools currently available.ERC is a unique signature of co-functionality that is entirely derived from comparative se-quence analysis. As such, it is expected to be independent and complementary to other estab-lished approaches, such as physical interaction datasets, co-expression analyses and literature
Evolution-Derived Gene Networks
PLOS Genetics | DOI:10.1371/journal.pgen.1004967 February 13, 2015 12 / 17

mining algorithms [5,12,55]. Integrating these methods will allow investigators to capitalize onthe strengths of each, enhancing our ability to prioritize and reveal valuable functional infor-mation regarding disease genes as well as to further contribute towards the recent trend of net-work-based studies of genes and diseases [4,56,57].
These efforts broadly begin to demonstrate the profound potential of utilizing a network-based understanding of molecular evolution to assist in gene prioritization, gene functionalannotation and informative gene-based network generation. Our hope is that ERC will providean alternative strategy for biomedical researchers to more efficiently transform gene candidatesinto actionable hypotheses.
Materials and Methods
Mammalian ERC value calculationERC values were calculated between 17,486 pairs of human genes as described in previous pub-lications [26,28]. In order to be included in the mammalian ERC analysis, gene ortholog pres-ence was required in a minimum of 17 of the 33 species in the dataset. Of the 19,733mammalian gene alignments considered, 17,487 met this threshold. Briefly, branch lengthsbased on amino acid divergence were created from protein coding mammalian sequences de-rived from the following species:Homo sapiens (human), Pongo pygmaeus abelii (orang-utan),Macaca mulatta (rhesus macaque), Callithrix jacchus (marmoset), Tarsius syrichta (tarsier),Microcebus murinus (mouse lemur), Otolemur garnettii (bushbaby), Tupaia belangeri (treeshrew), Cavia porcellus (guinea pig), Dipodomys ordii (kangaroo rat),Mus musculus (mouse),Rattus norvegicus (rat), Spermophilus tridecemlineatus (squirrel), Oryctolagus cuniculus (rab-bit), Ochotona princeps (pika), Vicugna pacos (alpaca), Sorex araneus (shrew), Bos taurus(cow), Tursiops truncatus (dolphin), Pteropus vampyrus (megabat),Myotis lucifugus (micro-bat), Erinaceus europaeus (hedgehog), Equus caballus (horse), Canis lupus familiaris (dog),Felis catus (cat), Choloepus hoffmanni (sloth), Echinops telfairi (tenrec), Loxodonta africana(elephant), Procavia capensis (rock hyrax), Dasypus novemcinctus (armadillo),Monodelphisdomestica (opossum),Macropus eugenii (wallaby), and Ornithorhynchus anatinus (platypus).Branch lengths were estimated using the aaml program of the PAML package [58]. Theselengths were normalized into relative rates using the projection operator method [59], and cor-relation coefficients (i.e. ERC values) between these relative rates were calculated betweenevery pair of genes using custom Perl programs.
OMIM disease gene ERC analysisData was downloaded from the OMIM website on June 4, 2013. Using the OMIMMorbidMap dataset, which is a list of diseases followed by single gene associations from publishedstudies, a Perl script was written that grouped disease genes by character matching manuallycurated disease gene associations into respective disease gene groups. 310 Disease Gene Group-ings (DGGs) were generated by broadly grouping all genes with matching disease names,effectively producing a list that consisted of each disease with multiple genes that have been as-sociated with that particular disease. These groups can be found in Supplemental S2 Table,which lists all genes within each DGG along with their corresponding gene and phenotypeMIM numbers. From this data, the average ERC value between all combinations of genes with-in each DGG from the 33 mammalian-species ERC dataset was calculated and then statisticallycompared to a null distribution of 100,000 random gene groups of the same size using a cus-tomized Perl script to determine any significant elevations in the mean ERC value. The analysiswas limited to disease gene pairings that were present in the current ERC database (17,487human genes & 133,416,393 ERC value pairs) and DGGs that contained greater than 1 gene.
Evolution-Derived Gene Networks
PLOS Genetics | DOI:10.1371/journal.pgen.1004967 February 13, 2015 13 / 17

The data was then sorted by p-value to determine diseases that most significantly harboredelevated ERC signatures. Lastly, a false discovery rate analysis was performed using the 'fdrtool'R package on the resulting p-values [60].
ERC disease gene prioritizationWe assessed ERC's ability to prioritize genes by creating a benchmarking study that generateda list of all genes surrounding a “target” disease gene within a 10 MB region and grouped theminto an aggregate “candidate” gene list. Using a “training set” of the remaining OMIM genesshown to be associated with the disease, the candidate genes were then prioritized based onERC values. We attempted to prioritize the genes using two ERC ranking strategies. The firstmethod (GROUP ERC) calculated the mean ERC value of each candidate gene with all genesin the training set and then ranked the candidates from highest mean ERC to lowest. Thesecond method (BEST ERC) scanned ERC values between each gene in the training set witheach candidate gene and used the maximum ERC value between any training set gene torank the candidates. Ultimately, the GROUP ERC method was chosen for application in theprioritization tests.
Inferring relationships between diseases with ERCDisease-disease comparisons were made by calculating the mean ERC value between the genesin each of the two diseases and then comparing that value to that of 10,000 resampled pseudo-disease sets. If two DGG's shared genes, these genes were dropped from the ERC mean calcula-tion to avoid an artificial enhancement of the value. The number of pseudo-datasets greaterthan or equal to the observed mean were tallied to calculate a permutation p-value. There werea total of 48,205 pairwise comparisons between all 310 Disease Gene Groupings. With theresulting p-values we performed false discovery rate analysis as before [60] and reported all dis-ease-disease pairs significant at a false discovery rate of 5% (Fig. 4).
Supporting InformationS1 Fig. ERC disease gene prioritization—scattered gene distributions. The prioritization ofthe true disease gene relative to randomly chosen genes throughout the genome improveswith a stronger ERC signal within the training set. A low p-value (x-axis) indicates strongERC within a training set. Prioritization (y-axis) is presented as the proportion of candidategenes scoring lower than the true disease gene, i.e. higher represents better prioritization. Thered series is for diseases with training sets with 20 or fewer genes, representing the majority(70%) of OMIM diseases interrogated. The dotted orange line is for those diseases with largertraining sets(TIFF)
S1 Table. ERC in all 310 disease gene groupings. Each disease gene grouping (DGG) is pre-sented with the mean ERC between all of its constituent genes. The permutation p-value re-flects how likely it is to achieve the indicated mean ERC or higher in random gene sets of thesame size. Q-values ('qval') reflect the false discovery rate for that given p-value taking into con-sideration the full distribution of p-values. 'Ngenes' lists the number of genes in that DGG.(XLSX)
S2 Table. OMIM disease gene groupings. This table provides the Mendelian Inheritance inMan (MIM) numbers for each phenotype and gene associated with a particular Disease GeneGrouping (DGG).(XLSX)
Evolution-Derived Gene Networks
PLOS Genetics | DOI:10.1371/journal.pgen.1004967 February 13, 2015 14 / 17

S3 Table. Comparison of disease maps. This supplemental table lists examples of disease-disease associations that were concordant and discordant between the evolution-based (ERC)disease map and the disease map produced by Goh et al. (PNAS 2007). Each line lists 2 or morediseases that formed an associated cluster. The first list contains disease associations found inboth maps. The second contains associations found in our evolution-based map that were notobserved in the map by Goh et al.(PDF)
Author ContributionsConceived and designed the experiments: NP NLC. Performed the experiments: NP NWNLC.Analyzed the data: NP NWNLC. Contributed reagents/materials/analysis tools: NP NWNLC.Wrote the paper: NP NLC.
References1. Manolio TA (2013) Bringing genome-wide association findings into clinical use. Nat Rev Genet 14:
549–558. doi: 10.1038/nrg3523 PMID: 23835440
2. Steensma DP (2013) The beginning of the end of the beginning in cancer genomics. N Engl J Med368: 2138–2140. doi: 10.1056/NEJMe1303816 PMID: 23634995
3. Barabási A-L, Gulbahce N, Loscalzo J (2011) Network medicine: a network-based approach to humandisease. Nat Rev Genet 12: 56–68. doi: 10.1038/nrg2918 PMID: 21164525
4. Blair DR, Lyttle CS, Mortensen JM, Bearden CF, Jensen AB, et al. (2013) A nondegenerate code of del-eterious variants in Mendelian loci contributes to complex disease risk. Cell 155: 70–80. doi: 10.1016/j.cell.2013.08.030 PMID: 24074861
5. Warde-Farley D, Donaldson SL, Comes O, Zuberi K, Badrawi R, et al. (2010) The GeneMANIA predic-tion server: biological network integration for gene prioritization and predicting gene function. NucleicAcids Res 38: W214–W220. doi: 10.1093/nar/gkq537 PMID: 20576703
6. Franceschini A, Szklarczyk D, Frankild S, Kuhn M, Simonovic M, et al. (2012) STRING v9.1: protein-protein interaction networks, with increased coverage and integration. Nucleic Acids Res 41: D808–D815. doi: 10.1093/nar/gks1094 PMID: 23203871
7. WuC, Macleod I, Su AI (2013) BioGPS and MyGene.info: organizing online, gene-centric information.Nucleic Acids Res 41: D561–D565. doi: 10.1093/nar/gks1114 PMID: 23175613
8. Kalathur RKR, Pinto JP, Hernández-Prieto MA, Machado RSR, Almeida D, et al. (2014) UniHI 7: an en-hanced database for retrieval and interactive analysis of humanmolecular interaction networks. NucleicAcids Res 42: D408–D414. doi: 10.1093/nar/gkt1100 PMID: 24214987
9. Navarro MN, Goebel J, Feijoo-Carnero C, Morrice N, Cantrell DA (2011) Phosphoproteomic analysisreveals an intrinsic pathway for the regulation of histone deacetylase 7 that controls the function of cyto-toxic T lymphocytes. Nat Immunol 12: 352–361. doi: 10.1038/ni.2008 PMID: 21399638
10. O'Roak BJ, Vives L, Girirajan S, Karakoc E, KrummN, et al. (2012) Sporadic autism exomes reveal ahighly interconnected protein network of de novo mutations. Nature 485: 246–250. doi: 10.1038/nature10989 PMID: 22495309
11. Mostafavi S, Morris Q (2012) Combining many interaction networks to predict gene function and ana-lyze gene lists. Proteomics 12: 1687–1696. doi: 10.1002/pmic.201100607 PMID: 22589215
12. Moreau Y, Tranchevent L-C (2012) Computational tools for prioritizing candidate genes: boosting dis-ease gene discovery. Nat Rev Genet 13: 523–536. doi: 10.1038/nrg3253 PMID: 22751426
13. Pippucci T, Parmeggiani A, Palombo F, Maresca A, Angius A, et al. (2013) A Novel Null HomozygousMutation ConfirmsCACNA2D2 as a Gene Mutated in Epileptic Encephalopathy. PLoS ONE 8: e82154.doi: 10.1371/journal.pone.0082154 PMID: 24358150
14. Jiao S, Chu Q, Wang Y, Xie Z, Hou S, et al. (2013) Identification of the causative gene for Simmentalarachnomelia syndrome using a network-based disease gene prioritization approach. PLoS ONE 8:e64468. doi: 10.1371/journal.pone.0064468 PMID: 23696895
15. Sparrow DB, Guillén-Navarro E, Fatkin D, Dunwoodie SL (2008) Mutation of Hairy-and-Enhancer-of-Split-7 in humans causes spondylocostal dysostosis. Human Molecular Genetics 17: 3761–3766. doi:10.1093/hmg/ddn272 PMID: 18775957
Evolution-Derived Gene Networks
PLOS Genetics | DOI:10.1371/journal.pgen.1004967 February 13, 2015 15 / 17

16. Rajab A, Straub V, McCann LJ, Seelow D, Varon R, et al. (2010) Fatal cardiac arrhythmia and long-QTsyndrome in a new form of congenital generalized lipodystrophy with muscle rippling (CGL4) due toPTRF-CAVIN mutations. PLoS Genet 6: e1000874. doi: 10.1371/journal.pgen.1000874 PMID:20300641
17. Erlich Y, Edvardson S, Hodges E, Zenvirt S, Thekkat P, et al. (2011) Exome sequencing and disease-network analysis of a single family implicate a mutation in KIF1A in hereditary spastic paraparesis.Genome Res 21: 658–664. doi: 10.1101/gr.117143.110 PMID: 21487076
18. Amberger J, Bocchini CA, Scott AF, Hamosh A (2009) McKusick's Online Mendelian Inheritance inMan (OMIM). Nucleic Acids Res 37: D793–D796. doi: 10.1093/nar/gkn665 PMID: 18842627
19. Barabási A-L (2007) Network medicine—from obesity to the "diseasome". N Engl J Med 357:404–407. PMID: 17652657
20. Lee D-S, Park J, Kay KA, Christakis NA, Oltvai ZN, et al. (2008) The implications of humanmetabolicnetwork topology for disease comorbidity. Proc Natl Acad Sci USA 105: 9880–9885. doi: 10.1073/pnas.0802208105 PMID: 18599447
21. Hidalgo CA, BlummN, Barabási A-L, Christakis NA (2009) A Dynamic Network Approach for the Study ofHuman Phenotypes. PLoSComput Biol 5: e1000353. doi: 10.1371/journal.pcbi.1000353 PMID: 19360091
22. Li Y, Agarwal P (2009) A pathway-based view of human diseases and disease relationships. PLoSONE 4: e4346. doi: 10.1371/journal.pone.0004346 PMID: 19194489
23. Dudley JT, Deshpande T, Butte AJ (2011) Exploiting drug-disease relationships for computational drugrepositioning. Briefings in Bioinformatics 12: 303–311. doi: 10.1093/bib/bbr013 PMID: 21690101
24. Hurle MR, Yang L, Xie Q, Rajpal DK, Sanseau P, et al. (2013) Computational drug repositioning: fromdata to therapeutics. Clin Pharmacol Ther 93: 335–341. doi: 10.1038/clpt.2013.1 PMID: 23443757
25. Lovell SC, Robertson DL (2010) An integrated view of molecular coevolution in protein-protein interac-tions. Mol Biol Evol 27: 2567–2575. doi: 10.1093/molbev/msq144 PMID: 20551042
26. Clark NL, Alani E, Aquadro CF (2012) Evolutionary rate covariation reveals shared functionality andcoexpression of genes. Genome Res 22: 714–720. doi: 10.1101/gr.132647.111 PMID: 22287101
27. Juan D, Pazos F, Valencia A (2008) High-confidence prediction of global interactomes based on ge-nome-wide coevolutionary networks. Proc Natl Acad Sci USA 105: 934–939. doi: 10.1073/pnas.0709671105 PMID: 18199838
28. Clark NL, Alani E, Aquadro CF (2013) Evolutionary rate covariation in meiotic proteins results from fluc-tuating evolutionary pressure in yeasts and mammals. Genetics 193: 529–538. doi: 10.1534/genetics.112.145979 PMID: 23183665
29. Clark NL, Aquadro CF (2010) A novel method to detect proteins evolving at correlated rates: identifyingnew functional relationships between coevolving proteins. Mol Biol Evol 27: 1152–1161. doi: 10.1093/molbev/msp324 PMID: 20044587
30. Clark NL, Gasper J, Sekino M, Springer SA, Aquadro CF, et al. (2009) Coevolution of interacting fertili-zation proteins. PLoS Genet 5: e1000570. doi: 10.1371/journal.pgen.1000570 PMID: 19629160
31. Findlay GD, Sitnik JL, WangW, Aquadro CF, Clark NL, et al. (2014) Evolutionary rate covariation identi-fies new members of a protein network required for Drosophila melanogaster female post-mating re-sponses. PLoS Genet 10: e1004108. doi: 10.1371/journal.pgen.1004108 PMID: 24453993
32. Storey JD, Tibshirani R (2003) Statistical significance for genomewide studies. Proc Natl Acad Sci USA100: 9440–9445. PMID: 12883005
33. Macgregor S, Montgomery GW, Liu JZ, Zhao ZZ, Henders AK, et al. (2011) Genome-wide associationstudy identifies a newmelanoma susceptibility locus at 1q21.3. Nat Genet 43: 1114–1118. doi: 10.1038/ng.958 PMID: 21983785
34. Kozopas KM, Yang T, Buchan HL, Zhou P, Craig RW (1993) MCL1, a gene expressed in programmedmyeloid cell differentiation, has sequence similarity to BCL2. Proc Natl Acad Sci USA 90: 3516–3520.PMID: 7682708
35. Bornigen D, Tranchevent LC, Bonachela-Capdevila F, Devriendt K, De Moor B, et al. (2012) An unbi-ased evaluation of gene prioritization tools. Bioinformatics 28: 3081–3088. doi: 10.1093/bioinformatics/bts581 PMID: 23047555
36. Bredrup C, Saunier S, Oud MM, Fiskerstrand T, Hoischen A, et al. (2011) Ciliopathies with skeletalanomalies and renal insufficiency due to mutations in the IFT-A geneWDR19. Am J HumGenet 89:634–643. doi: 10.1016/j.ajhg.2011.10.001 PMID: 22019273
37. Huber C, Cormier-Daire V (2012) Ciliary disorder of the skeleton. Am J Med Genet 160C: 165–174.doi: 10.1002/ajmg.c.31336 PMID: 22791528
38. Hu J, Barr MM (2005) ATP-2 interacts with the PLAT domain of LOV-1 and is involved in Caenorhabdi-tis elegans polycystin signaling. Mol Biol Cell 16: 458–469. PMID: 15563610
Evolution-Derived Gene Networks
PLOS Genetics | DOI:10.1371/journal.pgen.1004967 February 13, 2015 16 / 17

39. O'Toole JF, Liu Y, Davis EE, Westlake CJ, Attanasio M, et al. (2010) Individuals with mutations inXPNPEP3, which encodes a mitochondrial protein, develop a nephronophthisis-like nephropathy. JClin Invest 120: 791–802. doi: 10.1172/JCI40076 PMID: 20179356
40. Kingma PS, Zhang L, Ikegami M, Hartshorn K, McCormack FX, et al. (2006) Correction of PulmonaryAbnormalities in Sftpd-/- Mice Requires the Collagenous Domain of Surfactant Protein D. Journal of Bi-ological Chemistry 281: 24496–24505. PMID: 16787926
41. Orgeig S, Hiemstra PS, Veldhuizen EJA, Casals C, Clark HW, et al. (2010) Recent advances in alveolarbiology: evolution and function of alveolar proteins. Respir Physiol Neurobiol 173 Suppl: S43–S54. doi:10.1016/j.resp.2010.04.023 PMID: 20433956
42. Soufir N, Meziani R, Lacapère J-J, Bertrand G, Fumeron F, et al. (2005) Association between endothe-lin receptor B nonsynonymous variants and melanoma risk. J Natl Cancer Inst 97: 1297–1301. PMID:16145050
43. Cruz-MuñozW, Jaramillo ML, Man S, Xu P, Banville M, et al. (2012) Roles for endothelin receptor Band BCL2A1 in spontaneous CNSmetastasis of melanoma. Cancer Research 72: 4909–4919. doi: 10.1158/0008-5472.CAN-12-2194 PMID: 22865454
44. Kumasaka MY, Yajima I, Hossain K, Iida M, Tsuzuki T, et al. (2010) A Novel Mouse Model for De novoMelanoma. Cancer Research 70: 24–29. doi: 10.1158/0008-5472.CAN-09-2838 PMID: 20048069
45. Spinella F, Rosanò L, Di Castro V, Decandia S, Nicotra MR, et al. (2007) Endothelin-1 and endothelin-3promote invasive behavior via hypoxia-inducible factor-1alpha in human melanoma cells. Cancer Re-search 67: 1725–1734. PMID: 17308114
46. Selfridge J, Song L, Brownstein DG, Melton DW (2010) Mice with DNA repair gene Ercc1 deficiency ina neural crest lineage are a model for late-onset Hirschsprung disease. DNA Repair (Amst) 9: 653–660. doi: 10.1016/j.dnarep.2010.02.018 PMID: 20362516
47. Li W, Melton DW (2012) Cisplatin regulates the MAPK kinase pathway to induce increased expressionof DNA repair gene ERCC1 and increase melanoma chemoresistance. Oncogene 31: 2412–2422. doi:10.1038/onc.2011.426 PMID: 21996734
48. MDDAER, MD PJEA PhDMT, MD PBDG (2013) Noonan syndrome. The Lancet 381: 333–342. doi:10.1016/S0140-6736(12)61023-X PMID: 23312968
49. Vlachos A, Ball S, Dahl N, Alter BP, Sheth S, et al. (2008) Diagnosing and treating Diamond Blackfananaemia: results of an international clinical consensus conference. British Journal of Haematology142: 859–876. doi: 10.1111/j.1365-2141.2008.07269.x PMID: 18671700
50. Barilla-LaBarca M-L, Toder K, Furie R (2013) Targeting the complement system in systemic lupus ery-thematosus and other diseases. Clinical Immunology 148: 313–321. doi: 10.1016/j.clim.2013.02.014PMID: 23623037
51. Crispín JC, Hedrich CM, Tsokos GC (2013) Gene-function studies in systemic lupus erythematosus.Nature Publishing Group 9: 476–484.
52. Goh K-I, Cusick ME, Valle D, Childs B, Vidal M, et al. (2007) The human disease network. Proc NatlAcad Sci USA 104: 8685–8690. PMID: 17502601
53. Bröer S, Bailey CG, Kowalczuk S, Ng C, Vanslambrouck JM, et al. (2008) Iminoglycinuria andhyperglycinuria are discrete human phenotypes resulting from complex mutations in proline and glycinetransporters. J Clin Invest 118: 3881–3892. doi: 10.1172/JCI36625 PMID: 19033659
54. Suthram S, Dudley JT, Chiang AP, Chen R, Hastie TJ, et al. (2010) Network-Based Elucidation ofHuman Disease Similarities Reveals Common Functional Modules Enriched for Pluripotent Drug Tar-gets. PLoS Comput Biol 6: e1000662. doi: 10.1371/journal.pcbi.1000662 PMID: 20140234
55. Szklarczyk D, Franceschini A, Kuhn M, Simonovic M, Roth A, et al. (2011) The STRING database in2011: functional interaction networks of proteins, globally integrated and scored. Nucleic Acids Res 39:D561–D568. doi: 10.1093/nar/gkq973 PMID: 21045058
56. Kouskoumvekaki I, Shublaq N, Brunak S (2013) Facilitating the use of large-scale biological data andtools in the era of translational bioinformatics. Briefings in Bioinformatics.
57. Daub JT, Hofer T, Cutivet E, Dupanloup I, Quintana-Murci L, et al. (2013) Evidence for polygenic adap-tation to pathogens in the human genome. Mol Biol Evol 30: 1544–1558. doi: 10.1093/molbev/mst080PMID: 23625889
58. Yang Z (2007) PAML 4: Phylogenetic Analysis by Maximum Likelihood. Mol Biol Evol 24: 1586–1591.PMID: 17483113
59. Sato T, Yamanishi Y, Kanehisa M, Toh H (2005) The inference of protein-protein interactions by co-evolutionary analysis is improved by excluding the information about the phylogenetic relationships.Bioinformatics 21: 3482–3489. PMID: 15994190
60. Strimmer K (2008) fdrtool: a versatile R package for estimating local and tail area-based false discoveryrates. Bioinformatics 24: 1461–1462. doi: 10.1093/bioinformatics/btn209 PMID: 18441000
Evolution-Derived Gene Networks
PLOS Genetics | DOI:10.1371/journal.pgen.1004967 February 13, 2015 17 / 17