RESEARCHARTICLE 3DComputationalMechanicsElucidatethe ... · RESEARCHARTICLE...
23
RESEARCH ARTICLE 3D Computational Mechanics Elucidate the Evolutionary Implications of Orbit Position and Size Diversity of Early Amphibians Jordi Marcé-Nogué 1,2 *, Josep Fortuny 1,2 , Soledad De Esteban-Trivigno 2,3 , Montserrat Sánchez 1 , Lluís Gil 1 , Àngel Galobart 2 1 Universitat Politècnica de Catalunya–BarcelonaTech, Terrassa, Spain, 2 Institut Català de Paleontologia Miquel Crusafont, Cerdanyola del Vallés, Spain, 3 Transmitting Science, Piera, Spain * [email protected] Abstract For the first time in vertebrate palaeontology, the potential of joining Finite Element Analysis (FEA) and Parametrical Analysis (PA) is used to shed new light on two different cranial parameters from the orbits to evaluate their biomechanical role and evolutionary patterns. The early tetrapod group of Stereospondyls, one of the largest groups of Temnospondyls is used as a case study because its orbits position and size vary hugely within the members of this group. An adult skull of Edingerella madagascariensis was analysed using two different cases of boundary and loading conditions in order to quantify stress and deformation response under a bilateral bite and during skull raising. Firstly, the variation of the original geometry of its orbits was introduced in the models producing new FEA results, allowing the exploration of the ecomorphology, feeding strategy and evolutionary patterns of these top predators. Secondly, the quantitative results were analysed in order to check if the orbit size and position were correlated with different stress patterns. These results revealed that in most of the cases the stress distribution is not affected by changes in the size and position of the orbit. This finding supports the high mechanical plasticity of this group during the Tri- assic period. The absence of mechanical constraints regarding the orbit probably promoted the ecomorphological diversity acknowledged for this group, as well as its ecological niche differentiation in the terrestrial Triassic ecosystems in clades as lydekkerinids, tremato- saurs, capitosaurs or metoposaurs. Introduction The usage of computational methods such as Finite Element Analysis (FEA) or Multibody Dynamics Analysis (MDA) to estimate the biomechanical performance of vertebrate skeletal and soft tissues has increased in the last ten years. Particularly, Finite Element Analysis [1] has been used in vertebrate palaeontology to simulate simplified 2D models or create high-resolu- tion 3D models of vertebrates to study their function, morphological evolution, particular adaptation or constraints. (See [2] for a review of FEA methodology and examples). Other PLOS ONE | DOI:10.1371/journal.pone.0131320 June 24, 2015 1 / 23 OPEN ACCESS Citation: Marcé-Nogué J, Fortuny J, De Esteban- Trivigno S, Sánchez M, Gil L, Galobart À (2015) 3D Computational Mechanics Elucidate the Evolutionary Implications of Orbit Position and Size Diversity of Early Amphibians. PLoS ONE 10(6): e0131320. doi:10.1371/journal.pone.0131320 Editor: Pasquale Raia, University of Naples, ITALY Received: October 15, 2014 Accepted: June 1, 2015 Published: June 24, 2015 Copyright: © 2015 Marcé-Nogué et al. This is an open access article distributed under the terms of the Creative Commons Attribution License, which permits unrestricted use, distribution, and reproduction in any medium, provided the original author and source are credited. Data Availability Statement: All relevant data are within the paper and its Supporting Information files. Funding: This research received support from the SYNTHESYS Project FR-TAF-3353 to J.F. (http:// www.synthesys.info/) which is financed by European Community Research Infrastructure Action under the FP7 "Capacities" Program. The funds were only for trips in visiting collections. For the rest of the research, the authors received no specific funding for this work. Competing Interests: The authors have declared that no competing interests exist.
Transcript of RESEARCHARTICLE 3DComputationalMechanicsElucidatethe ... · RESEARCHARTICLE...
RESEARCH ARTICLE
3D Computational Mechanics Elucidate theEvolutionary Implications of Orbit Positionand Size Diversity of Early AmphibiansJordi Marcé-Nogué1,2*, Josep Fortuny1,2, Soledad De Esteban-Trivigno2,3,Montserrat Sánchez1, Lluís Gil1,Àngel Galobart2
1 Universitat Politècnica de Catalunya–BarcelonaTech, Terrassa, Spain, 2 Institut Català de PaleontologiaMiquel Crusafont, Cerdanyola del Vallés, Spain, 3 Transmitting Science, Piera, Spain
AbstractFor the first time in vertebrate palaeontology, the potential of joining Finite Element Analysis
(FEA) and Parametrical Analysis (PA) is used to shed new light on two different cranial
parameters from the orbits to evaluate their biomechanical role and evolutionary patterns.
The early tetrapod group of Stereospondyls, one of the largest groups of Temnospondyls is
used as a case study because its orbits position and size vary hugely within the members of
this group. An adult skull of Edingerella madagascariensis was analysed using two different
cases of boundary and loading conditions in order to quantify stress and deformation
response under a bilateral bite and during skull raising. Firstly, the variation of the original
geometry of its orbits was introduced in the models producing new FEA results, allowing the
exploration of the ecomorphology, feeding strategy and evolutionary patterns of these top
predators. Secondly, the quantitative results were analysed in order to check if the orbit size
and position were correlated with different stress patterns. These results revealed that in
most of the cases the stress distribution is not affected by changes in the size and position
of the orbit. This finding supports the high mechanical plasticity of this group during the Tri-
assic period. The absence of mechanical constraints regarding the orbit probably promoted
the ecomorphological diversity acknowledged for this group, as well as its ecological niche
differentiation in the terrestrial Triassic ecosystems in clades as lydekkerinids, tremato-
saurs, capitosaurs or metoposaurs.
IntroductionThe usage of computational methods such as Finite Element Analysis (FEA) or MultibodyDynamics Analysis (MDA) to estimate the biomechanical performance of vertebrate skeletaland soft tissues has increased in the last ten years. Particularly, Finite Element Analysis [1] hasbeen used in vertebrate palaeontology to simulate simplified 2D models or create high-resolu-tion 3D models of vertebrates to study their function, morphological evolution, particularadaptation or constraints. (See [2] for a review of FEA methodology and examples). Other
PLOSONE | DOI:10.1371/journal.pone.0131320 June 24, 2015 1 / 23
OPEN ACCESS
Citation: Marcé-Nogué J, Fortuny J, De Esteban-Trivigno S, Sánchez M, Gil L, Galobart À (2015) 3DComputational Mechanics Elucidate the EvolutionaryImplications of Orbit Position and Size Diversity ofEarly Amphibians. PLoS ONE 10(6): e0131320.doi:10.1371/journal.pone.0131320
Editor: Pasquale Raia, University of Naples, ITALY
Received: October 15, 2014
Accepted: June 1, 2015
Published: June 24, 2015
Copyright: © 2015 Marcé-Nogué et al. This is anopen access article distributed under the terms of theCreative Commons Attribution License, which permitsunrestricted use, distribution, and reproduction in anymedium, provided the original author and source arecredited.
Data Availability Statement: All relevant data arewithin the paper and its Supporting Information files.
Funding: This research received support from theSYNTHESYS Project FR-TAF-3353 to J.F. (http://www.synthesys.info/) which is financed by EuropeanCommunity Research Infrastructure Action under theFP7 "Capacities" Program. The funds were only fortrips in visiting collections. For the rest of theresearch, the authors received no specific funding forthis work.
Competing Interests: The authors have declaredthat no competing interests exist.
tools such as Parametrical Analysis (PA) are excellent inductive and non-invasive methods totest how morphological changes could affect the biomechanical performance of the biologicalstructures, giving the keys to understand the evolutionary history and variability of the ana-lysed organisms.
In vertebrate palaeontology, some previous works joined PA and FEA to test the behaviourand sensitivity of different parameters such as the material properties of the biological tissue[3], the homogeneity or heterogeneity of the bone [4], the sutures [5], or the influence of theloads applied [6,7]. Interestingly, FEA and PA were rarely used in vertebrate palaeontology totest how the variation of the original geometry affects the biomechanical performance [8].
Herein, we test the potential of joining Finite Element (FE) and Parametrical Analysis (PA)to test the effect of two different cranial parameters in Stereospondyls-one of the largest cladesof the early tetrapods Temnospondyls- to evaluate its biomechanical role and evolutionary pat-terns. Members of Stereospondyls acquired medium to gigantic sizes being the top freshwaterpredators during the Permian and until the Middle Triassic. Its members were mostly charac-terized by dorsoventral flattened and strongly ossified skulls giving them a superficially croco-dile-like appearance. Their shape diversity went from broad-headed (as Alligator) in the case ofcapitosaurs to slender headed (as gavialids) in the case of some trematosaurids. The ecomor-phology of the Stereospondyls has been largely debated, specially focusing on their feedingecology [9–14]. However, no previous studies have focused on the role of any morphologicalcharacter that could be involved in the ecomorphology and feeding strategy of Stereospondyls,as have been largely performed in other groups such as crocodiles [15–18]. Thus, we analysethe role of the orbits in these top predators. Orbits position and size hugely vary among the dif-ferent Stereospondyls groups (Fig 1); in metoposaurs, the orbits were positioned in a very ante-rior position in comparison with capitosaurs, while the orbit size also extremely varies amongthe Stereospondyls, with huge size in some capitosaur taxa (Mastodonsaurus sp. or Eryosuchussp.) in comparison with other capitosauroid, trematosauroid or metoposauroid taxa (See[13,19] and references therein). The biomechanical role of these characters was analysed usingFinite Element Analysis (FEA) and Parametric Analysis (PA) in a quantitative framework.
Materials and Methods
SampleAn adult skull of Edingerella madagascariensis was analysed. This taxon is well known fromthe Olenekian (Early Triassic) of Madagascar from several specimens, including ontogeneticalseries [20]. Phylogenetic analyses places this taxon as a basal member of the capitosaurianclade (See [20–22]. The specimen used as a case-study was described in detail by [22], beingthe largest and most well preserved specimen recovered to date for this taxon. The specimencomes from a siliceous nodule. A cast made with silicon resins allowed us to obtain a complete3D skull with an exceptional fidelity of skull details, including most of the inner regions with-out deformation (See [22] for further details). The specimen analysed is stored at the MuséumNational d’Histoire Naturelle (MNHN) in Paris, with the labelling MSNM V2992.
GeometryThe skull of E.madagascariensis was digitalized using a medical CT scan Siemens Sensations-16, at 140 kV and 150 mAs giving an output of 512 x 512 pixels per slice. The pixel size and theinter-slice space were 0.586 mm and 0.1 mm, respectively. It was converted to a CAD modelusing reverse engineering techniques [23].
The digital model was treated with the software AVIZO, which enables to perform interac-tive visualization and computation on 3D data sets, and at the same time generates and
3D Computational Mechanics of Early Amphibians
PLOS ONE | DOI:10.1371/journal.pone.0131320 June 24, 2015 2 / 23

modifies 3D surface models from stacked medical images such as CT, through image segmen-tation done in the STL (stereolithography) format involving the stages of segmentation and 3Dreconstruction.
The reconstructed geometry had the usual irregularities in the surface due to the generationof the model from the CT scan. Consequently, the geometry required a transformation toachieve a geometry that fulfils requirements of quality, consistency and shape. The quality oftetrahedrals in the STL mesh is given by quality indicators of the mesh such as skewness and/or aspect ratio. The consistency refers to possible topological errors, and the shape to the finalgeometry obtained with smooth operations. This was done using the automatic thresholdingtools of the CT-software AVIZO in a first step, and in a second step, in those areas where theirregularities were present, a semi-automatic thresholding approach to correct them withsmoothing and relaxation tools, to finally generate the 3D model. A refinement and smoothingand/or a relaxation of some regions of the geometrical mesh was also required. It is importantto differentiate between the geometrical and the Finite Element (FE) meshes: these mesheswere generated by different algorithms and with different functions. The geometrical mesh wasonly used to obtain the digital model from the CT scan, while the FE mesh is used to solve theequations of the structural analysis problem.
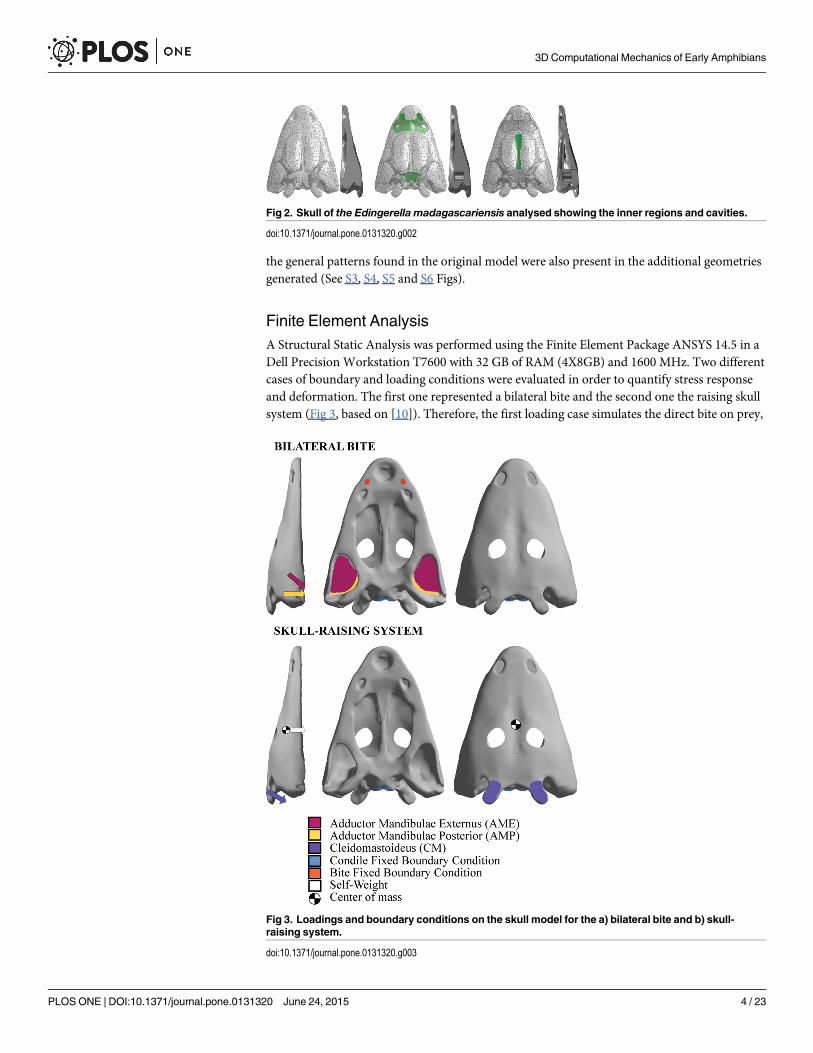
After this part in AVIZO, some inner regions were reconstructed (i.e. the space between thevomer and the skull roof bones, the endocranial area and the inner part of the cultriform pro-cess). These regions are rarely preserved in 3D in the fossil record (e.g. vomer and skull roofbones use to be in contact due to taphonomical factors). Despite this, reconstruction can bedone because in the literature these inner regions are described [24–26], but also thanks to per-sonal observations of one of us (J.F.). These features were reconstructed using the CAD inter-face of the Finite Element Package ANSYS 14.5 (Fig 2).
Additionally, in order to evaluate the overall skull shape diversity within Stereospondyls theoriginal model was wrapped in two different directions generating a long-slender snouted mor-photype and a broad skull and short-snouted morphotype. This was done to evaluate how theshape morphology affected the Von Mises stress patterns (See S2 Document) and revealed that
Fig 1. Simplified Cladogram of Stereospondyli based on Fortuny et al. [1] and Schoch [2].
doi:10.1371/journal.pone.0131320.g001
3D Computational Mechanics of Early Amphibians
PLOS ONE | DOI:10.1371/journal.pone.0131320 June 24, 2015 3 / 23
the general patterns found in the original model were also present in the additional geometriesgenerated (See S3, S4, S5 and S6 Figs).
Finite Element AnalysisA Structural Static Analysis was performed using the Finite Element Package ANSYS 14.5 in aDell Precision Workstation T7600 with 32 GB of RAM (4X8GB) and 1600 MHz. Two differentcases of boundary and loading conditions were evaluated in order to quantify stress responseand deformation. The first one represented a bilateral bite and the second one the raising skullsystem (Fig 3, based on [10]). Therefore, the first loading case simulates the direct bite on prey,
Fig 2. Skull of the Edingerella madagascariensis analysed showing the inner regions and cavities.
doi:10.1371/journal.pone.0131320.g002
Fig 3. Loadings and boundary conditions on the skull model for the a) bilateral bite and b) skull-raising system.
doi:10.1371/journal.pone.0131320.g003
3D Computational Mechanics of Early Amphibians
PLOS ONE | DOI:10.1371/journal.pone.0131320 June 24, 2015 4 / 23
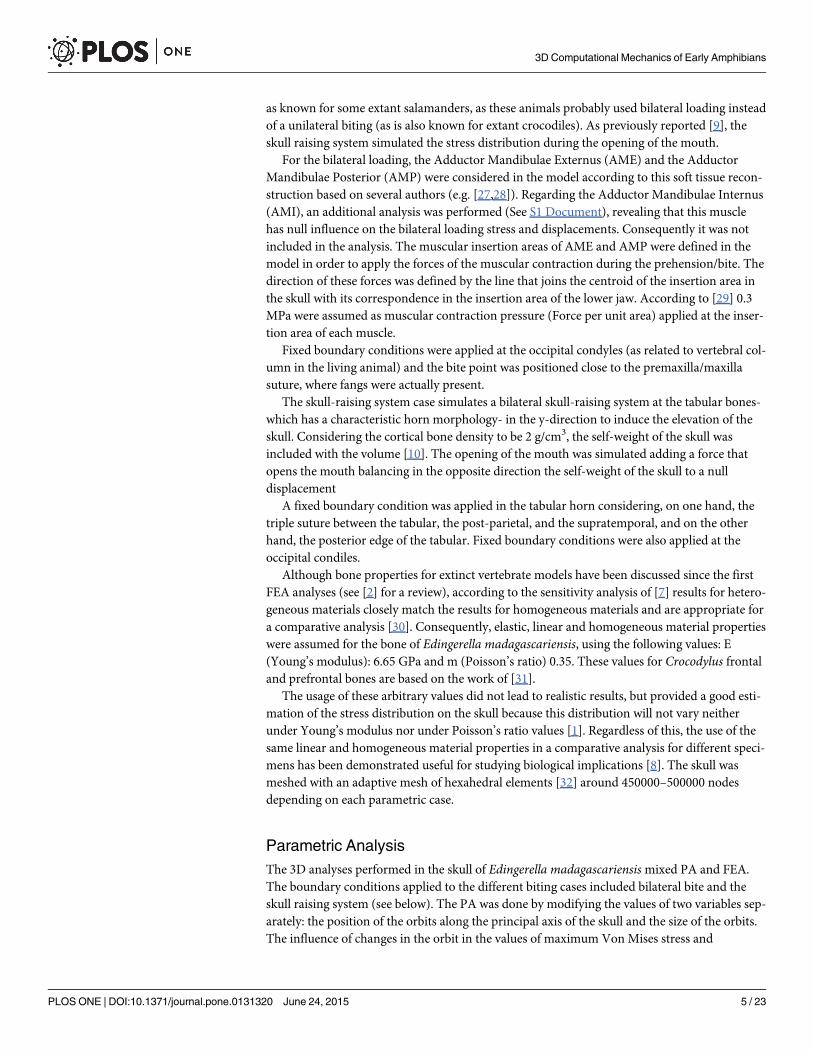
as known for some extant salamanders, as these animals probably used bilateral loading insteadof a unilateral biting (as is also known for extant crocodiles). As previously reported [9], theskull raising system simulated the stress distribution during the opening of the mouth.
For the bilateral loading, the Adductor Mandibulae Externus (AME) and the AdductorMandibulae Posterior (AMP) were considered in the model according to this soft tissue recon-struction based on several authors (e.g. [27,28]). Regarding the Adductor Mandibulae Internus(AMI), an additional analysis was performed (See S1 Document), revealing that this musclehas null influence on the bilateral loading stress and displacements. Consequently it was notincluded in the analysis. The muscular insertion areas of AME and AMP were defined in themodel in order to apply the forces of the muscular contraction during the prehension/bite. Thedirection of these forces was defined by the line that joins the centroid of the insertion area inthe skull with its correspondence in the insertion area of the lower jaw. According to [29] 0.3MPa were assumed as muscular contraction pressure (Force per unit area) applied at the inser-tion area of each muscle.
Fixed boundary conditions were applied at the occipital condyles (as related to vertebral col-umn in the living animal) and the bite point was positioned close to the premaxilla/maxillasuture, where fangs were actually present.
The skull-raising system case simulates a bilateral skull-raising system at the tabular bones-which has a characteristic horn morphology- in the y-direction to induce the elevation of theskull. Considering the cortical bone density to be 2 g/cm3, the self-weight of the skull wasincluded with the volume [10]. The opening of the mouth was simulated adding a force thatopens the mouth balancing in the opposite direction the self-weight of the skull to a nulldisplacement
A fixed boundary condition was applied in the tabular horn considering, on one hand, thetriple suture between the tabular, the post-parietal, and the supratemporal, and on the otherhand, the posterior edge of the tabular. Fixed boundary conditions were also applied at theoccipital condiles.
Although bone properties for extinct vertebrate models have been discussed since the firstFEA analyses (see [2] for a review), according to the sensitivity analysis of [7] results for hetero-geneous materials closely match the results for homogeneous materials and are appropriate fora comparative analysis [30]. Consequently, elastic, linear and homogeneous material propertieswere assumed for the bone of Edingerella madagascariensis, using the following values: E(Young’s modulus): 6.65 GPa and m (Poisson’s ratio) 0.35. These values for Crocodylus frontaland prefrontal bones are based on the work of [31].
The usage of these arbitrary values did not lead to realistic results, but provided a good esti-mation of the stress distribution on the skull because this distribution will not vary neitherunder Young’s modulus nor under Poisson’s ratio values [1]. Regardless of this, the use of thesame linear and homogeneous material properties in a comparative analysis for different speci-mens has been demonstrated useful for studying biological implications [8]. The skull wasmeshed with an adaptive mesh of hexahedral elements [32] around 450000–500000 nodesdepending on each parametric case.
Parametric AnalysisThe 3D analyses performed in the skull of Edingerella madagascariensismixed PA and FEA.The boundary conditions applied to the different biting cases included bilateral bite and theskull raising system (see below). The PA was done by modifying the values of two variables sep-arately: the position of the orbits along the principal axis of the skull and the size of the orbits.The influence of changes in the orbit in the values of maximum Von Mises stress and
3D Computational Mechanics of Early Amphibians
PLOS ONE | DOI:10.1371/journal.pone.0131320 June 24, 2015 5 / 23

displacements, as well as stress values at certain points, was observed and analysed. As revealedby the fossil record, the variability of orbit size and position in this group was very high, in con-trast with other characters (as position of the Pineal foramen) that were almost invariablealong the evolutionary history of Stereospondyls [19]. On this regard, the orbit position couldbe analysed according to the distance between the orbits and the pineal foramen and in relationto the total length of the skull (Table 1, Fig 1). Some taxa presented these two structures veryclose to each other (e.g. 0.09, Eocyclotosaurus and related forms, [33] in clear contrast withother taxa with widely separated orbits and pineal foramen (e.g., more than 4 times) as foundinMetoposaurus and related forms [34].
Similarly, the size of the orbits also presents high variability. Considering the maximumdiameter of the orbit in relation to the total length of the skull, some taxa present relativelysmall sized orbits (e.g. 0.08, Eocyclotosaurus and related forms [33], being different from mosttaxa with larger orbits (e.g. 0.12, Benthosuchus orWantzosaurus, [33,35] or those withextremely big orbits (e.g. 0.23,Mastodonsaurus or Eryosuchus, [19,36] being almost 3 times thesize of the smallest ones. Therefore, the parameterization analysis simulated the variability ofthese parametres (Fig 4). Value h corresponded to the distance between the centre of the pinealforamen and the centre of the orbit. The original distance from the centre of the pineal foramento the centre of the orbits was h = 17.5 mm. The distances ranged from from 2.5 mm to 42.5mm in steps of 2.5 mm for each case solving 18 cases in total. Value S corresponded to the pro-portion of the orbit size, considering 1 the original size. The size proportion of the orbits thatwas analysed went from 0.125 to 1.625 in steps of 0.125, solving 14 cases in total. These casesovercome the variability range found in the fossil record to test if the results varied and exploreany biological/biomechanical explanation for cases not found in fossil record.
Table 1. Distances relating skull length, pineal foramen position and orbit diameters in different Stereospondyls.
Taxon Skull length[mm]
distance pinealforamen–orbit [mm]
distance pineal foramenorbit / skull length
maximum orbitdiameter [mm]
maximum orbit diameter /skull length
Metoposaurus 314 131 0.4171 40 0.1273
Benthosuchus 160 25 0.1562 20 0.125
Cyclotosaurus 255 30 0.1176 27 0.1058
Eocyclotosaurus 305 27 0.0885 25 0.0819
Wantzosaurus 325 64 0.1969 47 0.1446
Edingerella 130 18 0.1384 22 0.1692
Mastodonsaurus 520 116 0.2230 1190 0.2288
Data extracted from published specimens for each taxon: Metoposaurus [48]; Benthosuchus, Cyclotosaurus and Eocyclotosaurus [33]; Wantzosaurus[35]; Edingerella [22]; Mastodonsaurus [36].
doi:10.1371/journal.pone.0131320.t001
Fig 4. Variables S and h used in the parameterization.Dorsal and ventral views of the skull model ofEdingerella madagascariensis with the points where the Von Mises Stress was recorded for a bilateral biteand a skull-raising system analysis. See text for abbreviations.
doi:10.1371/journal.pone.0131320.g004
3D Computational Mechanics of Early Amphibians
PLOS ONE | DOI:10.1371/journal.pone.0131320 June 24, 2015 6 / 23

Von Mises stress distribution was recorded because, according to [37], the Von Mises crite-rion is the most used in the cortical bone when isotropic material properties are assumed.Stress data were recorded for different parts of the skull (Fig 4). These were: a) the joint pointbetween the parietals and postparietals (PPP), b) the Pineal Foramen (PF), c) the cheek area, inthe triple suture joint of the squamosal, supratemporal and postorbital (SSP), d) in the middlearea along the nasals suture (NS), e) the middle point of the Parasphenoid (PPH), f) the poste-rior area of the Cultriform process (CP) and g) the central area of the vomer (CV).
Correlation of the parametersIn order to deeply understand the behaviour of the PA in terms of the results obtained, a corre-lation between the stress values at the recorded points and the size of the orbit (S) or distance(h) was developed.
We adjusted an Ordinary Least Squares (OLS) regression, because in this model the responsevariables are random, whereas the predictor variable represents fixed values chosen by theresearchers [38], as in the present case. Therefore, S and h were considered as the predictor var-iable and the stress values at each recorded point were the response variables. Homoscedasticityof residuals was checked using the Breusch-Pagan statistic, a test for heteroscedasticity, i.e. non-stationary variance of residuals [39]. Heteroscedasticity is present when the size of the errorterm differs across values of an independent variable. Lack of homoscedasticity strongly violatesthe assumptions of the regression model, so the statistics derived from it are not reliable. Tomeasure the proportion of the total variation in the stress values that is explained by its linearrelationship with the predictor variable (S or h), the coefficient of determination (r2) was used.These analyses were developed using PAST v. 3.04.
Other correlation coefficients have been developed to be more robust than the Pearson cor-relation and more responsive to nonlinear relationships [40]. Spearman's rank correlation coef-ficient is a nonparametric measure of mathematical dependence between two variables.Therefore, Spearman's rank correlation coefficient was also used to assess the correlationbetween those variables where a non-linear relationship was suspected.
Multivariate AnalysisThe skull is a single structure and it was interesting to analyse the response of its stress levels atthe different points in a multivariate manner. To achieve this goal, we developed PrincipalComponents Analyses (PCAs) for each of the analysed cases.
The Principal Components Analysis enables the reduction of the dimensionality of the data,as well as revealing patterns that cannot be found by analysing each variable separately. Ittransforms the original variables into a new set of uncorrelated variables called Principal Com-ponents (PC). The simplest way to understand PCA is in terms of axis rotation. PCA can beviewed as a rotation of the principal axis, so that the new axis explains as much of the varianceas possible, with the second PC being orthogonal to it (Quinn and Keough, 2002). PCA can bedeveloped using covariance or correlation matrix. The covariance matrix is based on mean-centered variables and is appropriate when the variables are measured in comparable units anddifferences in variance between variables make an important contribution to interpretation, asin this case.
ResultsThe stress values of the skull for the bilateral bite and the skull-raising system were obtainedfrom FEA. The coloured maps of the displacements and Von Mises Stress are shown for the
3D Computational Mechanics of Early Amphibians
PLOS ONE | DOI:10.1371/journal.pone.0131320 June 24, 2015 7 / 23

skull model (Figs 5 and 6). Specific values were obtained on the points previously described(Fig 4).
For the bilateral loading, S1 and S2 Tables show the numerical results of Von Mises stressand displacements obtained for the parameterization of the position of the orbits (h) and thesize of the orbit (S), whereas S3 and S4 Tables show the percent differences of the values of themodified geometry respect the original geometry (S = 1 and h = 17.5 mm). S5, S6, S7 and S8Tables show the same results for the skull-raising system respectively. Figs 7 and 8 show thegraphical representation of these values.
Bilateral BiteFEA and PA. The maximum value of displacement is almost uniform and slightly varies
when the position (h) and the size proportion (S) of the orbit are changed (in most of the casesless than 5% (See S3 and S4 Tables)). There is a small increment of the differences (7% and
Fig 5. Displacements (mm) and equivalent Von Mises stresses (MPa) in bilateral bite for (a) (b) h = 2.5 mm, h = 17.5 mm and h = 40mm and (c) (d)S = 0.125, S = 1 and S = 1.625.
doi:10.1371/journal.pone.0131320.g005
3D Computational Mechanics of Early Amphibians
PLOS ONE | DOI:10.1371/journal.pone.0131320 June 24, 2015 8 / 23

10%) on the values of displacement when the size (S) of the orbit is extremally big. Modifyingthe position (h) and size (S) of the orbits does not affect the distribution of the displacementson the skull (Fig 5) and the location of the maximum value. Regarding the displacements, thehighest values were located in the cheek region of the skull.
The Von Mises stress peaked around the otic notch in all the cases (Fig 5), thus not depend-ing on the size and position of the orbits. In the parameterization of the orbit position, stressdifferences are only present on the skull roof, showing that stress decreases on the posteriorpart of the skull and increases on the interorbital area when the orbits are placed on an anteriorposition. In the case of the size proportion of the orbit, stress differences between the differentcases show that the magnification of orbit size causes higher stress levels in the interorbitalregion. However, it should be noted that these stress differences related to orbit position andsize proportion are quantitatively low. The differences of Von Mises stress in the defined pointsof the skull (S3 and S4 Tables) reveal that most of the areas are not suffering important varia-tions when variables h and S are changed. In general, only the Von Mises stress recorded in
Fig 6. Displacements (mm) and equivalent Von Mises stresses (MPa) under a skull raising loading for (a) (b) h = 2.5 mm, h = 17.5 mm and h = 40mm and (c) (d) S = 0.125, S = 1 and S = 1.625.
doi:10.1371/journal.pone.0131320.g006
3D Computational Mechanics of Early Amphibians
PLOS ONE | DOI:10.1371/journal.pone.0131320 June 24, 2015 9 / 23

3D Computational Mechanics of Early Amphibians
PLOS ONE | DOI:10.1371/journal.pone.0131320 June 24, 2015 10 / 23

Pineal Foramen (PF), Cultriform Process (CP) and at the triple suture joint of the squamosal,supratemporal and postorbital (SSP) present important differences for the bilateral bite whenthe orbits are placed on a posterior position: very close to the Pineal Foramen (the differencesincrease up to 20%). We want to emphasise the values obtained in the Pineal Foramen (PF)that can rise up to the 50% when the position of the orbits are close to the posterior part of theskull. When the orbits are far from the Pineal Foramen (PF), in the central area of the vomer(CV) and the posterior part of the cultriform process (CP), the percent differences increase upto 10%. When the orbits are placed on the maximum posterior extreme case (h = 2.5), theresults obtained around the middle point of the Parasphenoid (PPH) and the joint pointbetween the parietals and postparietals (PPP), the stress increases only up to 5%. According toS3 and S4 Tables, the changes in the values obtained in the middle area along the nasals suture(NS), the joint between the parietals and the postparietals (PPP) and the middle point of theparasphenoid (PPH) are always less than a 5% of the value for the original shape (h = 17.5 mmand S = 1).
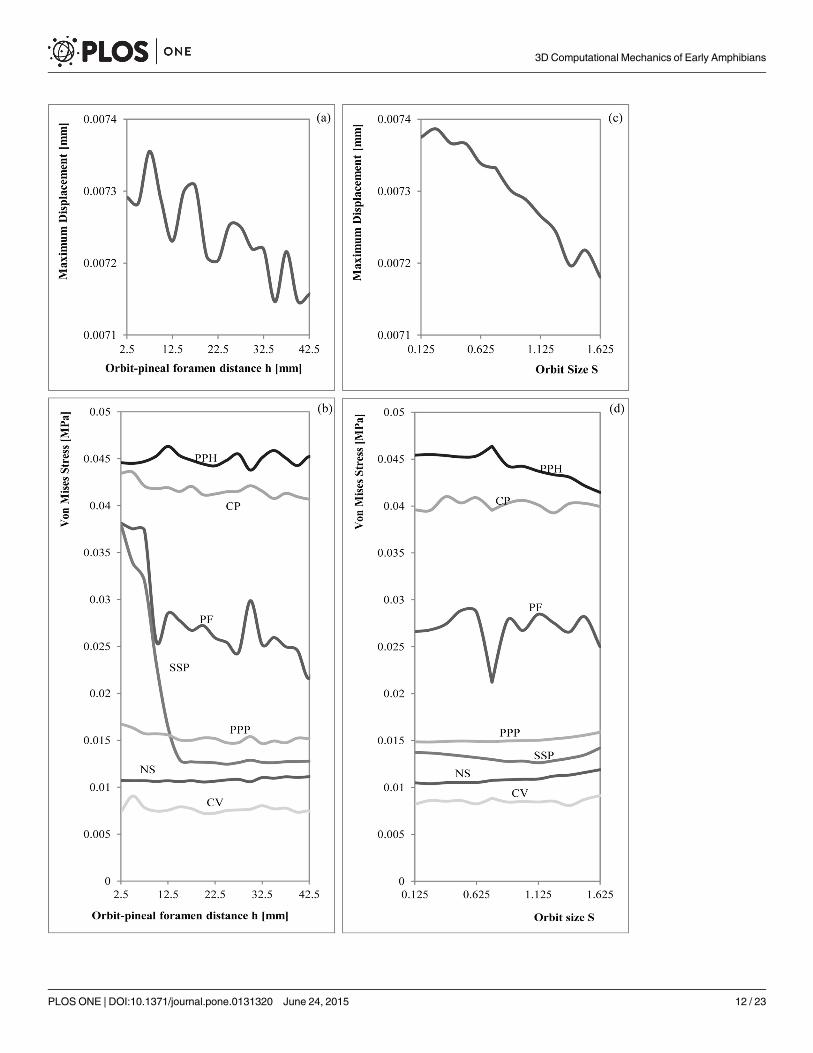
Correlation. During bilateral bite, all the regressions with the size proportion of the orbit(S) were significant (S9 Table). Despite this, the maximum displacement, the triple suture jointof the squamosal, supratemporal and postorbital (SSP) and the cultriform process (CP), havereally low slopes, indicating that, although correlated, changes in the orbit size have a smallimpact on the changes in stress values. On the other hand, the joint point between the parietalsand postparietals (PPP) and the middle point of the parasphenoid (PPH) have larger positivevalues, meaning that larger orbits produce larger stress values at those points, while the oppo-site occurs at the central area of the vomer (CV) and at the nasals sutures (NS) (stress valuesare smaller when the orbit increases in size). Finally, the Pineal Foramen (PF) lacked homosce-dasticity of residuals, indicating that a linear regression was not an adequate fit for this data (S9Table). In any case, the Spearman coefficient for this point was low; indicating that if any corre-lation existed it was not strong (Fig 9). When the position of the orbit is changed (h), threeregressions showed heteroscedastic residuals; Cultriform Process (CP), Pineal Foramen (PF)and the maximum displacement (S9 Table). For the Cultriform process (CP) and the PinealForamen (PF), however, the Spearman correlation is high and negative (Fig 9). Despite all hav-ing a significant relationship, only two points have a slope larger than 0.01/-0.01, indicatingvariation in the stress with the parameterization of the orbit: the joint point between the parie-tals and postparietals (PPP) and the central area of the vomer (CV). It is worth mentioningthat those slopes are of the order of ten times smaller than the larger slopes when the size of theorbit was modified (S9 Table). On the other hand, the nasals suture (NS) showed a non-signifi-cant relationship.
In relation with Spearman coefficient (Fig 9), the results point out that changes on the orbitsize (S) are strongly positively correlated (although not necessarily in a linear manner) with thetriple suture joint of the squamosal, supratemporal and postorbital (SSP) and the displacement(i.e. larger orbits were associated with increased stress levels) and correlated, but to a lesserextent, with the Pineal Foramen (PF) and the middle point of the parasphenoid (PPH). On theother hand, the size of the orbit is negatively correlated (i.e. larger orbits were associated withreduced stress levels) with the nasals suture (NS) and central area of the vomer (CV). Changesin the position of the orbit (h) affected the stress levels in an opposite manner, having a highnegative correlation with the Pineal Foramen (PF) and the Cultriform Process (CP), while the
Fig 7. Graphical relationship between the Orbit-pineal foramen distance with the (a) maximum displacement and the (b) Von Mises Stresses andthe Orbit Size with the (c) maximum displacement and the (d) Von Mises Stresses under a bilateral bite.
doi:10.1371/journal.pone.0131320.g007
3D Computational Mechanics of Early Amphibians
PLOS ONE | DOI:10.1371/journal.pone.0131320 June 24, 2015 11 / 23
3D Computational Mechanics of Early Amphibians
PLOS ONE | DOI:10.1371/journal.pone.0131320 June 24, 2015 12 / 23
positive correlations are with the joint point between the parietals and postparietals (PPP) andthe central area of the vomer (CV).
Multivariate Analyses. Taking the orbit size (S) into consideration, the first PC explainsalmost all the variance (S10 Table). The Pineal Foramen (PF) is the variable that contributesthe most to the PC1 (S11 Table), therefore this axis separates orbits of small and medium sizefrom really large orbits (1.375 onwards, Fig 10(A)), with the latter having high stress at thepineal foramen. This pattern is repeated by the orbit position, with the first PC explainingmore than 90% of the variance (S10 Table), and the pineal foramen being responsible of mostof the variation in this axis (S11 Table). In this case, the stress is much reduced when the orbitis positioned at the anterior part of the skull, but values intermediate and posterior locatedhave equally high stress. A small part of the variance (6.7%) can be attributed to the centralarea of the vomer (CV) with values larger than 40 having a big stress in that area (Fig 10(B)).
Skull-raising systemFEA and PA. The value of the maximum displacement is uniform and slightly varies
when the position and the size of the orbits changes (less than 2%, see S7 and S8 Tables) and,
Fig 8. Graphical relationship between the Orbit-pineal foramen distance with the (a) maximum displacement and the (b) Von Mises Stresses andthe Orbit Size with the (c) maximum displacement and the (d) Von Mises Stresses during the skull raising.
doi:10.1371/journal.pone.0131320.g008
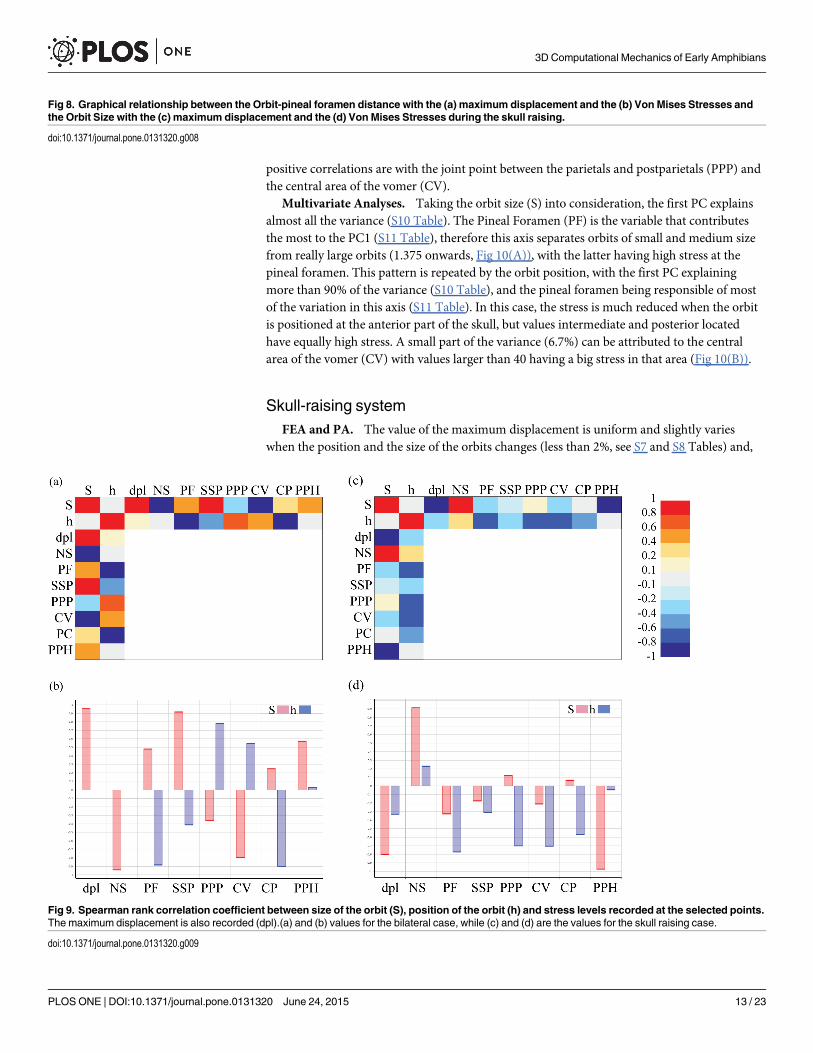
Fig 9. Spearman rank correlation coefficient between size of the orbit (S), position of the orbit (h) and stress levels recorded at the selected points.The maximum displacement is also recorded (dpl).(a) and (b) values for the bilateral case, while (c) and (d) are the values for the skull raising case.
doi:10.1371/journal.pone.0131320.g009
3D Computational Mechanics of Early Amphibians
PLOS ONE | DOI:10.1371/journal.pone.0131320 June 24, 2015 13 / 23

Fig 10. Dispersion plot of the first two PCs of the PCAs for the bilateral case.Red dots on the skulls drawing indicates areas with high stress accordingto the first PCA (i.e. variables with higher loading). a) Orbit size. b) Orbit location.
doi:10.1371/journal.pone.0131320.g010
3D Computational Mechanics of Early Amphibians
PLOS ONE | DOI:10.1371/journal.pone.0131320 June 24, 2015 14 / 23

as in the bilateral bite, the position of the maximum displacement is also the same when thesize of the orbits is varied. The maximum displacement is found on the snout, especially on itsanterior part, behaving as a cantilever beam during bending.
Stress peaks in the posterior part of the palate, in particular on the parasphenoid and exocci-pitals. Less important loadings accrue in the cultriform process (CP), and to the central part ofthe pterygoids. Considering parameterization, peak values always occur in the same areas notdepending on the size and the position of the orbits. Observing the numerical values recordedfor the Von Mises stress in the different points of the skull (S5 and S6 Tables) and the percentdifferences (S7 and S8 Tables), we noted that, most of these points not suffered important vari-ations when the parameters h (orbit position) and S (orbit size proportion) were changed. TheVon Mises stress recorded only presented significant changes in the Pineal foramen (PF) andin the triple suture joint of the squamosal, supratemporal and postorbital (SSP) for the skull-raising system when the orbits are placed in an extreme position, fairly close to the pineal fora-men. According to S7 and S8 Tables, the differences obtained in most of the points are alwaysless than a 5% of the value for the original shape (h = 18 mm and S = 1) whereas the valuesobtained in the Pineal foramen (PF) can rise up to 60% when the position of the orbits ispushed far backward. In the same way, the values in the triple suture joint of the squamosal,supratemporal and postorbital (SSP) rise to 30% when the position of the orbits is similarlyplaced to the back. Interestingly, the results also reveal (Fig 6) that when the size proportion ofthe orbits (S) is bigger or when the orbits are extremly anteriorly positioned, a notable stressconcentration appears in the interorbital region. However, this stress concentration is far fromthe higher stress values present on the parasphenoid and exoccipitals.
Correlation. Regarding the skull raising system, when S was changed, linear regressionswith the triple suture joint of the squamosal, supratemporal and postorbital (SSP) turn out tobe non-significant. Regardless of the significant results, the slopes for all the variables are sosmall that do not produce an effective change in the stress results, and the same happens whenit is the position of the orbit what changes.
Analysing the Spearman correlation coefficient (Fig 9), the nasals suture (NS) is the onlyvariable that shows larger stress values when increasing the size or the position of the orbits.Otherwise, the middle point of the parasphenoid (PPH) and the maximum displacement (dpl)have a high negative relationship with orbit size, whereas the Pineal foramen (PF), the jointsuture between the parietals and postparietals (PPP), the central area of the vomer (CV) andthe cultriform process (CP) are those more correlated (negatively) with the position of theorbits.
Multivariate analyses. For the size of the orbit, the pattern is not clear, as a large part ofthe variance is accounted by one case with high stress at the pineal foramen. If repeating thePC without the pineal foramen stress data, almost 80% of the variance is due to high stress inthe parasphenoid when the orbit grows smaller (Fig 11(A)). Regarding the location of the orbit,the PCA shows that orbits located frontally (10 and smaller, Fig 11(B)) have a high stress in thesupratemporal area, and to a lesser extent, in the pineal foramen (S11 Table). That accounts formore than 95% of variance (S10 Table).
DiscussionEarly amphibians, and in particular Temnospondyls, had different lifestyles occupying severalecological niches in aquatic, semi aquatic and terrestrial environments. The diversity of tem-nospondyls varied over time since their origin in the Carboniferous, but of special interest isthe increased diversity just after the End-Permian mass extinction [41,42]. In particular,Stereospondyls radiated after this event, possibly in relation to the extinction of basal
3D Computational Mechanics of Early Amphibians
PLOS ONE | DOI:10.1371/journal.pone.0131320 June 24, 2015 15 / 23
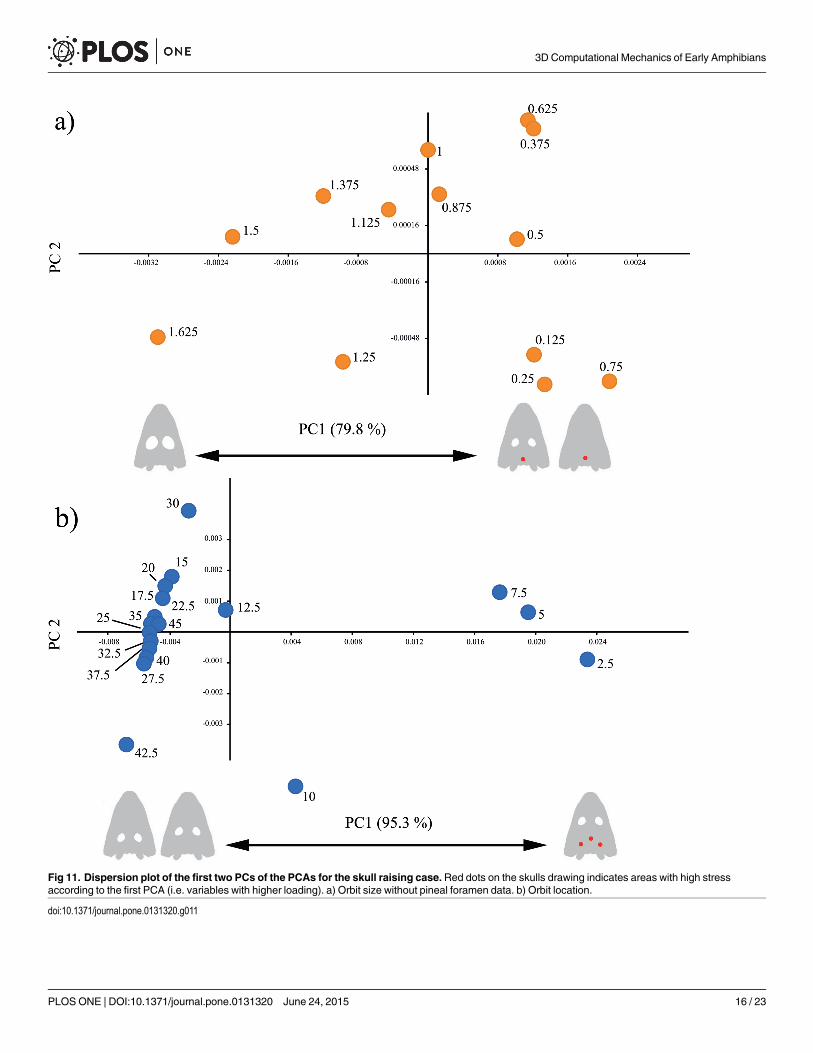
Fig 11. Dispersion plot of the first two PCs of the PCAs for the skull raising case.Red dots on the skulls drawing indicates areas with high stressaccording to the first PCA (i.e. variables with higher loading). a) Orbit size without pineal foramen data. b) Orbit location.
doi:10.1371/journal.pone.0131320.g011
3D Computational Mechanics of Early Amphibians
PLOS ONE | DOI:10.1371/journal.pone.0131320 June 24, 2015 16 / 23

archegosauriforms [43]. The skull evolution from the ancestral semi-aquatic stem-stereospon-dyls such as Capetus and Palatinerpeton, with short tooth-rows and fang pairs on the vomers,palatines and ectopterygoids [19], varied in the different clades of stereospondyls. Orbit posi-tion and size were two of the most variable morphological characters.
FEA and PA analysis developed in this work revealed that changes in the size and positionof the orbit in most cases did not affect stress distribution during bilateral biting. The higheststresses were found around the otic notch and posterior part of the skull. In the case of skullraising, stress distribution was independent of changes in orbit size or position. In this case, thestress concentrated on the posterior part of the skull (e.g. parasphenoid) and occipital area (e.g.exoccipital) but also with lesser importance in the cultriform area. On the other hand, whenthere is a relationship between the orbit size and location and the stress pattern (Figs 10 and11), it affects non vital areas such as the pineal foramen. All these results strongly support thehypothesis of an important mechanical plasticity in the stereospondyl skull, which allowedthem to achieve their ecomorphological diversity, especially during the Triassic period, inclades such as lydekkerinids, trematosaurs, capitosaurs or metoposaurs. More important, con-sidering the constructional morphology model [44], the results obtained in this work open thepossibility to shed new light on the historical, functional and structural constraints of theseearly amphibians.
Stereospondyls probably used a bilateral bite due to the absence of a secondary palate andwere less optimized to resist both bending and torsional forces during biting than other verte-brates [9]. Regarding taxa with oversized orbits, it should be considered that these oversizedorbits were only found in in gigantic sized stereospondyls (e.g.Mastodonsaurus, Eryosuchus).In many vertebrates, large taxa tend to have larger bite forces due to muscle and jaw size. InStereospondyls the possession of big orbits may be related to gigantism as in these forms thestress patterns do not affect (or slightly affect) the feeding strategy of these predators due totheir size. However, future analysis should include gigantic specimens to assess this issue withconfidence. Considering the position of the orbits, its ancestral position was probably similarto basal capitosaurs (as E.madagascariensis), as it is known for actinodontids and rhinesuchids.In agreement with FEA results, changes in orbit position slightly affect the results, but mayreflect that a posterior positioning of the orbits was less optimal due to the stress suffered in thebraincase region and some palate structures (such as the cultriform process). On the contrary,its positioning to a more anterior placement, as slightly present in trematosaurs or in extremecase in metoposaurs, reduced stress distribution in the braincase region although increased itin the interorbital region. Moreover, the results suggest that the great diversity of orbit charac-ters in Stereospondyls could only be constrained when the orbits were extremely posteriorpositioned (as the stress increases) and is in agreement with the fossil record, as to date no taxais known with these extreme morphological character. In a similar way, oversized orbits couldbe constrained but may be related to other features (as gigantism) for the viability of this char-acter, as also found in the fossil record.
Trematosaurs were most probably active fish eaters found in fluvial but also brackish envi-ronments and possibly their orbit position allowed better catching precision of prey. On theother hand, metoposaurs may obtain an ecological and niche differentiation in the Late Triassicecosystems (with usual presence of the broad snout cyclotosaur capitosaurids and the slender-snouted phytosaurs) due to the mechanical plasticity of the stereospondyli skull with posteri-orly positioned orbits with few (or no) structural consequences. During skull raising, stressconcentrated at the most posterior part of the skull, interestingly also affecting the cultriformprocess, although less importantly. The presence of low levels of stress in the cultriform processduring the skull raising while no stress is present in this structure during biting was of particu-lar interest because these amphibians did not present a secondary palate (as present in
3D Computational Mechanics of Early Amphibians
PLOS ONE | DOI:10.1371/journal.pone.0131320 June 24, 2015 17 / 23
archosaurs with important biomechanical implications). This is indicative of the biomechani-cal role of the cultriform process during feeding and raising skull, and future studies arerequired to analyse this structure. The morphology and thickness of the cultriform process var-ies throughout the different clades of temnospondyls, and future studies on different cladesshould analyse the biomechanical role of this structure.
Considering the parameterization during skull raising, possessing big sized orbits or havingthem in an anterior position implied an increased stress on the interorbital region. However,the correlation between orbit size and the stress found in the nasal region could partiallyexplain the nares sizes and morphology, as well as the presence of sympheseal tusks, to decreaseand to dissipate the stress generated during skull raising. Similarly, the correlation betweenorbit size and stress found in the parasphenoid region suggest that big sized orbits might reducestress on the braincase region.
After the End-Permian mass extinction, the freshwater terrestrial ecosystems were re-con-quered by different survivor groups. During the Early Triassic, trematosaurs replaced thePermian archegosaurs with similar ecomorphological appearance and antero-positioned orbitsprobably as active fish hunters living in fluvial and brackish environments [9]. This groupdecreased during the Middle Triassic, being relictual until the Late Triassic-Jurassic [45,46].Other Stereospondyls were present also in the Early Triassic terrestrial environments, such asthe rhytidosteideids, lydekkerinids and capitosaurs, being aquatic or semi-aquatic animals.Lydekkerinids and capitosaurs were probably also active predators with a probably wider rangeof prey in comparison with trematosaurs. Of special interest, capitosaurs radiated specially dur-ing the Middle Triassic acquiring some taxa gigantic sizes with the presence of taxa with bigsized orbits (such as Eryosuchus orMastodonsaurus). Interestingly, during the late Middle Tri-assic the first members of the metoposaurid group appeared as the case of Callistomordaxkugleri from the late Ladinian of Germany. Metoposaurs were members of the trematosauroidclade (see [47] for discussion) and presented antero-positioned orbits with a broad snout mor-phology in comparison with the slender snouts of trematosaurs. Metoposaurs radiated espe-cially during the Late Triassic with extreme anteropositioned orbits as found in Apachesaurus,Dutuitosaurus,Metoposaurus or Buettneria from Europe, Africa and North America [19].Other broad-snouted stereospondyls typically also lived in these Late Triassic terrestrialecosystems, with special dominance of the capitosaur genus Cyclotosaurus, while the slender-snouted animals from these ecosystems were the archosaur group of phytosaurs. In this eco-system scheme, the ecomorphological disparity between the broad-snouted stereospondylsand the slender-snouted phytosaurs is very clear, while within the broad-snouted stereospon-dyls the orbit characters, in particular orbit position, played a key role in the ecology of thesetwo predators; while capitosaur taxa were most probably active predators for a significantrange of prey, the metoposaurs were probably less active and sit-wait predators. At the end ofthe Late Triassic, this ecosystem scheme changed due to the radiation and dominance of someneosuchian groups replacing the stereospondyls causing the dissapareance or decrease ofthese anamniotes.
ConclusionIn conclusion, the characterization of the orbit parameters enabled to explore their biomechan-ical role but portioning the ecological niche of different Stereospondyls groups. Joining FEAand PA to analyse orbits parameters reveal that under bilateral biting and skull raising themechanical capabilities of these predators did not suffer many changes. In the light of theresults, orbit position and size did not constrain the diversity of the group and the great plastic-ity known for fossil record of Stereospondyls could be at least partially explained by the little
3D Computational Mechanics of Early Amphibians
PLOS ONE | DOI:10.1371/journal.pone.0131320 June 24, 2015 18 / 23
influence of orbit size or position in most cases. In extreme cases, the possession of very bigsized orbits is potentially related to acquiring gigantic body sizes in these taxa. In the case ofextremely anterior positioned orbits, these structural changes imply a reduction of stress to thebraincase region. During the Triassic period, different groups as trematosaurs, lyddekerinids,capitosaurs or metoposaurs evolved taking advantage of the empty niches after the End- Perm-ian mass extinction and diversified in the terrestrial environments thanks to the great plasticityas demonstrated for the orbit characters, with an important role in the ecological niche differ-entiation and feeding habits.
The mixing of PA and FEA to evaluate mechanical capabilities of biological structures isnovel in vertebrate palaeontology and the results herein reported demonstrate its potential toreproduce these analyses in other enigmatic or complex structures that could be analysed withthese techniques.
Supporting InformationS1 Document. Testing the influence of Adductor Mandibulae Internus (AMI).(DOCX)
S2 Document. Testing the influence of the slenderness.(DOCX)
S1 Fig. Loadings and boundary conditions on the skull model for the bilateral bite in bothextreme cases with AMI (S = 1.625 and h = 2.5 mm).(TIF)
S2 Fig. Displacements (mm) and equivalent Von Mises stresses (MPa) in bilateral bite for(a) (b) h = 2.5 mm and (c) (d) S = 1.625 with the inclusion of AMI and in bilateral bite for(e) (f) h = 2.5 mm and (g) (h) S = 1.625 without the inclusion of AMI.(TIF)
S3 Fig. Displacements (mm) and equivalent Von Mises stresses (MPa) in bilateral bite for(a) (b) h = 2.5 mm, h = 17.5 mm and h = 40 mm and (c) (d) S = 0.125, S = 1 and S = 1.625for the long-slender snouted morphotype.(TIF)
S4 Fig. Displacements (mm) and equivalent Von Mises stresses (MPa) under a skull raisingloading for (a) (b) h = 2.5 mm, h = 17.5 mm and h = 40 mm and (c) (d) S = 0.125, S = 1 andS = 1.625 for the long-slender snouted morphotype.(TIF)
S5 Fig. Displacements (mm) and equivalent Von Mises stresses (MPa) in bilateral bite for(a) (b) h = 2.5 mm, h = 17.5 mm and h = 40 mm and (c) (d) S = 0.125, S = 1 and S = 1.625for the broad skull and short-snouted morphotype.(TIF)
S6 Fig. Displacements (mm) and equivalent Von Mises stresses (MPa) under a skull raisingloading for (a) (b) h = 2.5 mm, h = 17.5 mm and h = 40 mm and (c) (d) S = 0.125, S = 1 andS = 1.625 for the broad skull and short-snouted morphotype.(TIF)
S1 Table. Von Mises stress and displacements obtained for the parameterization of theposition of the orbits (h) under a bilateral bite.(DOCX)
3D Computational Mechanics of Early Amphibians
PLOS ONE | DOI:10.1371/journal.pone.0131320 June 24, 2015 19 / 23
S2 Table. Von Mises stress and displacements obtained for the parameterization of the sizeof the orbit (S) under a bilateral bite.(DOCX)
S3 Table. Percent differences of Von Mises stress and displacements obtained for theparameterization of the position of the orbits (h) under a bilateral bite in relationship itsoriginal position (h = 17.5 mm).(DOCX)
S4 Table. Percent differences of Von Mises stress and displacements obtained for theparameterization of the size of the orbits (S) under a bilateral bite in relationship with theoriginal size of the orbits (S = 1).(DOCX)
S5 Table. Von Mises stress and displacements obtained for the parameterization of theposition of the orbit (h) during the skull-raising loading.(DOCX)
S6 Table. Von Mises stress and displacements obtained for the parameterization of the sizeof the orbit (S) during the skull-raising loading.(DOCX)
S7 Table. Percent differences of Von Mises Stress and displacements obtained for theparameterization of the position of the orbits (h) during the skull-raising loading in rela-tionship with its original position (h = 17.5 mm).(DOCX)
S8 Table. Percent differences of Von Mises Stress and displacements obtained for theparameterization of the size of the orbit (S) during the skull-raising loading in relationshipwith the original size of the orbits (S = 1).(DOCX)
S9 Table. Statistics of the OLS regression between orbit size and location and the stress var-iables and displacement.(DOCX)
S10 Table. Percent of explained variable for each PC at the different PCAs developed inthis work.(DOCX)
S11 Table. Loadings of the original variables for each PC at the different PCAs developedin this work.(DOCX)
AcknowledgmentsThe authors want to thank Ronan Allain (MNHN) for the loan, Hospital Mútua de Terrassafor the CT scanning of Edingerella, and Dr. J. Sébastien Steyer (CNRS-MNHN), Mikhail A.Shishkin (PIN) for their comments in order to improve the content of the manuscript. NuskaCorrià-Ainslie is aknowledged for his help in the english revision. This research received sup-port from the SYNTHESYS Project FR-TAF-3353 to J.F. http://www.synthesys.info/ which isfinanced by European Community Research Infrastructure Action under the FP7 "Capacities"Program. Reviews of two anonymous reviewers and from the editor, Pasquale Raia, greatlyimproved the previous version of this manuscript.
3D Computational Mechanics of Early Amphibians
PLOS ONE | DOI:10.1371/journal.pone.0131320 June 24, 2015 20 / 23

Author ContributionsConceived and designed the experiments: JM JF SDETMS LG AG. Performed the experiments:JM JF. Analyzed the data: JM JF SDET. Contributed reagents/materials/analysis tools: JM JFSDET MS LG AG. Wrote the paper: JM JF.
References1. Zienkiewicz O. The Finite Element Method in Engineering Science. Finite Element Methods In Engi-
neering Science. McGraw-Hill; 1971. pp. 98–359.
2. Rayfield EJ. Finite Element Analysis and Understanding the Biomechanics and Evolution of Living andFossil Organisms. Annu Rev Earth Planet Sci. 2007; 35: 541–576. doi: 10.1146/annurev.earth.35.031306.140104
3. Cox PG, Fagan MJ, Rayfield EJ, Jeffery N. Finite element modelling of squirrel, guinea pig and ratskulls: using geometric morphometrics to assess sensitivity. J Anat. 2011; 219: 696–709. doi: 10.1111/j.1469-7580.2011.01436.x PMID: 21974720
4. McHenry CR, Wroe S, Clausen PD, Moreno K, Cunningham E. Supermodeled sabercat, predatorybehavior in Smilodon fatalis revealed by high-resolution 3D computer simulation. Proc Natl Acad Sci US A. 2007; 104: 16010–5. doi: 10.1073/pnas.0706086104 PMID: 17911253
5. Kupczik K, Dobson CA, Fagan MJ, Crompton RH, Oxnard CE, O’Higgins P. Assessing mechanicalfunction of the zygomatic region in macaques: validation and sensitivity testing of finite element models.J Anat. 2007; 210: 41–53. doi: 10.1111/j.1469-7580.2006.00662.x PMID: 17229282
6. Tseng ZJ, McNitt-Gray JL, Flashner H, Wang X, Enciso R. Model Sensitivity and Use of the Compara-tive Finite Element Method in Mammalian JawMechanics: Mandible Performance in the GrayWolf.PLoS One. 2011; 6: 12. doi: 10.1371/journal.pone.0019171
7. Walmsley CW, McCurry MR, Clausen PD, McHenry CR. Beware the black box: investigating the sensi-tivity of FEA simulations to modelling factors in comparative biomechanics. PeerJ. 2013; 1: e204. doi:10.7717/peerj.204 PMID: 24255817
8. Piras P, Maiorino L, Teresi L, Meloro C, Lucci F, Kotsakis T, et al. Bite of the cats: relationships betweenfunctional integration and mechanical performance as revealed by mandible geometry. Syst Biol. 2013;62: 878–900. doi: 10.1093/sysbio/syt053 PMID: 23925509
9. Fortuny J, Marcé-Nogué J, De Esteban-Trivigno S, Gil L, Galobart À. Temnospondyli bite club: ecomor-phological patterns of the most diverse group of early tetrapods. J Evol Biol. 2011; 24: 2040–54. doi:10.1111/j.1420-9101.2011.02338.x PMID: 21707813
10. Fortuny J, Marcé-Nogué J, Gil L, Galobart À. Skull mechanics and the evolutionary patterns of the oticnotch closure in capitosaurs (Amphibia: Temnospondyli). Anat Rec (Hoboken). 2012; 295: 1134–46.doi: 10.1002/ar.22486
11. Warren A. Secondarily aquatic temnospondyls of the Upper Permian and Mesozoic. In: Carroll HH&RL, editor. Amphibian Biology. Beatty & Sons; 2000. pp. 1121–1149.
12. Schoch RR. Life cycles, plasticity and palaeoecology in temnospondyl amphibians. Smith A, editor.Palaeontology. 2014; 57: 517–529. doi: 10.1111/pala.12100
13. Schoch RR. Amphibian Evolution: The Life of Early Land Vertebrates. New Jersey: Wiley-Blackwell;2014.
14. Witzmann F. Cranial morphology and ontogeny of the Permo-Carboniferous temnospondyl Archego-saurus decheni Goldfuss, 1847 from the Saar–Nahe Basin, Germany. Trans R Soc Edinb Earth Sci.2006; 96: 131–162. doi: 10.1017/S0263593300001279
15. Erickson GM, Gignac PM, Steppan SJ, Lappin AK, Vliet KA, Brueggen JD, et al. Insights into the ecol-ogy and evolutionary success of crocodilians revealed through bite-force and tooth-pressure experi-mentation. PLoS One. 2012; 7: e31781. doi: 10.1371/journal.pone.0031781 PMID: 22431965
16. Walmsley CW, Smits PD, Quayle MR, McCurry MR, Richards HS, Oldfield CC, et al. Why the LongFace? The Mechanics of Mandibular Symphysis Proportions in Crocodiles. PLoS One. 2013; 8:e53873. doi: 10.1371/journal.pone.0053873 PMID: 23342027
17. Piras P, Buscalioni AD, Teresi L, Raia P, Sansalone G, Kotsakis T, et al. Morphological integration andfunctional modularity in the crocodilian skull. Integr Zool. 2014; 9: 498–516. doi: 10.1111/1749-4877.12062 PMID: 25236418
18. Busbey AB. The structural consequences of skull flattening in crocodilians. In: Thomason JJ, editor.Functional Morphology in Vertebrate Paleontology. Cambridge: Cambridge University Press;1995. pp. 173–192.
3D Computational Mechanics of Early Amphibians
PLOS ONE | DOI:10.1371/journal.pone.0131320 June 24, 2015 21 / 23
19. Schoch RR, Milner A. Stereospondyli. In: Wellnhofer P, editor. Encyclopedia of Paleoherpetology 3B.München: Dr. Friedrich Pfiel; 2000. pp. 1–204.
20. Steyer JS. A revision of the early Triassic “capitosaurs” (Stegocephali, Stereospondyli) fromMadagas-car, with remarks on their comparative ontogeny. Journal of Vertebrate Paleontology. 2003. pp. 544–555. doi: 10.1671/1740
21. Fortuny J, Galobart À, De Santisteban C. A New Capitosaur from the Middle Triassic of Spain and theRelationships within the Capitosauria. Acta Palaeontol Pol. 2011; 56: 553–566. doi: 10.4202/app.2010.0025
22. Maganuco S, Steyer JS, Pasini G, Bénéteau M, Lorrain S, Bénéteau A, et al. An exquisite specimen of“Edingerella Madagascariensis”(Temnospondyli) from the Lower Triassic of NWMadagascar: CranialAnatomy, Phylogeny, and Restorations. Mem Soc Ital Sci Nat Mus Civ Stor Nat Milano. 2009; XXXVI:1–72.
23. Marcé-Nogué J, Fortuny J, Gil L, Galobart À. Using Reverse Engineering to Reconstruct TetrapodSkulls and Analyse its Feeding Behaviour. Proc Thirteen Int Conf Civil, Struct Environ Eng Comput.Civil-Comp Press; 2011;
24. Schoch RR. The neurocranium of the stereospondyl Mastodonsaurus giganteus. Palaeontology. 2002;45: 627–645.
25. Dutuit J-M. Introduction à l’étude paléontologique du Trias continental marocain : description des pre-miers Stégocéphales recueillis dans le couloir d'Argana (Atlas occidental). Paris: Éditions du Muséum;1976.
26. Bystrow AP, Efremov JA. Benthosuchus sushkini Efr., a labyrinthodont from the Eotriassic of Sharz-henga River. Trav l’Institut Paleontol Acad des Sci l'URSS. 1940; 10: 1–152.
27. Carroll R, Holmes R. The skull and jaw musculature as guides to the ancestry of salamanders. Zool JLinn Soc. 1980;
28. Witzmann F, Schoch RR. Reconstruction of cranial and hyobranchial muscles in the Triassic temnos-pondyl Gerrothorax provides evidence for akinetic suction feeding. J Morphol. 2013; 274: 525–42. doi:10.1002/jmor.20113 PMID: 23280767
29. Alexander RM. Exploring biomechanics animals in motion R. McNeill Alexander. New York ScientificAmerican Library Distributed byW.H. Freeman; 1992.
30. Gil L, Marcé-Nogué J, Sánchez M. Insights into the controversy over materials data for the comparisonof biomechanical performance in vertebrates. Palaeontol Electron. 2015; in press.
31. Currey JD. The evolution of the mechanical properties of amniote bone. J Biomech. Elsevier; 1987; 20:1035–1044.
32. Marcé-Nogué J, Fortuny J, Gil L, Sánchez M. Improving mesh generation in Finite Element Analysis forfunctional morphology approaches. Spanish J Palaeontol. 2015;in press.
33. Damiani RJ. A systematic revision and phylogenetic analysis of Triassic mastodonsauroids (Temnos-pondyli: Stereospondyli). Zool J Linn Soc. 2001; 379–482. doi: 10.1006/zjls.2001.0304
34. Sulej T, Majer D. The temnospondyl amphibian Cyclotosaurus from the Upper Triassic of Poland.Palaeontology. 2005; 48: 157–170.
35. Steyer JS. The first articulated trematosaur “amphibian”from the Lower Triassic of Madagascar: impli-cations for the phylogeny of the group. Palaeontology. 2002; 45: 771–793.
36. Schoch RR. Comparitive osteology of Mastodonsaurus giganteus from the Middle Triassic of Germany.Stuttgarter Beiträge zur Naturkunde, Stuttgart. 1999; 1–175.
37. Doblaré M, García JM, Gómez MJ. Modelling bone tissue fracture and healing: a review*1. Eng FractMech. 2004; 71: 1809–1840. doi: 10.1016/j.engfracmech.2003.08.003
38. Quinn G, Keough M. Experimental design and data analysis for biologists. Cambridge Univ Press;2002.
39. HammerØ, Harper DAT, Ryan PD. Paleontological statistics software package for education and dataanalysis. Palaeontol Electron. 2001; 4: 9–18. doi: 10.1016/j.bcp.2008.05.025
40. Croxton FE, Cowden DJ, Klein S. Applied General Statistics. Pitman; 1968. p. 650.
41. Ruta M, Benton MJ. Calibrated diversity, tree topology and the mother of mass extinctions: The lessonof temnospondyls. Palaeontology. 2008; 51: 1261–1288. doi: 10.1111/j.1475-4983.2008.00808.x
42. Benton MJ, Ruta M, Dunhill AM, Sakamoto M. The first half of tetrapod evolution, sampling proxies, andfossil record quality. Palaeogeogr Palaeoclimatol Palaeoecol. 2013; 372: 18–41. doi: 10.1016/j.palaeo.2012.09.005
43. Stayton CT, Ruta M. Gometric orphometrics of the skull roof of Stereospondyls (Amphibia: Temnospo-nyli). Palaeontology. 2006; 49: 307–337. doi: 10.1111/j.1475-4983.2006.00523.x
3D Computational Mechanics of Early Amphibians
PLOS ONE | DOI:10.1371/journal.pone.0131320 June 24, 2015 22 / 23

44. Seilacher A. Arbeitskonzept zur konstruktions-morphologie. Lethaia. 1970; 3: 393–396.
45. Schoch RR, Milner A, Hellrung H. The last trematosaurid amphibian Hyperokynodon keuperinus revis-ited. Geol und Paläontologie. 2002; 1–9.
46. Maisch MW, Matzke AT, Sun G. A relict trematosauroid (Amphibia: Temnospondyli) from the MiddleJurassic of the Junggar Basin (NWChina). Naturwissenschaften. 2004; 91: 589–593. doi: 10.1007/s00114-004-0569-x PMID: 15448923
47. Schoch RR. A new stereospondyl from the GermanMiddle Triassic, and the origin of the Metoposauri-dae. Zool J Linn Soc. 2008; 152: 79–113. doi: 10.1111/j.1096-3642.2007.00363.x
48. Sulej T. Osteology, variability, and evolution of Metoposaurus, a temnospondyl from the Late Triassicof Poland. Palaeontol Pol. 2007; 64: 29–139.
3D Computational Mechanics of Early Amphibians
PLOS ONE | DOI:10.1371/journal.pone.0131320 June 24, 2015 23 / 23