Research: Reverse Osmosis Effects of Sap Concentration with Reverse Osmosis … · 2019-03-16 ·...
18
October 2015 11 C oncentrating maple sap with re- verse osmosis (RO) significantly increases the efficiency and prof- itability of processing sap into syrup by reducing the amount of both fuel and time required to concentrate the mate- rial to syrup density in the evaporator. However, because this also reduces the amount of time sap is processed in the evaporator, and since most of the reac- tions from which the flavor and color properties of maple syrup are ultimate- ly derived occur as sap is processed with heat in the evaporator, it is pos- sible that this could result in impacts on the finished syrup, causing it to differ from syrup produced with raw sap. Previous investigations of the effects of RO were limited to small quantities of syrup produced through batch boiling in the laboratory, conditions which do not necessarily well replicate those that occur during processing in an evapo- rator (Morselli et al. 1982, Sendak and Morselli 1984). It is imperative to de- termine the effects that RO might have under realistic processing conditions, as any gains in efficiency would be nullified by any possible negative im- pacts on syrup quality. Thus, between 2008 and 2011 we conducted a series of controlled experiments performed with commercial maple equipment to investigate the potential effects of the use of RO on the composition, proper- ties, and flavor of the maple syrup pro- duced. The following is a brief, general summary of these experiments and the results observed. More comprehensive descriptions of each study can be found in the scientific journal articles pub- lished for each. All experiments were conducted in the Maple Processing Research Facility at the University (MPRF) of Vermont Proctor Maple Research Center in Un- derhill Center, Vermont (UVM-PMRC) (Figure 1). Experiment 1 – Comparison of syrup made from raw sap and 8% concen- trate This experiment was conducted to investigate the fundamental effects of concentrating sap with RO on the prop- erties, composition, and flavor of maple syrup, and to determine if any signifi- cant differences exist in syrup made from raw and concentrated sap. To accomplish this, we conducted an ex- periment in which syrup was produced simultaneously from raw sap and from Research: Reverse Osmosis Effects of Sap Concentration with Reverse Osmosis on Syrup Composition and Flavor A summary of experiments conducted at the University of Vermont Proctor Maple Research Center Abby van den Berg, Timothy Perkins, Mark Isselhardt University of Vermont, Proctor Maple Research Center Mary An Godshall Sugar Processing Research Institute, Inc. Steven Lloyd United States Department of Agriculture Agricultural Research Service, Southern Regional Research Center Reverse Osmosis: continued on page 12
Transcript of Research: Reverse Osmosis Effects of Sap Concentration with Reverse Osmosis … · 2019-03-16 ·...
October 2015 11
Concentrating maple sap with re-verse osmosis (RO) significantly increases the efficiency and prof-
itability of processing sap into syrup by reducing the amount of both fuel and time required to concentrate the mate-rial to syrup density in the evaporator. However, because this also reduces the amount of time sap is processed in the evaporator, and since most of the reac-tions from which the flavor and color properties of maple syrup are ultimate-ly derived occur as sap is processed with heat in the evaporator, it is pos-sible that this could result in impacts on the finished syrup, causing it to differ from syrup produced with raw sap. Previous investigations of the effects of RO were limited to small quantities of syrup produced through batch boiling in the laboratory, conditions which do not necessarily well replicate those that occur during processing in an evapo-rator (Morselli et al. 1982, Sendak and Morselli 1984). It is imperative to de-termine the effects that RO might have under realistic processing conditions, as any gains in efficiency would be nullified by any possible negative im-pacts on syrup quality. Thus, between 2008 and 2011 we conducted a series of controlled experiments performed
with commercial maple equipment to investigate the potential effects of the use of RO on the composition, proper-ties, and flavor of the maple syrup pro-duced. The following is a brief, general summary of these experiments and the results observed. More comprehensive descriptions of each study can be found in the scientific journal articles pub-lished for each.
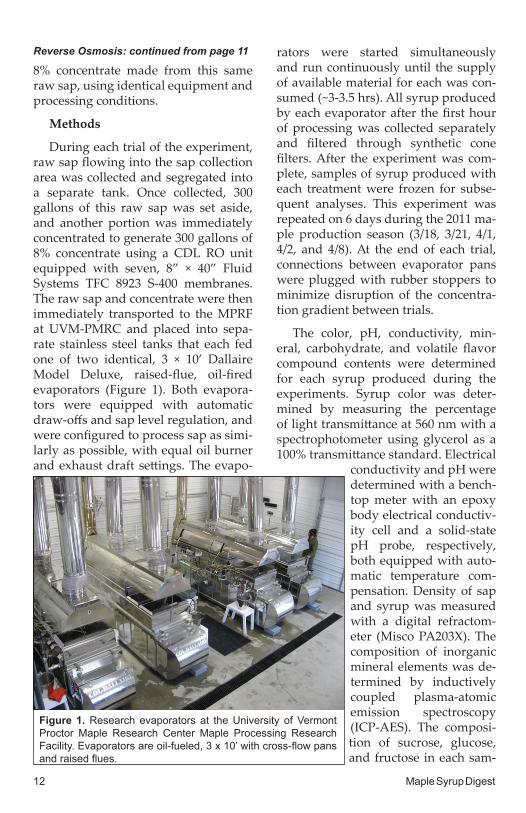
All experiments were conducted in the Maple Processing Research Facility at the University (MPRF) of Vermont Proctor Maple Research Center in Un-derhill Center, Vermont (UVM-PMRC) (Figure 1).
Experiment 1 – Comparison of syrup made from raw sap and 8% concen-trate
This experiment was conducted to investigate the fundamental effects of concentrating sap with RO on the prop-erties, composition, and flavor of maple syrup, and to determine if any signifi-cant differences exist in syrup made from raw and concentrated sap. To accomplish this, we conducted an ex-periment in which syrup was produced simultaneously from raw sap and from
Research: Reverse OsmosisEffects of Sap Concentration with ReverseOsmosis on Syrup Composition and FlavorA summary of experiments conducted at the University of Vermont Proctor Maple Research CenterAbby van den Berg, Timothy Perkins, Mark IsselhardtUniversity of Vermont, Proctor Maple Research Center
Mary An GodshallSugar Processing Research Institute, Inc.
Steven Lloyd United States Department of Agriculture Agricultural Research Service, Southern Regional Research Center
Reverse Osmosis: continued on page 12
12 Maple Syrup Digest
8% concentrate made from this same raw sap, using identical equipment and processing conditions.
Methods
During each trial of the experiment, raw sap flowing into the sap collection area was collected and segregated into a separate tank. Once collected, 300 gallons of this raw sap was set aside, and another portion was immediately concentrated to generate 300 gallons of 8% concentrate using a CDL RO unit equipped with seven, 8” × 40” Fluid Systems TFC 8923 S-400 membranes. The raw sap and concentrate were then immediately transported to the MPRF at UVM-PMRC and placed into sepa-rate stainless steel tanks that each fed one of two identical, 3 × 10’ Dallaire Model Deluxe, raised-flue, oil-fired evaporators (Figure 1). Both evapora-tors were equipped with automatic draw-offs and sap level regulation, and were configured to process sap as simi-larly as possible, with equal oil burner and exhaust draft settings. The evapo-
rators were started simultaneously and run continuously until the supply of available material for each was con-sumed (~3-3.5 hrs). All syrup produced by each evaporator after the first hour of processing was collected separately and filtered through synthetic cone filters. After the experiment was com-plete, samples of syrup produced with each treatment were frozen for subse-quent analyses. This experiment was repeated on 6 days during the 2011 ma-ple production season (3/18, 3/21, 4/1, 4/2, and 4/8). At the end of each trial, connections between evaporator pans were plugged with rubber stoppers to minimize disruption of the concentra-tion gradient between trials.
The color, pH, conductivity, min-eral, carbohydrate, and volatile flavor compound contents were determined for each syrup produced during the experiments. Syrup color was deter-mined by measuring the percentage of light transmittance at 560 nm with a spectrophotometer using glycerol as a 100% transmittance standard. Electrical
conductivity and pH were determined with a bench-top meter with an epoxy body electrical conductiv-ity cell and a solid-state pH probe, respectively, both equipped with auto-matic temperature com-pensation. Density of sap and syrup was measured with a digital refractom-eter (Misco PA203X). The composition of inorganic mineral elements was de-termined by inductively coupled plasma-atomic emission spectroscopy (ICP-AES). The composi-tion of sucrose, glucose, and fructose in each sam-
Figure 1. Research evaporators at the University of Vermont Proctor Maple Research Center Maple Processing Research Facility. Evaporators are oil-fueled, 3 x 10’ with cross-flow pans and raised flues.
Reverse Osmosis: continued from page 11
October 2015 13
ple of syrup was determined by high-performance liquid chromatography (HPLC), and the composition of volatile flavor and aroma compounds in each syrup sample was determined by solid-phase microextraction (SPME) and gas chromatography time-of-flight mass spectrometry (GC-TOF-MS). Detailed descriptions of the analytical methods used can be found in van den Berg et al. (2014). For each parameter, a paired t-test was used to determine if averages differed significantly in the syrup pro-duced simultaneously from raw sap and from the same sap concentrated to 8%. (Paired t-tests compare the compo-sition of the pairs of syrup produced si-multaneously with the two treatments.)
Sensory evaluation experiments were also conducted to examine poten-tial effects on flavor. For sensory evalu-ation, triangle tests were conducted to determine if an overall difference could be detected in the flavor of syrup pro-duced simultaneously with raw sap and the same sap concentrated to 8%. Trian-gle tests are a sensory evaluation meth-od used to determine whether an over-all difference in flavor exists between two samples. For example, in a triangle test designed to determine if an overall difference in flavor exists between the syrup produced with raw sap and the same sap concentrated to 8% during the experiment trial conducted on 3/18, each panelist would be presented with three samples of syrup. Two of the bot-tles would contain the syrup produced with raw sap during the 3/18 trial, and one of the bottles would contain the syrup produced with 8% concentrate during the 3/18 trial. (An equal number of panelists would receive two bottles of the syrup produced with concentrate and one bottle of the syrup produced with raw sap.) The panelists would then be asked to taste all three bottles
of syrup and write down the number of the bottle they believe contains the one syrup that is different from the other two. If enough panelists correctly iden-tify the ‘odd’ sample in the trio, then it is concluded that there is a difference in flavor between the pairs of syrup produced simultaneously with the two treatments.
Individual triangle tests were con-ducted for four of the six pairs of syrup produced during the experiment trials (to avoid sensory fatigue in the panel-ists) following the procedures described by Meilgaard et al. (2006). Twenty-six adult panelists with experience tasting and grading maple syrup participated in the test. Panelists were separated by cardboard partitions under fluorescent light during administration of the test, and sample presentation order was randomized for each panelist. Opaque sample bottles were used to eliminate any influence of syrup color on the panelists’ perceptions. Pairs were con-sidered significantly different (p < 0.01) if 15 of the 26 panelists positively iden-tified the odd sample (Meilgaard et al. 2006).
Results
Syrup produced simultaneously with raw sap and the same sap con-centrated to 8% sugar was very similar (Table 1). The most notable difference observed was with respect to syrup col-or: syrup produced with raw sap was slightly, but statistically significantly lighter in color than the syrup produced simultaneously with the same sap con-centrated to 8%. The average difference in light transmittance between the pairs of syrup produced simultaneously with raw sap and concentrate was 11.8 percentage points, however only one
Reverse Osmosis: continued on page 14
14 Maple Syrup Digest
pair fell within different grade classi-fications from one another (Figure 3). This result is particularly interesting, since it is the opposite of what might be expected: it is commonly hypothesized that syrup produced from concentrate will be lighter in color than syrup pro-duced from raw sap due to the shorter processing times required with concen-trate.
Besides color, few other statistically significant differences in composition or properties were observed between syrup produced with raw sap and con-
centrate. The conductivity did not dif-fer significantly between the two types of syrup and, accordingly, almost no differences were observed in the com-position of dissolved minerals between the syrup types (Table 1). The exception to this was magnesium (Mg), which was found in slightly lower quantities in syrup produced from raw sap, by approximately 20 ppm (Table 1). This is most likely due to the slight perme-ability of this membrane to Mg, which would result in the concentrate con-taining proportionally slightly less Mg than the raw sap.
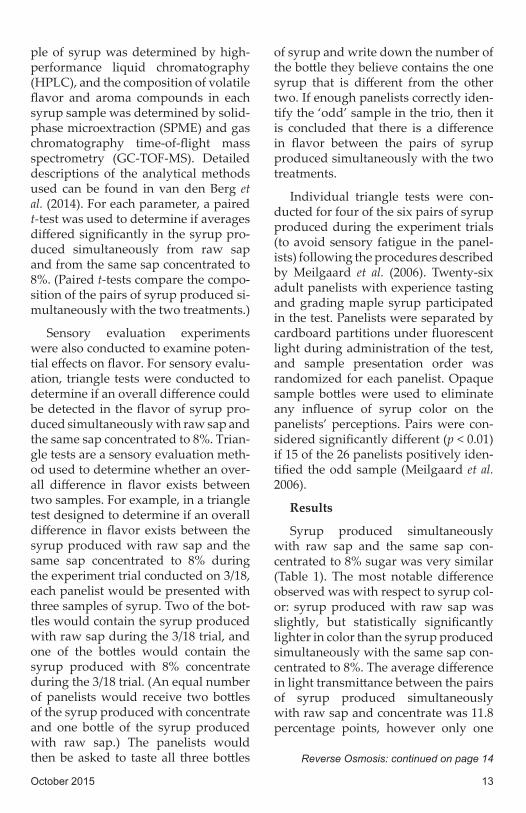
Table 1. Chemical composition and properties of maple syrup produced simultaneously from raw maple sap and the same sap concentrated to 8% with RO. Values are averages (± standard error) of 6 experiment trials. p-values are for statistical tests to determine whether average values for the two treatments were equal. Bold p-values indicate statistically significant differences (α = 0.05).
Reverse Osmosis: continued from page 13
October 2015 15
The pH of syrup produced with raw sap was slightly lower than that of syr-up produced with concentrate, though the difference was small and the aver-age values for both syrup types were near neutral (Table 1). Glucose was the only sugar that differed significantly between the two types of syrup, how-ever the difference was also numeri-cally quite small (0.11 vs. 0.09%, Table 1). From a practical perspective, these differences were very small, and would not impart any functional or quality difference between the syrups.
It is possible that the difference in the pH of syrup produced from raw sap and concentrate is simply a resid-ual effect of the slight difference in pH between raw and concentrated sap – in reverse osmosis, the pH of the concen-trate will always be slightly higher than the incoming material being concentrat-ed. (This is because RO membranes are permeable to carbon dioxide gas, but not to the bi-carbonate ions which typical-ly balance the effects of CO2 on pH.) This can be seen in Table 2, which shows the composi t ion and proper-ties of the sap, concentra te , and permeate used in each trial of this ex-periment, and the average composi t ion of the sap and concentra te . This slight dif-ference in pH
might also explain the small differences observed in glucose – sucrose, the pri-mary sugar found in maple syrup, is comprised of a molecule each of glu-cose and fructose bonded together. The rate that sucrose is split (hydrolyzed) into glucose and fructose increases as the pH of a solution gets lower. Thus, it’s possible that the slightly lower pH of the syrup produced with raw sap might result in slightly increased rates of sucrose hydrolysis, and thus also re-sult in slightly higher concentrations of glucose relative to the syrup produced with concentrate.
Although color differed between the syrup made with the two treatments, the relative quantity of volatile flavor compounds did not differ significantly between syrup made simultaneously with raw sap and the same sap concen-trated to 8% (Table 1). This suggests that
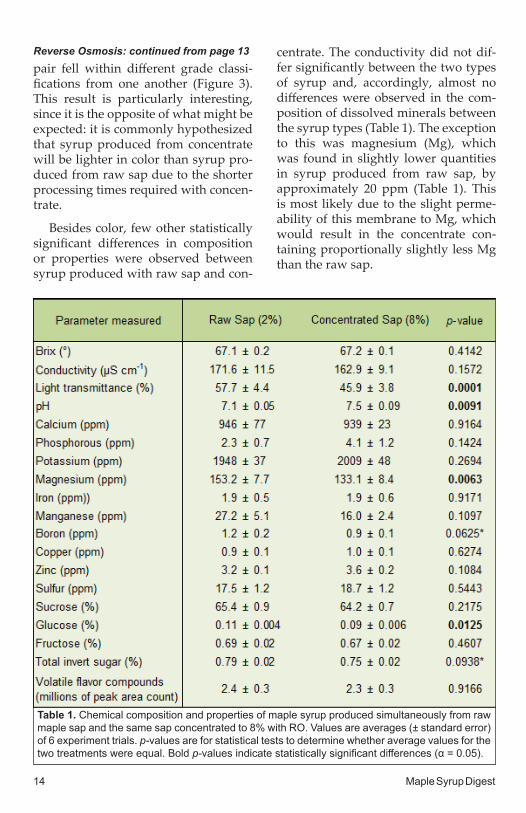
Figure 2. Samples of maple syrup produced simultaneously with raw maple sap (bottom row) and the same sap concentrated to 8% by RO (top row) dur-ing 6 experiment trials. Percent values indicate the light transmittance (560 nm) of the samples. Light transmittance ranges for international standard ma-ple syrup grades: ≥75.0% = Golden Color with Delicate Taste, 50.0-74.9%% = Amber Color with Rich Taste, 25.0-49.9% = Dark Color with Robust Taste, <25% = Very Dark Color with Strong Taste.
Reverse Osmosis: continued on page 17
October 2015 17
producing syrup from sap concentrat-ed by RO to 8% sugar does not signifi-cantly affect the overall development of flavor in maple syrup. However, be-cause the total quantity of volatile fla-vor compounds doesn’t always equate with the perceived level of flavor (Belitz et al. 2004), a sensory evaluation experi-ment was also conducted to investigate the potential impacts of RO on syrup flavor. For this experiment, we hypoth-esized that if concentrating sap with RO significantly affected syrup flavor, then an overall difference should be evident in the flavor of the syrup pro-duced simultaneously with raw sap and the same sap concentrated to 8% with RO. We conducted triangle tests on the pairs of syrup produced during four of the experiment trials (3/18, 4/2, 4/4, and 4/8). However, for each of the four pairs of syrup tested, panelists did not detect a difference in the flavor of the syrups produced simultaneously with raw and concentrated sap (Table 3). For the syrup pair produced on 3/18, the number of panelists who correctly identified the odd sample was close to the critical value necessary to conclude that a difference existed, suggesting that some differences in flavor might be present, but that if present they are likely very subtle. Thus, taken together with the results of volatile flavor com-pound analysis, these results suggest that concentrating sap to 8% with RO does not significantly impact syrup fla-vor.
In conclusion, the results of this study indicate that concentrating maple sap to 8% with RO does not substan-tially affect syrup composition, prop-erties, or flavor. Syrup produced si-multaneously from raw maple sap and the same sap concentrated to 8% had similar properties and composition,
and had flavor that was indistinguish-able by both chemical profiles and by panelists in sensory experiments. The most notable effect observed was on syrup color, which was slightly darker in syrup produced with concentrate. However, the differences observed in color were quite small, with only one of the six sample pairs differing in color grade. Any decrease in syrup value due to this minor reduction in color would be more than offset by the lower fuel and labor costs required for processing concentrate.
Experiment 2 – Comparison of syrup made from sap at 2, 8, 12, and 15% concentration
Another experiment was conducted to investigate the effects of the level of concentration with RO on the proper-ties, composition, and flavor of the syr-up produced. In this experiment, syrup was produced simultaneously with sap at 2, 8, 12, and 15% sugar concentration, and its composition, properties, and flavor analyzed and compared.
Methods
Specifically, sap concentrated to 15% using a Springtech 1600 unit with a Hy-dranautics LSY-PVD-1 membrane and the permeate generated during concen-tration were obtained. Three hundred gallons of the 15% concentrate were retained, while the remainder was di-luted with the appropriate quantity of the permeate necessary to generate 300 gallons of sap at each of three dif-ferent sugar concentration levels: 2, 8, and 12%. Each treatment was placed in a separate stainless steel tank which fed one of four identical, 3 × 10’ evaporators (as described above), and the evapora-tors were started simultaneously and allowed to continue processing until
Reverse Osmosis: continued on page 19
Reverse Osmosis: continued from page 15
18 Maple Syrup Digest
the supply of available liquid for each was consumed. After the first 1.5 hours of processing, all syrup produced by each treatment evaporator was col-lected separately. After the experiment was complete, the syrup produced with each treatment was filtered with a plate filter press, then packaged and frozen for subsequent analyses. The experi-ment was repeated on four days during the 2008 production season (4/2, 4/3, 4/5, and 4/8).
Sample analyses for color, conduc-tivity, pH, carbohydrate, mineral and flavor composition were performed as described in the previous experiment. Data were compiled and for each pa-rameter, repeated measures analysis of variance procedures were used to determine if significant differences ex-isted between the averages of syrup produced simultaneously with sap at the four treatment levels of sugar con-centration. If an overall significant dif-ference was found between the four treatments for a parameter, pairwise comparisons between the individual treatments were performed with or-thogonal contrasts to determine if sig-nificant differences existed between any of the individual sap concentration treatment levels. For sensory evalua-tion, triangle tests were conducted to determine if an overall difference could be detected in the flavor of syrup pro-duced simultaneously with sap at 2% and 15% concentration. Individual tri-angle tests were conducted for each of the syrup pairs produced during the four experiment trials, using 22 adult panelists with experience tasting and grading maple syrup. Pairs were con-sidered different (p < 0.01) if 14 of the 22 panelists correctly identified the odd sample (Meilgaard et al. 2006). More detailed descriptions of the methodol-
Reverse Osmosis: continued on page 12
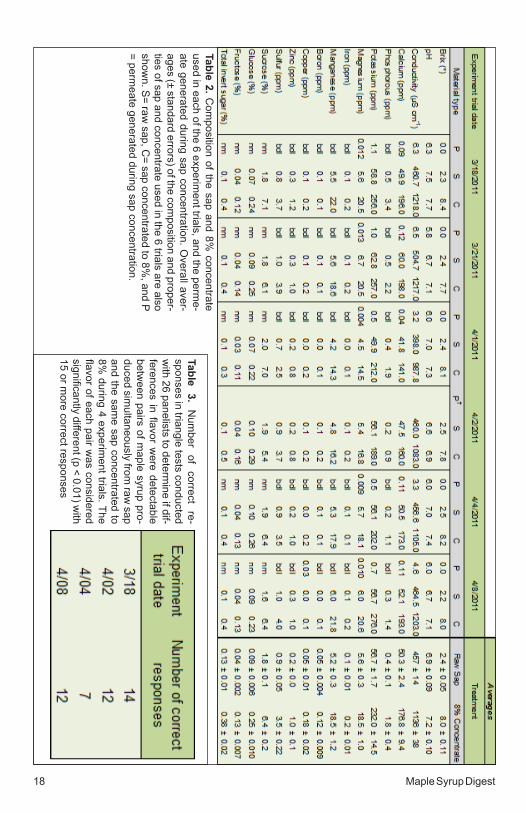
Table 2. Com
position of the sap and 8% concentrate
used in each of the 6 experiment trials, and the perm
e-ate generated during sap concentration. O
verall aver-ages (± standard errors) of the com
position and proper-ties of sap and concentrate used in the 6 trials are also show
n. S= raw sap, C
= sap concentrated to 8%, and P
= permeate generated during sap concentration.
Table 3. N
umber
of correct
re-sponses in triangle tests conducted w
ith 26 panelists to determine if dif-
ferences in flavor were detectable
between pairs of m
aple syrup pro-duced sim
ultaneously from raw
sap and the sam
e sap concentrated to 8%
during 4 experiment trials. The
flavor of each pair was considered
significantly different (p < 0.01) with
15 or more correct responses
October 2015 19
the supply of available liquid for each was consumed. After the first 1.5 hours of processing, all syrup produced by each treatment evaporator was col-lected separately. After the experiment was complete, the syrup produced with each treatment was filtered with a plate filter press, then packaged and frozen for subsequent analyses. The experi-ment was repeated on four days during the 2008 production season (4/2, 4/3, 4/5, and 4/8).
Sample analyses for color, conduc-tivity, pH, carbohydrate, mineral and flavor composition were performed as described in the previous experiment. Data were compiled and for each pa-rameter, repeated measures analysis of variance procedures were used to determine if significant differences ex-isted between the averages of syrup produced simultaneously with sap at the four treatment levels of sugar con-centration. If an overall significant dif-ference was found between the four treatments for a parameter, pairwise comparisons between the individual treatments were performed with or-thogonal contrasts to determine if sig-nificant differences existed between any of the individual sap concentration treatment levels. For sensory evalua-tion, triangle tests were conducted to determine if an overall difference could be detected in the flavor of syrup pro-duced simultaneously with sap at 2% and 15% concentration. Individual tri-angle tests were conducted for each of the syrup pairs produced during the four experiment trials, using 22 adult panelists with experience tasting and grading maple syrup. Pairs were con-sidered different (p < 0.01) if 14 of the 22 panelists correctly identified the odd sample (Meilgaard et al. 2006). More detailed descriptions of the methodol-
Reverse Osmosis: continued on page 12
ogy and analytical methods used can be found in van den Berg et al. (2011).
Results
As in the first study, very few differ-ences were observed in the composition or properties of syrup produced with the different sap concentration levels. The conductivity of syrup differed significantly between syrup produced with the four treatments, with a pat-tern suggesting lower conductivity in syrup produced with more concentrat-ed sap. This pattern followed and was likely driven by that of the composi-tion of manganese (Mn) in the samples, which was lower in syrup produced with more concentrated sap, and was the only mineral which differed signifi-cantly between the treatments (Table 4). Similar to Mg in the first study, the dif-ferences between the treatments were small, averaging approximately 30 ppm. Also similar to the first study, the pH differed significantly between the treatments, with slightly lower values in syrup made from less concentrated sap. In the first study, the quantity of glucose was slightly higher in syrup made from raw sap than in syrup made from concentrated sap; similar to this, in this study the quantity of total invert sugar (glucose + fructose) and fruc-tose differed significantly between the treatments, also with slightly higher amounts found in syrup made from less concentrated sap. Like the first study, though statistically significant, all of these differences were numerical-ly quite small, and unlikely to impart any functional or practical difference between the syrup made with the dif-ferent concentration levels.
Syrup color also differed slightly, but significantly, between the treat-
Reverse Osmosis: continued on page 20
Reverse Osmosis: continued from page 17
20 Maple Syrup Digest
BASCOM MAPLE FARMSONE SOURCE FOR ALL YOUR MAPLE SUPPLIES AND EQUIPMENT
Saturday, 8:00 a.m. - 12:00 p.m.
F Saturday 8:00 a.m. - 4:00 p.m. Closed Sundays.
N
2 0 1 4 M A P L E S U P P L I E S & E Q U I P M E N T C ATA L O G
BASCOM
Monday through Friday, 7:30 am - 4:30 pm Saturday, 8:00 am - 12:00 noonFebruary 1st to April 5th: Saturday, 8:00 am - 4:00 pm. Closed Sundays.
56 Sugar House Road, Alstead, NH 03602 Phone 603-835-6361 Fax 603-835-2455E-mail: [email protected] www.bascommaple.com
Contact us today with your questions about maple sugaringsupplies and equipment, or to receive your free catalog.
Tel: 603-835-6361 Fax: 603-835-2455E-mail: [email protected] Web: www.bascommaple.com
Monday - Friday, 7:30 a.m. - 4:30 p.m. Saturday8:00 a.m. - 12:00 p.m.
Feb. 1st - April 5thSaturday 8:00 a.m. - 4:00 p.m. Closed Sundays
56 Sugar House Rd.Alstead, NH 03603
Bascom Ad 10/15_Layout 1 10/15/14 8:13 PM Page 1
Monday- Friday,7:30 a.m. - 4:30 p.m.Saturday8:00 a.m. - 12:00 p.m.
Feb. 2nd - April 4thSaturday8:00 a.m. - 3:00 p.m.Closed Sundays
ments. However, the general pattern appears to be the opposite of what was observed in the first study – syrup produced with more concentrated sap tended to be lighter in color than syrup produced with less concentrated sap. However, looking at the data more closely, although this pattern is evident when comparing syrup made from 2% versus 15% sap, and 8% versus 12 and 15% sap, syrup made from 8% sap was actually darker than syrup made from 2% sap, the same result observed in the first study. Thus, although the data generally show a pattern of increasingly lighter syrup with increasing sap con-centration, the results again show that syrup made from 8% concentrate was slightly darker than syrup made from 2% sap. It is important to emphasize that the differences in color between
the treatments were extremely small in this study. For example, the difference between the average light transmit-tance of syrup produced with 2% and 8% sap was 3.1 percentage points, and the average difference in light transmit-tance between syrup samples produced with the different treatments in each trial was approximately 4 percentage points. Further, in three of the four tri-als, syrup produced with all four treat-ments fell within the same color grade classification (Figure 3).
Although an overall significant difference was detected in the total quantity of volatile flavor compounds between the syrup produced with the four concentration levels of sap, no significant differences were observed in the quantity of flavor compounds in pairwise comparisons between the individual treatments (2% vs. 8%, etc.)
Reverse Osmosis: continued on page 23
Reverse Osmosis: continued from page 19
October 2015 21
Tabl
e 4.
Che
mic
al c
ompo
sitio
n an
d pr
oper
-tie
s of
map
le s
yrup
pro
duce
d si
mul
tane
ousl
y fro
m s
ap a
t 4 c
once
ntra
tion
leve
ls: 2
, 8, 1
2,
and
15%
. Va
lues
are
ave
rage
s (±
sta
ndar
d er
ror)
of 4
exp
erim
ent t
rials
. Ove
rall
p-va
lues
ar
e fo
r sta
tistic
al te
sts
to d
eter
min
e w
heth
er
the
aver
age
valu
es o
f the
4 tr
eatm
ents
wer
e eq
ual
and,
whe
re s
igni
fican
t ov
eral
l di
ffer-
ence
s w
ere
dete
cted
, fo
r pa
irwis
e co
mpa
ri-so
ns t
o de
term
ine
if si
gnifi
cant
diff
eren
ces
exis
ted
betw
een
the
aver
ages
of t
he in
divi
d-ua
l tre
atm
ents
. Bol
d p-
valu
es in
dica
te s
tatis
-tic
ally
sig
nific
ant d
iffer
ence
s (α
= 0
.05)
.
Tabl
e 5.
Num
ber o
f cor
rect
resp
ons-
es in
tria
ngle
test
s co
nduc
ted
with
22
pane
lists
to
dete
rmin
e if
diffe
renc
es
in fl
avor
wer
e de
tect
able
bet
wee
n pa
irs o
f map
le s
yrup
pro
duce
d si
mul
-ta
neou
sly
from
sap
at
2% a
nd 1
5%
conc
entra
tion
durin
g 4
expe
rimen
t tri
als.
The
flav
or o
f ea
ch p
air
was
co
nsid
ered
sig
nific
antly
diff
eren
t (p
<
0.01
) w
ith 1
4 or
mor
e co
rrect
re-
spon
ses.
October 2015 23
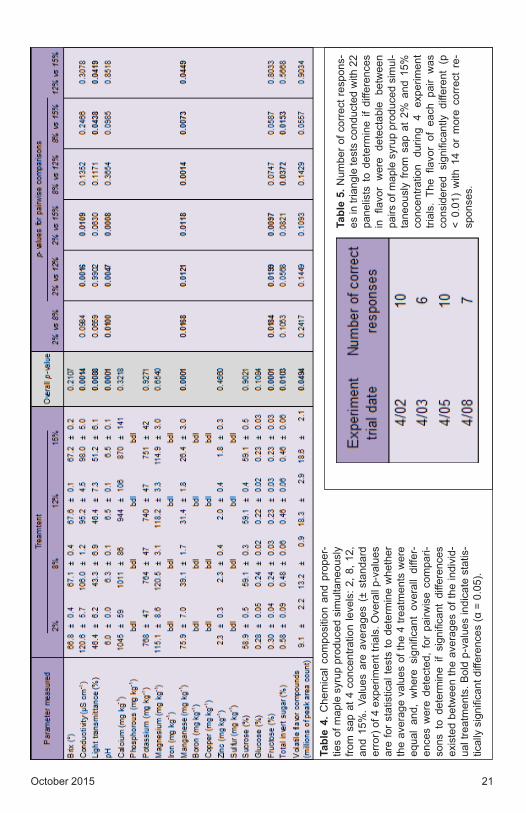
(Table 4). This suggests that the overall statistical difference is not indicative of any actual differences between the in-dividual treatments. Interestingly, the data suggest a trend for syrup made from more concentrated sap to contain more volatile flavor compounds than syrup produced with less concentrated sap (Table 4), which contrasts with the common anecdotal hypothesis that syr-up produced from more concentrated sap might be less flavorful than syrup made from less concentrated sap. This also contrasts with the common as-sumption that the level of flavor is posi-tively correlated with syrup color – in these syrups, lighter colored syrups contained more flavor compounds than darker colored syrups. Sensory evalu-ation experiments were con-ducted to further examine the flavor of the syrup produced with the different treatments. We hypothesized that if differ-ences in flavor existed in syr-up produced with the differ-ent concentration levels, that they would be most readily detectible in syrup produced with the two most extreme treatment levels, 2 and 15%. Thus, we conducted triangle tests to determine if differ-ences could be perceived in the flavor of the pairs of syrup produced simultaneously with 2 and 15% sap on each of the four experiment trial dates. In the triangle tests, panelists were not able to detect differ-ences in the flavor of syrup produced simultaneously with these treatments for any of the four pairs tested (Table 5). To-gether, these results suggest
that producing syrup with different concentrations of sap did not result in significant impacts on syrup flavor.
In conclusion, the results of this study indicate that producing syrup with sap concentrated to between 8 and 15% does not substantially affect syrup composition, properties, or flavor. Syr-up produced simultaneously from sap at 2, 8, 12, and 15% sugar concentration had similar properties and composi-tion. In addition, no difference was de-tected in the flavor of syrup produced simultaneously with the same sap at 2 and 15% concentration. Very small
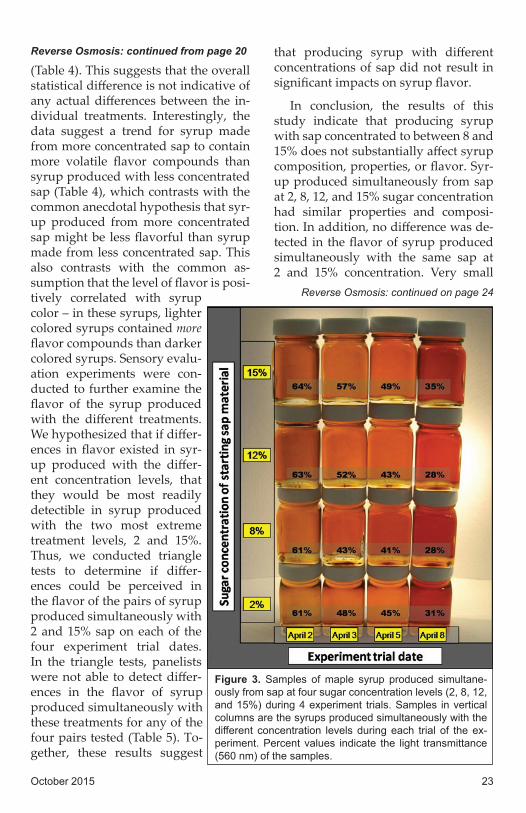
Figure 3. Samples of maple syrup produced simultane-ously from sap at four sugar concentration levels (2, 8, 12, and 15%) during 4 experiment trials. Samples in vertical columns are the syrups produced simultaneously with the different concentration levels during each trial of the ex-periment. Percent values indicate the light transmittance (560 nm) of the samples.
Reverse Osmosis: continued on page 24
Reverse Osmosis: continued from page 20
24 Maple Syrup Digest
differences were observed in the color of syrup produced with the different treatments – the general, overall trend observed was for lighter colored syrup to be produced from more concentrated sap. However, consistent with the re-sults of the first study, syrup produced from sap at 8% concentration was slightly darker than syrup produced from sap at 2%.
Experiment 3 – Comparison of syrup made from sap concentrated to mod-erate and high levels with RO
Although the first studies demon-strated that concentrating sap with RO up to 15% does not result in substantial impacts on the syrup produced, one re-maining question was whether concen-trating sap to higher levels might have greater impacts on syrup properties, composition, or flavor. Concentrating sap to levels greater than 15% increases efficiency and profitability by further reducing the time and cost of processing sap to syrup density. However, since it also further reduces the length of time sap is processed with heat in the evapo-rator, it is possible that syrup could be affected to a greater degree than when processing sap concentrated to more moderate levels (8-15%). Thus, a third study was conducted to investigate the potential impacts of concentrating sap with RO to a level higher than 15% on the properties, composition, and flavor of the syrup produced, and determine if any significant differences existed in syrup produced simultaneously with the same sap concentrated to either moderate or high levels.
Methods
To accomplish this, we conducted a study in which syrup was produced simultaneously from the same sap con-
centrated to either 8 or 21.5% sugar. Specifically, for each trial of the experi-ment, a common source of maple sap was concentrated sequentially to gener-ate 300 gallons each of 8 and 21.5% con-centrate using a CDL RO unit equipped with 8 × 40 Mark I membranes (Dow FilmTec, Midland, MI, USA). Each treatment was placed in a separate tank that fed one of two identical, 3 × 10’ evaporators (as described previously). The evaporators were started simulta-neously and run continuously until the supply of concentrate for each was con-sumed. All syrup produced with each treatment after the first 1.5 hours of pro-cessing was collected. After processing was complete, the syrup produced with each treatment was filtered separately with a plate filter press, and was then kept frozen until subsequent analyses. Separate trials of the experiment were conducted on five individual days dur-ing the 2009 maple production season (3/17, 3/19, 3/28, 3/29, 4/2).
Sample analyses for color, conduc-tivity, pH, carbohydrate, mineral, and flavor composition were performed as described in the previous experiment. Data were compiled and for each pa-rameter, a paired Student’s t-test was used to determine if significant differ-ences existed in the means of the syr-up produced simultaneously from the same sap concentrated to either 8 or 21.5%. For sensory evaluation, individ-ual triangle tests with 28 panelists with experience tasting and grading maple syrup were conducted for each pair of syrup produced during the first four trials of the experiment to determine if an overall difference could be detected in the flavor of maple syrup produced simultaneously with the same sap con-centrated to 8 and 21.5% sugar. Pairs
Reverse Osmosis: continued on page 25
Reverse Osmosis: continued from page 23
26 Maple Syrup Digest
were considered different (p < 0.01) if 16 of the 28 panelists correctly identi-fied the odd sample (Meilgaard et al. 2006). More detailed descriptions of the methodology and analytical methods used can be found in van den Berg et al. (2012).
Results
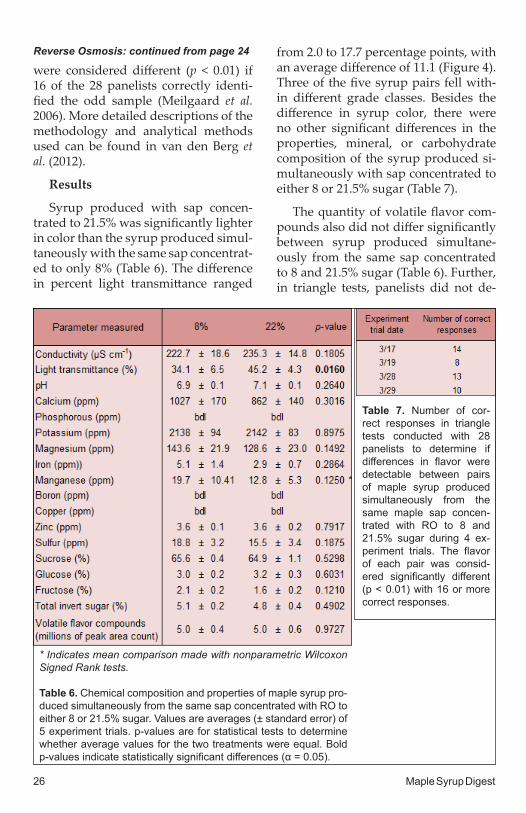
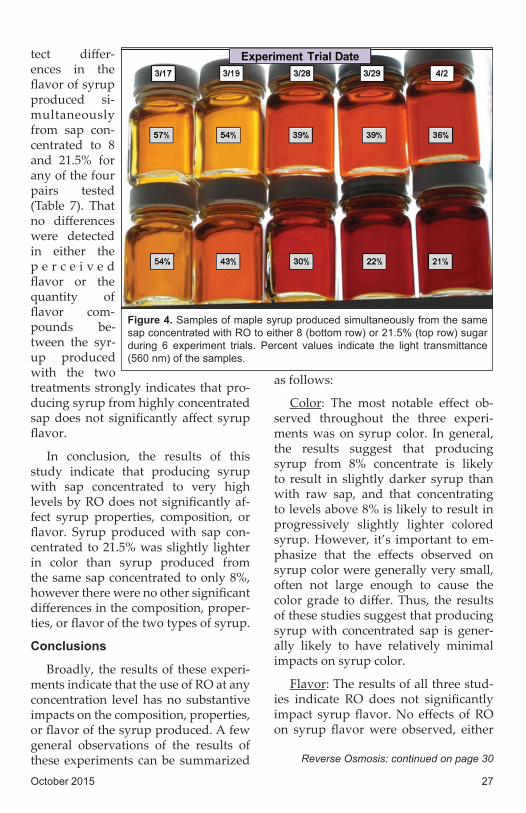
Syrup produced with sap concen-trated to 21.5% was significantly lighter in color than the syrup produced simul-taneously with the same sap concentrat-ed to only 8% (Table 6). The difference in percent light transmittance ranged
* Indicates mean comparison made with nonparametric Wilcoxon Signed Rank tests.
Table 6. Chemical composition and properties of maple syrup pro-duced simultaneously from the same sap concentrated with RO to either 8 or 21.5% sugar. Values are averages (± standard error) of 5 experiment trials. p-values are for statistical tests to determine whether average values for the two treatments were equal. Bold p-values indicate statistically significant differences (α = 0.05).
Table 7. Number of cor-rect responses in triangle tests conducted with 28 panelists to determine if differences in flavor were detectable between pairs of maple syrup produced simultaneously from the same maple sap concen-trated with RO to 8 and 21.5% sugar during 4 ex-periment trials. The flavor of each pair was consid-ered significantly different (p < 0.01) with 16 or more correct responses.
from 2.0 to 17.7 percentage points, with an average difference of 11.1 (Figure 4). Three of the five syrup pairs fell with-in different grade classes. Besides the difference in syrup color, there were no other significant differences in the properties, mineral, or carbohydrate composition of the syrup produced si-multaneously with sap concentrated to either 8 or 21.5% sugar (Table 7).
The quantity of volatile flavor com-pounds also did not differ significantly between syrup produced simultane-ously from the same sap concentrated to 8 and 21.5% sugar (Table 6). Further, in triangle tests, panelists did not de-
Reverse Osmosis: continued from page 24
October 2015 27
tect differ-ences in the flavor of syrup produced si-multaneously from sap con-centrated to 8 and 21.5% for any of the four pairs tested (Table 7). That no differences were detected in either the p e r c e i v e d flavor or the quantity of flavor com-pounds be-tween the syr-up produced with the two treatments strongly indicates that pro-ducing syrup from highly concentrated sap does not significantly affect syrup flavor.
In conclusion, the results of this study indicate that producing syrup with sap concentrated to very high levels by RO does not significantly af-fect syrup properties, composition, or flavor. Syrup produced with sap con-centrated to 21.5% was slightly lighter in color than syrup produced from the same sap concentrated to only 8%, however there were no other significant differences in the composition, proper-ties, or flavor of the two types of syrup.
Conclusions
Broadly, the results of these experi-ments indicate that the use of RO at any concentration level has no substantive impacts on the composition, properties, or flavor of the syrup produced. A few general observations of the results of these experiments can be summarized
as follows:
Color: The most notable effect ob-served throughout the three experi-ments was on syrup color. In general, the results suggest that producing syrup from 8% concentrate is likely to result in slightly darker syrup than with raw sap, and that concentrating to levels above 8% is likely to result in progressively slightly lighter colored syrup. However, it’s important to em-phasize that the effects observed on syrup color were generally very small, often not large enough to cause the color grade to differ. Thus, the results of these studies suggest that producing syrup with concentrated sap is gener-ally likely to have relatively minimal impacts on syrup color.
Flavor: The results of all three stud-ies indicate RO does not significantly impact syrup flavor. No effects of RO on syrup flavor were observed, either
Figure 4. Samples of maple syrup produced simultaneously from the same sap concentrated with RO to either 8 (bottom row) or 21.5% (top row) sugar during 6 experiment trials. Percent values indicate the light transmittance (560 nm) of the samples.
Reverse Osmosis: continued on page 30
30 Maple Syrup Digest
by chemical composition analyses or panelists in sensory experiments, be-tween syrup produced simultaneously from raw sap and the same sap concen-trated to 8%, from the same sap at 2 and 15% concentration, or from the same sap concentrated to 8 and 21.5%. Thus, although given the slight differences in color observed it is reasonable to con-clude that using RO has some impact on flavor development, these results indicate that any impact is quite subtle,
and beyond what most people are able to perceive.
Other composition and properties: Very few other differences were ob-served in the composition of syrup. In all cases, the differences that were ob-served were numerically very small, and not likely to be of any practical significance. In addition, all values for all parameters measured in syrup pro-duced with all treatments during the three experiments were within pub-lished ranges for the composition and
properties of pure maple syrup (Stuckel and Low 1996, Perkins et al. 2006, van den Berg et al. 2006, Perkins and van den Berg 2009).
C o n c e n t r a t -ing sap with RO can provide very large savings in time, fuel, and energy use, in-creasing the prof-itability of syrup production sub-stantially. The collective results of these experi-ments demon-strate that these benefits can be achieved with-out detriment to the quality of the syrup produced.
Expanded Dis-cussion
That the syrup produced with raw sap and sap
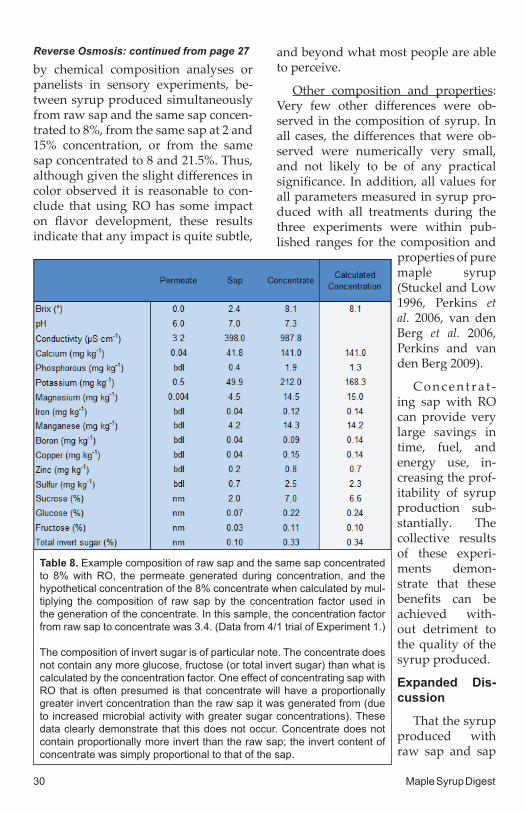
Table 8. Example composition of raw sap and the same sap concentrated to 8% with RO, the permeate generated during concentration, and the hypothetical concentration of the 8% concentrate when calculated by mul-tiplying the composition of raw sap by the concentration factor used in the generation of the concentrate. In this sample, the concentration factor from raw sap to concentrate was 3.4. (Data from 4/1 trial of Experiment 1.)
The composition of invert sugar is of particular note. The concentrate does not contain any more glucose, fructose (or total invert sugar) than what is calculated by the concentration factor. One effect of concentrating sap with RO that is often presumed is that concentrate will have a proportionally greater invert concentration than the raw sap it was generated from (due to increased microbial activity with greater sugar concentrations). These data clearly demonstrate that this does not occur. Concentrate does not contain proportionally more invert than the raw sap; the invert content of concentrate was simply proportional to that of the sap.
Reverse Osmosis: continued from page 27
October 2015 31
concentrated to different levels with RO was very similar is not surprising, given that the primary difference be-tween raw sap and concentrate is sim-ply the concentration of the substances present. When RO’s are functioning properly, very little else besides water passes through the membrane and into the permeate. This is illustrated well by the data in Table 8, which shows the composition of a sample of raw sap and the 8% concentrate made from that sap, along with the hypothetical com-position of the concentrate calculated by multiplying the concentration of the substances in the raw sap by the con-centration factor used in the concentra-tion of the sap to 8%. The calculated concentrations are very similar to the actual concentrations measured in the 8% concentrate. So, RO concentrate is essentially concentrated sap. The differ-ences between the actual and calculated concentrations of the concentrate are mostly in the ions that pass through RO membranes in very minute amounts, predominantly potassium (K), magne-sium (Mg), and calcium (Ca). However, as you can see in Tables 8 and 2, per-meate contains very little of even these ions; in fact, in the study of raw sap ver-sus 8% concentrate, for example, over 99.8% of Ca and Mg, and 98.7% of K, were retained in the concentrate (Table 2). If we consider the reactions that oc-cur during sap processing in a very sim-plified way, the rates of these reactions are influenced by temperature, the con-centration of reactants, and the length of time they occur. With concentrated sap, the length of time for reactions to occur is reduced, but the concentration of reactants and temperature are both increased. Thus, it may simply be that the changes are somewhat balanced out, and processing raw sap or con-centrate made from that sap, whether
concentrated to 8, 15, or 20%, results in very similar syrup.
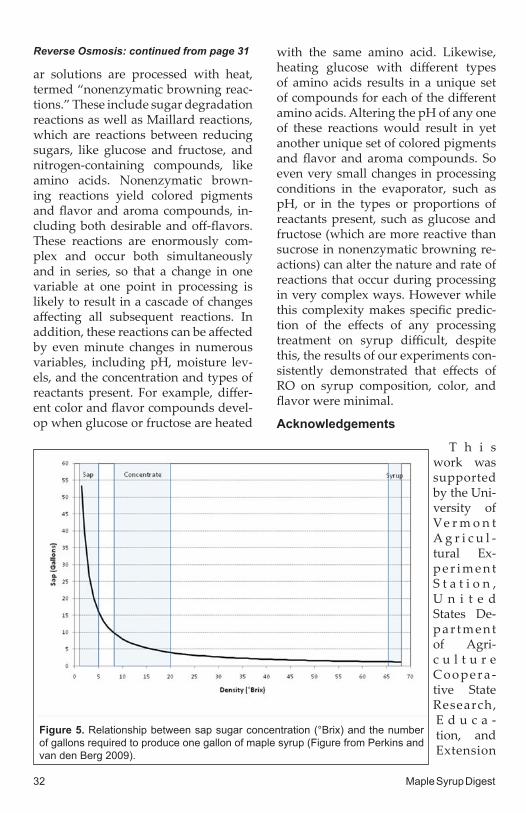
So why, then, do we see some differ-ences in color between syrup produced with raw sap and different levels of concentrate? Concentrating sap to 8% is a much larger concentration step than concentrating from 8% to higher lev-els. Most of the water removed by RO, ~75%, is removed in in this step, and concentrating sap to higher concentra-tions than 8% removes proportionally much less water (Figure 5). It is possible that the large concentration step from 2 to 8% doesn’t result in reductions in processing times large enough to bal-ance the simultaneously large increas-es in concentration, and thus slightly more color development reactions oc-cur with 8% concentrate than with raw sap. But when sap is concentrated to levels higher than 8%, the reductions in processing time may be sufficient to overcome the increased concentration, and fewer color development reactions occur during processing than with less concentrated sap.
This is a very simplified account of the reactions that occur as sap and con-centrate are processed in the evaporator and doesn’t take into account changes that the presence of particular types of reactants, like the reducing sugars glucose and fructose, or in processing conditions like pH, can have on the re-actions that occur during processing. In reality, the reactions that occur when sap is processed with heat in the evapo-rator are so complex that it’s unlikely to ever be possible to accurately or consis-tently predict the effects that changing a single variable will have on the syrup produced. In general, much of the color and flavor in maple syrup develops through reactions that occur when sug-
Reverse Osmosis: continued on page 32
32 Maple Syrup Digest
Reverse Osmosis: continued from page 31
ar solutions are processed with heat, termed “nonenzymatic browning reac-tions.” These include sugar degradation reactions as well as Maillard reactions, which are reactions between reducing sugars, like glucose and fructose, and nitrogen-containing compounds, like amino acids. Nonenzymatic brown-ing reactions yield colored pigments and flavor and aroma compounds, in-cluding both desirable and off-flavors. These reactions are enormously com-plex and occur both simultaneously and in series, so that a change in one variable at one point in processing is likely to result in a cascade of changes affecting all subsequent reactions. In addition, these reactions can be affected by even minute changes in numerous variables, including pH, moisture lev-els, and the concentration and types of reactants present. For example, differ-ent color and flavor compounds devel-op when glucose or fructose are heated
with the same amino acid. Likewise, heating glucose with different types of amino acids results in a unique set of compounds for each of the different amino acids. Altering the pH of any one of these reactions would result in yet another unique set of colored pigments and flavor and aroma compounds. So even very small changes in processing conditions in the evaporator, such as pH, or in the types or proportions of reactants present, such as glucose and fructose (which are more reactive than sucrose in nonenzymatic browning re-actions) can alter the nature and rate of reactions that occur during processing in very complex ways. However while this complexity makes specific predic-tion of the effects of any processing treatment on syrup difficult, despite this, the results of our experiments con-sistently demonstrated that effects of RO on syrup composition, color, and flavor were minimal.
Acknowledgements
T h i s work was supported by the Uni-versity of Ve r m o n t A g r i c u l -tural Ex-p e r i m e n t S t a t i o n , U n i t e d States De-p a r t m e n t of Agri-c u l t u r e Coope ra -tive State Research, E d u c a -tion, and Extension
Figure 5. Relationship between sap sugar concentration (°Brix) and the number of gallons required to produce one gallon of maple syrup (Figure from Perkins and van den Berg 2009).
October 2015 33
Service (USDA CSREES) grant #2008-34157-19186, United States Depart-ment of Agriculture National Institute of Food and Agriculture (USDA NIFA) grant #2010-34157-21008. We are very grateful for a grant received from the Chittenden County Maple Sugarmak-ers Association which paid for the evaporators used in this work. We would like to thank Ben Dana, Douglas Edwards, Teague Henkle, Alan How-ard, David Marvin, Marianne McKee, Joshua O’Neill, Ted Ortiz Y Pino, Jack O’Wril, Brian Perkins, Eric Sorkin, Bri-an Stowe, and Joel Tilley for their assis-tance with this research.
Literature Cited
Belitz, H.-D., Grosch, W. and Schieber-le, P. (2004) Carbohydrates. Food Chemistry, 3rd ed. Springer-Verlag, Berlin, Germany. pp 245-341.
Meilgaard, M., Civille, G.V., and Carr, B.T. (2006) Overall difference testing. Sensory Evaluation Techniques (4th ed). CRC Press, Boca Raton, FL. pp 63-104.
Morselli, M.F., Whalen, M.L., Baggett, K.L. and Sendak, P.E. 1982. Quality of syrup produced from sap concen-trated by reverse osmosis (RO). Maple Syrup J. 6: 18.
Perkins, T.D., Morselli, M.F., van den Berg, A.K., and Wilmot, T.R. (2006) Maple chemistry and quality. North American Maple Syrup Producers Man-ual, 2nd ed. (Eds. Heiligmann, R.B., Koelling, M.R. and Perkins, T.D.). The Ohio State University, Ohio, USA. pp 294-300.
Perkins, T.D. and van den Berg, A.K. (2009) Maple syrup – production, composition, chemistry, and sensory characteristics. In Advances in Food and Nutrition Research (Ed. S.L. Tay-
lor), 56: 103-144. Academic Press, San Diego, CA, USA.
Sendak, P.E. and Morselli, M.F. 1984. Reverse osmosis in the production of maple syrup. Forest Prod. J. 34: 57-61.
Stuckel, J.G. and Low, N.H. (1996) The chemical composition of 80 pure ma-ple syrup samples produced in North America. Food Res Int 29(3-4) pp. 373-379.
van den Berg, A.K., Perkins, T.D., and Isselhardt, M.L. (2006) Sugar profiles of maple syrup grades. Maple Syrup Digest 18: 12-13.
van den Berg, A.K., Perkins, T.D., Is-selhardt, M.L., Godshall, M.A., and Lloyd, S.W. (2011) Effects of produc-ing maple syrup from concentrated and reconstituted sap of different sugar concentrations. Int Sugar J 113: 35-44.
van den Berg, A.K., Perkins, T.D., Is-selhardt, M.L., Godshall, M.A., and Lloyd, S.W. (2012) Maple syrup pro-duction with sap concentrated to high levels by membrane separation: effects on syrup chemical composi-tion and flavor Int Sugar J 114: 572-576.
van den Berg, A.K., Perkins, T.D., Is-selhardt, M.L., Godshall, M.A., and Lloyd, S.W. (2014) Effects of mem-brane separation on maple syrup composition and flavor Int Sugar J 116: 656-665.