Research on Key Problems in PIV Particle Image Velocimetry ...
7
Research on Key Problems in PIV Particle Image Velocimetry Measurement Qingmin Pu 1, a , Jing Sun 1, b , Yulin Jiang 1, c and Wenbin Ding 2, d 1 College of Information Engineering, Zhongshan Polytechnic, No.25, Boai No.7 Road, Zhongshan, China 2 College of Electronic and Engineering, Jiujiang University, No. 551 Qianjin East Road, Jiujiang, China a [email protected], b [email protected], c [email protected], d [email protected] Keywords: PIV particle image velocimetry, Specified true value, Turbulence intensity, Optimal number of measurements. Abstract: In the process of measuring the flow field distribution of the partially filled pipes with PIV particle image velocimetry, aiming at the insufficiency of the limited number of continuous measurements of velocimeter, a method for quickly calculating the required number of measurements for specified true value is proposed in this paper. The flow velocity is regarded as a superposition of the average flow velocity and the pulsation flow velocity, and the discriminant basis for measuring the change degree of the average flow velocity and the pulsation flow velocity is defined respectively. According to the discriminant basis, the measured data is analyzed, then the required number of measurements for calculating specified true value is determined. Finally, the optimal number of measurements for PIV particle image single point measurement is obtained by using the constraints of equal precision measurement. The experimental results show that the proposed method can quickly obtain the number of measurements to determine the specified true value, which has an important reference for engineering application. 1. Introduction The particle image velocimeter PIV has been widely used in the field of flow measurement such as turbulence and complex flow due to its advantages of non-contact, undisturbed measurement, transient measurement, etc. The basic principle is to add micro-trace particles into the flow field. The light source such as a pulsed laser was incident into the measured flow field region, and the image of the tracer particle is recorded. Finally, the fluid flow rate is obtained by a modern mathematical processing method such as autocorrelation or cross-correlation. However, in the process of measuring the flow velocity in partially filled pipes using PIV particle image velocimeter, there are still several key problems to be solved: One is the determination of the specified true value of the unknown flow rate; Second, the determination of the optimal number of measurements under the condition of satisfying the measurement accuracy. The specified true value of the flow rate is a value close to the true value, and the difference from the true value is negligible. Assuming no systematic error, the average of the measured values is often used as the specified true value in project. However, due to the limitation of the particle image velocimeter itself, the number of repeated measurements cannot be excessive. Therefore, how to determine the required number of measurements to solve the specified true value has been a hot topic in engineering applications. At the same time, in the process of measuring the flow velocity of the partially filled flow field, due to the existence of complex flows such as upstream flow and secondary flow, if the number of repeated measurements is too small, the measurement results will deviate from the normal distribution, and the credibility of the measurement result will decrease. Therefore, how to obtain the optimal number of measurements under the premise of ensuring measurement accuracy is another hot topic in engineering applications. For the determination of the required number of measurements to solve the specified true value, most of the engineering relies on theoretical truth or previous experience. However, in the study of the velocity distribution of the partially filled pipes, there is no theoretical calculation method that 2019 3rd International Conference on Computer Engineering, Information Science and Internet Technology (CII 2019) Published by CSP © 2019 the Authors 504 504
Transcript of Research on Key Problems in PIV Particle Image Velocimetry ...
Research on Key Problems in PIV Particle Image Velocimetry Measurement
Qingmin Pu1, a, Jing Sun1, b, Yulin Jiang1, c and Wenbin Ding2, d 1 College of Information Engineering, Zhongshan Polytechnic, No.25, Boai No.7 Road, Zhongshan, China
2 College of Electronic and Engineering, Jiujiang University, No. 551 Qianjin East Road, Jiujiang, China [email protected], [email protected], [email protected], [email protected]
Keywords: PIV particle image velocimetry, Specified true value, Turbulence intensity, Optimal number of measurements.
Abstract: In the process of measuring the flow field distribution of the partially filled pipes with PIV particle image velocimetry, aiming at the insufficiency of the limited number of continuous measurements of velocimeter, a method for quickly calculating the required number of measurements for specified true value is proposed in this paper. The flow velocity is regarded as a superposition of the average flow velocity and the pulsation flow velocity, and the discriminant basis for measuring the change degree of the average flow velocity and the pulsation flow velocity is defined respectively. According to the discriminant basis, the measured data is analyzed, then the required number of measurements for calculating specified true value is determined. Finally, the optimal number of measurements for PIV particle image single point measurement is obtained by using the constraints of equal precision measurement. The experimental results show that the proposed method can quickly obtain the number of measurements to determine the specified true value, which has an important reference for engineering application.
1. Introduction The particle image velocimeter PIV has been widely used in the field of flow measurement such
as turbulence and complex flow due to its advantages of non-contact, undisturbed measurement, transient measurement, etc. The basic principle is to add micro-trace particles into the flow field. The light source such as a pulsed laser was incident into the measured flow field region, and the image of the tracer particle is recorded. Finally, the fluid flow rate is obtained by a modern mathematical processing method such as autocorrelation or cross-correlation. However, in the process of measuring the flow velocity in partially filled pipes using PIV particle image velocimeter, there are still several key problems to be solved: One is the determination of the specified true value of the unknown flow rate; Second, the determination of the optimal number of measurements under the condition of satisfying the measurement accuracy. The specified true value of the flow rate is a value close to the true value, and the difference from the true value is negligible. Assuming no systematic error, the average of the measured values is often used as the specified true value in project. However, due to the limitation of the particle image velocimeter itself, the number of repeated measurements cannot be excessive. Therefore, how to determine the required number of measurements to solve the specified true value has been a hot topic in engineering applications.
At the same time, in the process of measuring the flow velocity of the partially filled flow field, due to the existence of complex flows such as upstream flow and secondary flow, if the number of repeated measurements is too small, the measurement results will deviate from the normal distribution, and the credibility of the measurement result will decrease. Therefore, how to obtain the optimal number of measurements under the premise of ensuring measurement accuracy is another hot topic in engineering applications.
For the determination of the required number of measurements to solve the specified true value, most of the engineering relies on theoretical truth or previous experience. However, in the study of the velocity distribution of the partially filled pipes, there is no theoretical calculation method that
2019 3rd International Conference on Computer Engineering, Information Science and Internet Technology (CII 2019)
Published by CSP © 2019 the Authors 504504
can be used for engineering calculation, and the theoretical true value cannot be obtained by the calculation formula. Therefore, how to determine the required number of measurements to solve the specified true value is the primary solution to be solved in this paper. Secondly, there are many research results on the research of the optimal number of measurement (e.g. Vickers, 2003; Binev, Cohen, Mula, & Nichols, 2018; Shahriar, Habiballah, & Hussein, 2018; Stojnic, Parvaresh, & Hassibi, 2009). Yang, Wei, and Yonina (2019) studied the relationship between measurement times and signal recovery from the perspective of signal-to-noise ratio, and proposed more measurements do not necessarily imply better recovery. Akçakaya and Tarokh (2008) researched how to use the optimal number of measurements to recover sparse signals through Vandermonde measurements method. Imer and Basar (2010) proposed a dynamic programming method to study the optimal number of measurements in sensor signal transmission scheduling. Muscas, Pilo, Pisano, and Sulis (2007) proposed an optimization algorithm based on the techniques of dynamic programming technology to analyze the optimal number of measurements of different nodes in the distribution network, in order to ensure the equipment can provide high-precision results at the lowest cost. These researches have studied the optimal number of measurements for a single point measurement. These methods assume that the specified true value of the measurement is known, but in practical engineering applications, the specified true value is usually unknown, so these methods have certain limitations in practical engineering applications.
This paper proposes a method for quickly calculating the required number of measurements of specify the true value. The flow field flow velocity is regarded as a linear superposition of the average flow velocity and the pulsation flow velocity, and the discrimination basis for measuring the change degree of the average flow velocity and the pulsation flow velocity are defined. The number of measurements of the specified true value is determined based on the relative error of the average flow velocity and the turbulence intensity, then the specified true value of the flow field is obtained. Finally, the optimal number of measurements of the single point measurement of the PIV particle image are obtained by using the equal precision measurement constraints.
2. Problems in Measurement 2.1 Device for Measuring Velocity
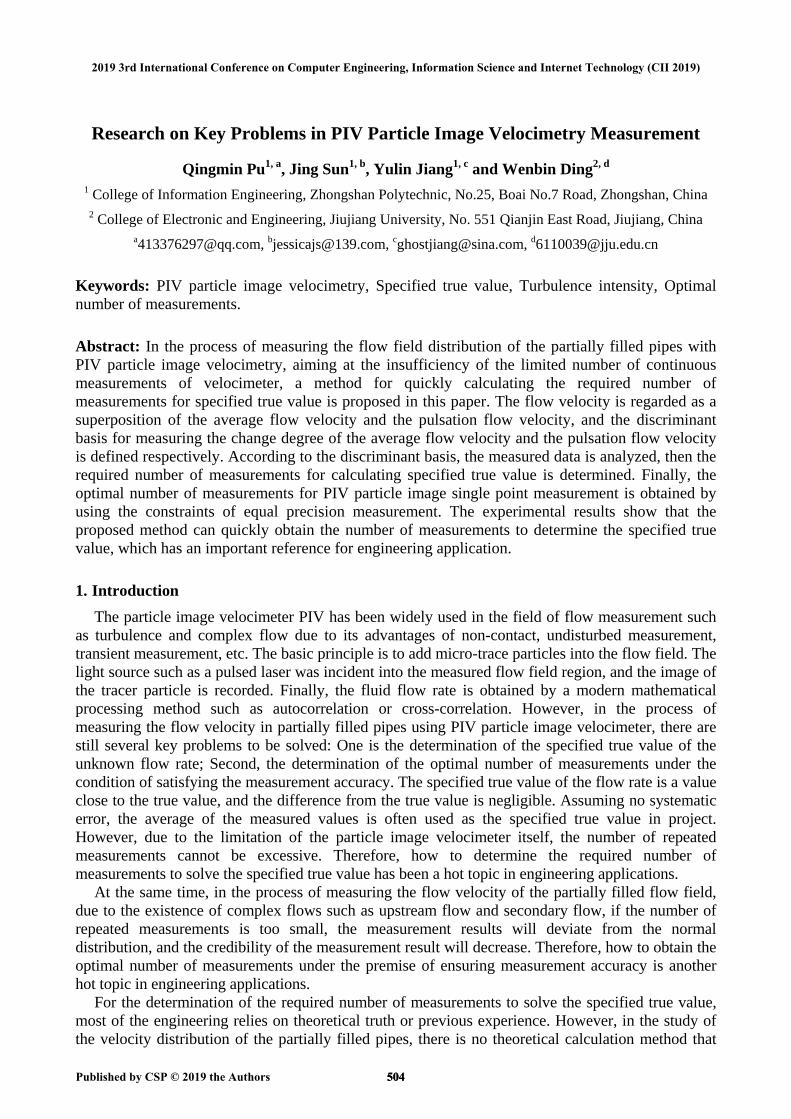
When a PIV particle image velocimetry was used to measure the fluid velocity in partially filled pipes, the measurement system is shown in Figure 1.
Flow control Flow meter Pump
Influent chamber
Effluent chamber
Test pipe
20D 15DPIV
Stepper motor support
Laser
Water tank
Figure 1. Schematic of test equipment.
In Figure 1, the water pipe is circular pipe, and made of transparent acrylic tube. The PIV particle image velocimetry is installed on the console of the composite stepping motor, which can move up and down, left and right. In the process of velocity measurement, the micro-trace particles are added into the fluid, the tracer particles flow with the flow of the fluid. The PIV velocimetry system captures the tracer particles in the fluid, then the flow rate was indirectly obtaining the fluid based on the moving speed of the tracer particles.
505505
2.2 Problem During the fluid velocity measurement process, when the pipeline fluid is in a laminar flow state,
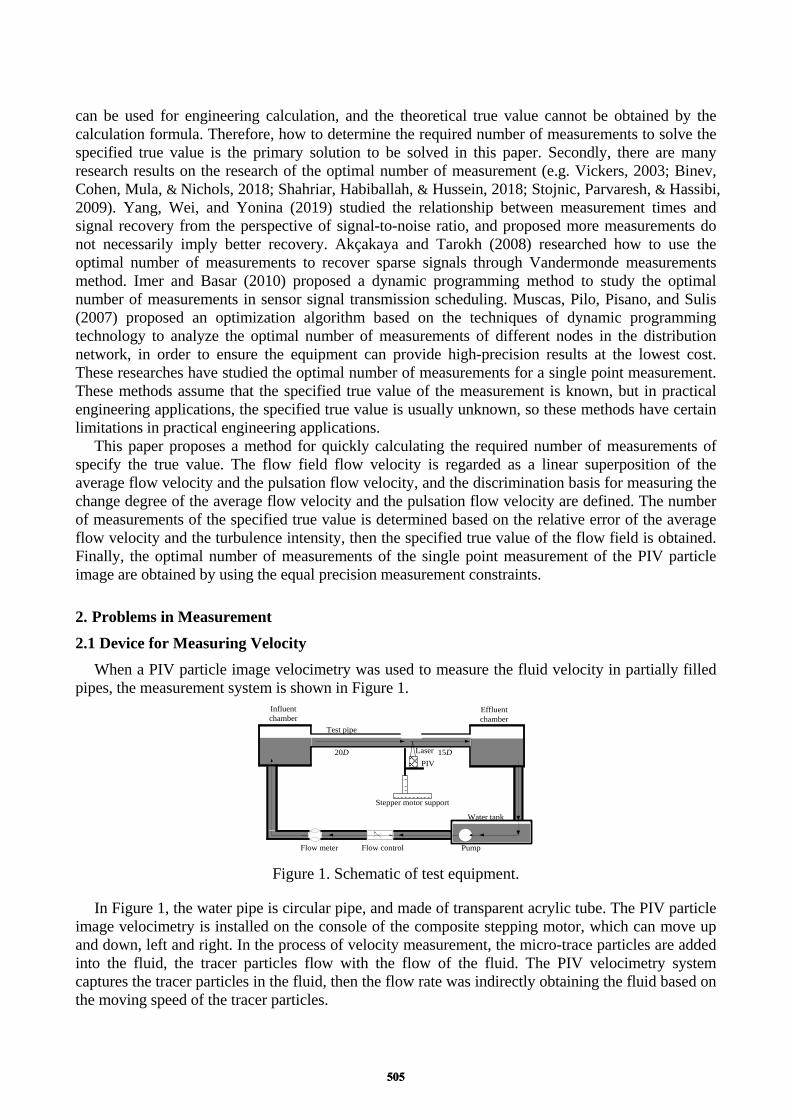
a single measurement point can obtain a stable measurement value required only a few measurements. But when the pipeline fluid is in a turbulent state, the measurement result is not stable. Taking the fullness of 70% as an example, the fluid velocity of the center line of the pipeline is as shown in Figure 2.
Figure 2. Single Point Velocity Distribution.
Obviously, in the case of turbulence, the measured value is not a stable value, and the outlier data is also irregular. In other words, the instantaneous measured value at a certain point cannot be used instead of the truth value in the experiment. The fluid velocity of single-point must be repeated multiple times to obtain the approximate true value. If the number of repeated measurements is small, the true flow field characteristics cannot be reflected, and the reliability is lowered. However, due to the performance of the measuring instrument, the number of repeated measurements cannot be too much. Therefore, the optimal number of repeated measurements at a single flow point must be determined.
3. Construction of Optimal Number of Measurements Model In a partially filled pipes, the fluid velocity of the measuring point can be regarded as the
superposition of the pulsating fluid velocity and the average fluid velocity, then the fluid velocity of the measuring point can be expressed as
ntusv tt ,,1,0 =+= (1) ],,,,[ 210 nvvvvv = is the measured data, n is the number of measurement, where s represents
an unknown flow velocity vector and tu is the instantaneous fluctuating velocity. Because s is the theoretical velocity, it is usually unknown. In practice, the average value v of n measurement data, i.e. the specified true value, is used to approximate replace the true value. Then the formula (1) can be changed to
ntuvv tnt ,,1,0 =+≈ (2) Where the specified true value can be written as
∑==
n
i in vn
v1
1 (3)
And the standard deviation of flow velocity can be written as
0 50 100 150 200 250 300 350 400 450 5000
0.05
0.1
0.15
0.2
0.25
0.3
0.35
Number of measurements
Flow
vel
ocity
(m/s
)
506506
∑∑
∑
=
=
=
−−
=
−
−=
n
i
n
i i
i
n
i ni
n
vv
n
n
vv
1
2
12
12
11
1
)(σ
(4)
Then the standard deviation of the mean velocity can be gotten as
nστ = (5)
When the precision measure φ and the standard deviation of the mean velocity are equal, the optimal number of measurements N can be obtained
22
=
=
φσ
τσN (6)
The optimal number of measurements of the fluid velocity measurement can be obtained by solving equation(6). However, from equations (1) to (6), the required number of measurements of specified true value should be first determined before solving equation (6), then the specified true value close to the true value can be obtained, which is also one of the important issues to be solved in this paper.
4. Construction of the Specified True Value Model In the fluid velocity measurement process, the state of the measuring pipe and the measuring
instrument are fixed. Therefore, when the fluid in the pipe reaches a stable and enough development, the single point measurement can be regarded as an equal precision measurement. The root mean square of the pulsating fluid velocity can be expressed as
2
0])([1)( ∑=
−=′ n
i nvivn
nu (7)
Where )(nu′ represents the fluctuation degree of the pulsation fluid velocity, and reflects the
turbulence intensity of the fluid in the pipe. When the flow field is in a stable and fully developed state, if the number of measurements is sufficient, both the average fluid velocity and the turbulence intensity tend to be fixed values. Therefore, the relative error of the average flow rate and the turbulence intensity measured were used to calculate the required number of measurements for the specified true value. The relative error formula is defined as follows
∞
∞−=
vvvn
vε (8)
)()()(
∞′∞′−′
=′ uunu
uε (9)
Where nv represents the average velocity of n measurements, ∞v represents the average velocity of ∞ measurements, )(nu′ and )(∞′u are the corresponding turbulence intensities. Obviously, when the number of repeated measurements is enough, the influence of the outliers on the overall turbulence intensity is gradually weakened, and the turbulence intensity is gradually stabilizing, tending to a certain fixed value. Similarly, the effect of outliers on the relative error of the average velocity and turbulence intensity are also decreasing. According to the relationship between
507507
turbulence intensity, the relative error and the number of measurements, the required number of measurements for calculating the specified true value can be obtained.
5. Experiment and Analysis 5.1 Determination of the Specified True Value
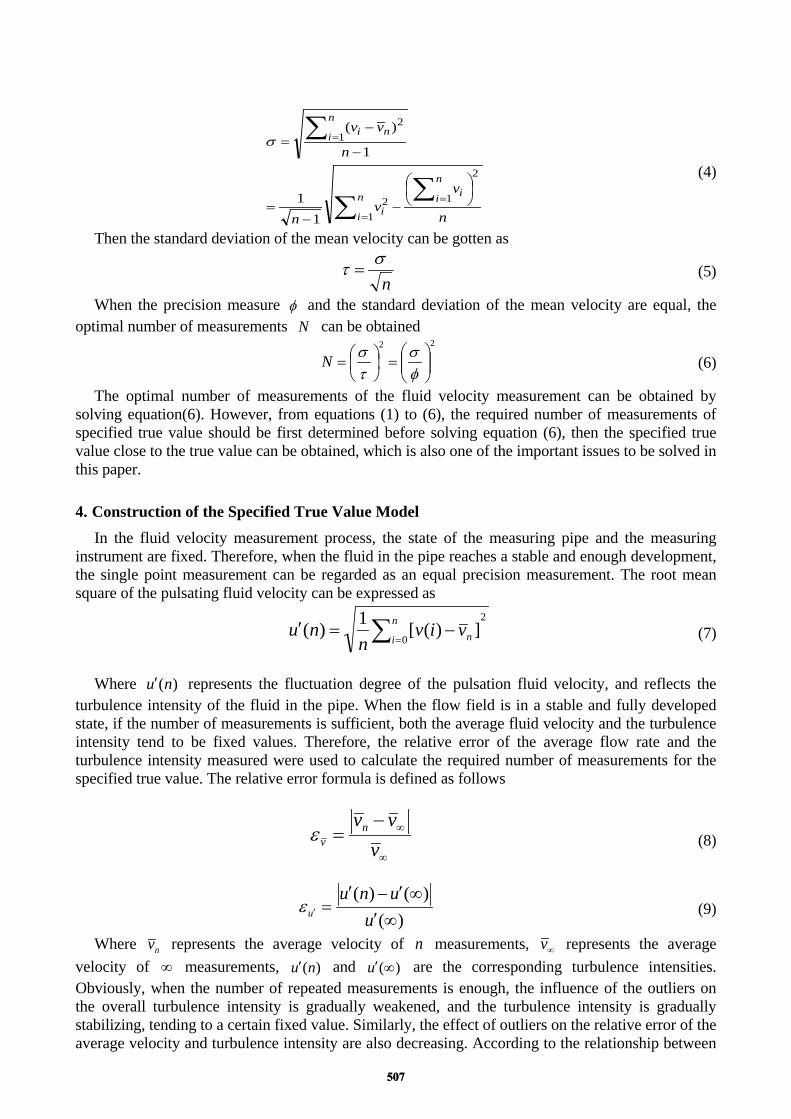
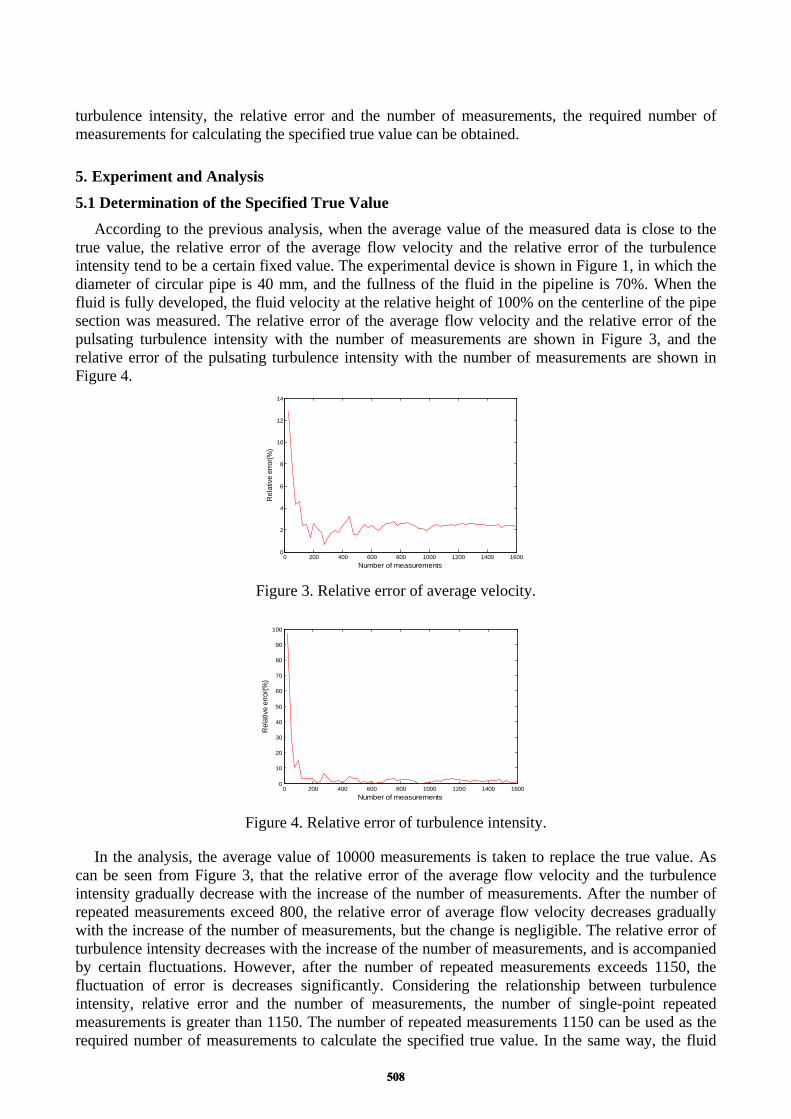
According to the previous analysis, when the average value of the measured data is close to the true value, the relative error of the average flow velocity and the relative error of the turbulence intensity tend to be a certain fixed value. The experimental device is shown in Figure 1, in which the diameter of circular pipe is 40 mm, and the fullness of the fluid in the pipeline is 70%. When the fluid is fully developed, the fluid velocity at the relative height of 100% on the centerline of the pipe section was measured. The relative error of the average flow velocity and the relative error of the pulsating turbulence intensity with the number of measurements are shown in Figure 3, and the relative error of the pulsating turbulence intensity with the number of measurements are shown in Figure 4.
Figure 3. Relative error of average velocity.
Figure 4. Relative error of turbulence intensity.
In the analysis, the average value of 10000 measurements is taken to replace the true value. As can be seen from Figure 3, that the relative error of the average flow velocity and the turbulence intensity gradually decrease with the increase of the number of measurements. After the number of repeated measurements exceed 800, the relative error of average flow velocity decreases gradually with the increase of the number of measurements, but the change is negligible. The relative error of turbulence intensity decreases with the increase of the number of measurements, and is accompanied by certain fluctuations. However, after the number of repeated measurements exceeds 1150, the fluctuation of error is decreases significantly. Considering the relationship between turbulence intensity, relative error and the number of measurements, the number of single-point repeated measurements is greater than 1150. The number of repeated measurements 1150 can be used as the required number of measurements to calculate the specified true value. In the same way, the fluid
0 200 400 600 800 1000 1200 1400 16000
2
4
6
8
10
12
14
Number of measurements
Rel
ativ
e er
ror(%
)
0 200 400 600 800 1000 1200 1400 16000
10
20
30
40
50
60
70
80
90
100
Number of measurements
Rel
ativ
e er
ror(%
)
508508
velocity of each measuring point is measured at the same pipe fullness, and the relative height of the measuring point is 20%~100% respectively. Then the required number of measurements to calculate the specified true value was obtained. The average velocity of measurements was compared with the average velocity of 10000 measurements, and the results are shown in Table 1.
Table 1. Required number of measurements to calculate the specified true value. Relative Height
(h/H) Required number of measurements to calculate the specified true
value Relative Errorδ (%)
20% 1800 0.69 30% 1600 0.71 40% 1000 0.25 50% 800 0.41 60% 600 0.98 70% 600 0.34 80% 600 0.25 90% 600 0.60
100% 1150 0.86
Where relative error10000
10000
vvvN −
=δ . From Table 1, in the measurement position close to the pipe
wall, more measurement is required to obtain the specified true value similar to measurements. On the fluid surface, due to the fluctuation of the fluid flow, more measurements are needed to obtain the specified true value, and the number of measurements at other positions is relatively small and stable.
5.2 Determination of the Optimal Number of Measurements According to formula (6), when the fluid fullness in the pipeline is 70%, the measured values
obtained at different heights on the pipeline section are analyzed. When the measurement accuracy is 0.5%, the optimal number of measurements at different heights from the pipe bottom are obtained. The results are shown in Table 2.
Table 2. Optimal number of measurements.
Measurement accuracy Relative Height (h/H) Optimal number of measurement N
0.5% 20% 1250 0.5% 30% 1102 0.5% 40% 757 0.5% 50% 566 0.5% 60% 434 0.5% 70% 234 0.5% 80% 148 0.5% 90% 122 0.5% 100% 821
From Table 2, near the pipe wall, the minimum number of measurements for a single point
measurement is the largest. On the free surface of the fluid, the minimum number of measurements for a single point measurement comes second, and the number of measurements at other positions is relatively small. Because in the vicinity of the pipe wall, the tracer particles collide and fraction with the pipe wall under the action of gravity, which makes the PIV velocimetry system requires more measurement data to make judgments. On the free surface of the fluid, due to the influence of secondary flow such as fluid up flow and vortex flow, the PIV measurement system also needs more measurement data to get more accurate results.
509509

6. Conclusion In this paper, the optimal number of measurements for velocity measurement using PIV particle
image velocimeter is studied. The required number of measurements to calculate the specified true value was emphasis analyzed, and the corresponding judgment basis was given. On this basis, the pair is single. The optimal number of measurements for single-point was also analyzed. The experimental results show that the proposed method can quickly determine the required number of measurements for specified true value. In the vicinity of the pipe wall and on the free surface of the fluid, the required number of measurements to calculate the specified true value is relatively large, and elsewhere is less. In the same measurement accuracy, the closer to the tube wall, the more optimal number of repeated measurements for a single point, and vice versa. Therefore, in the measurement, the required number of measurements to determine the specified true value is based on the number of measurements near the wall, and the optimal number of measurements at a single point is also based on the number of measurements near the wall.
Acknowledgements This work was supported by the Science and Technology Project of Education Department of the
Guangdong Province, China(2017GKTSCX079), and Science and Technology Project of Education Department of the Jiangxi Province, China (GJJ151069), and the Research Project of Zhongshan Polytechnic, China(2018G01).
References [1] Akçakaya M., Tarokh, V., 2008. “A frame construction and a universal distortion bound for sparse representations”. IEEE Trans Signal Process. vol 56, no. 6, pp. 2443–2450, Jun. [2] Binev, P., Cohen, A., Mula, O., Nichols, J. 2018. Greedy algorithms for optimal measurements selection in state estimation using reduced models. SIAM/ASA Journal on Uncertainty Quantification. vol 6, issue 3, pp:1101-1126. [3] Imer, O.C., Basar, T., 2010. Optimal estimation with limited measurements. International Journal of Systems, Control and Communications. vol 2, pp. 5-29. [4] Muscas, C., Pilo, F., Pisano, G., Sulis, S., 2007. Optimal number and location of measurement instruments in distributed systems for harmonic state estimation. Electrical Power Quality and Utilisation Journal. vol.13, pp.75-81. [5] Shahriar, M.S., Habiballah, I.O., Hussein, H., 2018. Optimization of phasor measurement unit (PMU) placement in supervisory control and data acquisition (SCADA)-based power system for better state-estimation performance. Energies. vol 11, 570. [6] Stojnic, M., Parvaresh F., Hassibi, B., 2009. On the reconstruction of block-sparse signals with an optimal number of measurements. IEEE Transactions on signal processing. vol 57, no 8, pp:3075-3085. [7] Vickers A.J., 2003. How many repeated measures in repeated measures designs? Statistical issues for comparative trials. BMC Medical Research Methodology. 3:22. [8] Yang, L., Wei D., Yonina, C.E., 2019. Optimal Number of Measurements in a Linear System with Quadratically Decreasing SNR. IEEE Transactions on Signal Processing. vol 67, pp. 2947-2959.
510510