PIV with LED: Particle Shadow Velocimetry (PSV)
10
American Institute of Aeronautics and Astronautics 1 PIV with LED: Particle Shadow Velocimetry (PSV) Jordi Estevadeordal* and Larry Goss** Innovative Scientific Solutions, Inc. 2766 Indian Ripple Rd., Dayton, OH 45440, USA A particle-shadow-velocimetry (PSV) technique that employs light sources with significantly lower power than lasers is introduced as a variant of particle-image velocimetry (PIV). The PSV technique uses a non-scattering approach that relies on direct in-line illumination by a pulsed source such as a light-emitting diode (LED) onto the camera imaging system. Narrow-depth-of-field optical setups are employed for imaging a two- dimensional plane within a flow volume, and images that resemble a “negative” or “inverse” of the standard PIV scattering mode are produced by casting particle shadows on a bright background. In this technique the amount of light reaching the image plane and the contrast of the seeding particles are significantly increased while requiring significantly lower power than scattering approaches. The limitations of the technique, its velocity ranges, and the setup parameters are discussed. I. Introduction ARTICLE-IMAGE VELOCIMETRY - (PIV) is a powerful diagnostic technique that is capable of providing accurate and resolved velocity fields in a variety of applications. High-speed PIV is becoming increasingly important with the emergence of high-speed laser sources and high-speed video cameras. 1 Most PIV techniques require laser light sources that are capable of high-power, short-duration pulses, allowing instantaneous marking of seed particles and capture of their scattered light by an imaging system. Presently lasers are the most expensive component in PIV systems, despite their relatively slow repetition rates in their commercial form. High-speed PIV is even more costly since it also requires expensive high-speed cameras. In the present paper an alternative approach, particle-shadow velocimetry (PSV), is introduced, which allows low-power illumination sources such as LEDs to be used for PIV in many applications. LEDs are inexpensive and can be pulsed to nanosecond levels and at high-repetition rates; 2 their use is proposed here for applications to PIV measurements in various fields of view and over various velocity ranges. The PSV technique has further advantages with respect to laser-based PIV because it produces no glare or reflections from surfaces; since LEDs of many monochromatic wavelengths are available, two-color PIV and multicolor PIV is also feasible. Applications of the technique for large areas through the use of LED clusters to increase short-pulses brightness and strategies for controlling the depth of field for imaging a two-dimensional (2D) plane will be also discussed. One of the main aims of this research is to develop a technique for use in large-scale, high-speed wind-tunnel applications that can accommodate direct illumination. A schematic of the LED setup for one such application, a transonic-cascade experiment, 3 is shown in Fig. 1. The small size of the LED light-source units and their relatively simple wiring also make them attractive and feasible for optical diagnostics inside turbomachines. II. Particle-Shadow Velocimetry (PSV) The PSV technique is a variant of PIV that utilizes direct in-line volume illumination and an imaging-optics setup that produces a narrow depth-of-field (DOF) for 2D plane imaging. ____________________________________ * Senior Research Engineer, ISSI, 2766 Indian Ripple Rd., Dayton, OH 45440, Associate Fellow. ** President, ISSI, 2766 Indian Ripple Rd., Dayton, OH 45440, Associate Fellow. P
Transcript of PIV with LED: Particle Shadow Velocimetry (PSV)
American Institute of Aeronautics and Astronautics1
PIV with LED: Particle Shadow Velocimetry (PSV)
Jordi Estevadeordal* and Larry Goss**Innovative Scientific Solutions, Inc.
2766 Indian Ripple Rd.,Dayton, OH 45440, USA
A particle-shadow-velocimetry (PSV) technique that employs light sources withsignificantly lower power than lasers is introduced as a variant of particle-image velocimetry(PIV). The PSV technique uses a non-scattering approach that relies on direct in-lineillumination by a pulsed source such as a light-emitting diode (LED) onto the cameraimaging system. Narrow-depth-of-field optical setups are employed for imaging a two-dimensional plane within a flow volume, and images that resemble a “negative” or “inverse”of the standard PIV scattering mode are produced by casting particle shadows on a brightbackground. In this technique the amount of light reaching the image plane and thecontrast of the seeding particles are significantly increased while requiring significantlylower power than scattering approaches. The limitations of the technique, its velocityranges, and the setup parameters are discussed.
I. IntroductionARTICLE-IMAGE VELOCIMETRY - (PIV) is a powerful diagnostic technique that is capable of providingaccurate and resolved velocity fields in a variety of applications. High-speed PIV is becoming increasingly
important with the emergence of high-speed laser sources and high-speed video cameras.1 Most PIV techniquesrequire laser light sources that are capable of high-power, short-duration pulses, allowing instantaneous marking ofseed particles and capture of their scattered light by an imaging system. Presently lasers are the most expensivecomponent in PIV systems, despite their relatively slow repetition rates in their commercial form. High-speed PIVis even more costly since it also requires expensive high-speed cameras.
In the present paper an alternative approach, particle-shadow velocimetry (PSV), is introduced, which allowslow-power illumination sources such as LEDs to be used for PIV in many applications. LEDs are inexpensive andcan be pulsed to nanosecond levels and at high-repetition rates;2 their use is proposed here for applications to PIVmeasurements in various fields of view and over various velocity ranges. The PSV technique has further advantageswith respect to laser-based PIV because it produces no glare or reflections from surfaces; since LEDs of manymonochromatic wavelengths are available, two-color PIV and multicolor PIV is also feasible.
Applications of the technique for large areas through the use of LED clusters to increase short-pulses brightnessand strategies for controlling the depth of field for imaging a two-dimensional (2D) plane will be also discussed.
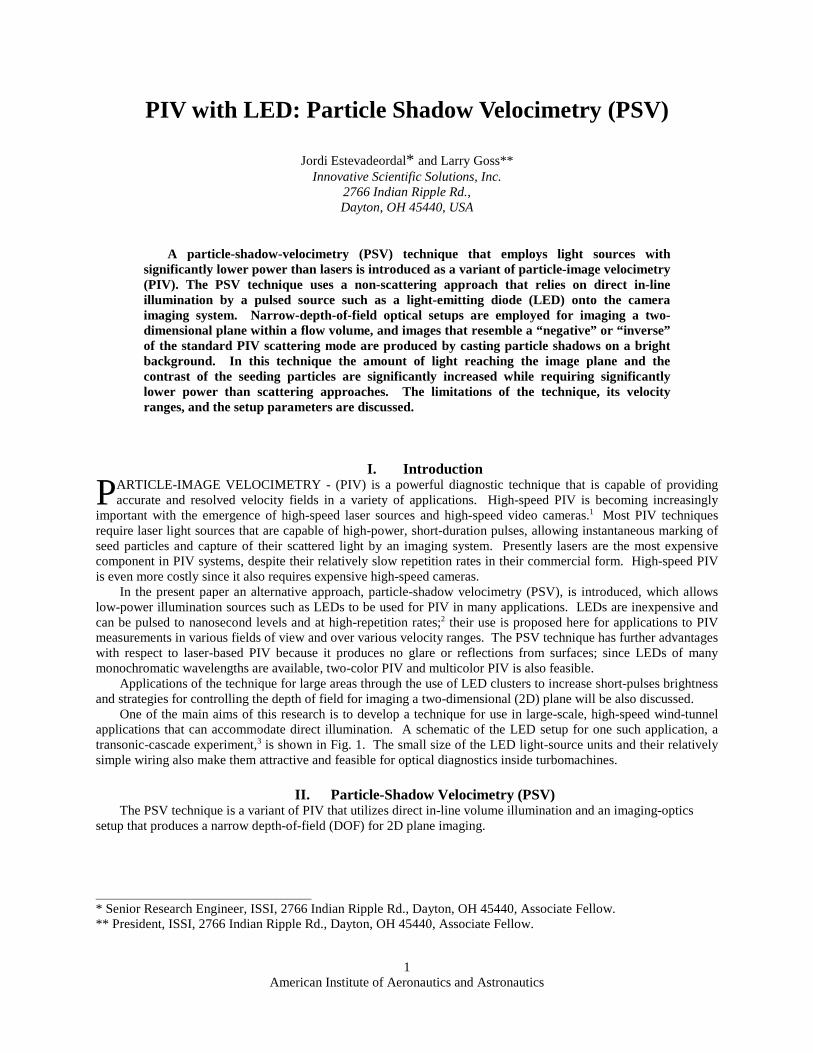
One of the main aims of this research is to develop a technique for use in large-scale, high-speed wind-tunnelapplications that can accommodate direct illumination. A schematic of the LED setup for one such application, atransonic-cascade experiment,3 is shown in Fig. 1. The small size of the LED light-source units and their relativelysimple wiring also make them attractive and feasible for optical diagnostics inside turbomachines.
II. Particle-Shadow Velocimetry (PSV)The PSV technique is a variant of PIV that utilizes direct in-line volume illumination and an imaging-optics
setup that produces a narrow depth-of-field (DOF) for 2D plane imaging.
____________________________________* Senior Research Engineer, ISSI, 2766 Indian Ripple Rd., Dayton, OH 45440, Associate Fellow.** President, ISSI, 2766 Indian Ripple Rd., Dayton, OH 45440, Associate Fellow.
P
American Institute of Aeronautics and Astronautics2
Fig. 1 LED substitutes the laser in transonic-cascade experiment. Narrow DOF imaging substitutes the laser-sheet thickness.
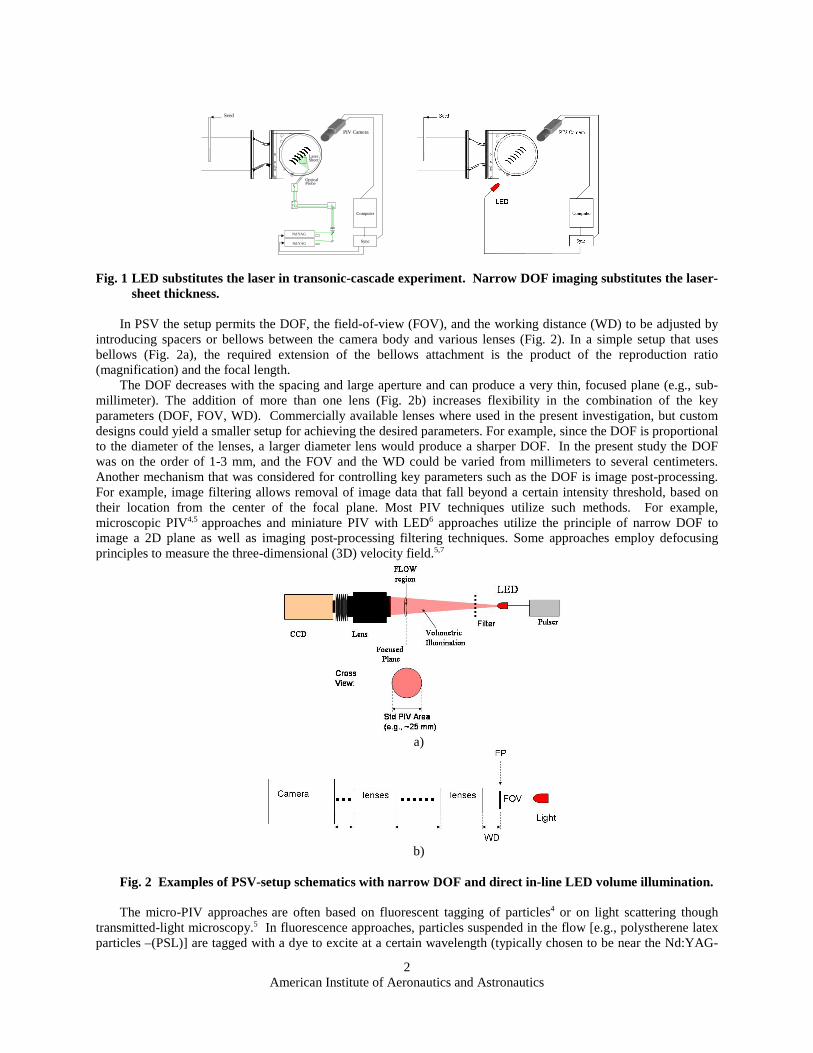
In PSV the setup permits the DOF, the field-of-view (FOV), and the working distance (WD) to be adjusted byintroducing spacers or bellows between the camera body and various lenses (Fig. 2). In a simple setup that usesbellows (Fig. 2a), the required extension of the bellows attachment is the product of the reproduction ratio(magnification) and the focal length.
The DOF decreases with the spacing and large aperture and can produce a very thin, focused plane (e.g., sub-millimeter). The addition of more than one lens (Fig. 2b) increases flexibility in the combination of the keyparameters (DOF, FOV, WD). Commercially available lenses where used in the present investigation, but customdesigns could yield a smaller setup for achieving the desired parameters. For example, since the DOF is proportionalto the diameter of the lenses, a larger diameter lens would produce a sharper DOF. In the present study the DOFwas on the order of 1-3 mm, and the FOV and the WD could be varied from millimeters to several centimeters.Another mechanism that was considered for controlling key parameters such as the DOF is image post-processing.For example, image filtering allows removal of image data that fall beyond a certain intensity threshold, based ontheir location from the center of the focal plane. Most PIV techniques utilize such methods. For example,microscopic PIV4,5 approaches and miniature PIV with LED6 approaches utilize the principle of narrow DOF toimage a 2D plane as well as imaging post-processing filtering techniques. Some approaches employ defocusingprinciples to measure the three-dimensional (3D) velocity field.5,7
a)
b)
Fig. 2 Examples of PSV-setup schematics with narrow DOF and direct in-line LED volume illumination.
The micro-PIV approaches are often based on fluorescent tagging of particles4 or on light scattering thoughtransmitted-light microscopy.5 In fluorescence approaches, particles suspended in the flow [e.g., polystherene latexparticles –(PSL)] are tagged with a dye to excite at a certain wavelength (typically chosen to be near the Nd:YAG-
LaserSheet
OpticalProbe
Nd:YAG
Nd:YAG
Sync
Computer
PIV Camera
Seed
American Institute of Aeronautics and Astronautics3
laser wavelengths) and emit at another. In transmitted-light techniques, the light is transmitted from a source on theside of the specimen that is opposite the objective and passed through a condenser to focus it on the specimen for obtaining very high illumination. After the light passes through the specimen, the image of the specimen goesthrough the objective lens and to the oculars, where the enlarged image is viewed. The most widely used setup forproper specimen illumination and image generation is known as Köhler illumination, and there the micro-PIVapplications rely on scattering.
The miniature approach of PIV with LED found in the literature6 discusses various setups and results fromforward, backward, and side scattering. Because of weak scattering from the LED, the technique is applied only tosmall areas. In other approaches such as holography, scattering and its interaction with the background light is ofmajor importance when using coherent laser light.8-12
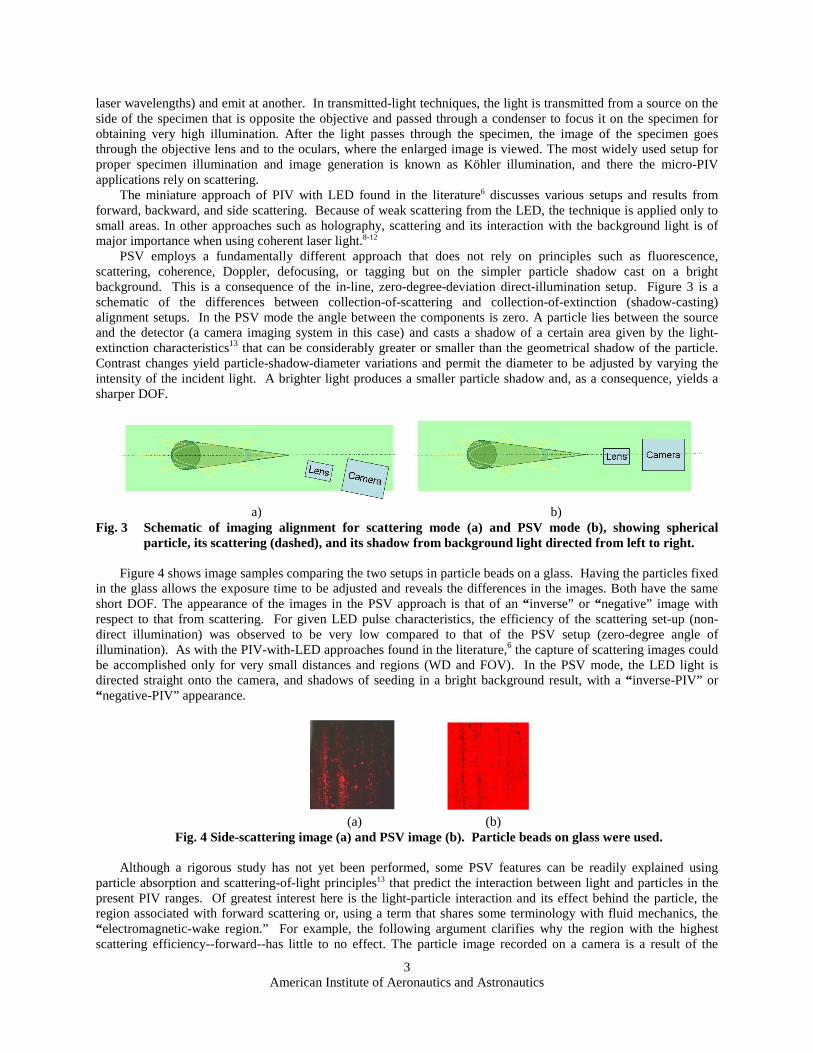
PSV employs a fundamentally different approach that does not rely on principles such as fluorescence,scattering, coherence, Doppler, defocusing, or tagging but on the simpler particle shadow cast on a brightbackground. This is a consequence of the in-line, zero-degree-deviation direct-illumination setup. Figure 3 is aschematic of the differences between collection-of-scattering and collection-of-extinction (shadow-casting)alignment setups. In the PSV mode the angle between the components is zero. A particle lies between the sourceand the detector (a camera imaging system in this case) and casts a shadow of a certain area given by the light-extinction characteristics13 that can be considerably greater or smaller than the geometrical shadow of the particle.Contrast changes yield particle-shadow-diameter variations and permit the diameter to be adjusted by varying theintensity of the incident light. A brighter light produces a smaller particle shadow and, as a consequence, yields asharper DOF.
a) b)Fig. 3 Schematic of imaging alignment for scattering mode (a) and PSV mode (b), showing spherical
particle, its scattering (dashed), and its shadow from background light directed from left to right.
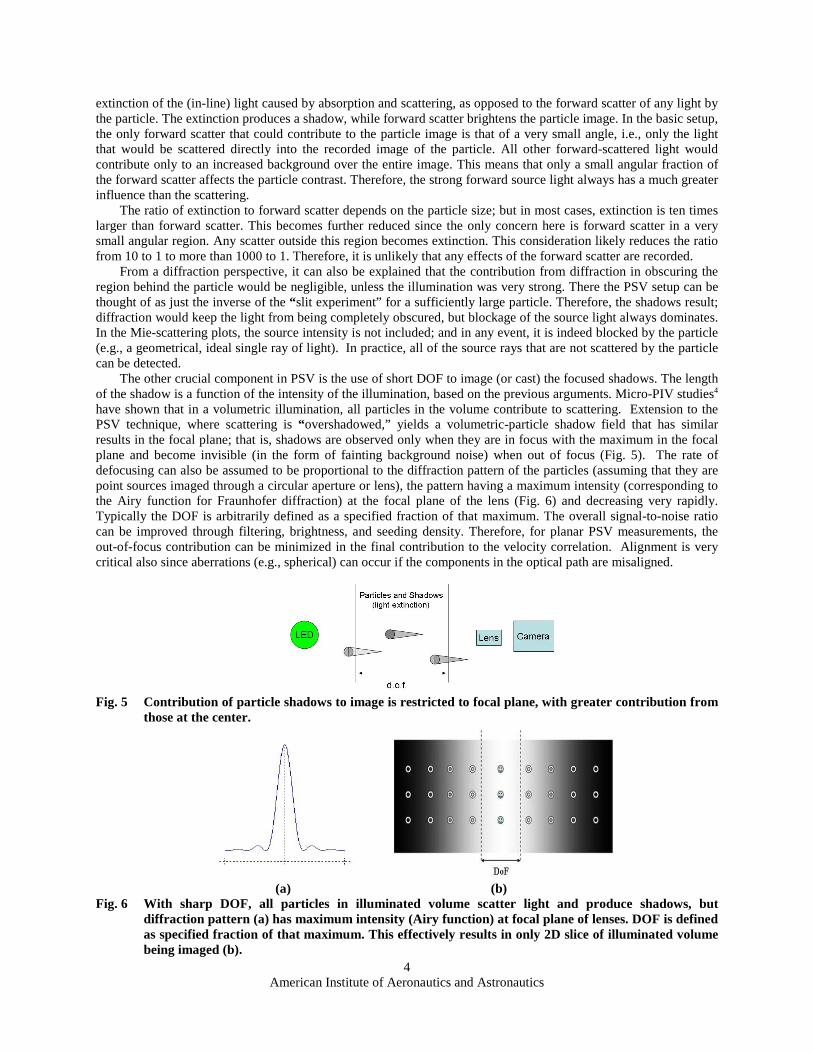
Figure 4 shows image samples comparing the two setups in particle beads on a glass. Having the particles fixedin the glass allows the exposure time to be adjusted and reveals the differences in the images. Both have the sameshort DOF. The appearance of the images in the PSV approach is that of an “inverse” or “negative” image withrespect to that from scattering. For given LED pulse characteristics, the efficiency of the scattering set-up (non-direct illumination) was observed to be very low compared to that of the PSV setup (zero-degree angle ofillumination). As with the PIV-with-LED approaches found in the literature,6 the capture of scattering images couldbe accomplished only for very small distances and regions (WD and FOV). In the PSV mode, the LED light isdirected straight onto the camera, and shadows of seeding in a bright background result, with a “inverse-PIV” or“negative-PIV” appearance.
(a) (b)Fig. 4 Side-scattering image (a) and PSV image (b). Particle beads on glass were used.
Although a rigorous study has not yet been performed, some PSV features can be readily explained usingparticle absorption and scattering-of-light principles13 that predict the interaction between light and particles in thepresent PIV ranges. Of greatest interest here is the light-particle interaction and its effect behind the particle, theregion associated with forward scattering or, using a term that shares some terminology with fluid mechanics, the“electromagnetic-wake region.” For example, the following argument clarifies why the region with the highestscattering efficiency--forward--has little to no effect. The particle image recorded on a camera is a result of the
American Institute of Aeronautics and Astronautics4
extinction of the (in-line) light caused by absorption and scattering, as opposed to the forward scatter of any light bythe particle. The extinction produces a shadow, while forward scatter brightens the particle image. In the basic setup,the only forward scatter that could contribute to the particle image is that of a very small angle, i.e., only the lightthat would be scattered directly into the recorded image of the particle. All other forward-scattered light wouldcontribute only to an increased background over the entire image. This means that only a small angular fraction ofthe forward scatter affects the particle contrast. Therefore, the strong forward source light always has a much greaterinfluence than the scattering.
The ratio of extinction to forward scatter depends on the particle size; but in most cases, extinction is ten timeslarger than forward scatter. This becomes further reduced since the only concern here is forward scatter in a verysmall angular region. Any scatter outside this region becomes extinction. This consideration likely reduces the ratiofrom 10 to 1 to more than 1000 to 1. Therefore, it is unlikely that any effects of the forward scatter are recorded.
From a diffraction perspective, it can also be explained that the contribution from diffraction in obscuring theregion behind the particle would be negligible, unless the illumination was very strong. There the PSV setup can bethought of as just the inverse of the “slit experiment” for a sufficiently large particle. Therefore, the shadows result;diffraction would keep the light from being completely obscured, but blockage of the source light always dominates.In the Mie-scattering plots, the source intensity is not included; and in any event, it is indeed blocked by the particle(e.g., a geometrical, ideal single ray of light). In practice, all of the source rays that are not scattered by the particlecan be detected.
The other crucial component in PSV is the use of short DOF to image (or cast) the focused shadows. The lengthof the shadow is a function of the intensity of the illumination, based on the previous arguments. Micro-PIV studies4
have shown that in a volumetric illumination, all particles in the volume contribute to scattering. Extension to thePSV technique, where scattering is “overshadowed,” yields a volumetric-particle shadow field that has similarresults in the focal plane; that is, shadows are observed only when they are in focus with the maximum in the focalplane and become invisible (in the form of fainting background noise) when out of focus (Fig. 5). The rate ofdefocusing can also be assumed to be proportional to the diffraction pattern of the particles (assuming that they arepoint sources imaged through a circular aperture or lens), the pattern having a maximum intensity (corresponding tothe Airy function for Fraunhofer diffraction) at the focal plane of the lens (Fig. 6) and decreasing very rapidly.Typically the DOF is arbitrarily defined as a specified fraction of that maximum. The overall signal-to-noise ratiocan be improved through filtering, brightness, and seeding density. Therefore, for planar PSV measurements, theout-of-focus contribution can be minimized in the final contribution to the velocity correlation. Alignment is verycritical also since aberrations (e.g., spherical) can occur if the components in the optical path are misaligned.
Fig. 5 Contribution of particle shadows to image is restricted to focal plane, with greater contribution fromthose at the center.
(a) (b)Fig. 6 With sharp DOF, all particles in illuminated volume scatter light and produce shadows, but
diffraction pattern (a) has maximum intensity (Airy function) at focal plane of lenses. DOF is definedas specified fraction of that maximum. This effectively results in only 2D slice of illuminated volumebeing imaged (b).
American Institute of Aeronautics and Astronautics5
In PIV, velocity is found by calculating the particle ensemble displacements between two instantaneous timesnap-shots, which is generally accomplished through correlation techniques such as using FFT on the image signal.The signal information is generated from changes in intensities; therefore, the same technique can be used for PSVsince it is based on information from particle ensembles, although the intensity information is inverted to that fromPIV. A subtle difference is that in PIV the particles intensities have a shape such as Gaussian whereas in PSV thisshape has not been determined yet and depends on the aforementioned light-particle interaction characteristics.Although this appears to have a negligible effect (e.g., in the correlation peak finding) the method has beencalibrated for accuracy as will be explained in the following section. Moreover, since the interest is in the shift ordisplacement between two signals rather than the signal characteristics themselves, techniques such correlation areapplicable to that effect. The PSV image with particles having the lowest intensity compared to the maximumintensity of the background can be readily inverted and generate a PIV-like signal if desired, as will be shown in thefollowing section.
III. ResultsIn this section some results pertaining to the PSV technique are presented to proof the concept validity and
feasibility. First, some samples of LED pulses are displayed, together with some applications showing theircapabilities; next, images from a variety of particles and conditions are compared; then, some results from filteringtechniques are presented; and finally, some results of flow tests with jets in water and air for several particle sizesand shapes are presented.
The fact that the LED can be pulsed at any rate made it very attractive for velocimetry. This capability is notshared by other sources like lasers or Nanopulsers2 which generally have lower and fixed repetition rates (althoughshorter pulses at present). Pulses from LEDs that were used ranged from tenths of nanoseconds to microseconds.The choice of pulse depends on the velocity of the flow and the magnification, and the pulse must be sufficientlyshort to freeze the motion while providing sufficient illumination. The red LED is preferred since the CCD camerahas its higher spectral sensitivity in the upper-red region. However, an available blue cluster (ISSI) was used toobtain most of the present results because it provided brighter shorter pulses. A red LED cluster will be tested in thefuture in attempts to gain more efficiency and shorter pulses that would be a requirement in many transonic andhigher speed applications. A single LED can be also used if the velocity ranges and other parametes (WD, FOV) areappropriate.
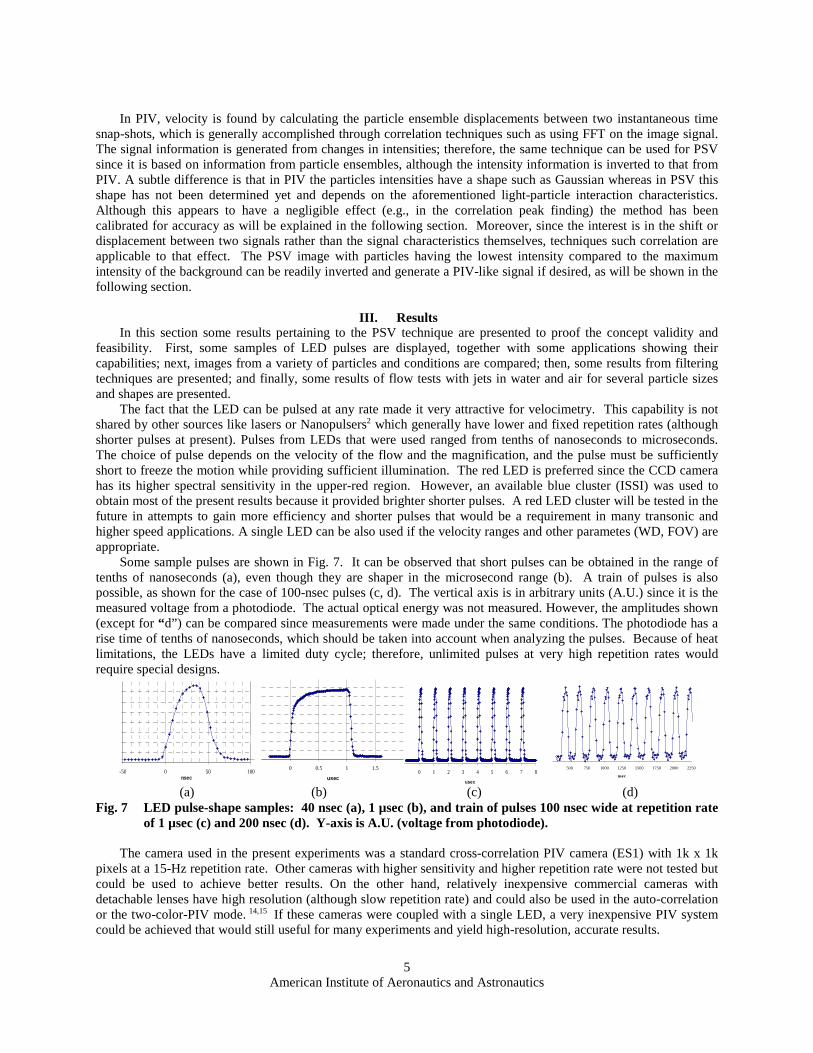
Some sample pulses are shown in Fig. 7. It can be observed that short pulses can be obtained in the range oftenths of nanoseconds (a), even though they are shaper in the microsecond range (b). A train of pulses is alsopossible, as shown for the case of 100-nsec pulses (c, d). The vertical axis is in arbitrary units (A.U.) since it is themeasured voltage from a photodiode. The actual optical energy was not measured. However, the amplitudes shown(except for “d”) can be compared since measurements were made under the same conditions. The photodiode has arise time of tenths of nanoseconds, which should be taken into account when analyzing the pulses. Because of heatlimitations, the LEDs have a limited duty cycle; therefore, unlimited pulses at very high repetition rates wouldrequire special designs.
-50 0 50 100nsec
0 0.5 1 1.5
usec0 1 2 3 4 5 6 7 8
usec
500 750 1000 1250 1500 1750 2000 2250
nsec
(a) (b) (c) (d)Fig. 7 LED pulse-shape samples: 40 nsec (a), 1 µsec (b), and train of pulses 100 nsec wide at repetition rate
of 1 µsec (c) and 200 nsec (d). Y-axis is A.U. (voltage from photodiode).
The camera used in the present experiments was a standard cross-correlation PIV camera (ES1) with 1k x 1kpixels at a 15-Hz repetition rate. Other cameras with higher sensitivity and higher repetition rate were not tested butcould be used to achieve better results. On the other hand, relatively inexpensive commercial cameras withdetachable lenses have high resolution (although slow repetition rate) and could also be used in the auto-correlationor the two-color-PIV mode. 14,15 If these cameras were coupled with a single LED, a very inexpensive PIV systemcould be achieved that would still useful for many experiments and yield high-resolution, accurate results.
American Institute of Aeronautics and Astronautics6
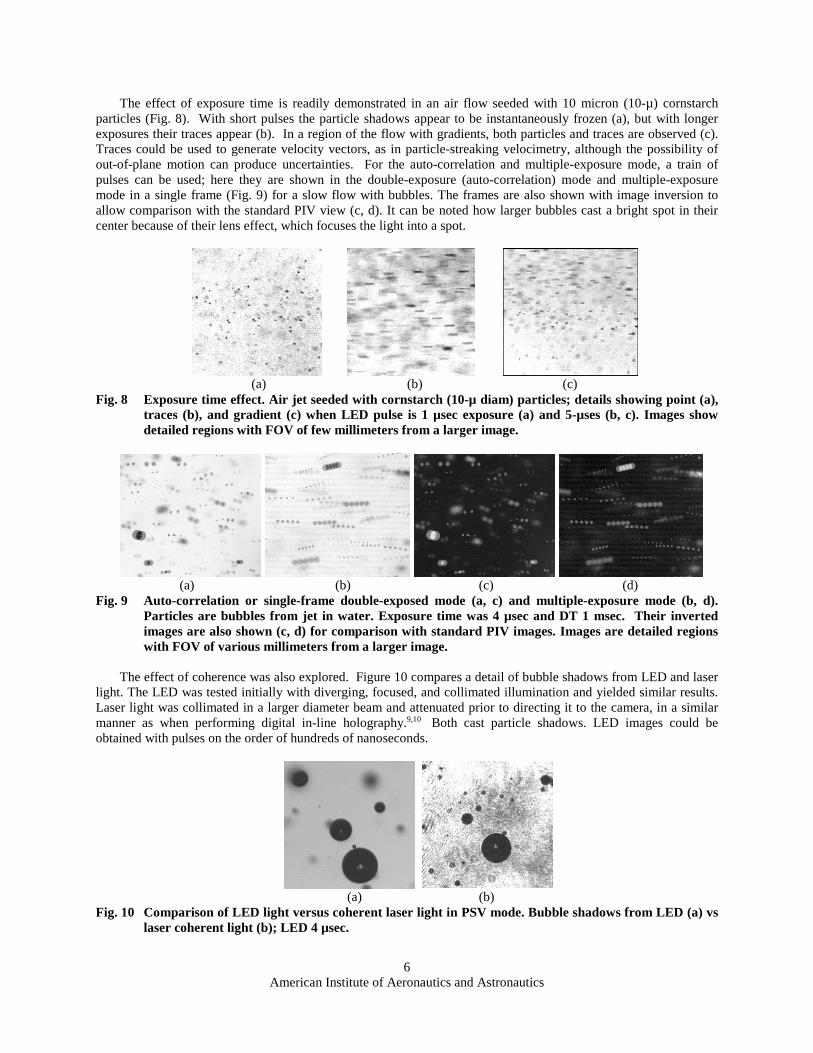
The effect of exposure time is readily demonstrated in an air flow seeded with 10 micron (10-µ) cornstarchparticles (Fig. 8). With short pulses the particle shadows appear to be instantaneously frozen (a), but with longerexposures their traces appear (b). In a region of the flow with gradients, both particles and traces are observed (c).Traces could be used to generate velocity vectors, as in particle-streaking velocimetry, although the possibility ofout-of-plane motion can produce uncertainties. For the auto-correlation and multiple-exposure mode, a train ofpulses can be used; here they are shown in the double-exposure (auto-correlation) mode and multiple-exposuremode in a single frame (Fig. 9) for a slow flow with bubbles. The frames are also shown with image inversion toallow comparison with the standard PIV view (c, d). It can be noted how larger bubbles cast a bright spot in theircenter because of their lens effect, which focuses the light into a spot.
(a) (b) (c)Fig. 8 Exposure time effect. Air jet seeded with cornstarch (10-µ diam) particles; details showing point (a),
traces (b), and gradient (c) when LED pulse is 1 µsec exposure (a) and 5-µses (b, c). Images showdetailed regions with FOV of few millimeters from a larger image.
(a) (b) (c) (d)Fig. 9 Auto-correlation or single-frame double-exposed mode (a, c) and multiple-exposure mode (b, d).
Particles are bubbles from jet in water. Exposure time was 4 µsec and DT 1 msec. Their invertedimages are also shown (c, d) for comparison with standard PIV images. Images are detailed regionswith FOV of various millimeters from a larger image.
The effect of coherence was also explored. Figure 10 compares a detail of bubble shadows from LED and laserlight. The LED was tested initially with diverging, focused, and collimated illumination and yielded similar results.Laser light was collimated in a larger diameter beam and attenuated prior to directing it to the camera, in a similarmanner as when performing digital in-line holography.9,10 Both cast particle shadows. LED images could beobtained with pulses on the order of hundreds of nanoseconds.
(a) (b)Fig. 10 Comparison of LED light versus coherent laser light in PSV mode. Bubble shadows from LED (a) vs
laser coherent light (b); LED 4 µsec.
American Institute of Aeronautics and Astronautics7
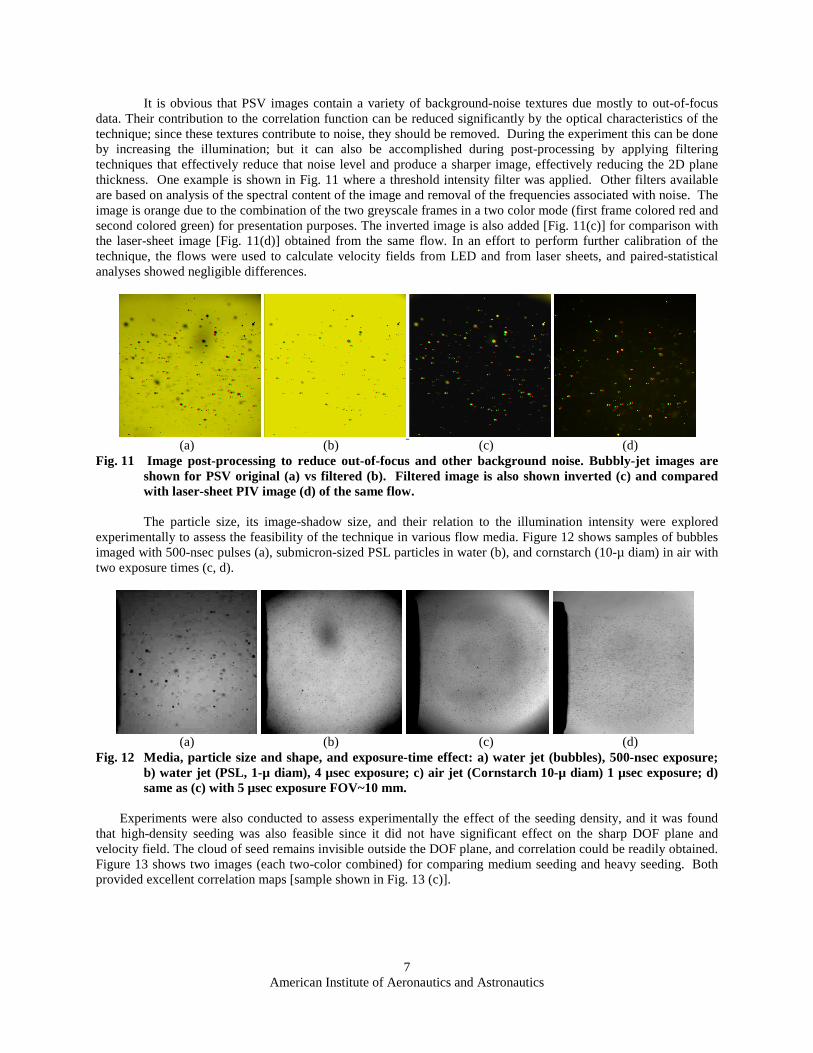
It is obvious that PSV images contain a variety of background-noise textures due mostly to out-of-focusdata. Their contribution to the correlation function can be reduced significantly by the optical characteristics of thetechnique; since these textures contribute to noise, they should be removed. During the experiment this can be doneby increasing the illumination; but it can also be accomplished during post-processing by applying filteringtechniques that effectively reduce that noise level and produce a sharper image, effectively reducing the 2D planethickness. One example is shown in Fig. 11 where a threshold intensity filter was applied. Other filters availableare based on analysis of the spectral content of the image and removal of the frequencies associated with noise. Theimage is orange due to the combination of the two greyscale frames in a two color mode (first frame colored red andsecond colored green) for presentation purposes. The inverted image is also added [Fig. 11(c)] for comparison withthe laser-sheet image [Fig. 11(d)] obtained from the same flow. In an effort to perform further calibration of thetechnique, the flows were used to calculate velocity fields from LED and from laser sheets, and paired-statisticalanalyses showed negligible differences.
(a) (b) (c) (d)Fig. 11 Image post-processing to reduce out-of-focus and other background noise. Bubbly-jet images are
shown for PSV original (a) vs filtered (b). Filtered image is also shown inverted (c) and comparedwith laser-sheet PIV image (d) of the same flow.
The particle size, its image-shadow size, and their relation to the illumination intensity were exploredexperimentally to assess the feasibility of the technique in various flow media. Figure 12 shows samples of bubblesimaged with 500-nsec pulses (a), submicron-sized PSL particles in water (b), and cornstarch (10-µ diam) in air withtwo exposure times (c, d).
(a) (b) (c) (d)Fig. 12 Media, particle size and shape, and exposure-time effect: a) water jet (bubbles), 500-nsec exposure;
b) water jet (PSL, 1-µ diam), 4 µsec exposure; c) air jet (Cornstarch 10-µ diam) 1 µsec exposure; d)same as (c) with 5 µsec exposure FOV~10 mm.
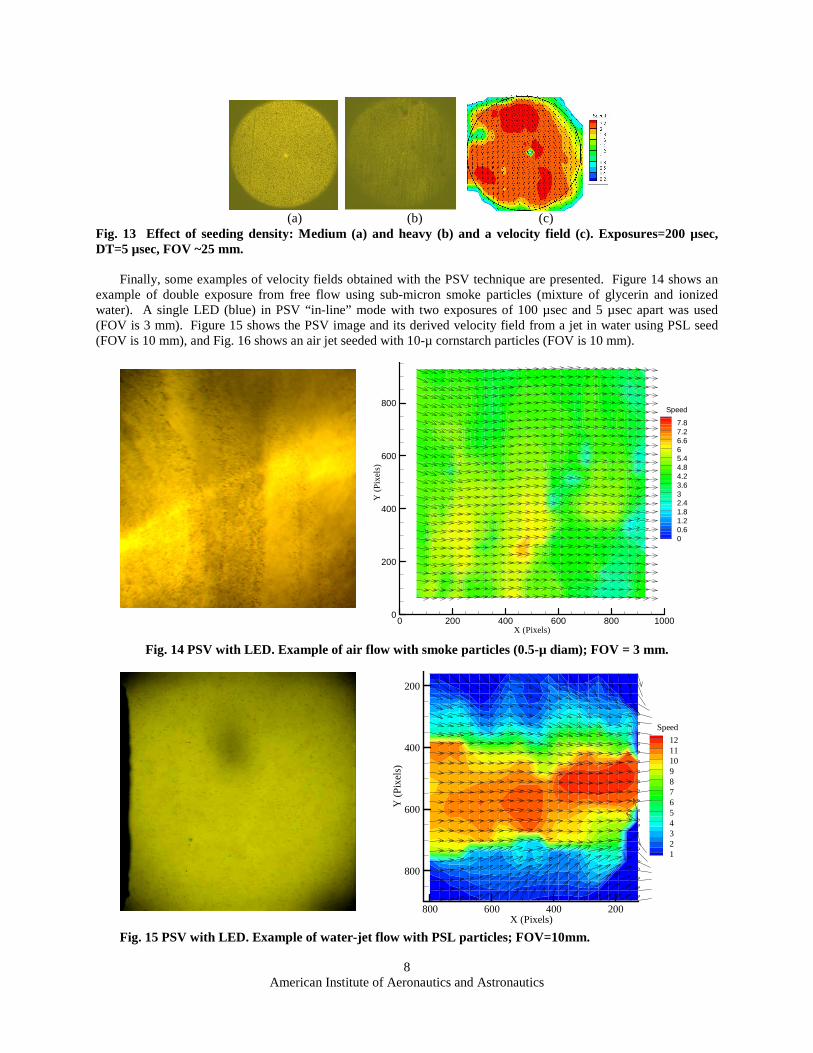
Experiments were also conducted to assess experimentally the effect of the seeding density, and it was foundthat high-density seeding was also feasible since it did not have significant effect on the sharp DOF plane andvelocity field. The cloud of seed remains invisible outside the DOF plane, and correlation could be readily obtained.Figure 13 shows two images (each two-color combined) for comparing medium seeding and heavy seeding. Bothprovided excellent correlation maps [sample shown in Fig. 13 (c)].
American Institute of Aeronautics and Astronautics8
(a) (b) (c)Fig. 13 Effect of seeding density: Medium (a) and heavy (b) and a velocity field (c). Exposures=200 µsec,DT=5 µsec, FOV ~25 mm.
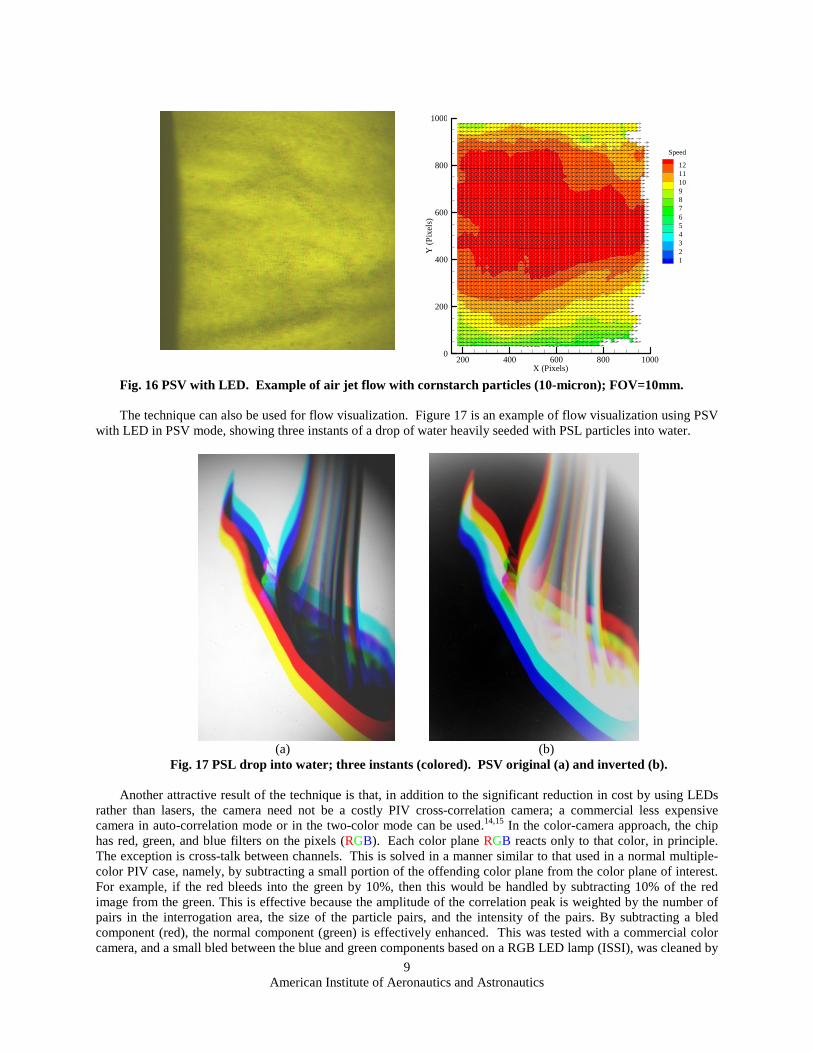
Finally, some examples of velocity fields obtained with the PSV technique are presented. Figure 14 shows anexample of double exposure from free flow using sub-micron smoke particles (mixture of glycerin and ionizedwater). A single LED (blue) in PSV “in-line” mode with two exposures of 100 µsec and 5 µsec apart was used(FOV is 3 mm). Figure 15 shows the PSV image and its derived velocity field from a jet in water using PSL seed(FOV is 10 mm), and Fig. 16 shows an air jet seeded with 10-µ cornstarch particles (FOV is 10 mm).
X (Pixels)
Y(P
ixel
s)
0 200 400 600 800 10000
200
400
600
800Speed
7.87.26.665.44.84.23.632.41.81.20.60
Fig. 14 PSV with LED. Example of air flow with smoke particles (0.5-µ diam); FOV = 3 mm.
X (Pixels)
Y(P
ixel
s)
200400600800
200
400
600
800
Speed
121110987654321
Fig. 15 PSV with LED. Example of water-jet flow with PSL particles; FOV=10mm.
American Institute of Aeronautics and Astronautics9
X (Pixels)
Y(P
ixel
s)
200 400 600 800 10000
200
400
600
800
1000
Speed
121110987654321
Fig. 16 PSV with LED. Example of air jet flow with cornstarch particles (10-micron); FOV=10mm.
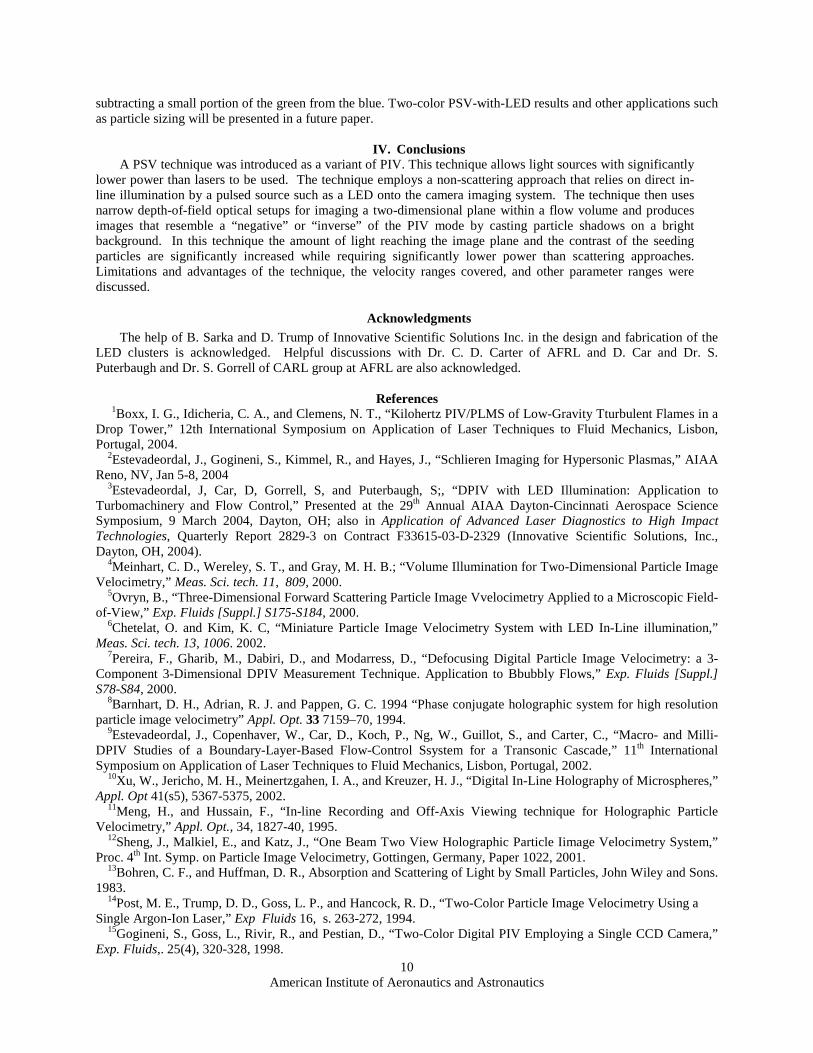
The technique can also be used for flow visualization. Figure 17 is an example of flow visualization using PSVwith LED in PSV mode, showing three instants of a drop of water heavily seeded with PSL particles into water.
(a) (b)Fig. 17 PSL drop into water; three instants (colored). PSV original (a) and inverted (b).
Another attractive result of the technique is that, in addition to the significant reduction in cost by using LEDsrather than lasers, the camera need not be a costly PIV cross-correlation camera; a commercial less expensivecamera in auto-correlation mode or in the two-color mode can be used.14,15 In the color-camera approach, the chiphas red, green, and blue filters on the pixels (RGB). Each color plane RGB reacts only to that color, in principle.The exception is cross-talk between channels. This is solved in a manner similar to that used in a normal multiple-color PIV case, namely, by subtracting a small portion of the offending color plane from the color plane of interest.For example, if the red bleeds into the green by 10%, then this would be handled by subtracting 10% of the redimage from the green. This is effective because the amplitude of the correlation peak is weighted by the number ofpairs in the interrogation area, the size of the particle pairs, and the intensity of the pairs. By subtracting a bledcomponent (red), the normal component (green) is effectively enhanced. This was tested with a commercial colorcamera, and a small bled between the blue and green components based on a RGB LED lamp (ISSI), was cleaned by
American Institute of Aeronautics and Astronautics10
subtracting a small portion of the green from the blue. Two-color PSV-with-LED results and other applications suchas particle sizing will be presented in a future paper.
IV. ConclusionsA PSV technique was introduced as a variant of PIV. This technique allows light sources with significantly
lower power than lasers to be used. The technique employs a non-scattering approach that relies on direct in-line illumination by a pulsed source such as a LED onto the camera imaging system. The technique then usesnarrow depth-of-field optical setups for imaging a two-dimensional plane within a flow volume and producesimages that resemble a “negative” or “inverse” of the PIV mode by casting particle shadows on a brightbackground. In this technique the amount of light reaching the image plane and the contrast of the seedingparticles are significantly increased while requiring significantly lower power than scattering approaches.Limitations and advantages of the technique, the velocity ranges covered, and other parameter ranges werediscussed.
AcknowledgmentsThe help of B. Sarka and D. Trump of Innovative Scientific Solutions Inc. in the design and fabrication of the
LED clusters is acknowledged. Helpful discussions with Dr. C. D. Carter of AFRL and D. Car and Dr. S.Puterbaugh and Dr. S. Gorrell of CARL group at AFRL are also acknowledged.
References1Boxx, I. G., Idicheria, C. A., and Clemens, N. T., “Kilohertz PIV/PLMS of Low-Gravity Tturbulent Flames in a
Drop Tower,” 12th International Symposium on Application of Laser Techniques to Fluid Mechanics, Lisbon,Portugal, 2004.
2Estevadeordal, J., Gogineni, S., Kimmel, R., and Hayes, J., “Schlieren Imaging for Hypersonic Plasmas,” AIAAReno, NV, Jan 5-8, 2004
3Estevadeordal, J, Car, D, Gorrell, S, and Puterbaugh, S;, “DPIV with LED Illumination: Application toTurbomachinery and Flow Control,” Presented at the 29th Annual AIAA Dayton-Cincinnati Aerospace ScienceSymposium, 9 March 2004, Dayton, OH; also in Application of Advanced Laser Diagnostics to High ImpactTechnologies, Quarterly Report 2829-3 on Contract F33615-03-D-2329 (Innovative Scientific Solutions, Inc.,Dayton, OH, 2004).
4Meinhart, C. D., Wereley, S. T., and Gray, M. H. B.; “Volume Illumination for Two-Dimensional Particle ImageVelocimetry,” Meas. Sci. tech. 11, 809, 2000.
5Ovryn, B., “Three-Dimensional Forward Scattering Particle Image Vvelocimetry Applied to a Microscopic Field-of-View,” Exp. Fluids [Suppl.] S175-S184, 2000.
6Chetelat, O. and Kim, K. C, “Miniature Particle Image Velocimetry System with LED In-Line illumination,”Meas. Sci. tech. 13, 1006. 2002.
7Pereira, F., Gharib, M., Dabiri, D., and Modarress, D., “Defocusing Digital Particle Image Velocimetry: a 3-Component 3-Dimensional DPIV Measurement Technique. Application to Bbubbly Flows,” Exp. Fluids [Suppl.]S78-S84, 2000.
8Barnhart, D. H., Adrian, R. J. and Pappen, G. C. 1994 “Phase conjugate holographic system for high resolutionparticle image velocimetry” Appl. Opt. 33 7159–70, 1994.
9Estevadeordal, J., Copenhaver, W., Car, D., Koch, P., Ng, W., Guillot, S., and Carter, C., “Macro- and Milli-DPIV Studies of a Boundary-Layer-Based Flow-Control Ssystem for a Transonic Cascade,” 11th InternationalSymposium on Application of Laser Techniques to Fluid Mechanics, Lisbon, Portugal, 2002.
10Xu, W., Jericho, M. H., Meinertzgahen, I. A., and Kreuzer, H. J., “Digital In-Line Holography of Microspheres,”Appl. Opt 41(s5), 5367-5375, 2002.
11Meng, H., and Hussain, F., “In-line Recording and Off-Axis Viewing technique for Holographic ParticleVelocimetry,” Appl. Opt., 34, 1827-40, 1995.
12Sheng, J., Malkiel, E., and Katz, J., “One Beam Two View Holographic Particle Iimage Velocimetry System,”Proc. 4th Int. Symp. on Particle Image Velocimetry, Gottingen, Germany, Paper 1022, 2001.
13Bohren, C. F., and Huffman, D. R., Absorption and Scattering of Light by Small Particles, John Wiley and Sons.1983.
14Post, M. E., Trump, D. D., Goss, L. P., and Hancock, R. D., “Two-Color Particle Image Velocimetry Using aSingle Argon-Ion Laser,” Exp Fluids 16, s. 263-272, 1994.
15Gogineni, S., Goss, L., Rivir, R., and Pestian, D., “Two-Color Digital PIV Employing a Single CCD Camera,”Exp. Fluids,. 25(4), 320-328, 1998.