Research Article A Multicenter Trial Defining a Serum Protein ...
11
Research Article A Multicenter Trial Defining a Serum Protein Signature Associated with Pancreatic Ductal Adenocarcinoma Anna S. Gerdtsson, 1 Núria Malats, 2 Anna Säll, 1 Francisco X. Real, 3,4 Miquel Porta, 5 Petter Skoog, 1 Helena Persson, 1 Christer Wingren, 1 and Carl A. K. Borrebaeck 1 1 Department of Immunotechnology and CREATE Health, Lund University, Medicon Village 406, 223 81 Lund, Sweden 2 Genetic and Molecular Epidemiology Group, Spanish National Cancer Research Centre (CNIO), C/Melchor Fern´ andez Almagro 3, 28029 Madrid, Spain 3 Epithelial Carcinogenesis Group, Spanish National Cancer Research Centre (CNIO), C/Melchor Fern´ andez Almagro 3, 28029 Madrid, Spain 4 Department of Experimental and Health Sciences, University of Pompeu Fabra, Dr. Aiguader 88, 08003 Barcelona, Spain 5 Hospital del Mar Medical Research Institute (IMIM), CIBERESP, UAB, Dr. Aiguader 88, 08003 Barcelona, Spain Correspondence should be addressed to Carl A. K. Borrebaeck; [email protected] Received 20 May 2015; Accepted 28 September 2015 Academic Editor: Djuro Josic Copyright © 2015 Anna S. Gerdtsson et al. is is an open access article distributed under the Creative Commons Attribution License, which permits unrestricted use, distribution, and reproduction in any medium, provided the original work is properly cited. Background. Pancreatic ductal adenocarcinoma (PDAC) is an aggressive disease with rapid tumor progression and poor prognosis. is study was motivated by the lack of sensitive and specific PDAC biomarkers and aimed to identify a diagnostic, serum protein signature for PDAC. Methods. To mimic a real life test situation, a multicenter trial comprising a serum sample cohort, including 338 patients with either PDAC or other pancreatic diseases (OPD) and controls with nonpancreatic conditions (NPC), was analyzed on 293-plex recombinant antibody microarrays targeting immunoregulatory and cancer-associated antigens. Results. Serum samples collected from different hospitals were analyzed and showed that (i) sampling from five different hospitals could not be identified as a preanalytical variable and (ii) a multiplexed biomarker signature could be identified, utilizing up to 10 serum markers that could discriminate PDAC from controls, with sensitivities and specificities in the 91–100% range. e first protein profiles associated with the location of the primary tumor in the pancreas could also be identified. Conclusions. e results demonstrate that robust enough serum signatures could be identified in a multicenter trial, potentially contributing to the development of a multiplexed biomarker immunoassay for improved PDAC diagnosis. 1. Introduction Pancreatic ductal adenocarcinoma (PDAC) is the 4th most common cancer-related cause of death [1]. Multiple factors account for its poor prognosis and improved diagnosis provides today the only possibility for cure. PDAC is oſten detected at late stages with 80% of patients not eligible for surgery due to either locally advanced or metastatic disease [1–3]. Genetic data suggest a time frame of at least 5 years from tumor initiation until the acquisition of metastatic ability [4], thus pointing towards a window of opportunity for detection if markers were available. e most extensively evaluated marker for PDAC, CA19- 9, suffers from poor specificity and the use of CA19-9 alone for PDAC screening has been discouraged [5]. In recent years, the field has moved towards multiplexed marker panels in search of increased sensitivity and specificity [6]. e protein panels assessed have commonly consisted of 2–5 analytes mainly selected on the basis of literature searches, or following mass spectrometry-based discovery studies, and measured in serial or in parallel using ELISA or equivalent methods [7, 8]. e markers have primarily been highly abundant blood proteins, acute-phase reactants (e.g., CRP and SAA), tumor markers (e.g., CA242, CA125, and CEA), Hindawi Publishing Corporation International Journal of Proteomics Volume 2015, Article ID 587250, 10 pages http://dx.doi.org/10.1155/2015/587250
Transcript of Research Article A Multicenter Trial Defining a Serum Protein ...
Research ArticleA Multicenter Trial Defining a Serum Protein SignatureAssociated with Pancreatic Ductal Adenocarcinoma
Anna S. Gerdtsson,1 Núria Malats,2 Anna Säll,1 Francisco X. Real,3,4 Miquel Porta,5
Petter Skoog,1 Helena Persson,1 Christer Wingren,1 and Carl A. K. Borrebaeck1
1Department of Immunotechnology and CREATE Health, Lund University, Medicon Village 406, 223 81 Lund, Sweden2Genetic and Molecular Epidemiology Group, Spanish National Cancer Research Centre (CNIO),C/Melchor Fernandez Almagro 3, 28029 Madrid, Spain3Epithelial Carcinogenesis Group, Spanish National Cancer Research Centre (CNIO), C/Melchor Fernandez Almagro 3,28029 Madrid, Spain4Department of Experimental and Health Sciences, University of Pompeu Fabra, Dr. Aiguader 88, 08003 Barcelona, Spain5Hospital del Mar Medical Research Institute (IMIM), CIBERESP, UAB, Dr. Aiguader 88, 08003 Barcelona, Spain
Correspondence should be addressed to Carl A. K. Borrebaeck; [email protected]
Received 20 May 2015; Accepted 28 September 2015
Academic Editor: Djuro Josic
Copyright © 2015 Anna S. Gerdtsson et al. This is an open access article distributed under the Creative Commons AttributionLicense, which permits unrestricted use, distribution, and reproduction in any medium, provided the original work is properlycited.
Background. Pancreatic ductal adenocarcinoma (PDAC) is an aggressive disease with rapid tumor progression and poor prognosis.This study was motivated by the lack of sensitive and specific PDAC biomarkers and aimed to identify a diagnostic, serum proteinsignature for PDAC.Methods.Tomimic a real life test situation, amulticenter trial comprising a serum sample cohort, including 338patients with either PDAC or other pancreatic diseases (OPD) and controls with nonpancreatic conditions (NPC), was analyzed on293-plex recombinant antibody microarrays targeting immunoregulatory and cancer-associated antigens. Results. Serum samplescollected from different hospitals were analyzed and showed that (i) sampling from five different hospitals could not be identified asa preanalytical variable and (ii) a multiplexed biomarker signature could be identified, utilizing up to 10 serum markers that coulddiscriminate PDAC from controls, with sensitivities and specificities in the 91–100% range.The first protein profiles associated withthe location of the primary tumor in the pancreas could also be identified. Conclusions.The results demonstrate that robust enoughserum signatures could be identified in a multicenter trial, potentially contributing to the development of a multiplexed biomarkerimmunoassay for improved PDAC diagnosis.
1. Introduction
Pancreatic ductal adenocarcinoma (PDAC) is the 4th mostcommon cancer-related cause of death [1]. Multiple factorsaccount for its poor prognosis and improved diagnosisprovides today the only possibility for cure. PDAC is oftendetected at late stages with 80% of patients not eligible forsurgery due to either locally advanced or metastatic disease[1–3]. Genetic data suggest a time frame of at least 5 yearsfrom tumor initiation until the acquisition of metastaticability [4], thus pointing towards a window of opportunityfor detection if markers were available.
The most extensively evaluated marker for PDAC, CA19-9, suffers from poor specificity and the use of CA19-9 alonefor PDAC screening has been discouraged [5]. In recentyears, the field hasmoved towardsmultiplexedmarker panelsin search of increased sensitivity and specificity [6]. Theprotein panels assessed have commonly consisted of 2–5analytes mainly selected on the basis of literature searches,or following mass spectrometry-based discovery studies, andmeasured in serial or in parallel using ELISA or equivalentmethods [7, 8]. The markers have primarily been highlyabundant blood proteins, acute-phase reactants (e.g., CRPand SAA), tumor markers (e.g., CA242, CA125, and CEA),
Hindawi Publishing CorporationInternational Journal of ProteomicsVolume 2015, Article ID 587250, 10 pageshttp://dx.doi.org/10.1155/2015/587250
2 International Journal of Proteomics
Table 1: Characteristics of the PANKRAS II study subjects according to the groups considered in the comparative analysis.
Diagnosis Number of samples Gender (M/F) Age (mean ± sd.)Pancreatic cancer (PDAC) 156 92/64 66 ± 13
Head (ICD9: 157.0) 97 45/52 67 ± 13Body (ICD9: 157.1) 16 12/4 68 ± 10Tail (ICD9: 157.2) 10 8/2 60 ± 11Other (ICD9: 157.8) 16 8/8 65 ± 13Unspecified (ICD9: 157.9) 17 12/5 66 ± 15
Other pancreatic diseases (OPD) 152 117/35 52 ± 14Acute pancreatitis (ICD9: 577.0) 33 22/11 59 ± 15Chronic pancreatitis (ICD9: 577.1) 110 95/15 50 ± 13Islet neoplasm (ICD9: 211.7) 3 0/3 64 ± 3Benign pancreatic neoplasms (ICD9: 211.6) 6 0/6 51 ± 18
Nonpancreatic conditions (NPC)∗ 30 20/10 62 ± 14Total 338(∗) ICD9 codes: 454 (2), 540, 735 (2), 807, 808, 812, 813, 820, 550.9 (4), 553.21 (2), 553.3, 560.9, 603.9, 735.0, 806.4, 812.09, 815.02, 820.2, 820.8, 821.2, 823.0,823.90, 824.0, 839.0.
adhesion molecules (e.g., ICAM-1 and ADCAM), proteinsinvolved in extracellular matrix degradation (e.g., MMPs andTIMP1), and lipoproteins (e.g., Apo-C1, Apo-A2), most oftenin combination with CA19-9 [9–14].
Given the inflammatory mechanisms of cancer, theimmunoregulatory serum proteome is also a relevant sourceof potential cancer biomarkers [15]. However, systemic effectsand the multitude of functions of many proteins of theimmune system suggest that panels of 2–5 markers mightnot be sufficiently specific for PDAC, particularly for thedifferential diagnosis with chronic pancreatitis (CP) andother conditions sharing symptoms and/or mechanisms. Infact, previous studies have shown that an increased num-ber of immunoregulatory proteins (≤25) may yield highlydisease-specific signatures [16–18]. Nevertheless, analysis ofthe immunoregulatory proteome faces several challenges.First, the serum concentration of proteins of interest dis-plays a vast dynamic range, from high microgram to lowpicogram per mL, complicating their simultaneous detec-tion, using conventional proteomic methodologies [19, 20].Second, promising cancer markers are more likely to befound among the low abundant, often low-molecular weight,proteins, which so far can only be targeted using affinityproteomics with high-performing binders [21, 22]. Third,disease-associated changes in serum levels of low-abundanceanalytes are expected to be small, requiring a large number ofsamples for a statistically significant demonstration of benefit[23].
For these purposes, we have designed microarrays withclose to 300 human recombinant scFv antibodies. Origi-nally, this platform mainly targeted the immunoregulatoryproteome [24] but has now been extended with a set ofnovel antibodies selected against predominantly cancer-associated antigens. With these highly multiplexed arrays,protein expression can be measured in hundreds of samplesin a reproducible and high-throughput manner. Moreover,this discovery mode platform could be straightforwardlyscaled down to a disease-specific biomarker assay for clinical
application. The aim of the current study was to perform amulticenter trial, where serum collected at several differentsites was analyzed, and to identify a robust, diagnostic serumprotein signature associated with PDAC at time of clinicaldiagnosis.
2. Materials and Methods
2.1. Samples. This retrospective study analyzed 338 serumsamples from patients with PDAC (𝑛 = 156) and otherpancreatic diseases (OPD) (𝑛 = 152) and normal pancreaticcontrols (NPC) (𝑛 = 30) that were collected after local ethicalapproval and informed consent at five different hospitals inSpain (Hospital del Mar, Barcelona; Hospital Vall Hebron,Barcelona; Hospital Mutua de Terrassa, Terrassa; HospitalSon Dureta, Palma de Mallorca; Hospital General Univer-sitario de Elche, Elche), as part of the PANKRAS-II Study[25, 26] from 1992 to 1995 (Table 1).
The study included patients with a suspicion of PDACmanaged in the participating hospitals, and one sample wasdrawn from each patient, using standardized protocols. Apanel of experts validated by consensus the final diagnosis ofall patients through a careful revision of clinical and patho-logical records and follow-up information [27]. We havepreviously shown that PDAC can be accurately discriminatedfrom healthy volunteers, using a smaller serum cohort andan earlier version of the antibody microarray platform [17],which is why we in the current study focused on pancreatitisas themain control group.The smaller group of NPC patientsincluded for reference was mainly attended to in the servicesof general surgery and digestive and traumatology of theparticipant hospitals, mostly including orthopedic fracturesand hernias (Table 1, footnote). Samples were collected beforeany treatment was given, separated within 3 h and storedas 1mL aliquots at −80∘C. The entire set of samples waslabeled at a single occasion, using a previously optimizedprotocol [28, 29]. Briefly, crude samples were diluted 1 : 45in PBS, resulting in an approximate protein concentration
International Journal of Proteomics 3
of 2mg/mL, and labeled with a 15 : 1 molar excess of biotinto protein, using 0.6mM EZ-Link Sulfo-NHS-LC-Biotin(Pierce, Rockford, IL, USA). Unbound biotin was removedby dialysis using a 3.5 kDaMWdialysismembrane (SpectrumLaboratories, Rancho Dominguez, CA, USA) against PBS for72 hours, with a change of buffer every 24 hours. Labeledsamples were aliquoted and stored at −20∘C.
2.2. Antibodies. The antibody microarrays contained 293human recombinant scFv antibodies directed against 98known antigens (Supplementary Table 1 in SupplementaryMaterial available online at http://dx.doi.org/10.1155/2015/587250) and 31 peptides motifs (Supplementary Table 2) [30].Most antibodies were selected against immunoregulatoryproteins and have previously demonstrated robust on-chipfunctionality [31–33]. Several binders have also been vali-dated, using ELISA, mass spectrometry, and spiking and/orblocking experiments (Supplementary Table 1). In addition,76 scFvs targeting 28 additional antigens were selected fromthe Hell-11 phage display library (Sall et al., manuscript inpreparation) against predominantly cancer-associated tar-gets, including kinases and other enzymes, transcriptionalregulators, cytokines, and receptors. Although these bindershave not previously been used in microarray applications,their on-chip functionality has been demonstrated in anindependent study (Sall et al., manuscript in preparation).The antibodies were produced in E. coli and purified fromthe periplasm, using aMagneHis Protein Purification System(Promega, Madison, WI, USA). The elution buffer wasexchanged for PBS, using Zeba 96-well desalt spin plates(Pierce). The protein yield was measured using NanoDrop(Thermo Scientific, Wilmington, DE, USA) and the puritywas checked using 10% SDS-PAGE (Invitrogen, Carlsbad,CA, USA).
2.3. Antibody Microarrays. Antibody microarrays were pro-duced on black MaxiSorp slides (NUNC, Roskilde, Den-mark), using a noncontact printer (SciFlexarrayer S11, Sci-enion, Berlin, Germany). Thirteen identical subarrays wereprinted on each slide, each array consisting of 33 × 31 spots(130 𝜇m spot diameter) with 200𝜇m spot-to-spot centerdistance. Each subarray consisted of 3 segments, separatedby rows of labeled BSA (Supplementary Figure 1) and eachantibody was printed in 3 replicates, one in each segmentand in different segment positions for each replicate. For eachround of analysis, 8 slides (104 arrays) were printed overnightand the slides were used for array analysis the followingday. All samples were blindly analyzed over the course of 5consecutive days.
Each slide wasmounted in a hybridization gasket (Schott,Jena, Germany) and blocked with PBSMT (1% (w/v) milk,1% (v/v) Tween-20 in PBS) for 1 h. Meantime, aliquots oflabeled serum samples were thawed on ice and diluted 1 : 10in PBSMT. The slides were washed 4 times with PBST(0.05% (v/v) Tween-20 in PBS) before 120𝜇L of the sampleswere added. Samples were incubated for 2 h on a rocking tableand slides were washed 4 times with PBST, incubated with1 𝜇g/mL Streptavidin-Alexa in PBSMT for 1 h on a rocking
table, and again washed 4 times with PBST. Finally, theslides were dismounted from the hybridization chambers,quickly immersed in dH
2O, and dried under a stream of
N2. The slides were immediately analyzed, using a confo-
cal microarray scanner (PerkinElmer Life and AnalyticalSciences, Wellesley, MA, USA) at 10 𝜇m resolution, using60% PMT gain and 90% laser power. Signal intensities werequantified, using the ScanArray Express software version 4.0(PerkinElmer Life and Analytical Sciences) with the fixedcircle option. After local background subtraction, intensityvalues were used for data analysis. Data acquisition wasperformed by a trained member of the research team blindedto the sample classification and clinical data.
2.4. Data Preprocessing. An average of the 3 replicate spotswas used, unless any replicate CV exceeded 15% from themean value, in which case it was dismissed and the averageof the 2 remaining replicates was used instead. The averageCV of replicates was 8.3% (±5.5%). Applying a cut-off CV of15%, 70% of data values were calculated from all 3 replicatesand the remaining 30% from 2 replicates.
For evaluation of normalization strategies and data distri-bution, the datawas visualized using 3Dprincipal componentanalysis (PCA) with ANOVA filtering (Qlucore AB, Lund,Sweden). Two samples (OPD) were excluded as barely anysignals were obtained from them for reasons that were notfurther explored. Of note, ANOVA on log10 raw data showedno significant (𝑝 < 0.01) differences between (i) samplesubarray positioning on slide, (ii) patient gender, (iii) patientage, and (iv) participating clinical center (data not shown).Minor systematic differences were observed between daysof analysis (rounds 1–5, likely due to small differences inhumidity during array printing, in particular for day 1; seeSupplementary Figure 2(A)), which could be neutralizedby normalization (Supplementary Figure 2(B)). The datawas normalized in two steps. First, differences betweenrounds (days) of analysis were eliminated, using a subtractgroup mean strategy [34]. The average intensity from eachantibody was calculated within each round of analysis andsubtracted from the single values, thus zero-centering thedata. The global mean signal from each antibody was addedto each respective data point to avoid negative values. Second,array-to-array differences (e.g., inherent sample backgroundfluorescence differences (see Supplementary Figure 1)) werehandled by calculating a scaling factor for each subarray,based on the 20% of antibodies with the lowest CV, as hasbeen previously described [17, 35].
2.5. Data Analysis. Two-group comparisons (PDAC versusNPC and PDAC versus OPD) were performed using PCA,Student’s 𝑡-test, Benjamini Hochberg procedure for falsediscovery rate control (𝑞-values), and fold changes. A groupANOVA was also performed (Qlucore). SVM analysis wasperformed in R, using a linear kernel with the cost ofconstraints set to 1. For SVM analyses, the data was randomlydivided into training and test sets with 2/3 of the samplesfrom each group as training set and the remaining samplesas test set. A backward elimination algorithm was applied,
4 International Journal of Proteomics
using training set data, excluding one antibody at the time,and iteratively eliminating the antibody that was removedwhen the smallest Kullback-Leibler divergence was obtainedin the classification analysis, as previously described [36].The last 25 antibodies to be eliminated were used to builda classification model in the training set, which then wasfrozen and applied in the corresponding independent testset, a procedure that reduces overfitting of data. The areaunder the ROC-curve (AUC) was used as a measure ofthe accuracy of performance of the signature in the testset. This procedure was repeated 10 times, in 10 differentand randomly generated pairs of training and test sets.Ultimately, each antibody was given a score based on theorder of elimination in the 10 training sets. The score wascalculated from the average endurance in the eliminationprocess (first antibody to be eliminated: 1; last antibody tobe eliminated: 293). Sensitivities (SN) and specificities (SP)and positive (PPV) and negative (NPV) predictive valueswere calculated from SVMprediction value threshold of zero.Finally, pathway analyses were performed, using MetaCore(Thomson Reuters, New York, NY, USA).
3. Results
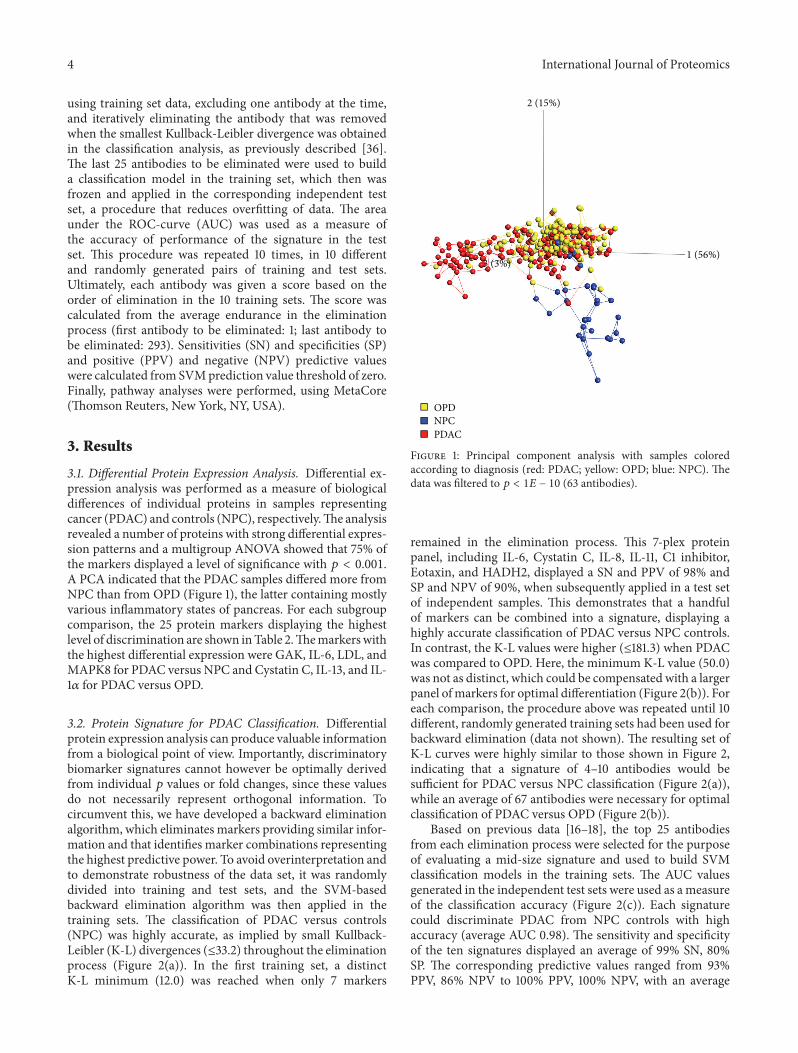
3.1. Differential Protein Expression Analysis. Differential ex-pression analysis was performed as a measure of biologicaldifferences of individual proteins in samples representingcancer (PDAC) and controls (NPC), respectively.The analysisrevealed a number of proteins with strong differential expres-sion patterns and a multigroup ANOVA showed that 75% ofthe markers displayed a level of significance with 𝑝 < 0.001.A PCA indicated that the PDAC samples differed more fromNPC than from OPD (Figure 1), the latter containing mostlyvarious inflammatory states of pancreas. For each subgroupcomparison, the 25 protein markers displaying the highestlevel of discrimination are shown inTable 2.Themarkerswiththe highest differential expression were GAK, IL-6, LDL, andMAPK8 for PDAC versus NPC and Cystatin C, IL-13, and IL-1𝛼 for PDAC versus OPD.
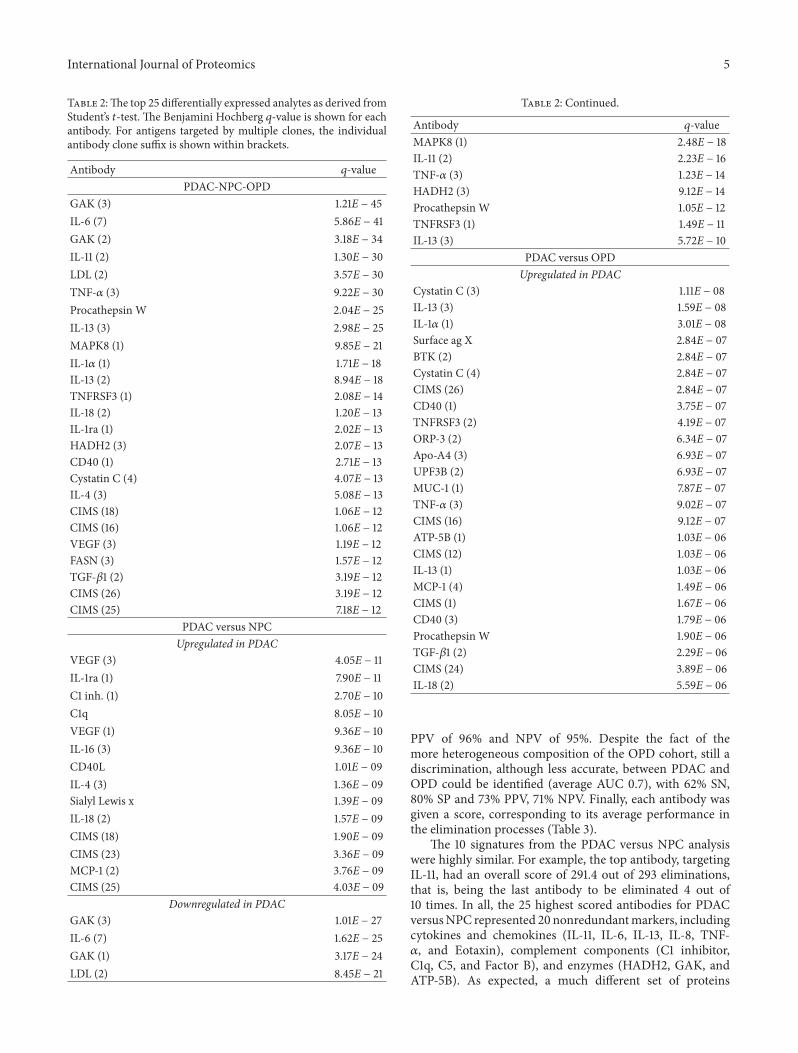
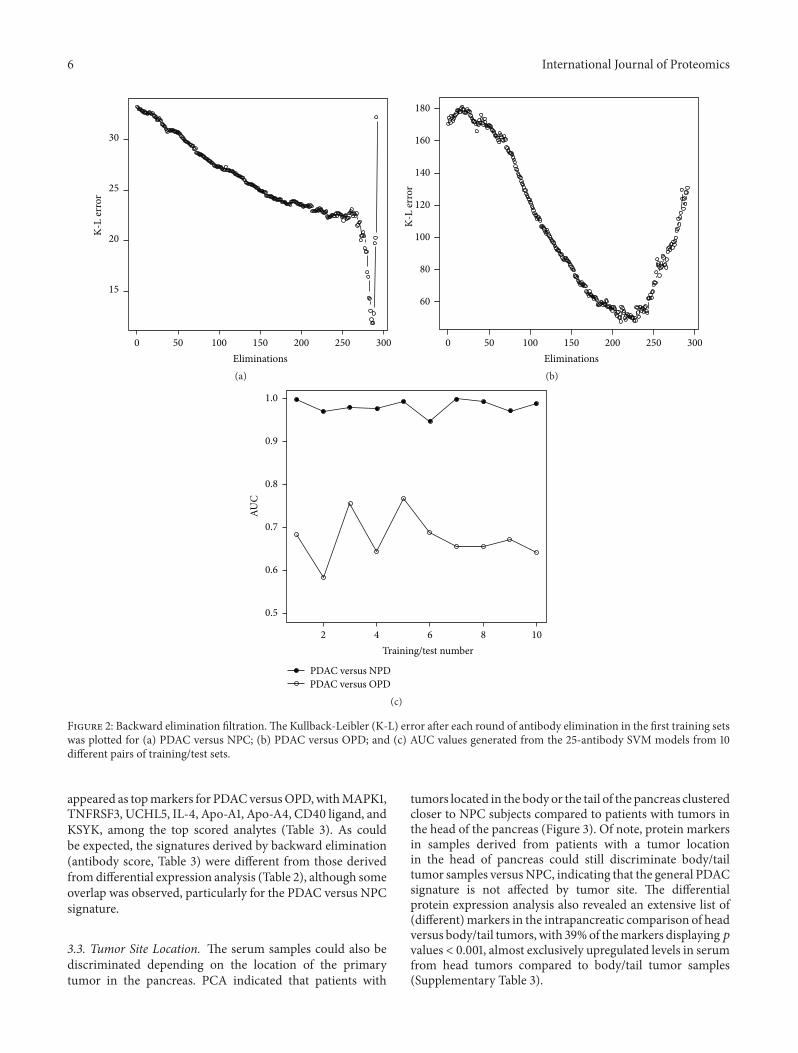
3.2. Protein Signature for PDAC Classification. Differentialprotein expression analysis can produce valuable informationfrom a biological point of view. Importantly, discriminatorybiomarker signatures cannot however be optimally derivedfrom individual 𝑝 values or fold changes, since these valuesdo not necessarily represent orthogonal information. Tocircumvent this, we have developed a backward eliminationalgorithm, which eliminates markers providing similar infor-mation and that identifies marker combinations representingthe highest predictive power. To avoid overinterpretation andto demonstrate robustness of the data set, it was randomlydivided into training and test sets, and the SVM-basedbackward elimination algorithm was then applied in thetraining sets. The classification of PDAC versus controls(NPC) was highly accurate, as implied by small Kullback-Leibler (K-L) divergences (≤33.2) throughout the eliminationprocess (Figure 2(a)). In the first training set, a distinctK-L minimum (12.0) was reached when only 7 markers
2 (15%)
1 (56%)3 (3%)
OPDNPCPDAC
Figure 1: Principal component analysis with samples coloredaccording to diagnosis (red: PDAC; yellow: OPD; blue: NPC). Thedata was filtered to 𝑝 < 1𝐸 − 10 (63 antibodies).
remained in the elimination process. This 7-plex proteinpanel, including IL-6, Cystatin C, IL-8, IL-11, C1 inhibitor,Eotaxin, and HADH2, displayed a SN and PPV of 98% andSP and NPV of 90%, when subsequently applied in a test setof independent samples. This demonstrates that a handfulof markers can be combined into a signature, displaying ahighly accurate classification of PDAC versus NPC controls.In contrast, the K-L values were higher (≤181.3) when PDACwas compared to OPD. Here, the minimum K-L value (50.0)was not as distinct, which could be compensated with a largerpanel ofmarkers for optimal differentiation (Figure 2(b)). Foreach comparison, the procedure above was repeated until 10different, randomly generated training sets had been used forbackward elimination (data not shown). The resulting set ofK-L curves were highly similar to those shown in Figure 2,indicating that a signature of 4–10 antibodies would besufficient for PDAC versus NPC classification (Figure 2(a)),while an average of 67 antibodies were necessary for optimalclassification of PDAC versus OPD (Figure 2(b)).
Based on previous data [16–18], the top 25 antibodiesfrom each elimination process were selected for the purposeof evaluating a mid-size signature and used to build SVMclassification models in the training sets. The AUC valuesgenerated in the independent test sets were used as ameasureof the classification accuracy (Figure 2(c)). Each signaturecould discriminate PDAC from NPC controls with highaccuracy (average AUC 0.98). The sensitivity and specificityof the ten signatures displayed an average of 99% SN, 80%SP. The corresponding predictive values ranged from 93%PPV, 86% NPV to 100% PPV, 100% NPV, with an average
International Journal of Proteomics 5
Table 2:The top 25 differentially expressed analytes as derived fromStudent’s 𝑡-test. The Benjamini Hochberg 𝑞-value is shown for eachantibody. For antigens targeted by multiple clones, the individualantibody clone suffix is shown within brackets.
Antibody 𝑞-valuePDAC-NPC-OPD
GAK (3) 1.21E − 45IL-6 (7) 5.86E − 41GAK (2) 3.18E − 34IL-11 (2) 1.30E − 30LDL (2) 3.57E − 30TNF-𝛼 (3) 9.22E − 30Procathepsin W 2.04E − 25IL-13 (3) 2.98E − 25MAPK8 (1) 9.85E − 21IL-1𝛼 (1) 1.71E − 18IL-13 (2) 8.94E − 18TNFRSF3 (1) 2.08E − 14IL-18 (2) 1.20E − 13IL-1ra (1) 2.02E − 13HADH2 (3) 2.07E − 13CD40 (1) 2.71E − 13Cystatin C (4) 4.07E − 13IL-4 (3) 5.08E − 13CIMS (18) 1.06E − 12CIMS (16) 1.06E − 12VEGF (3) 1.19E − 12FASN (3) 1.57E − 12TGF-𝛽1 (2) 3.19E − 12CIMS (26) 3.19E − 12CIMS (25) 7.18E − 12
PDAC versus NPCUpregulated in PDAC
VEGF (3) 4.05E − 11IL-1ra (1) 7.90E − 11C1 inh. (1) 2.70E − 10C1q 8.05E − 10VEGF (1) 9.36E − 10IL-16 (3) 9.36E − 10CD40L 1.01E − 09IL-4 (3) 1.36E − 09Sialyl Lewis x 1.39E − 09IL-18 (2) 1.57E − 09CIMS (18) 1.90E − 09CIMS (23) 3.36E − 09MCP-1 (2) 3.76E − 09CIMS (25) 4.03E − 09
Downregulated in PDACGAK (3) 1.01E − 27IL-6 (7) 1.62E − 25GAK (1) 3.17E − 24LDL (2) 8.45E − 21
Table 2: Continued.
Antibody 𝑞-valueMAPK8 (1) 2.48E − 18IL-11 (2) 2.23E − 16TNF-𝛼 (3) 1.23E − 14HADH2 (3) 9.12E − 14Procathepsin W 1.05E − 12TNFRSF3 (1) 1.49E − 11IL-13 (3) 5.72E − 10
PDAC versus OPDUpregulated in PDAC
Cystatin C (3) 1.11E − 08IL-13 (3) 1.59E − 08IL-1𝛼 (1) 3.01E − 08Surface ag X 2.84E − 07BTK (2) 2.84E − 07Cystatin C (4) 2.84E − 07CIMS (26) 2.84E − 07CD40 (1) 3.75E − 07TNFRSF3 (2) 4.19E − 07ORP-3 (2) 6.34E − 07Apo-A4 (3) 6.93E − 07UPF3B (2) 6.93E − 07MUC-1 (1) 7.87E − 07TNF-𝛼 (3) 9.02E − 07CIMS (16) 9.12E − 07ATP-5B (1) 1.03E − 06CIMS (12) 1.03E − 06IL-13 (1) 1.03E − 06MCP-1 (4) 1.49E − 06CIMS (1) 1.67E − 06CD40 (3) 1.79E − 06Procathepsin W 1.90E − 06TGF-𝛽1 (2) 2.29E − 06CIMS (24) 3.89E − 06IL-18 (2) 5.59E − 06
PPV of 96% and NPV of 95%. Despite the fact of themore heterogeneous composition of the OPD cohort, still adiscrimination, although less accurate, between PDAC andOPD could be identified (average AUC 0.7), with 62% SN,80% SP and 73% PPV, 71% NPV. Finally, each antibody wasgiven a score, corresponding to its average performance inthe elimination processes (Table 3).
The 10 signatures from the PDAC versus NPC analysiswere highly similar. For example, the top antibody, targetingIL-11, had an overall score of 291.4 out of 293 eliminations,that is, being the last antibody to be eliminated 4 out of10 times. In all, the 25 highest scored antibodies for PDACversusNPC represented 20 nonredundantmarkers, includingcytokines and chemokines (IL-11, IL-6, IL-13, IL-8, TNF-𝛼, and Eotaxin), complement components (C1 inhibitor,C1q, C5, and Factor B), and enzymes (HADH2, GAK, andATP-5B). As expected, a much different set of proteins
6 International Journal of Proteomics
50 100 150 200 250 3000Eliminations
15
20
25
30
K-L
erro
r
(a)
50 100 150 200 250 3000Eliminations
60
80
100
120
140
160
180
K-L
erro
r
(b)
PDAC versus NPDPDAC versus OPD
0.5
0.6
0.7
0.8
0.9
1.0
AUC
4 6 8 102Training/test number
(c)
Figure 2: Backward elimination filtration.The Kullback-Leibler (K-L) error after each round of antibody elimination in the first training setswas plotted for (a) PDAC versus NPC; (b) PDAC versus OPD; and (c) AUC values generated from the 25-antibody SVM models from 10different pairs of training/test sets.
appeared as topmarkers for PDACversusOPD,withMAPK1,TNFRSF3, UCHL5, IL-4, Apo-A1, Apo-A4, CD40 ligand, andKSYK, among the top scored analytes (Table 3). As couldbe expected, the signatures derived by backward elimination(antibody score, Table 3) were different from those derivedfromdifferential expression analysis (Table 2), although someoverlap was observed, particularly for the PDAC versus NPCsignature.
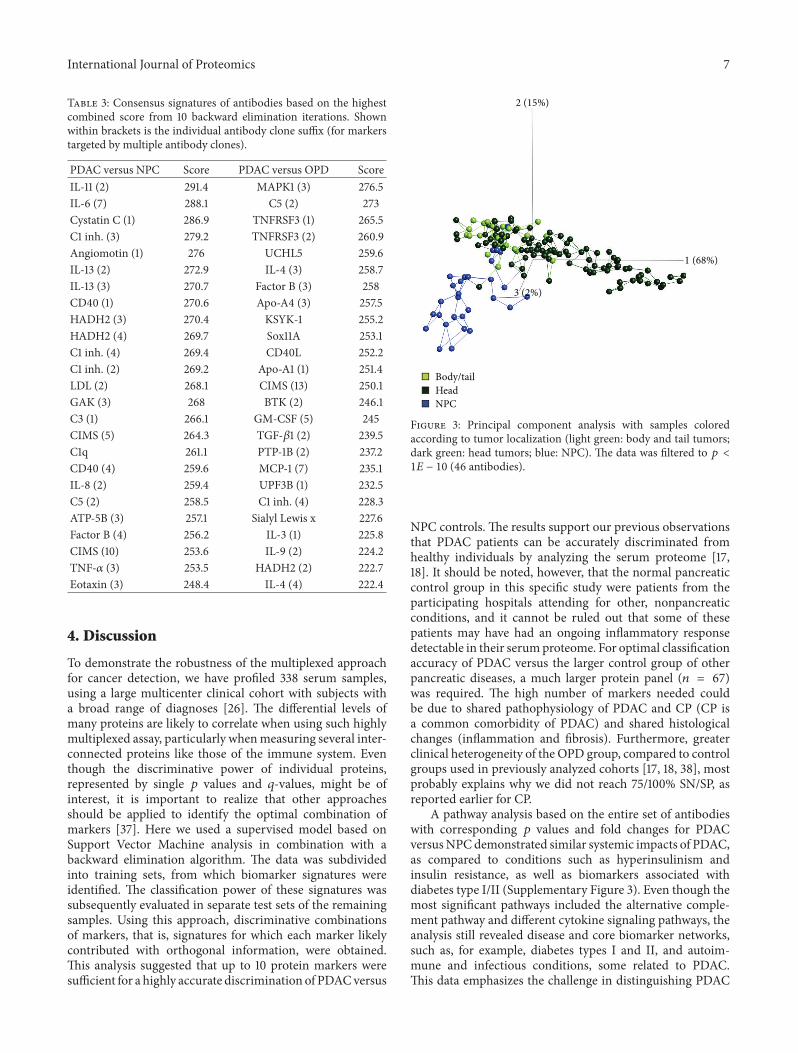
3.3. Tumor Site Location. The serum samples could also bediscriminated depending on the location of the primarytumor in the pancreas. PCA indicated that patients with
tumors located in the body or the tail of the pancreas clusteredcloser to NPC subjects compared to patients with tumors inthe head of the pancreas (Figure 3). Of note, protein markersin samples derived from patients with a tumor locationin the head of pancreas could still discriminate body/tailtumor samples versusNPC, indicating that the general PDACsignature is not affected by tumor site. The differentialprotein expression analysis also revealed an extensive list of(different)markers in the intrapancreatic comparison of headversus body/tail tumors, with 39%of themarkers displaying𝑝values < 0.001, almost exclusively upregulated levels in serumfrom head tumors compared to body/tail tumor samples(Supplementary Table 3).
International Journal of Proteomics 7
Table 3: Consensus signatures of antibodies based on the highestcombined score from 10 backward elimination iterations. Shownwithin brackets is the individual antibody clone suffix (for markerstargeted by multiple antibody clones).
PDAC versus NPC Score PDAC versus OPD ScoreIL-11 (2) 291.4 MAPK1 (3) 276.5IL-6 (7) 288.1 C5 (2) 273Cystatin C (1) 286.9 TNFRSF3 (1) 265.5C1 inh. (3) 279.2 TNFRSF3 (2) 260.9Angiomotin (1) 276 UCHL5 259.6IL-13 (2) 272.9 IL-4 (3) 258.7IL-13 (3) 270.7 Factor B (3) 258CD40 (1) 270.6 Apo-A4 (3) 257.5HADH2 (3) 270.4 KSYK-1 255.2HADH2 (4) 269.7 Sox11A 253.1C1 inh. (4) 269.4 CD40L 252.2C1 inh. (2) 269.2 Apo-A1 (1) 251.4LDL (2) 268.1 CIMS (13) 250.1GAK (3) 268 BTK (2) 246.1C3 (1) 266.1 GM-CSF (5) 245CIMS (5) 264.3 TGF-𝛽1 (2) 239.5C1q 261.1 PTP-1B (2) 237.2CD40 (4) 259.6 MCP-1 (7) 235.1IL-8 (2) 259.4 UPF3B (1) 232.5C5 (2) 258.5 C1 inh. (4) 228.3ATP-5B (3) 257.1 Sialyl Lewis x 227.6Factor B (4) 256.2 IL-3 (1) 225.8CIMS (10) 253.6 IL-9 (2) 224.2TNF-𝛼 (3) 253.5 HADH2 (2) 222.7Eotaxin (3) 248.4 IL-4 (4) 222.4
4. Discussion
To demonstrate the robustness of the multiplexed approachfor cancer detection, we have profiled 338 serum samples,using a large multicenter clinical cohort with subjects witha broad range of diagnoses [26]. The differential levels ofmany proteins are likely to correlate when using such highlymultiplexed assay, particularly whenmeasuring several inter-connected proteins like those of the immune system. Eventhough the discriminative power of individual proteins,represented by single 𝑝 values and 𝑞-values, might be ofinterest, it is important to realize that other approachesshould be applied to identify the optimal combination ofmarkers [37]. Here we used a supervised model based onSupport Vector Machine analysis in combination with abackward elimination algorithm. The data was subdividedinto training sets, from which biomarker signatures wereidentified. The classification power of these signatures wassubsequently evaluated in separate test sets of the remainingsamples. Using this approach, discriminative combinationsof markers, that is, signatures for which each marker likelycontributed with orthogonal information, were obtained.This analysis suggested that up to 10 protein markers weresufficient for a highly accurate discrimination of PDACversus
2 (15%)
1 (68%)
3 (2%)
Body/tailHeadNPC
Figure 3: Principal component analysis with samples coloredaccording to tumor localization (light green: body and tail tumors;dark green: head tumors; blue: NPC). The data was filtered to 𝑝 <1𝐸 − 10 (46 antibodies).
NPC controls. The results support our previous observationsthat PDAC patients can be accurately discriminated fromhealthy individuals by analyzing the serum proteome [17,18]. It should be noted, however, that the normal pancreaticcontrol group in this specific study were patients from theparticipating hospitals attending for other, nonpancreaticconditions, and it cannot be ruled out that some of thesepatients may have had an ongoing inflammatory responsedetectable in their serumproteome. For optimal classificationaccuracy of PDAC versus the larger control group of otherpancreatic diseases, a much larger protein panel (𝑛 = 67)was required. The high number of markers needed couldbe due to shared pathophysiology of PDAC and CP (CP isa common comorbidity of PDAC) and shared histologicalchanges (inflammation and fibrosis). Furthermore, greaterclinical heterogeneity of the OPD group, compared to controlgroups used in previously analyzed cohorts [17, 18, 38], mostprobably explains why we did not reach 75/100% SN/SP, asreported earlier for CP.
A pathway analysis based on the entire set of antibodieswith corresponding 𝑝 values and fold changes for PDACversusNPCdemonstrated similar systemic impacts of PDAC,as compared to conditions such as hyperinsulinism andinsulin resistance, as well as biomarkers associated withdiabetes type I/II (Supplementary Figure 3). Even though themost significant pathways included the alternative comple-ment pathway and different cytokine signaling pathways, theanalysis still revealed disease and core biomarker networks,such as, for example, diabetes types I and II, and autoim-mune and infectious conditions, some related to PDAC.This data emphasizes the challenge in distinguishing PDAC
8 International Journal of Proteomics
from symptomatically related benign conditions [18, 38] andalso underlines the need for multiplexing to reach sufficientdiscrimination power.
Ongoing follow-up studies will show whether the sig-nature identified here could be condensed to even smallerpanels of markers, while maintaining the sensitivity andspecificity required for a diagnostic immunoassay. As dis-cussed above, we selected the top 25 antibodies from eachelimination process as a starting point to build SVM classifi-cation models in training sets. The AUC values subsequentlygenerated were used as a measure of classification accuracy,where AUC up to 0.98 was reached (PDAC versus NPC).Despite adopting two highly different strategies for signatureidentification (differential protein expression versus SVM-based backward elimination), there was still a substantialoverlap between the signatures; that is, the markers withthe highest overall backward elimination scores were alsosignificantly differentially expressed. For example, IL-11, IL-6, C1 inhibitor, IL-13, HADH2, LDL, GAK, C1q, and TNF-𝛼appeared in both signatures and, thus, demonstrated both low𝑝 values and 𝑞-values as well as high backward eliminationscores for PDAC versus NPC. For PDAC versus OPD the twosignatures overlapped by C5, Apo-A4, BTK, TGF-𝛽1, MCP-1, and UPF3B. Of note, a large number of markers that havebeen associated with PDAC in previous studies were iden-tified in the present comparisons with both NPC and OPD,including C1 inhibitor, C5, Factor B, IL-13, MCP-1, and TNF-𝛼 [17, 18, 39–41]. In addition, new potential PDAC markerswere identified, illustrated by HADH2, a 3-hydroxyacyl-CoA dehydrogenase type II, and the serine/threonine kinaseGAK (Cyclin G associated kinase), a direct transcriptionaltarget of p53. GAK was markedly downregulated in PDACversus NPC and also appeared in the backward eliminationsignature for PDAC versus NPC. In addition, TNFRSF3 (aTNF-𝛽 receptor) and UPF3B (an mRNA regulatory protein)were included in both the differential expression analysis andbackward elimination score s for PDAC versus OPD. Finally,MAPK1 (ERK2), a kinase of the MAPK/ERK signaling path-way which is deregulated in PDAC and other cancers [42],was the highest scoring protein in the backward eliminationsignatures for PDAC versus OPD. Of note, these proteinsdisplay diverse subcellular distributions and some, such asGAK, HADH2, MAPK1, and TNFRSF3, to the best of ourknowledge have not previously been identified in serum.
A new finding in this study was the observation thatserum protein markers associated with tumor localizationwere identified. Amajor problemwith tumors of the body/tailin comparisonwith pancreatic head cancer is distantmetasta-sis, especially in the liver, and resection of the tumor does notincrease postoperative survival in metastatic disease [43]. Onthe other hand, patients with local-stage body/tail tumors hadhigher survival rates compared with local-stage pancreatichead cancer [44]. Our data indicated markers in samplesfrom patients with body/tail tumors clustering closer to theNPC controls, as compared to samples from patients withpancreatic head tumors. This may be explained by a moreprofound systemic impact of the head tumors, as these areprone to invade the surrounding mesenteric blood vesselsconnecting the pancreas to the duodenum [2], or by changes
secondary to biliary obstruction. As the biological differencescan result in different treatment efficiency [43], biomarkersthat can discriminate between tumor localization could be ofclinical relevance.
Despite being the 4th most lethal cancer, the incidenceof PDAC is low with ∼11 per 100 000 individuals in the US[45]. Given the increasing mortality in Europe and USA,PDAC will likely become a more serious problem over thenext decades [46, 47]. Still, it might be argued that thelow incidence does not justify screening for PDAC in thegeneral population. In light of this, a recent health-economicstudy based on sensitivities and specificities presented by usfrom a previous trial [18] suggests the cost-effectiveness ofscreening for PDAC in high-risk groups, such as patients withfamiliar history of PDAC chronic pancreatitis, Peutz-Jegherssyndrome, and newly onset diabetes mellitus [48, 49]. PDACpatients in the current cohort had predominantly stage IIIand IV tumors, and consequently studies have been initiatedto explore the diagnostic power of the marker signature inpatients with stage I and II tumors, as well as subjects fromthe relevant risk groups.
5. Conclusion
In summary, this multicenter study allowed identification ofprotein signatures associated with PDAC, displaying sensi-tivities and specificities in the 91–100% range, demonstratingthat different sites for sample collection were not a con-founding factor affecting the robustness of the signature.Furthermore, we provide an indication that recombinantantibody microarrays could identify serum protein markersassociated with different tumor locations in the pancreas,although this observation and its clinical implications needto be further corroborated. Further refinement of the proteinpatterns defined in this study and previous cohorts andvalidation in additional sample sets could lead to biomarkersignatures providing improved ability for diagnosis of thisdisease with such dismal prognosis.
Conflict of Interests
Carl A. K. Borrebaeck, Christer Wingren, and Anna S.Gerdtsson are inventors of pending patent on pancreaticcancer biomarkers.
Authors’ Contribution
Anna S. Gerdtsson, Christer Wingren, and Carl A. K. Bor-rebaeck were responsible for acquisition of data, analysis andinterpretation of data, study concept and design, and draftingof the paper. Nuria Malats, Francisco X. Real, and MiquelPorta were responsible for collection of clinical samples,study design, interpretation of data, and critical revision ofthe paper. Petter Skoog performed technical support andacquisition of data. Anna Sall and Helena Persson wereresponsible for technical and material support.

International Journal of Proteomics 9
Acknowledgments
The authors gratefully acknowledge Carina Strand for lab-oratory assistance and the many investigators, nurses, andpatients who participated in the PANKRAS-II Study. Thisstudy was supported by VINNOVA and the SSF StrategicCenter for Translational Cancer Research (CREATE Health);EU FP7 Grant Agreement 241481 (AFFINOMICS: ProteinBinders for Characterization of Human Proteome Function:Generation, Validation, Application); Fondo de Investiga-ciones Sanitarias (FIS no. PI09-02102, no. PI12-00815, andno. PI13-00020) and Red Tematica de Investigacion Coop-erativa en Cancer (RTICC no. RD12/0036/0050), Institutode Salud Carlos III (ISCIII), Spanish Ministry of Econ-omy and Competitiveness; European Commission (EU-7FP-HEALTH-259737 CANCERALIA) and European Coopera-tion in Science and Technology (COST Action no. BM1204:EU Pancreas).
References
[1] R. Siegel, D.Naishadham, andA. Jemal, “Cancer statistics, 2012,”CA: A Cancer Journal for Clinicians, vol. 62, no. 1, pp. 10–29,2012.
[2] M. Hidalgo, “Pancreatic cancer,” The New England Journal ofMedicine, vol. 362, no. 17, pp. 1562–1617, 2010.
[3] M. Porta, X. Fabregat, N. Malats et al., “Exocrine pancreaticcancer: symptoms at presentation and their relation to tumoursite and stage,” Clinical and Translational Oncology, vol. 7, no. 5,pp. 189–197, 2005.
[4] S. Yachida, S. Jones, I. Bozic et al., “Distant metastasis occurslate during the genetic evolution of pancreatic cancer,” Nature,vol. 467, no. 7319, pp. 1114–1117, 2010.
[5] G. Y. Locker, S. Hamilton, J. Harris et al., “ASCO 2006 updateof recommendations for the use of tumor markers in gastroin-testinal cancer,” Journal of Clinical Oncology, vol. 24, no. 33, pp.5313–5327, 2006.
[6] J. Koopmann, C. N. W. Rosenzweig, Z. Zhang et al., “Serummarkers in patients with resectable pancreatic adenocarcinoma:macrophage inhibitory cytokine 1 versus CA19-9,” ClinicalCancer Research, vol. 12, no. 2, pp. 442–446, 2006.
[7] S. Bunger, T. Laubert, U. J. Roblick, and J. K. Habermann,“Serum biomarkers for improved diagnostic of pancreaticcancer: a current overview,” Journal of Cancer Research andClinical Oncology, vol. 137, no. 3, pp. 375–389, 2011.
[8] R. E. Brand, B. M. Nolen, H. J. Zeh et al., “Serum biomarkerpanels for the detection of pancreatic cancer,” Clinical CancerResearch, vol. 17, no. 4, pp. 805–816, 2011.
[9] J.-T. Jiang, C.-P. Wu, H.-F. Deng et al., “Serum level of TSGF,CA242 and CA19-9 in pancreatic cancer,” World Journal ofGastroenterology, vol. 10, no. 11, pp. 1675–1677, 2004.
[10] N. Duraker, S. Hot, Y. Polat, A. Hobek, N. Gencler, and N.Urhan, “CEA, CA 19-9, and CA 125 in the differential diagnosisof benign and malignant pancreatic diseases with or withoutjaundice,” Journal of Surgical Oncology, vol. 95, no. 2, pp. 142–147, 2007.
[11] X. G. Ni, X. F. Bai, Y. L. Mao et al., “The clinical value of serumCEA, CA19-9, and CA242 in the diagnosis and prognosis ofpancreatic cancer,” European Journal of Surgical Oncology, vol.31, no. 2, pp. 164–169, 2005.
[12] V.M. Faca, K. S. Song,H.Wang et al., “Amouse to human searchfor plasma proteome changes associated with pancreatic tumordevelopment,” PLoS Medicine, vol. 5, no. 6, article e123, 2008.
[13] M. A. Firpo, D. Z. Gay, S. R. Granger et al., “Improved diagnosisof pancreatic adenocarcinoma using haptoglobin and serumamyloid A in a panel screen,” World Journal of Surgery, vol. 33,no. 4, pp. 716–722, 2009.
[14] R. Orchekowski, D. Hamelinck, L. Li et al., “Antibody microar-ray profiling reveals individual and combined serum proteinsassociated with pancreatic cancer,” Cancer Research, vol. 65, no.23, pp. 11193–11202, 2005.
[15] L. M. Coussens and Z. Werb, “Inflammation and cancer,”Nature, vol. 420, no. 6917, pp. 860–867, 2002.
[16] A. Carlsson, D. M. Wuttge, J. Ingvarsson et al., “Serum proteinprofiling of systemic lupus erythematosus and systemic sclerosisusing recombinant antibodymicroarrays,”Molecular &CellularProteomics, vol. 10, no. 5, 2011.
[17] J. Ingvarsson, C. Wingren, A. Carlsson et al., “Detectionof pancreatic cancer using antibody microarray-based serumprotein profiling,” Proteomics, vol. 8, no. 11, pp. 2211–2219, 2008.
[18] C. Wingren, A. Sandstrom, R. Segersvard et al., “Identificationof serum biomarker signatures associated with pancreatic can-cer,” Cancer Research, vol. 72, no. 10, pp. 2481–2490, 2012.
[19] N. L. Anderson and N. G. Anderson, “The human plasma pro-teome: history, character, and diagnostic prospects,” Molecular& Cellular Proteomics, vol. 1, no. 11, pp. 845–867, 2002.
[20] H. Zhang, A. Y. Liu, P. Loriaux et al., “Mass spectrometricdetection of tissue proteins in plasma,” Molecular and CellularProteomics, vol. 6, no. 1, pp. 64–71, 2007.
[21] S. Surinova, R. Schiess, R. Huttenhain, F. Cerciello, B.Wollscheid, and R. Aebersold, “On the development of plasmaprotein biomarkers,” Journal of Proteome Research, vol. 10, no. 1,pp. 5–16, 2011.
[22] B. B.Haab, B.H.Geierstanger, G.Michailidis et al., “Immunoas-say and antibody microarray analysis of the HUPO PlasmaProteome Project reference specimens: Systematic variationbetween sample types and calibration of mass spectrometrydata,” Proteomics, vol. 5, no. 13, pp. 3278–3291, 2005.
[23] T. A. Alonzo, M. S. Pepe, and C. S. Moskowitz, “Samplesize calculations for comparative studies of medical tests fordetecting presence of disease,” Statistics in Medicine, vol. 21, no.6, pp. 835–852, 2002.
[24] C. A. K. Borrebaeck and C. Wingren, “Design of high-densityantibody microarrays for disease proteomics: key technologicalissues,” Journal of Proteomics, vol. 72, no. 6, pp. 928–935, 2009.
[25] M. Porta, N. Malats, M. Jariod et al., “Serum concentrations oforganochlorine compounds and K-ras mutations in exocrinepancreatic cancer. PANKRAS II Study Group,”The Lancet, vol.354, no. 9196, pp. 2125–2129, 1999.
[26] L. A. Parker, M. Porta, B. Lumbreras et al., “Clinical validityof detecting K-ras mutations for the diagnosis of exocrinepancreatic cancer: a prospective study in a clinically-relevantspectrumof patients,”European Journal of Epidemiology, vol. 26,no. 3, pp. 229–236, 2011.
[27] M. Porta, S. Costafreda, N.Malats et al., “Validity of the hospitaldischarge diagnosis in epidemiologic studies of biliopancreaticpathology,” European Journal of Epidemiology, vol. 16, no. 6, pp.533–541, 2000.
[28] C. Wingren, J. Ingvarsson, L. Dexlin, D. Szul, and C. A. K.Borrebaeck, “Design of recombinant antibody microarrays forcomplex proteome analysis: choice of sample labeling-tag andsolid support,” Proteomics, vol. 7, no. 17, pp. 3055–3065, 2007.
10 International Journal of Proteomics
[29] A. Carlsson, O. Persson, J. Ingvarsson et al., “Plasma proteomeprofiling reveals biomarker patterns associated with prognosisand therapy selection in glioblastoma multiforme patients,”Proteomics—Clinical Applications, vol. 4, no. 6-7, pp. 591–602,2010.
[30] N. Olsson, S. Wallin, P. James, C. A. K. Borrebaeck, and C.Wingren, “Epitope-specificity of recombinant antibodies re-veals promiscuous peptide-binding properties,” Protein Science,vol. 21, no. 12, pp. 1897–1910, 2012.
[31] C.Wingren and C. A. Borrebaeck, “Antibodymicroarray analy-sis of directly labelled complex proteomes,” Current Opinion inBiotechnology, vol. 19, no. 1, pp. 55–61, 2008.
[32] C. Steinhauer, C. Wingren, A. C. Hager, and C. Borrebaeck,“Single framework recombinant antibody fragments designedfor protein chip applications,” Biotechniques, supplement, pp.38–45, 2002.
[33] C.Wingren, C. Steinhauer, J. Ingvarsson, E. Persson, K. Larsson,and C. A. K. Borrebaeck, “Microarrays based on affinity-taggedsingle-chain Fv antibodies: sensitive detection of analyte incomplex proteomes,” Proteomics, vol. 5, no. 5, pp. 1281–1291,2005.
[34] Y.-W. B. Wu and P. J. Wooldridge, “The impact of centeringfirst-level predictors on individual and contextual effects inmultilevel data analysis,” Nursing Research, vol. 54, no. 3, pp.212–216, 2005.
[35] A. Carlsson, C. Wingren, J. Ingvarsson et al., “Serum proteomeprofiling of metastatic breast cancer using recombinant anti-body microarrays,” European Journal of Cancer, vol. 44, no. 3,pp. 472–480, 2008.
[36] A. Carlsson, C. Wingren, M. Kristensson et al., “Molecularserum portraits in patients with primary breast cancer predictthe development of distant metastases,” Proceedings of theNational Academy of Sciences of the United States of America,vol. 108, no. 34, pp. 14252–14257, 2011.
[37] J. Quackenbush, “Computational analysis of microarray data,”Nature Reviews Genetics, vol. 2, no. 6, pp. 418–427, 2001.
[38] A. Sandstrom, R. Andersson, R. Segersvard, M. Lohr, C. A.K. Borrebaeck, and C. Wingren, “Serum proteome profiling ofpancreatitis using recombinant antibody microarrays revealsdisease-associated biomarker signatures,” PROTEOMICS—Clinical Applications, vol. 6, no. 9-10, pp. 486–496, 2012.
[39] Y. Ma, R. F. Hwang, C. D. Logsdon, and S. E. Ullrich, “Dynamicmast cell-stromal cell interactions promote growth of pancre-atic cancer,”Cancer Research, vol. 73, no. 13, pp. 3927–3937, 2013.
[40] C. Kudo-Saito, H. Shirako, M. Ohike, N. Tsukamoto, and Y.Kawakami, “CCL2 is critical for immunosuppression to pro-mote cancer metastasis,” Clinical and Experimental Metastasis,vol. 30, no. 4, pp. 393–405, 2013.
[41] T. P.McDade, R. A. Perugini, F. J. Vittimberga Jr., R. C. Carrigan,and M. P. Callery, “Salicylates inhibit NF-𝜅B activation andenhance TNF-𝛼-induced apoptosis in human pancreatic cancercells,” Journal of Surgical Research, vol. 83, no. 1, pp. 56–61, 1999.
[42] A. Arlt, S. S. Muerkoster, and H. Schafer, “Targeting apoptosispathways in pancreatic cancer,” Cancer Letters, vol. 332, no. 2,pp. 346–358, 2013.
[43] T.-C. Wu, Y.-F. Shao, Y. Shan, J.-X. Wu, and P. Zhao, “Surgicaleffect of malignant tumor of body and tail of the pancreas:compare with pancreatic head cancer,” Zhonghua Wai Ke ZaZhi, vol. 45, no. 1, pp. 30–33, 2007.
[44] M. K. Lau, J. A. Davila, and Y. H. Shaib, “Incidence and survivalof pancreatic head and body and tail cancers: a population-based study in the United States,” Pancreas, vol. 39, no. 4, pp.458–462, 2010.
[45] Y. H. Shaib, J. A. Davila, and H. B. El-Serag, “The epidemiologyof pancreatic cancer in the United States: changes below thesurface,”Alimentary Pharmacology andTherapeutics, vol. 24, no.1, pp. 87–94, 2006.
[46] M. Malvezzi, P. Bertuccio, F. Levi, C. La Vecchia, and E. Negri,“European cancer mortality predictions for the year 2014,”Annals of Oncology, vol. 25, no. 8, Article ID mdu138, pp. 1650–1656, 2014.
[47] L. Rahib, B. D. Smith, R. Aizenberg, A. B. Rosenzweig, J. M.Fleshman, and L. M. Matrisian, “Projecting cancer incidenceand deaths to 2030: the unexpected burden of thyroid, liver, andpancreas cancers in the United States,” Cancer Research, vol. 74,no. 11, pp. 2913–2921, 2014.
[48] O. Ghatnekar, R. Andersson, M. Svensson et al., “Modellingthe benefits of early diagnosis of pancreatic cancer using abiomarker signature,” International Journal of Cancer, vol. 133,no. 10, pp. 2392–2397, 2013.
[49] F. Konstantinou, K. N. Syrigos, and M. W. Saif, “Pancreaticcancer: what about screening and detection?” Journal of thePancreas, vol. 14, no. 4, pp. 312–315, 2013.

Submit your manuscripts athttp://www.hindawi.com
Hindawi Publishing Corporationhttp://www.hindawi.com Volume 2014
Anatomy Research International
PeptidesInternational Journal of
Hindawi Publishing Corporationhttp://www.hindawi.com Volume 2014
Hindawi Publishing Corporation http://www.hindawi.com
International Journal of
Volume 2014
Zoology
Hindawi Publishing Corporationhttp://www.hindawi.com Volume 2014
Molecular Biology International
GenomicsInternational Journal of
Hindawi Publishing Corporationhttp://www.hindawi.com Volume 2014
The Scientific World JournalHindawi Publishing Corporation http://www.hindawi.com Volume 2014
Hindawi Publishing Corporationhttp://www.hindawi.com Volume 2014
BioinformaticsAdvances in
Marine BiologyJournal of
Hindawi Publishing Corporationhttp://www.hindawi.com Volume 2014
Hindawi Publishing Corporationhttp://www.hindawi.com Volume 2014
Signal TransductionJournal of
Hindawi Publishing Corporationhttp://www.hindawi.com Volume 2014
BioMed Research International
Evolutionary BiologyInternational Journal of
Hindawi Publishing Corporationhttp://www.hindawi.com Volume 2014
Hindawi Publishing Corporationhttp://www.hindawi.com Volume 2014
Biochemistry Research International
ArchaeaHindawi Publishing Corporationhttp://www.hindawi.com Volume 2014
Hindawi Publishing Corporationhttp://www.hindawi.com Volume 2014
Genetics Research International
Hindawi Publishing Corporationhttp://www.hindawi.com Volume 2014
Advances in
Virolog y
Hindawi Publishing Corporationhttp://www.hindawi.com
Nucleic AcidsJournal of
Volume 2014
Stem CellsInternational
Hindawi Publishing Corporationhttp://www.hindawi.com Volume 2014
Hindawi Publishing Corporationhttp://www.hindawi.com Volume 2014
Enzyme Research
Hindawi Publishing Corporationhttp://www.hindawi.com Volume 2014
International Journal of
Microbiology