Report on the Joint Eglin Acoustic Week III - NASA · PDF fileReport on the Joint Eglin...
11
1 Report on the Joint Eglin Acoustic Week III Michael E. Watts Aerospace Engineer NASA Langley Research Center Hampton, Virginia [email protected] David A. Conner Aerospace Engineer U.S. Army AFDD-JRPO, AMRDEC, RDECOM Hampton, Virginia [email protected] Charles D. Smith Aeronautical Staff Engineer Lockheed Martin Engineering and Sciences Company Hampton, Virginia [email protected] Abstract A series of three flight tests have been conducted at Eglin Air Force Base located in the Florida panhandle. The first was the “Acoustics Week” flight test conducted in September 2003. The second was the NASA Heavy Lift Rotorcraft Acoustic Flight Test conducted in October-November 2005. The most recent was the Eglin Acoustic Week III test conducted in August-September 2007. This series of tests have acquired acoustic data for a number of rotary and fixed wing aircraft that are used to generate noise semi-spheres used in predicting the acoustic footprint for prescribed flight operations. This extensive database can be used to determine the impact of flight operations on communities around a terminal area. Another valuable use of the semi-spheres is determining the long-range propagation of noise for civilian and military purposes. This paper will describe the third in this series of tests. Introduction Airport congestion and flight delays are increasing as passenger demand continues to grow. There was a significant downturn in passenger demand post-9/11, but demand has currently surpassed those pre-9/11 levels. Vertical lift aircraft can have a significant impact on reducing airport congestion and flight delays. The 1995 Civil Tiltrotor Advisory Committee Final Report to Congress [ref 1] found that “CTR (Civil Tilt Rotor) could produce significant societal benefits, reducing airport congestion, creating jobs, and having a positive impact on the balance of trade.” A more recent study [ref 2] showed that 26% of commercial operations from the 64 major airports had a trip Presented at the American Helicopter Society Next Generation Vertical Lift Technologies Specialist Meeting, Oct. 15-17, 2008, Dallas, TX. This paper is declared a work of the U.S. Government and is not subject to copyright protection in the United States. length of less than 500 miles and could be offloaded from conventional aircraft with Runway Independent Aircraft. This resulted in a reduction of the projected 2017 average delay time from 86.6 minutes to 18.3 minutes thus showing that V/ESTOL aircraft can have a significant impact on commercial operations. This study was not comprehensive in that it only addressed the 64 largest airports. It did not address delays caused by delays at other than these airports and thus the absolute magnitude of the delay difference is questionable. However, what it does provide is that there is a significant effect of replacing conventional with CTR operations. Several barriers need to be overcome before the public will accept rotorcraft for commercial scheduled operations. One of the barriers is the acoustic impact of these operations on the community in and around the terminal area. The rotorcraft noise that is heard on the ground can be broken into three areas: source, propagation, and receiver as shown in figure 1. https://ntrs.nasa.gov/search.jsp?R=20080042299 2018-05-11T09:19:04+00:00Z
Transcript of Report on the Joint Eglin Acoustic Week III - NASA · PDF fileReport on the Joint Eglin...

1
Report on the Joint Eglin Acoustic Week III Michael E. Watts
Aerospace Engineer NASA Langley Research Center
Hampton, Virginia [email protected]
David A. Conner Aerospace Engineer
U.S. Army AFDD-JRPO, AMRDEC, RDECOM Hampton, Virginia
Charles D. Smith Aeronautical Staff Engineer
Lockheed Martin Engineering and Sciences Company Hampton, Virginia
Abstract
A series of three flight tests have been conducted at Eglin Air Force Base located in the Florida panhandle. The first was the “Acoustics Week” flight test conducted in September 2003. The second was the NASA Heavy Lift Rotorcraft Acoustic Flight Test conducted in October-November 2005. The most recent was the Eglin Acoustic Week III test conducted in August-September 2007. This series of tests have acquired acoustic data for a number of rotary and fixed wing aircraft that are used to generate noise semi-spheres used in predicting the acoustic footprint for prescribed flight operations. This extensive database can be used to determine the impact of flight operations on communities around a terminal area. Another valuable use of the semi-spheres is determining the long-range propagation of noise for civilian and military purposes. This paper will describe the third in this series of tests.
Introduction
Airport congestion and flight delays are increasing as passenger demand continues to grow. There was a significant downturn in passenger demand post-9/11, but demand has currently surpassed those pre-9/11 levels. Vertical lift aircraft can have a significant impact on reducing airport congestion and flight delays. The 1995 Civil Tiltrotor Advisory Committee Final Report to Congress [ref 1] found that “CTR (Civil Tilt Rotor) could produce significant societal benefits, reducing airport congestion, creating jobs, and having a positive impact on the balance of trade.” A more recent study [ref 2] showed that 26% of commercial operations from the 64 major airports had a trip
Presented at the American Helicopter Society Next Generation Vertical Lift Technologies Specialist Meeting, Oct. 15-17, 2008, Dallas, TX. This paper is declared a work of the U.S. Government and is not subject to copyright protection in the United States.
length of less than 500 miles and could be offloaded from conventional aircraft with Runway Independent Aircraft. This resulted in a reduction of the projected 2017 average delay time from 86.6 minutes to 18.3 minutes thus showing that V/ESTOL aircraft can have a significant impact on commercial operations. This study was not comprehensive in that it only addressed the 64 largest airports. It did not address delays caused by delays at other than these airports and thus the absolute magnitude of the delay difference is questionable. However, what it does provide is that there is a significant effect of replacing conventional with CTR operations.
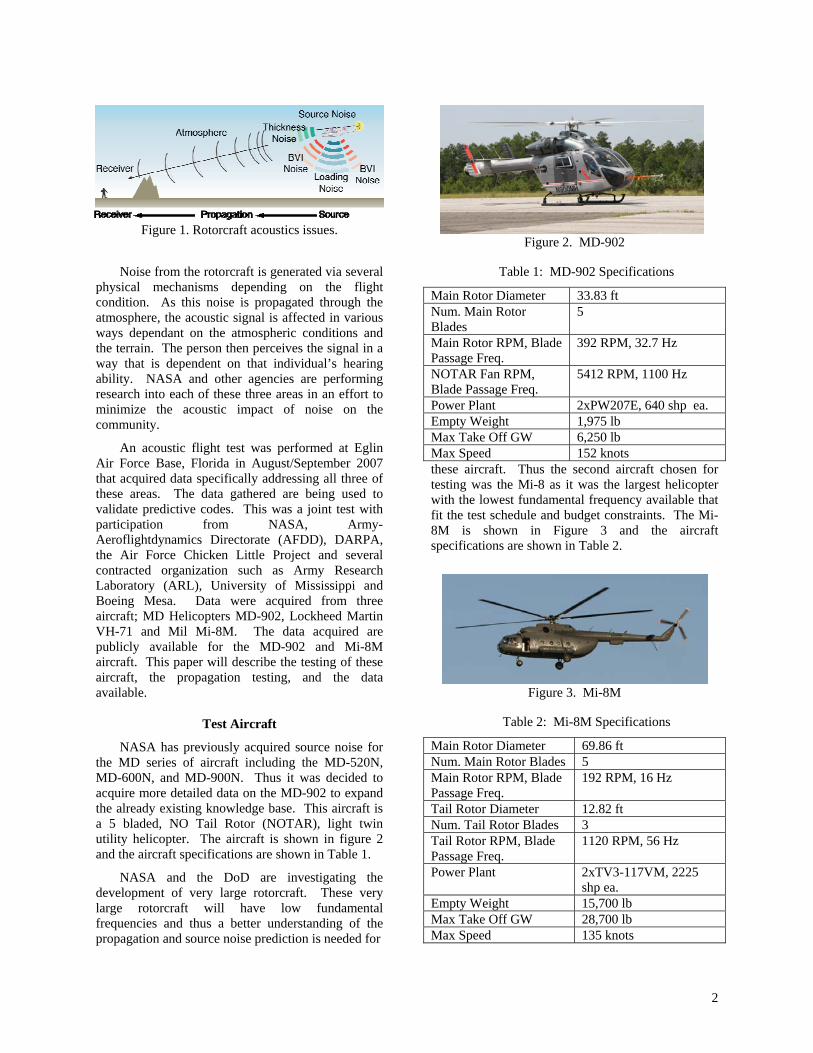
Several barriers need to be overcome before the public will accept rotorcraft for commercial scheduled operations. One of the barriers is the acoustic impact of these operations on the community in and around the terminal area. The rotorcraft noise that is heard on the ground can be broken into three areas: source, propagation, and receiver as shown in figure 1.
https://ntrs.nasa.gov/search.jsp?R=20080042299 2018-05-11T09:19:04+00:00Z
2
Noise from the rotorcraft is generated via several physical mechanisms depending on the flight condition. As this noise is propagated through the atmosphere, the acoustic signal is affected in various ways dependant on the atmospheric conditions and the terrain. The person then perceives the signal in a way that is dependent on that individual’s hearing ability. NASA and other agencies are performing research into each of these three areas in an effort to minimize the acoustic impact of noise on the community.
An acoustic flight test was performed at Eglin Air Force Base, Florida in August/September 2007 that acquired data specifically addressing all three of these areas. The data gathered are being used to validate predictive codes. This was a joint test with participation from NASA, Army- Aeroflightdynamics Directorate (AFDD), DARPA, the Air Force Chicken Little Project and several contracted organization such as Army Research Laboratory (ARL), University of Mississippi and Boeing Mesa. Data were acquired from three aircraft; MD Helicopters MD-902, Lockheed Martin VH-71 and Mil Mi-8M. The data acquired are publicly available for the MD-902 and Mi-8M aircraft. This paper will describe the testing of these aircraft, the propagation testing, and the data available.
Test Aircraft
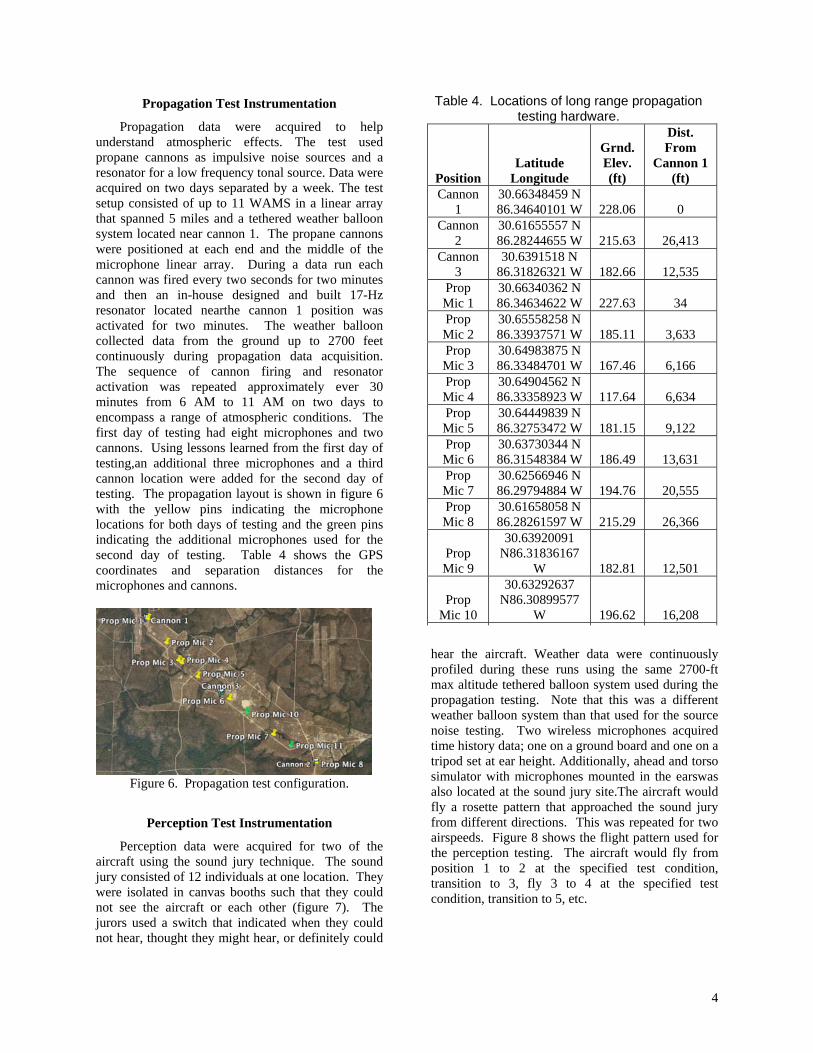
NASA has previously acquired source noise for the MD series of aircraft including the MD-520N, MD-600N, and MD-900N. Thus it was decided to acquire more detailed data on the MD-902 to expand the already existing knowledge base. This aircraft is a 5 bladed, NO Tail Rotor (NOTAR), light twin utility helicopter. The aircraft is shown in figure 2 and the aircraft specifications are shown in Table 1.
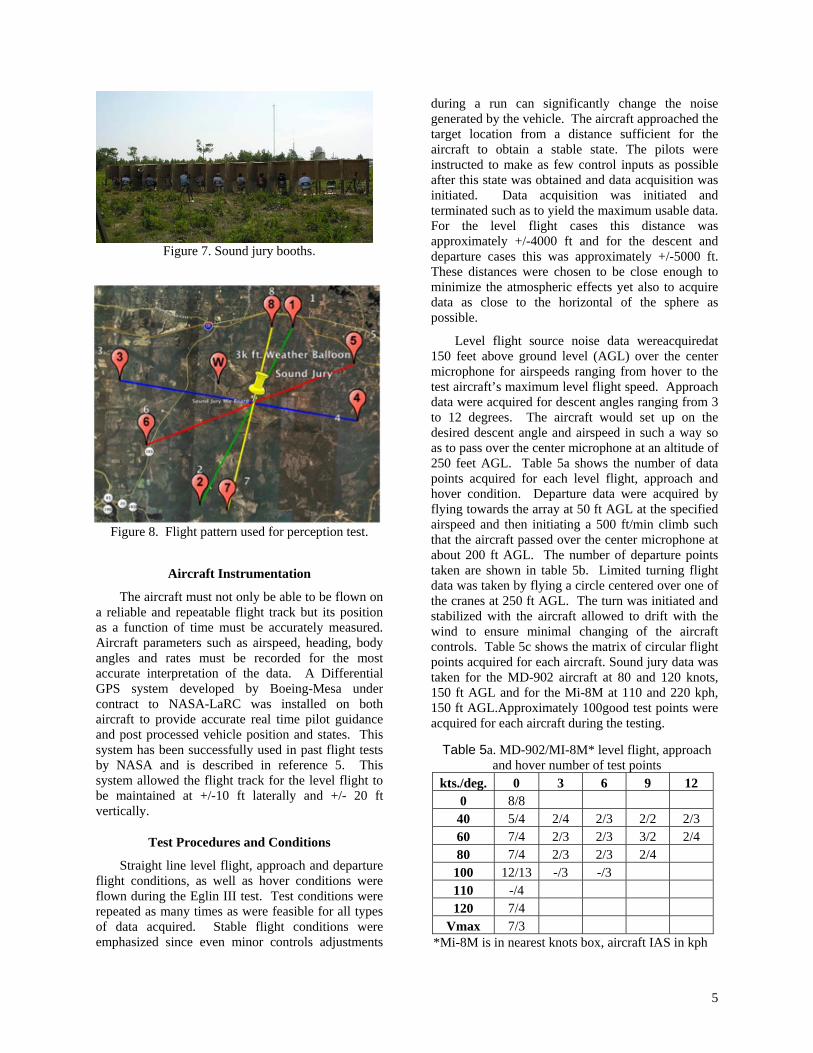
NASA and the DoD are investigating the development of very large rotorcraft. These very large rotorcraft will have low fundamental frequencies and thus a better understanding of the propagation and source noise prediction is needed for
Table 1: MD-902 Specifications
Main Rotor Diameter 33.83 ft Num. Main Rotor Blades
5
Main Rotor RPM, Blade Passage Freq.
392 RPM, 32.7 Hz
NOTAR Fan RPM, Blade Passage Freq.
5412 RPM, 1100 Hz
Power Plant 2xPW207E, 640 shp ea. Empty Weight 1,975 lb Max Take Off GW 6,250 lb Max Speed 152 knots these aircraft. Thus the second aircraft chosen for testing was the Mi-8 as it was the largest helicopter with the lowest fundamental frequency available that fit the test schedule and budget constraints. The Mi-8M is shown in Figure 3 and the aircraft specifications are shown in Table 2.
Table 2: Mi-8M Specifications
Main Rotor Diameter 69.86 ft Num. Main Rotor Blades 5 Main Rotor RPM, Blade Passage Freq.
192 RPM, 16 Hz
Tail Rotor Diameter 12.82 ft Num. Tail Rotor Blades 3 Tail Rotor RPM, Blade Passage Freq.
1120 RPM, 56 Hz
Power Plant 2xTV3-117VM, 2225 shp ea.
Empty Weight 15,700 lb Max Take Off GW 28,700 lb Max Speed 135 knots
Figure 1. Rotorcraft acoustics issues.
Figure 2. MD-902
Figure 3. Mi-8M

3
Source Noise Instrumentation
Source noise data were acquired for the purpose of creating noise semi-spheres that can be used in the Rotorcraft Noise Model (RNM) [ref 3] code to predict noise footprints on the ground for a prescribed flight profile. Source noise data were acquired using a similar technique and microphone setup as in the Eglin 2003 and Eglin 2005 flight tests [ref. 4]. The microphone setup for this test consisted of 19 microphones in a horseshoe-shaped array. Two 175 ft cranes were located 800 ft apart. Four microphones were suspended from each crane and 11 microphones were on ground boards between the cranes. Figure 4 shows the horseshoe array as seen from the aircraft. An additional microphone was placed on a 32.8 ft (10m) pole along the center of the flight path 50 ft before the array center microphone. All of these microphones were connected via coaxial cable to two data vans located 939 and 870 ft from the center of the microphone array. Data was filtered at 11,670 Hz, digitized at the microphone power supply box at 25 kHz, transmitted via cables to the data vans where it was multiplexed with time and test run information and recorded. In addition, there were four Wireless Acoustic Measurement Systems (WAMS) deployed outside of the array closely aligned with the projected angle of the aircraft over the center of the array through two crane microphone positions. The microphone locations are shown in figure 5 and detailed in table 3.
A tethered weather balloon system was located 1.9 miles from the microphone array location. This balloon continually traversed from ground level up to 1000 ft altitude during the test runs. The data was recorded and post processed to give temperature, wind speed and direction and relative humidity measurements for all the test runs.
Figure 4. Horseshoe microphone array
X X X X
15010050
175
370 250 175 110 55 0 55 110 175 250 370 591 8851200 600800
Figure 5. Source Noise microphone locations (dimensions in feet).
Table 3. Source Noise microphone details.
4
Propagation Test Instrumentation
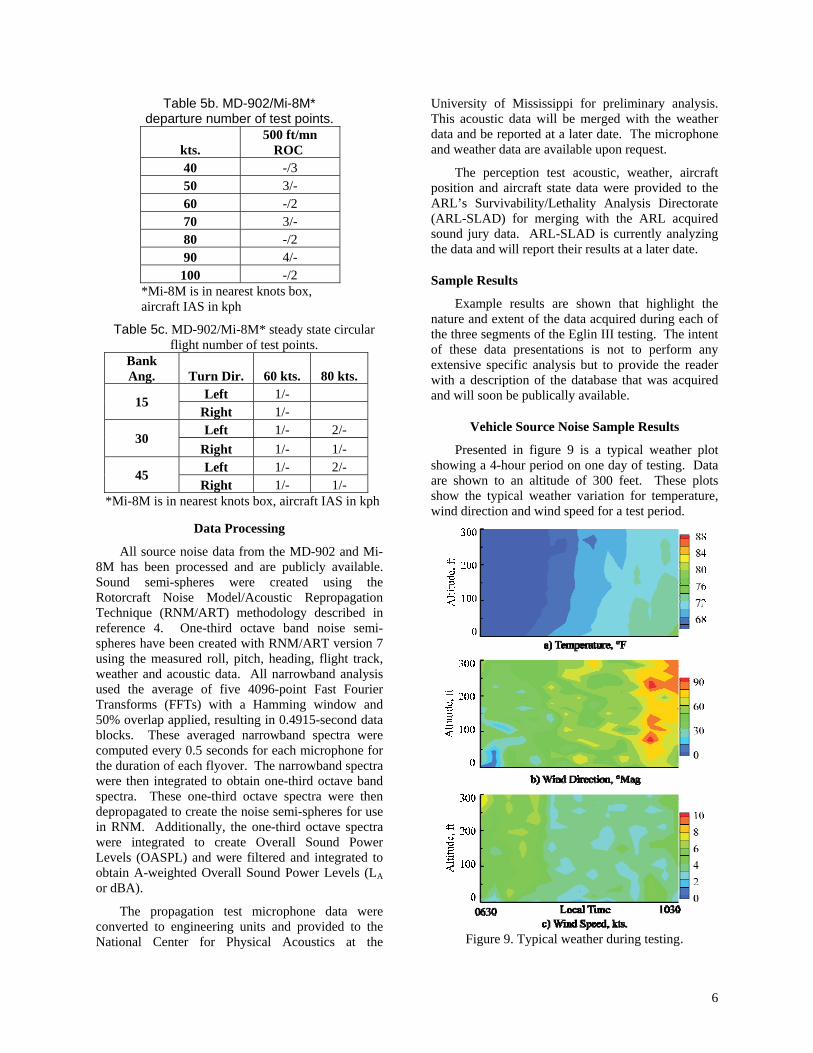
Propagation data were acquired to help understand atmospheric effects. The test used propane cannons as impulsive noise sources and a resonator for a low frequency tonal source. Data were acquired on two days separated by a week. The test setup consisted of up to 11 WAMS in a linear array that spanned 5 miles and a tethered weather balloon system located near cannon 1. The propane cannons were positioned at each end and the middle of the microphone linear array. During a data run each cannon was fired every two seconds for two minutes and then an in-house designed and built 17-Hz resonator located nearthe cannon 1 position was activated for two minutes. The weather balloon collected data from the ground up to 2700 feet continuously during propagation data acquisition. The sequence of cannon firing and resonator activation was repeated approximately ever 30 minutes from 6 AM to 11 AM on two days to encompass a range of atmospheric conditions. The first day of testing had eight microphones and two cannons. Using lessons learned from the first day of testing,an additional three microphones and a third cannon location were added for the second day of testing. The propagation layout is shown in figure 6 with the yellow pins indicating the microphone locations for both days of testing and the green pins indicating the additional microphones used for the second day of testing. Table 4 shows the GPS coordinates and separation distances for the microphones and cannons.
Perception Test Instrumentation
Perception data were acquired for two of the aircraft using the sound jury technique. The sound jury consisted of 12 individuals at one location. They were isolated in canvas booths such that they could not see the aircraft or each other (figure 7). The jurors used a switch that indicated when they could not hear, thought they might hear, or definitely could
hear the aircraft. Weather data were continuously profiled during these runs using the same 2700-ft max altitude tethered balloon system used during the propagation testing. Note that this was a different weather balloon system than that used for the source noise testing. Two wireless microphones acquired time history data; one on a ground board and one on a tripod set at ear height. Additionally, ahead and torso simulator with microphones mounted in the earswas also located at the sound jury site.The aircraft would fly a rosette pattern that approached the sound jury from different directions. This was repeated for two airspeeds. Figure 8 shows the flight pattern used for the perception testing. The aircraft would fly from position 1 to 2 at the specified test condition, transition to 3, fly 3 to 4 at the specified test condition, transition to 5, etc.
Figure 6. Propagation test configuration.
Table 4. Locations of long range propagation testing hardware.
Position Latitude
Longitude
Grnd. Elev. (ft)
Dist. From
Cannon 1 (ft)
Cannon 1
30.66348459 N 86.34640101 W 228.06 0
Cannon 2
30.61655557 N 86.28244655 W 215.63 26,413
Cannon 3
30.6391518 N 86.31826321 W 182.66 12,535
Prop Mic 1
30.66340362 N 86.34634622 W 227.63 34
Prop Mic 2
30.65558258 N 86.33937571 W 185.11 3,633
Prop Mic 3
30.64983875 N 86.33484701 W 167.46 6,166
Prop Mic 4
30.64904562 N 86.33358923 W 117.64 6,634
Prop Mic 5
30.64449839 N 86.32753472 W 181.15 9,122
Prop Mic 6
30.63730344 N 86.31548384 W 186.49 13,631
Prop Mic 7
30.62566946 N 86.29794884 W 194.76 20,555
Prop Mic 8
30.61658058 N 86.28261597 W 215.29 26,366
Prop Mic 9
30.63920091 N86.31836167
W 182.81 12,501
Prop Mic 10
30.63292637 N86.30899577
W 196.62 16,208
5
Aircraft Instrumentation
The aircraft must not only be able to be flown on a reliable and repeatable flight track but its position as a function of time must be accurately measured. Aircraft parameters such as airspeed, heading, body angles and rates must be recorded for the most accurate interpretation of the data. A Differential GPS system developed by Boeing-Mesa under contract to NASA-LaRC was installed on both aircraft to provide accurate real time pilot guidance and post processed vehicle position and states. This system has been successfully used in past flight tests by NASA and is described in reference 5. This system allowed the flight track for the level flight to be maintained at +/-10 ft laterally and +/- 20 ft vertically.
Test Procedures and Conditions
Straight line level flight, approach and departure flight conditions, as well as hover conditions were flown during the Eglin III test. Test conditions were repeated as many times as were feasible for all types of data acquired. Stable flight conditions were emphasized since even minor controls adjustments
during a run can significantly change the noise generated by the vehicle. The aircraft approached the target location from a distance sufficient for the aircraft to obtain a stable state. The pilots were instructed to make as few control inputs as possible after this state was obtained and data acquisition was initiated. Data acquisition was initiated and terminated such as to yield the maximum usable data. For the level flight cases this distance was approximately +/-4000 ft and for the descent and departure cases this was approximately +/-5000 ft. These distances were chosen to be close enough to minimize the atmospheric effects yet also to acquire data as close to the horizontal of the sphere as possible.
Level flight source noise data wereacquiredat 150 feet above ground level (AGL) over the center microphone for airspeeds ranging from hover to the test aircraft’s maximum level flight speed. Approach data were acquired for descent angles ranging from 3 to 12 degrees. The aircraft would set up on the desired descent angle and airspeed in such a way so as to pass over the center microphone at an altitude of 250 feet AGL. Table 5a shows the number of data points acquired for each level flight, approach and hover condition. Departure data were acquired by flying towards the array at 50 ft AGL at the specified airspeed and then initiating a 500 ft/min climb such that the aircraft passed over the center microphone at about 200 ft AGL. The number of departure points taken are shown in table 5b. Limited turning flight data was taken by flying a circle centered over one of the cranes at 250 ft AGL. The turn was initiated and stabilized with the aircraft allowed to drift with the wind to ensure minimal changing of the aircraft controls. Table 5c shows the matrix of circular flight points acquired for each aircraft. Sound jury data was taken for the MD-902 aircraft at 80 and 120 knots, 150 ft AGL and for the Mi-8M at 110 and 220 kph, 150 ft AGL.Approximately 100good test points were acquired for each aircraft during the testing.
Figure 7. Sound jury booths.
Figure 8. Flight pattern used for perception test.
Table 5a. MD-902/MI-8M* level flight, approach and hover number of test points
kts./deg. 0 3 6 9 12 0 8/8
40 5/4 2/4 2/3 2/2 2/3 60 7/4 2/3 2/3 3/2 2/4 80 7/4 2/3 2/3 2/4
100 12/13 -/3 -/3 110 -/4 120 7/4
Vmax 7/3 *Mi-8M is in nearest knots box, aircraft IAS in kph
6
Data Processing
All source noise data from the MD-902 and Mi-8M has been processed and are publicly available. Sound semi-spheres were created using the Rotorcraft Noise Model/Acoustic Repropagation Technique (RNM/ART) methodology described in reference 4. One-third octave band noise semi-spheres have been created with RNM/ART version 7 using the measured roll, pitch, heading, flight track, weather and acoustic data. All narrowband analysis used the average of five 4096-point Fast Fourier Transforms (FFTs) with a Hamming window and 50% overlap applied, resulting in 0.4915-second data blocks. These averaged narrowband spectra were computed every 0.5 seconds for each microphone for the duration of each flyover. The narrowband spectra were then integrated to obtain one-third octave band spectra. These one-third octave spectra were then depropagated to create the noise semi-spheres for use in RNM. Additionally, the one-third octave spectra were integrated to create Overall Sound Power Levels (OASPL) and were filtered and integrated to obtain A-weighted Overall Sound Power Levels (LA or dBA).
The propagation test microphone data were converted to engineering units and provided to the National Center for Physical Acoustics at the
University of Mississippi for preliminary analysis. This acoustic data will be merged with the weather data and be reported at a later date. The microphone and weather data are available upon request.
The perception test acoustic, weather, aircraft position and aircraft state data were provided to the ARL’s Survivability/Lethality Analysis Directorate (ARL-SLAD) for merging with the ARL acquired sound jury data. ARL-SLAD is currently analyzing the data and will report their results at a later date.
Sample Results
Example results are shown that highlight the nature and extent of the data acquired during each of the three segments of the Eglin III testing. The intent of these data presentations is not to perform any extensive specific analysis but to provide the reader with a description of the database that was acquired and will soon be publically available.
Vehicle Source Noise Sample Results
Presented in figure 9 is a typical weather plot showing a 4-hour period on one day of testing. Data are shown to an altitude of 300 feet. These plots show the typical weather variation for temperature, wind direction and wind speed for a test period.
Table 5b. MD-902/Mi-8M* departure number of test points.
kts. 500 ft/mn
ROC 40 -/3 50 3/- 60 -/2 70 3/- 80 -/2 90 4/- 100 -/2
*Mi-8M is in nearest knots box, aircraft IAS in kph
Table 5c. MD-902/Mi-8M* steady state circular flight number of test points.
Bank Ang. Turn Dir. 60 kts. 80 kts.
15 Left 1/- Right 1/-
30 Left 1/- 2/- Right 1/- 1/-
45 Left 1/- 2/- Right 1/- 1/-
*Mi-8M is in nearest knots box, aircraft IAS in kph
Figure 9. Typical weather during testing.
7
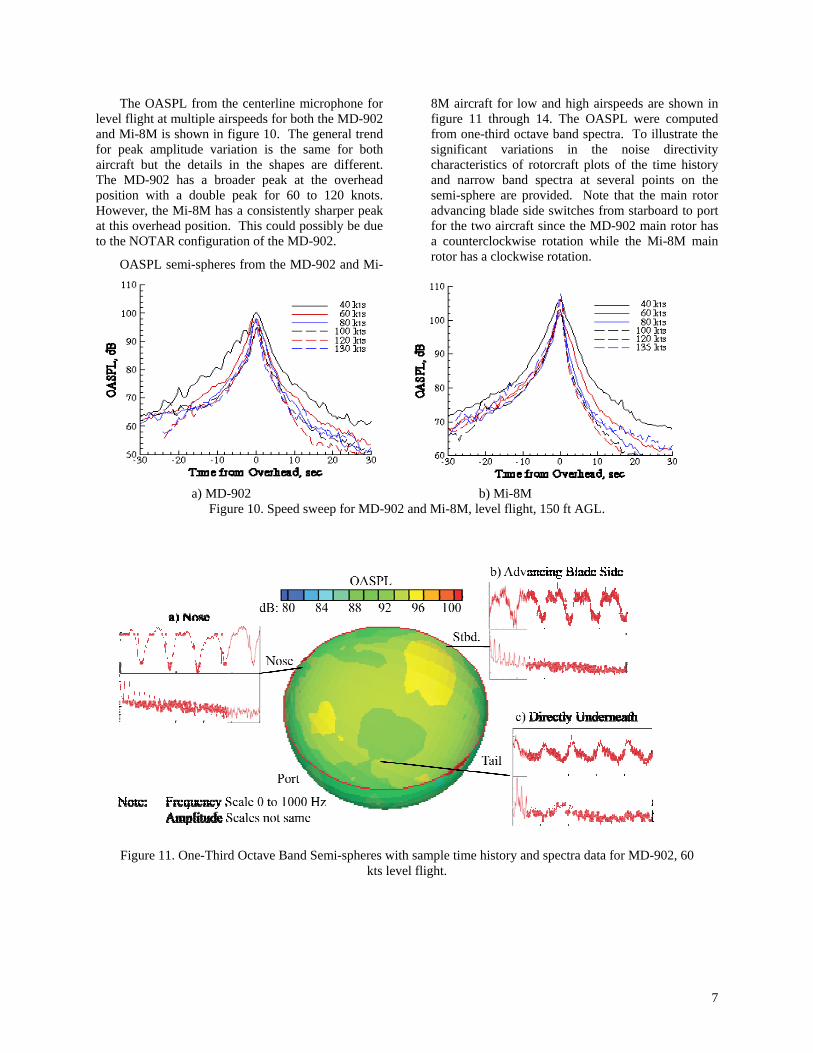
The OASPL from the centerline microphone for level flight at multiple airspeeds for both the MD-902 and Mi-8M is shown in figure 10. The general trend for peak amplitude variation is the same for both aircraft but the details in the shapes are different. The MD-902 has a broader peak at the overhead position with a double peak for 60 to 120 knots. However, the Mi-8M has a consistently sharper peak at this overhead position. This could possibly be due to the NOTAR configuration of the MD-902.
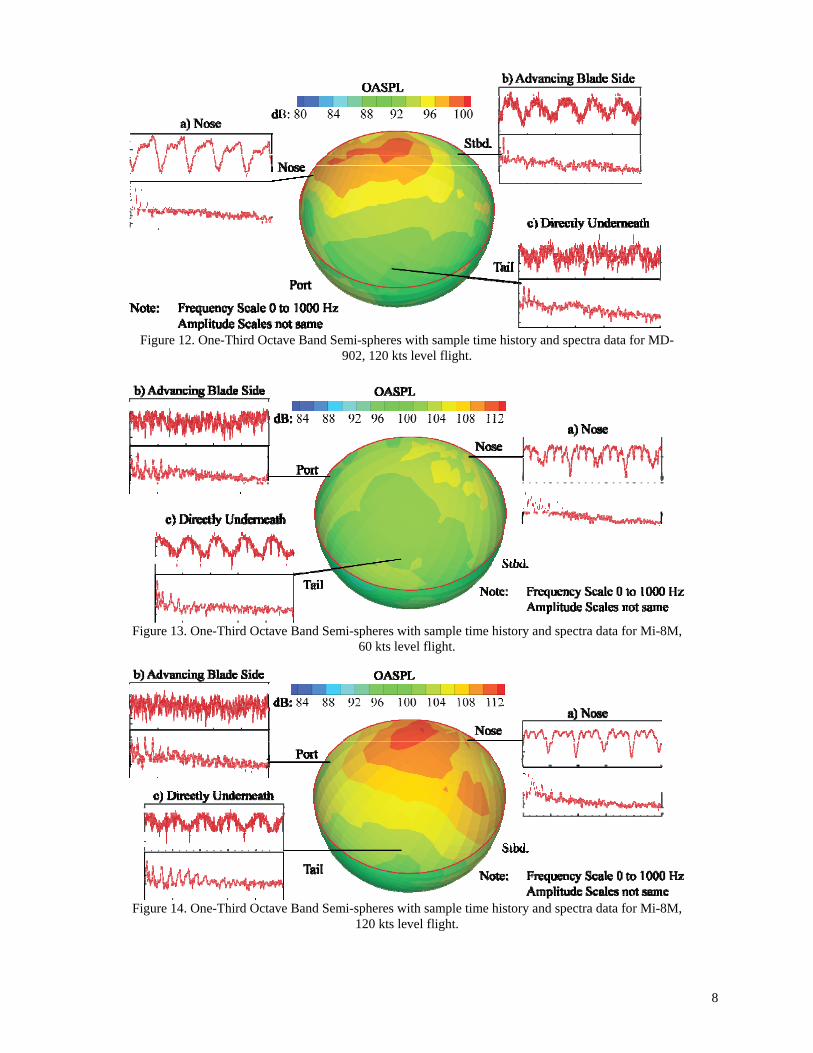
OASPL semi-spheres from the MD-902 and Mi-
8M aircraft for low and high airspeeds are shown in figure 11 through 14. The OASPL were computed from one-third octave band spectra. To illustrate the significant variations in the noise directivity characteristics of rotorcraft plots of the time history and narrow band spectra at several points on the semi-sphere are provided. Note that the main rotor advancing blade side switches from starboard to port for the two aircraft since the MD-902 main rotor has a counterclockwise rotation while the Mi-8M main rotor has a clockwise rotation.
a) MD-902 b) Mi-8M
Figure 10. Speed sweep for MD-902 and Mi-8M, level flight, 150 ft AGL.
Figure 11. One-Third Octave Band Semi-spheres with sample time history and spectra data for MD-902, 60
kts level flight.
8
Figure 12. One-Third Octave Band Semi-spheres with sample time history and spectra data for MD-
902, 120 kts level flight.
Figure 13. One-Third Octave Band Semi-spheres with sample time history and spectra data for Mi-8M,
60 kts level flight.
Figure 14. One-Third Octave Band Semi-spheres with sample time history and spectra data for Mi-8M,
120 kts level flight.
9
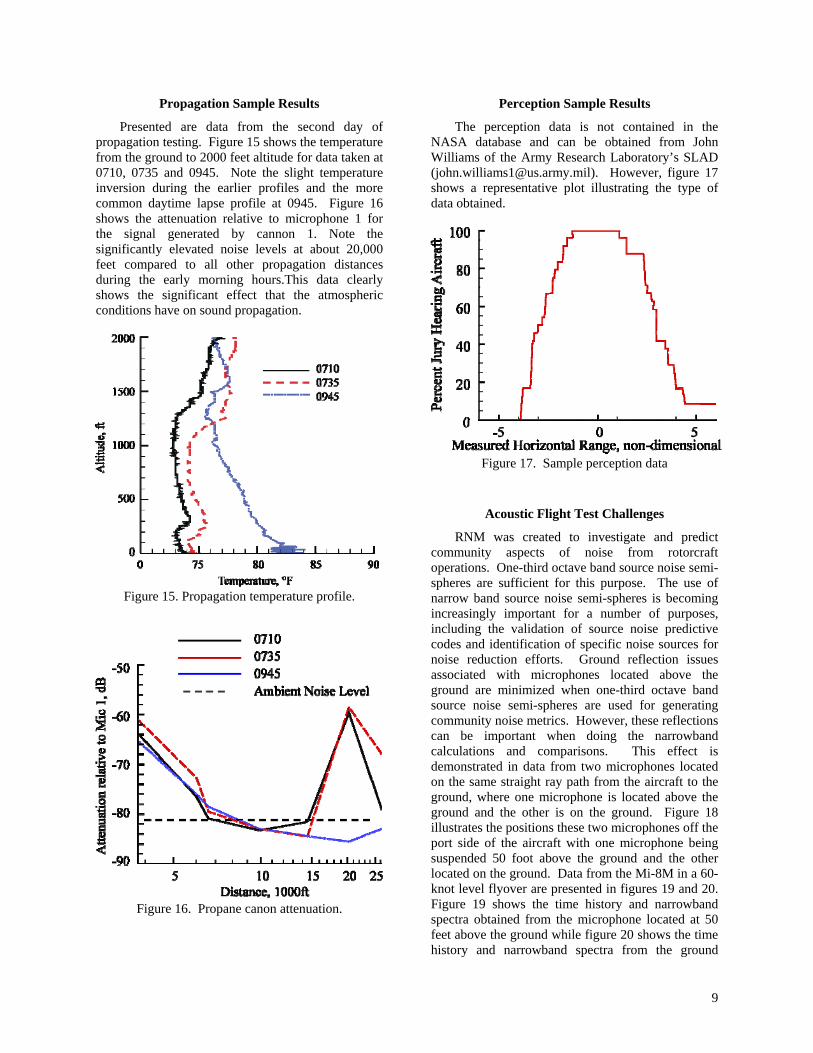
Propagation Sample Results
Presented are data from the second day of propagation testing. Figure 15 shows the temperature from the ground to 2000 feet altitude for data taken at 0710, 0735 and 0945. Note the slight temperature inversion during the earlier profiles and the more common daytime lapse profile at 0945. Figure 16 shows the attenuation relative to microphone 1 for the signal generated by cannon 1. Note the significantly elevated noise levels at about 20,000 feet compared to all other propagation distances during the early morning hours.This data clearly shows the significant effect that the atmospheric conditions have on sound propagation.
Perception Sample Results
The perception data is not contained in the NASA database and can be obtained from John Williams of the Army Research Laboratory’s SLAD ([email protected]). However, figure 17 shows a representative plot illustrating the type of data obtained.
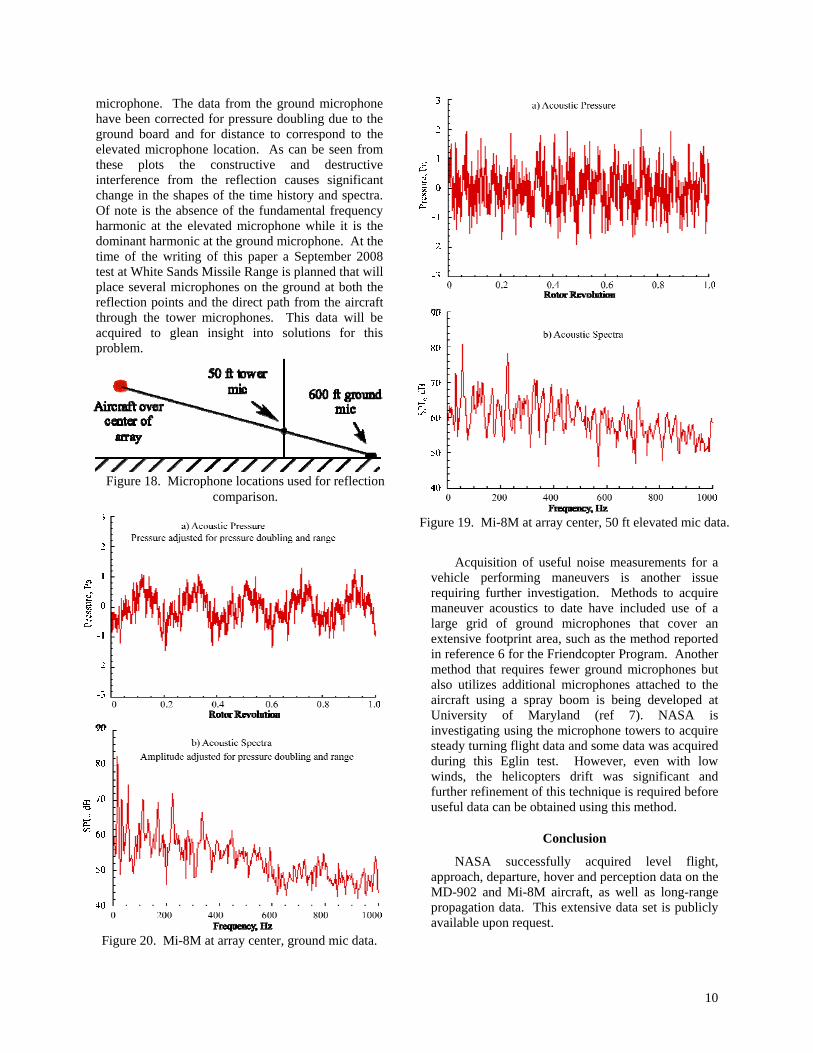
Acoustic Flight Test Challenges
RNM was created to investigate and predict community aspects of noise from rotorcraft operations. One-third octave band source noise semi-spheres are sufficient for this purpose. The use of narrow band source noise semi-spheres is becoming increasingly important for a number of purposes, including the validation of source noise predictive codes and identification of specific noise sources for noise reduction efforts. Ground reflection issues associated with microphones located above the ground are minimized when one-third octave band source noise semi-spheres are used for generating community noise metrics. However, these reflections can be important when doing the narrowband calculations and comparisons. This effect is demonstrated in data from two microphones located on the same straight ray path from the aircraft to the ground, where one microphone is located above the ground and the other is on the ground. Figure 18 illustrates the positions these two microphones off the port side of the aircraft with one microphone being suspended 50 foot above the ground and the other located on the ground. Data from the Mi-8M in a 60-knot level flyover are presented in figures 19 and 20. Figure 19 shows the time history and narrowband spectra obtained from the microphone located at 50 feet above the ground while figure 20 shows the time history and narrowband spectra from the ground
Figure 15. Propagation temperature profile.
Figure 16. Propane canon attenuation.
Figure 17. Sample perception data
10
microphone. The data from the ground microphone have been corrected for pressure doubling due to the ground board and for distance to correspond to the elevated microphone location. As can be seen from these plots the constructive and destructive interference from the reflection causes significant change in the shapes of the time history and spectra. Of note is the absence of the fundamental frequency harmonic at the elevated microphone while it is the dominant harmonic at the ground microphone. At the time of the writing of this paper a September 2008 test at White Sands Missile Range is planned that will place several microphones on the ground at both the reflection points and the direct path from the aircraft through the tower microphones. This data will be acquired to glean insight into solutions for this problem.
Acquisition of useful noise measurements for a vehicle performing maneuvers is another issue requiring further investigation. Methods to acquire maneuver acoustics to date have included use of a large grid of ground microphones that cover an extensive footprint area, such as the method reported in reference 6 for the Friendcopter Program. Another method that requires fewer ground microphones but also utilizes additional microphones attached to the aircraft using a spray boom is being developed at University of Maryland (ref 7). NASA is investigating using the microphone towers to acquire steady turning flight data and some data was acquired during this Eglin test. However, even with low winds, the helicopters drift was significant and further refinement of this technique is required before useful data can be obtained using this method.
Conclusion
NASA successfully acquired level flight, approach, departure, hover and perception data on the MD-902 and Mi-8M aircraft, as well as long-range propagation data. This extensive data set is publicly available upon request.
Figure 18. Microphone locations used for reflection
comparison.
Figure 19. Mi-8M at array center, 50 ft elevated mic data.
Figure 20. Mi-8M at array center, ground mic data.
11
References
[1] CTRDAC-1995-REPORT, Civil Tiltrotor Development Advisory Committee Report to Congress in accordance with PL102-581, December 1995 [2 Johnson, J., Stouffer, V., Long, D., Gribko, J. “Evaluation of the National Throughput Benefits of the Civil Tilt Rotor”, NASA CR-2001-211055, Sept 2001. [3] Conner, D.A., and Page, J.A., “A Tool for Low Noise Procedures Design and Community Noise Impact Assessment: The Rotorcraft Noise Model (RNM),” Presented at Heli Japan 2002, Tochigi, Japan, November 11-13, 2002. [4] Conner, David A., Burley, Casey L., Smith, Charles D., “Flight Acoustic Testing and Data Acquisition For the Rotorcraft Noise Model (RNM)“, AHS Forum 62, Phoenix, AZ, May 9-11, 2006. [5] Hardesty, M., Conner, D., Smith, C., and Terrell, W., “The Use of GPS Tracking and Guidance Systems for the Chicken Little Joint Project’s ‘Acoustic Week’ Flight Test Program,” AHS Forum 60, Baltimore, MD, June 7-10, 2004. [6] Marze, H.-J, Gervais, M., Martin, P. Dupont, P., “Acoustic Flight Test of the EC130 B4 in the Scope of the Friendcopter Project,” AHS Forum 66, Montreal, Canada, April 29-May1, 2008. [7] Greenwood, Eric, “Helicopter External Noise Radiation in Turning Flight: Theory and Experiment,” AHS Forum 65, Virginia Beach, VA, May 1-3, 2007.